Upgrade to Pro — share decks privately, control downloads, hide ads and more …

Towards an Open Apache Kafka Performance Model

Avatar for Paul Brebner Paul Brebner
September 26, 2025

Towards an Open Apache Kafka Performance Model

Everything I know about Kafka performance, and everything I don't know - but potentially could know if we had a Kafka performance model! Performance Engineering track keynote talk from Community over Code NA 2025 (including track intro).

Avatar for Paul Brebner

Paul Brebner

September 26, 2025

More Decks by Paul Brebner

Other Decks in Technology

Transcript

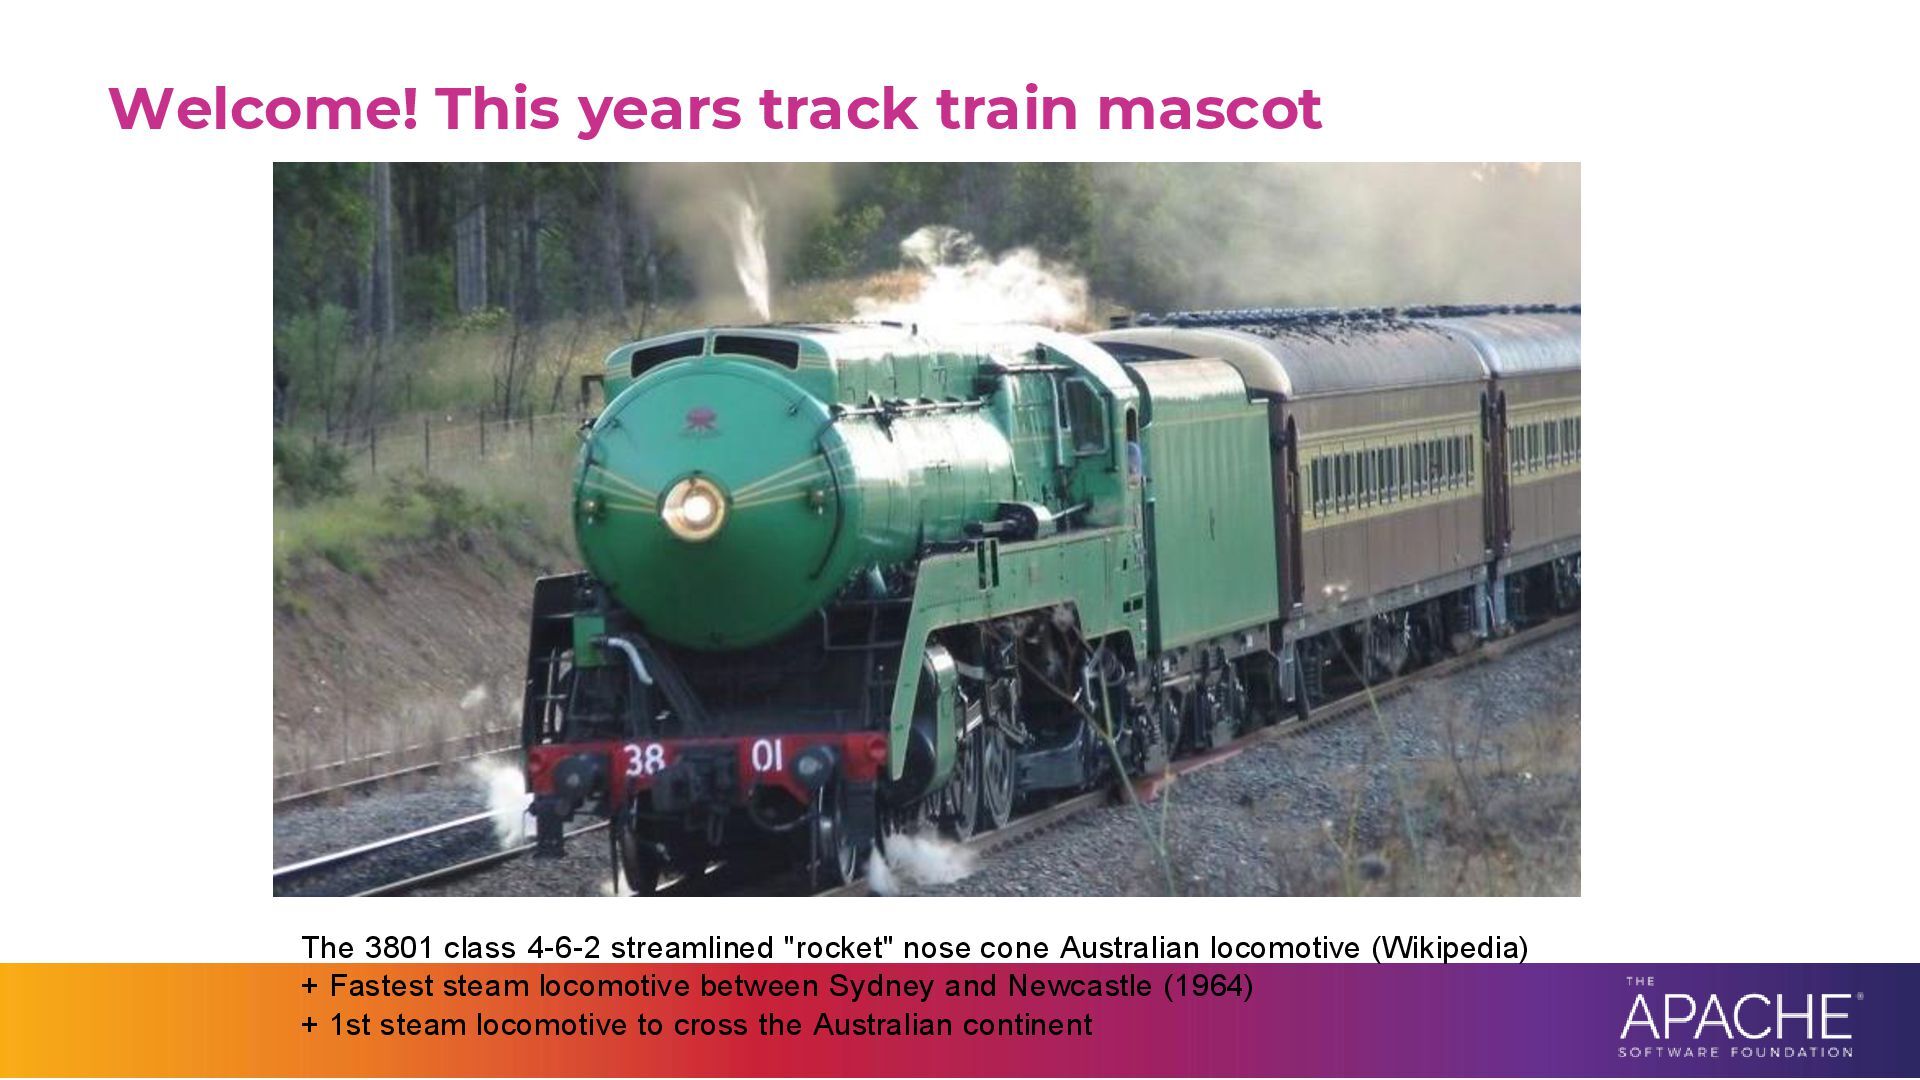
  1. Welcome! This years track train mascot The 3801 class 4-6-2

    streamlined "rocket" nose cone Australian locomotive (Wikipedia) + Fastest steam locomotive between Sydney and Newcastle (1964) + 1st steam locomotive to cross the Australian continent
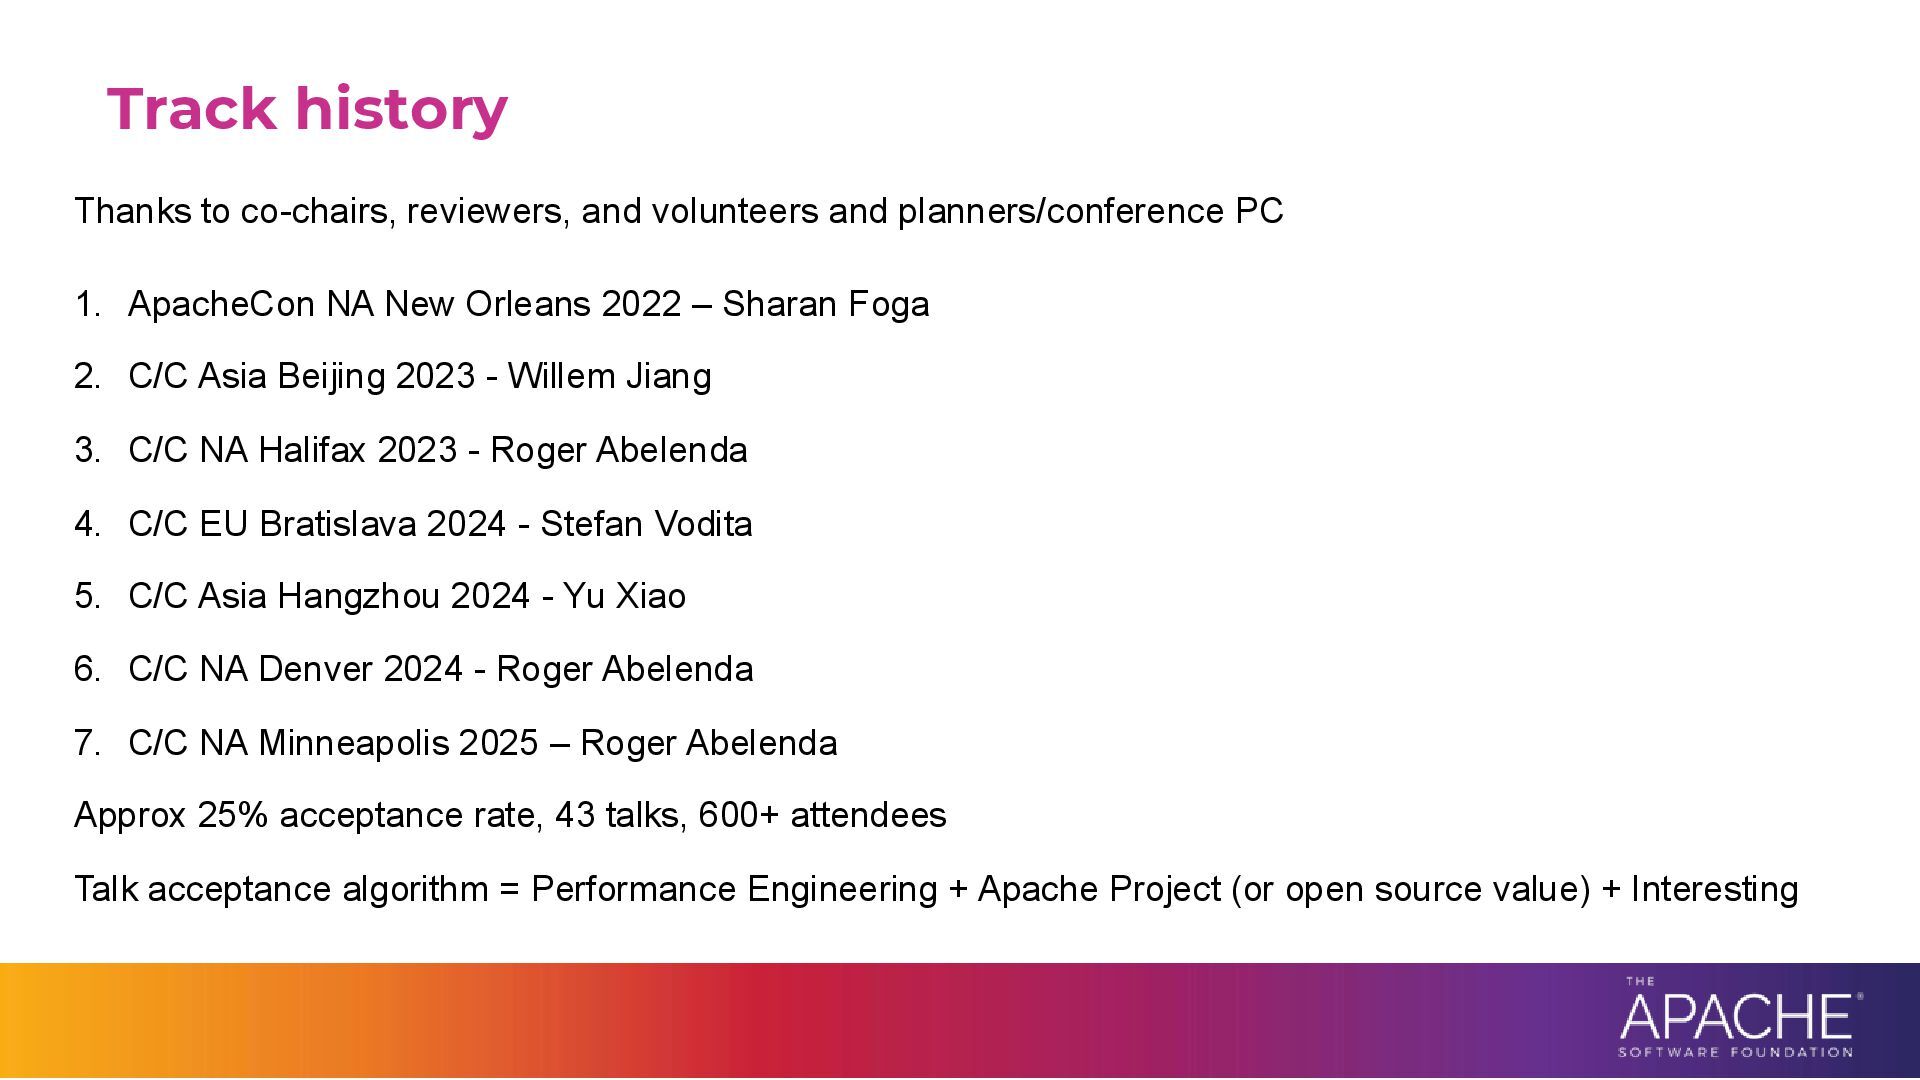
  2. Track history 1. ApacheCon NA New Orleans 2022 – Sharan

    Foga 2. C/C Asia Beijing 2023 - Willem Jiang 3. C/C NA Halifax 2023 - Roger Abelenda 4. C/C EU Bratislava 2024 - Stefan Vodita 5. C/C Asia Hangzhou 2024 - Yu Xiao 6. C/C NA Denver 2024 - Roger Abelenda 7. C/C NA Minneapolis 2025 – Roger Abelenda Approx 25% acceptance rate, 43 talks, 600+ attendees Talk acceptance algorithm = Performance Engineering + Apache Project (or open source value) + Interesting Thanks to co-chairs, reviewers, and volunteers and planners/conference PC
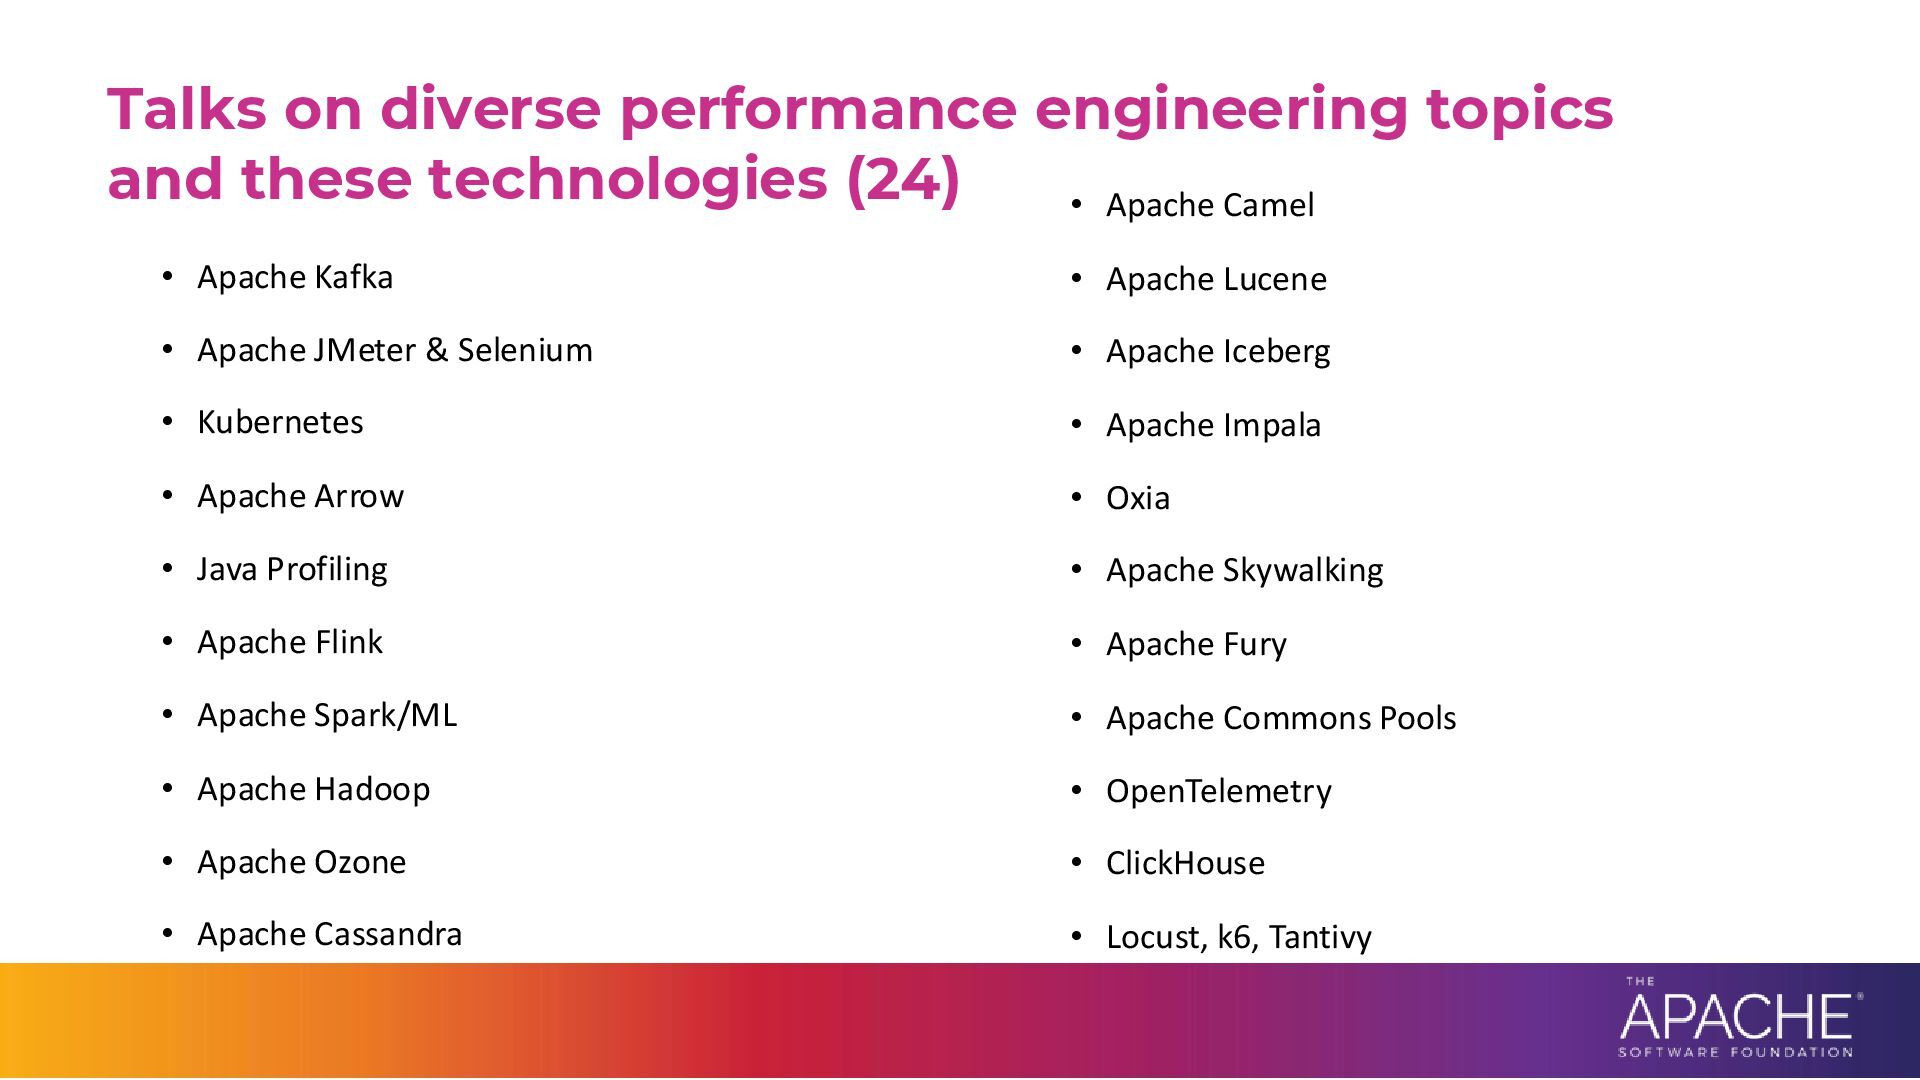
  3. Talks on diverse performance engineering topics and these technologies (24)

    • Apache Camel • Apache Lucene • Apache Iceberg • Apache Impala • Oxia • Apache Skywalking • Apache Fury • Apache Commons Pools • OpenTelemetry • ClickHouse • Locust, k6, Tantivy • Apache Kafka • Apache JMeter & Selenium • Kubernetes • Apache Arrow • Java Profiling • Apache Flink • Apache Spark/ML • Apache Hadoop • Apache Ozone • Apache Cassandra
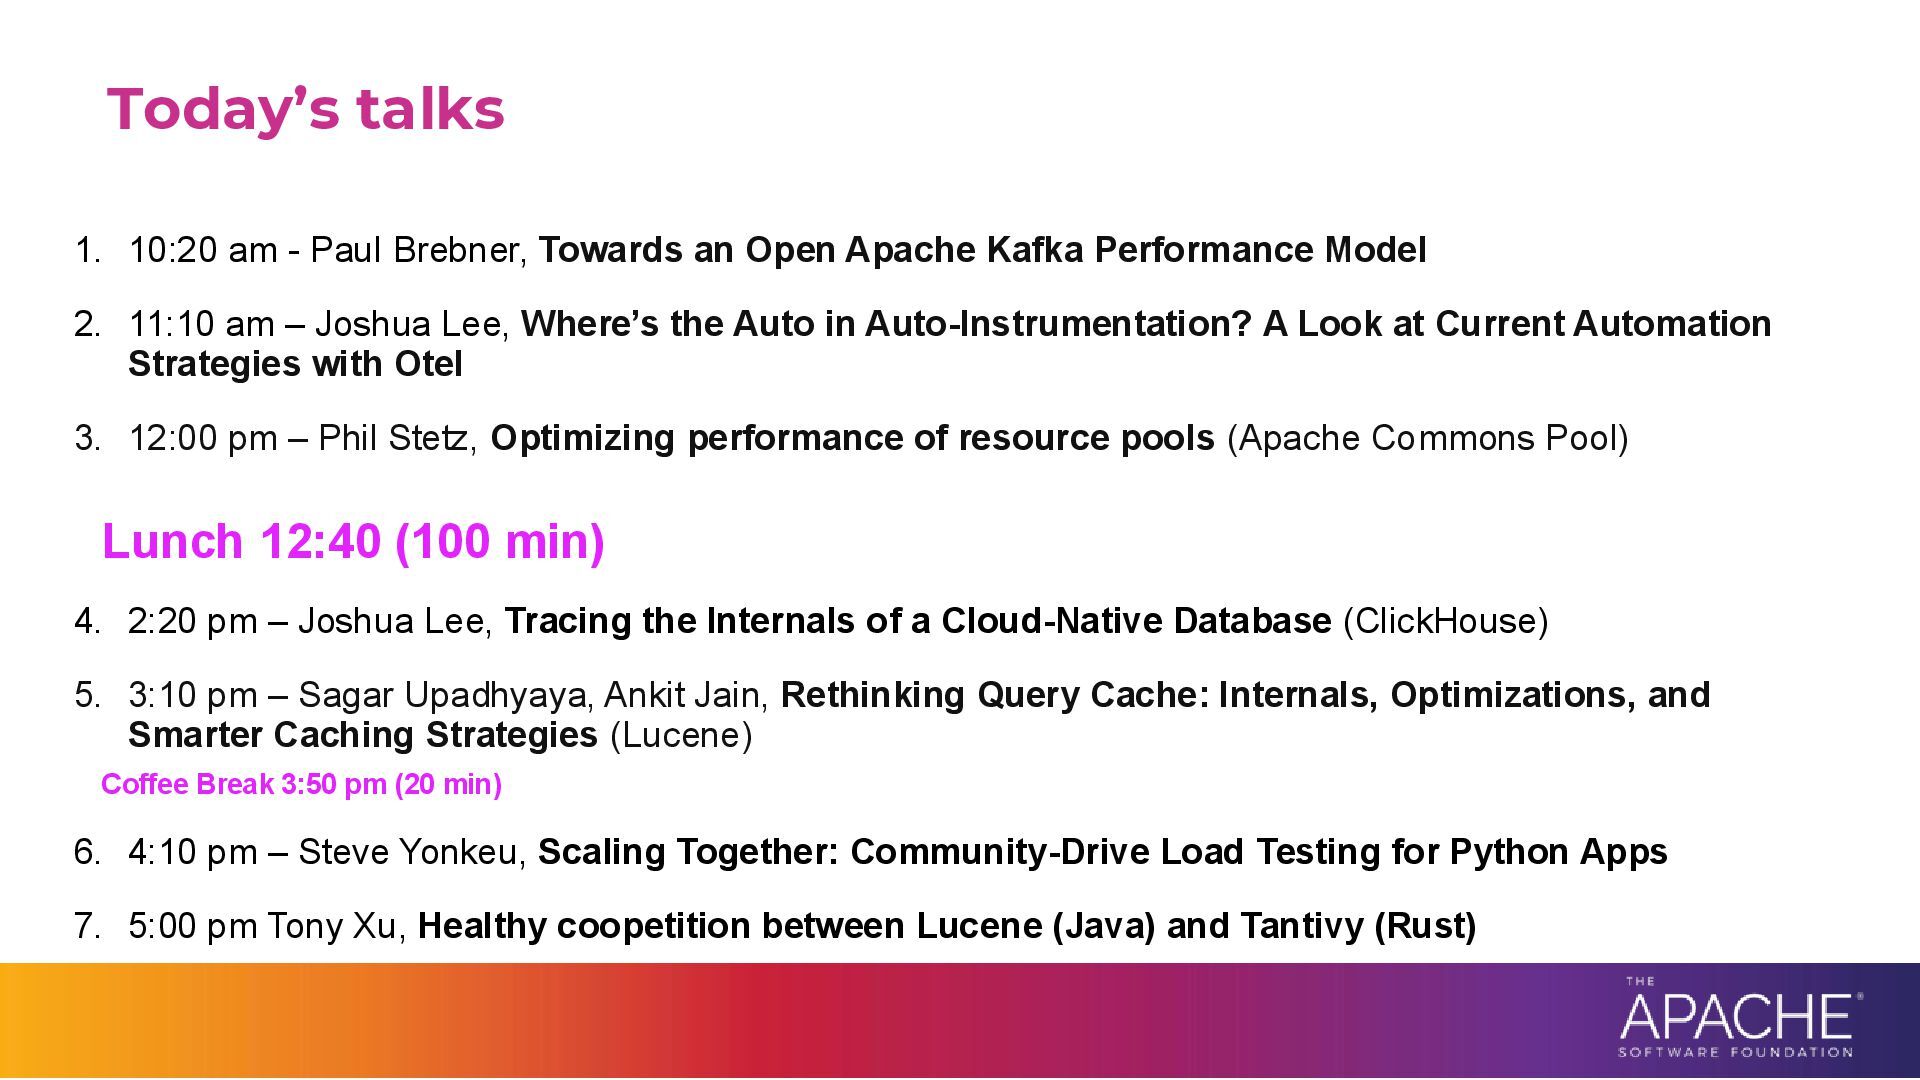
  4. Today’s talks 1. 10:20 am - Paul Brebner, Towards an

    Open Apache Kafka Performance Model 2. 11:10 am – Joshua Lee, Where’s the Auto in Auto-Instrumentation? A Look at Current Automation Strategies with Otel 3. 12:00 pm – Phil Stetz, Optimizing performance of resource pools (Apache Commons Pool) Lunch 12:40 (100 min) 4. 2:20 pm – Joshua Lee, Tracing the Internals of a Cloud-Native Database (ClickHouse) 5. 3:10 pm – Sagar Upadhyaya, Ankit Jain, Rethinking Query Cache: Internals, Optimizations, and Smarter Caching Strategies (Lucene) Coffee Break 3:50 pm (20 min) 6. 4:10 pm – Steve Yonkeu, Scaling Together: Community-Drive Load Testing for Python Apps 7. 5:00 pm Tony Xu, Healthy coopetition between Lucene (Java) and Tantivy (Rust)
  5. Paul Brebner Technology Evangelist NetApp Instaclustr Community over Code NA

    September 2025 © 2025 NetApp, Inc. All rights reserved. TOWARDS AN OPEN APACHE KAFKA PERFORMANCE MODEL
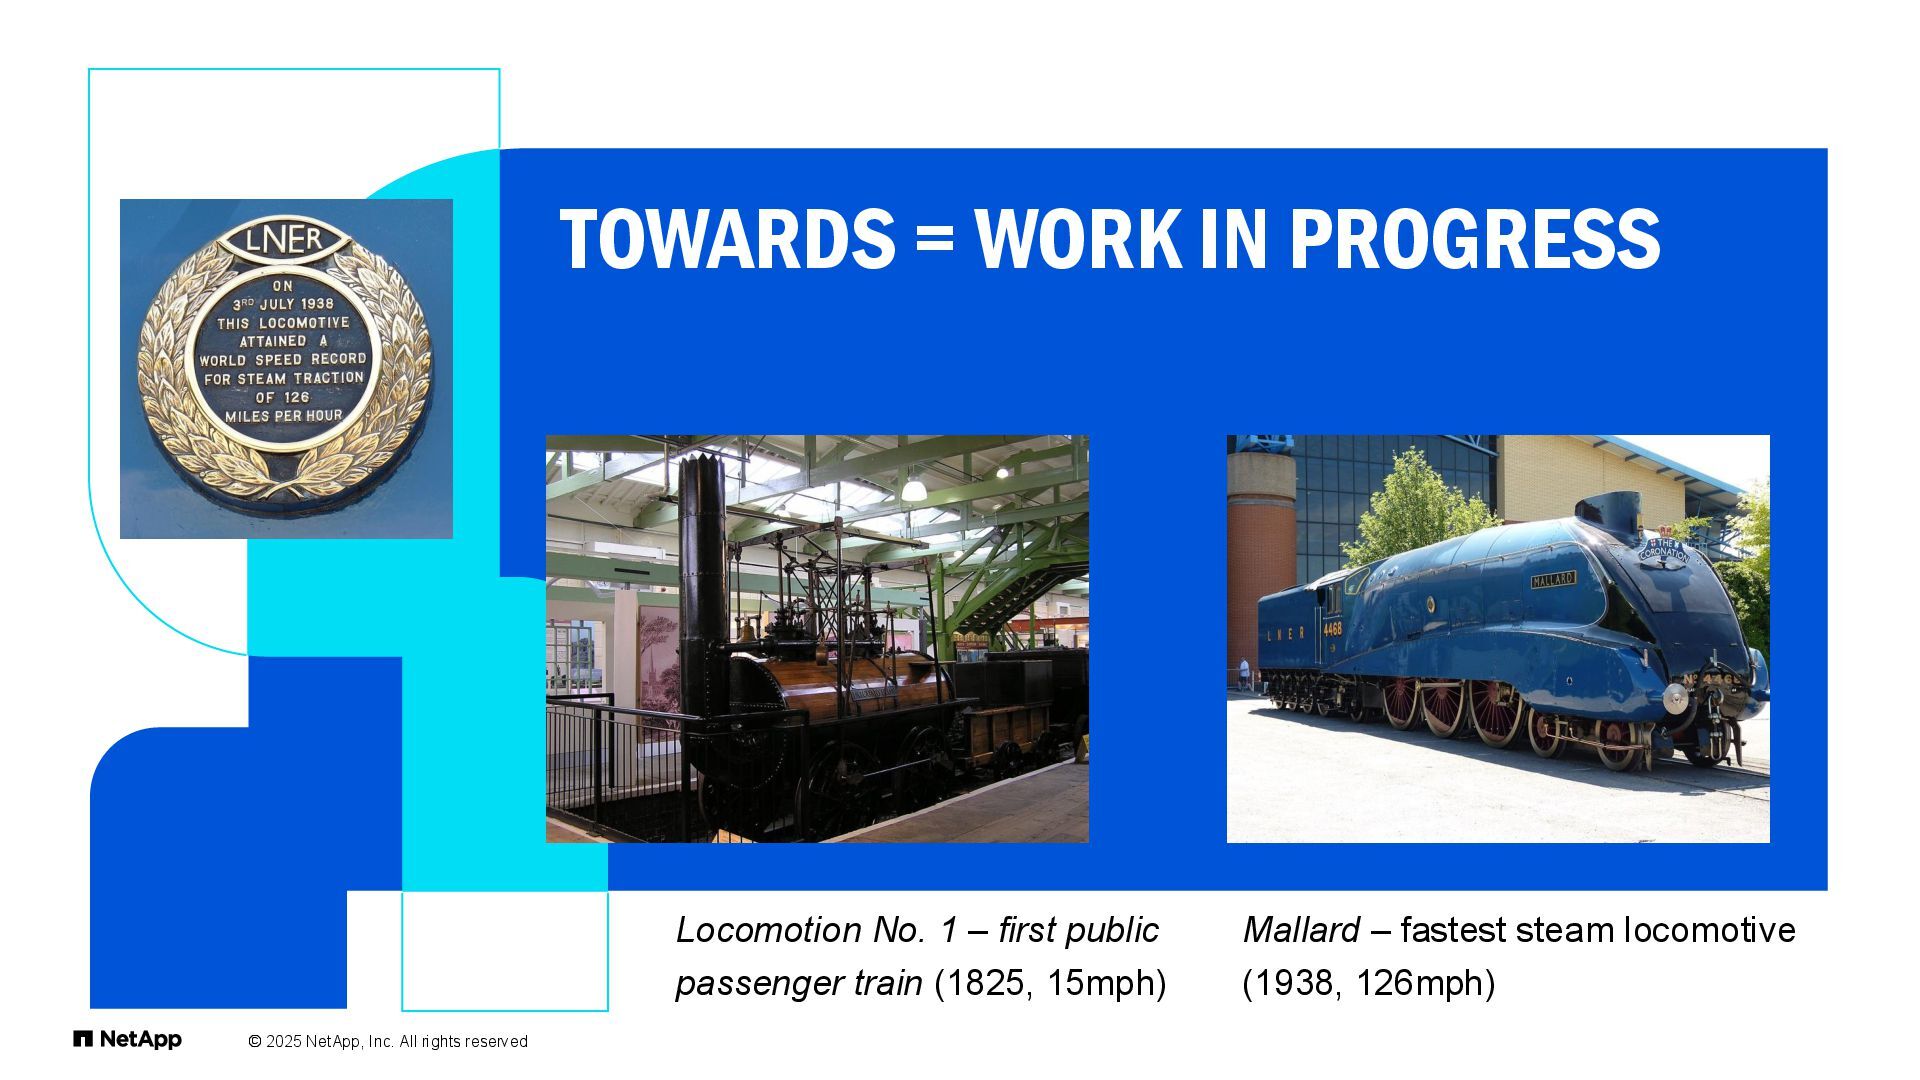
  6. TOWARDS = WORK IN PROGRESS © 2025 NetApp, Inc. All

    rights reserved Locomotion No. 1 – first public passenger train (1825, 15mph) Mallard – fastest steam locomotive (1938, 126mph)
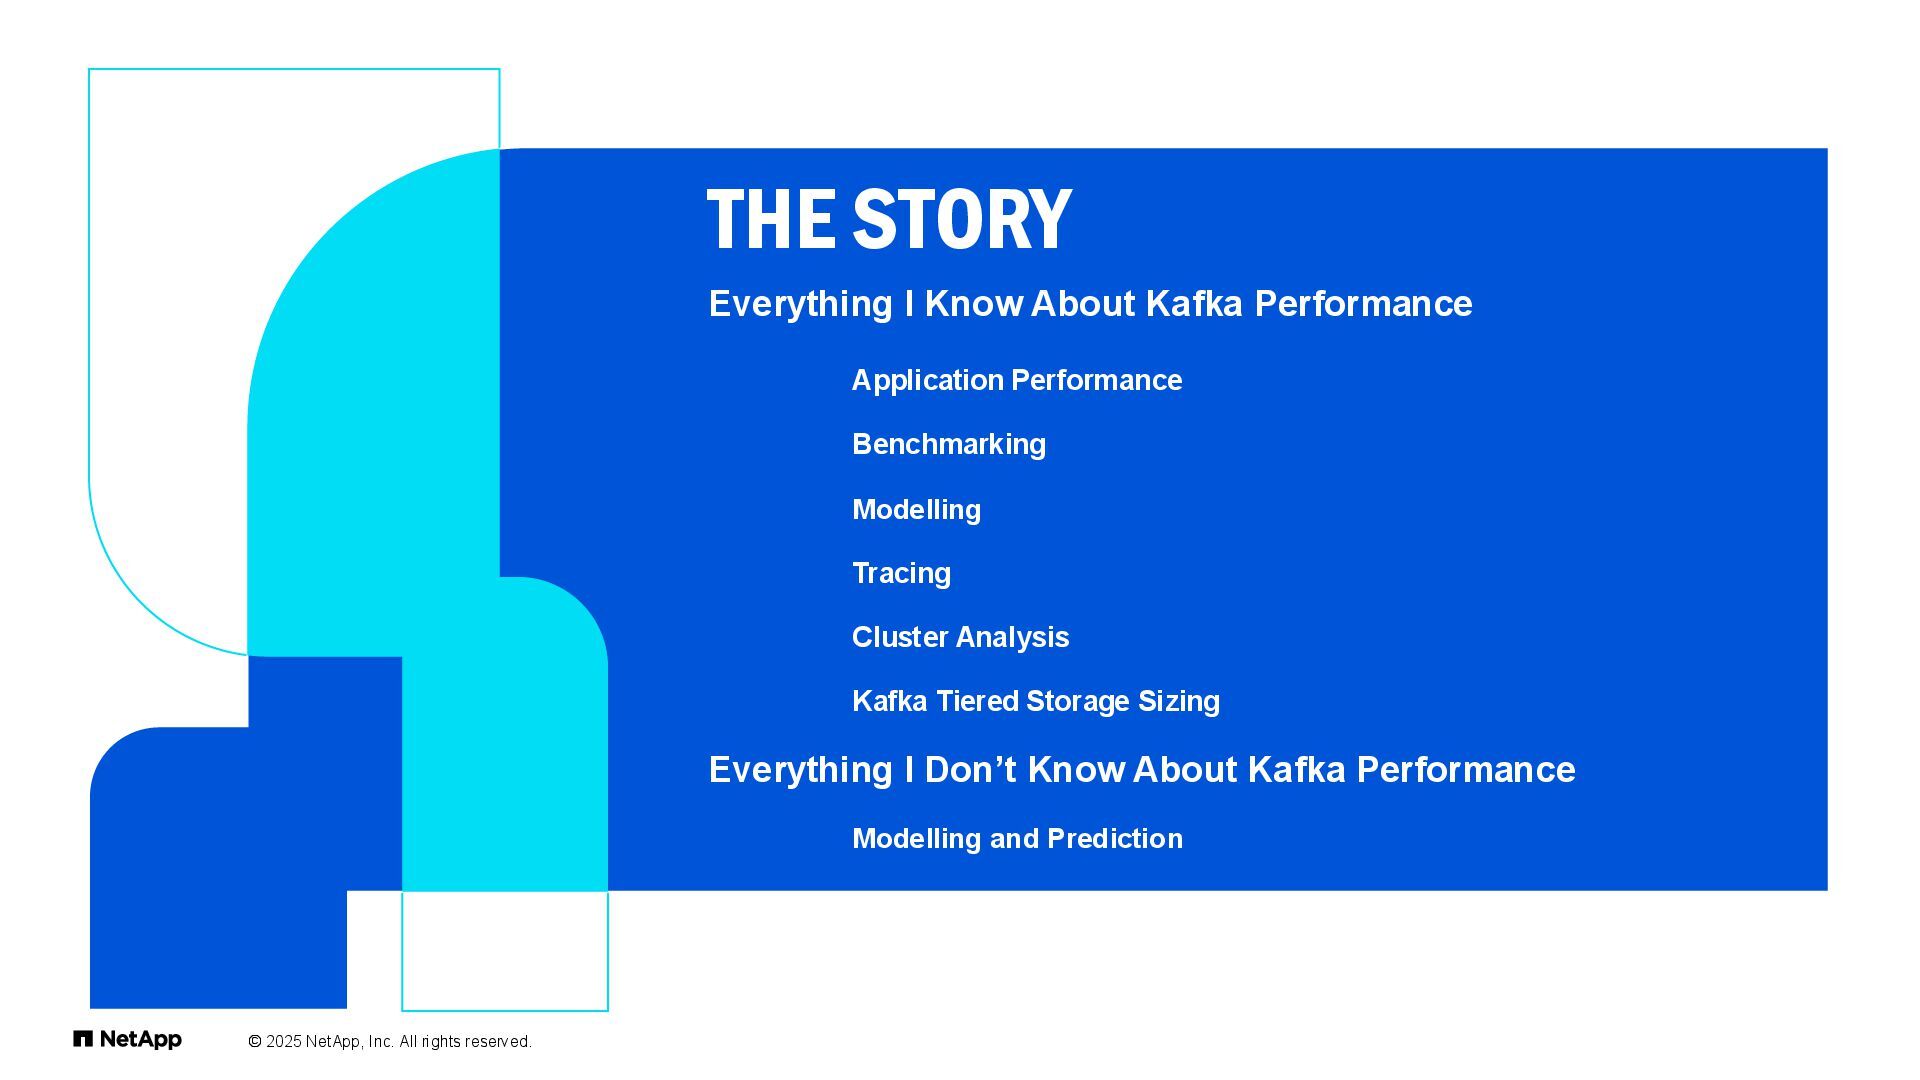
  7. Everything I Know About Kafka Performance Application Performance Benchmarking Modelling

    Tracing Cluster Analysis Kafka Tiered Storage Sizing Everything I Don’t Know About Kafka Performance Modelling and Prediction THE STORY © 2025 NetApp, Inc. All rights reserved.
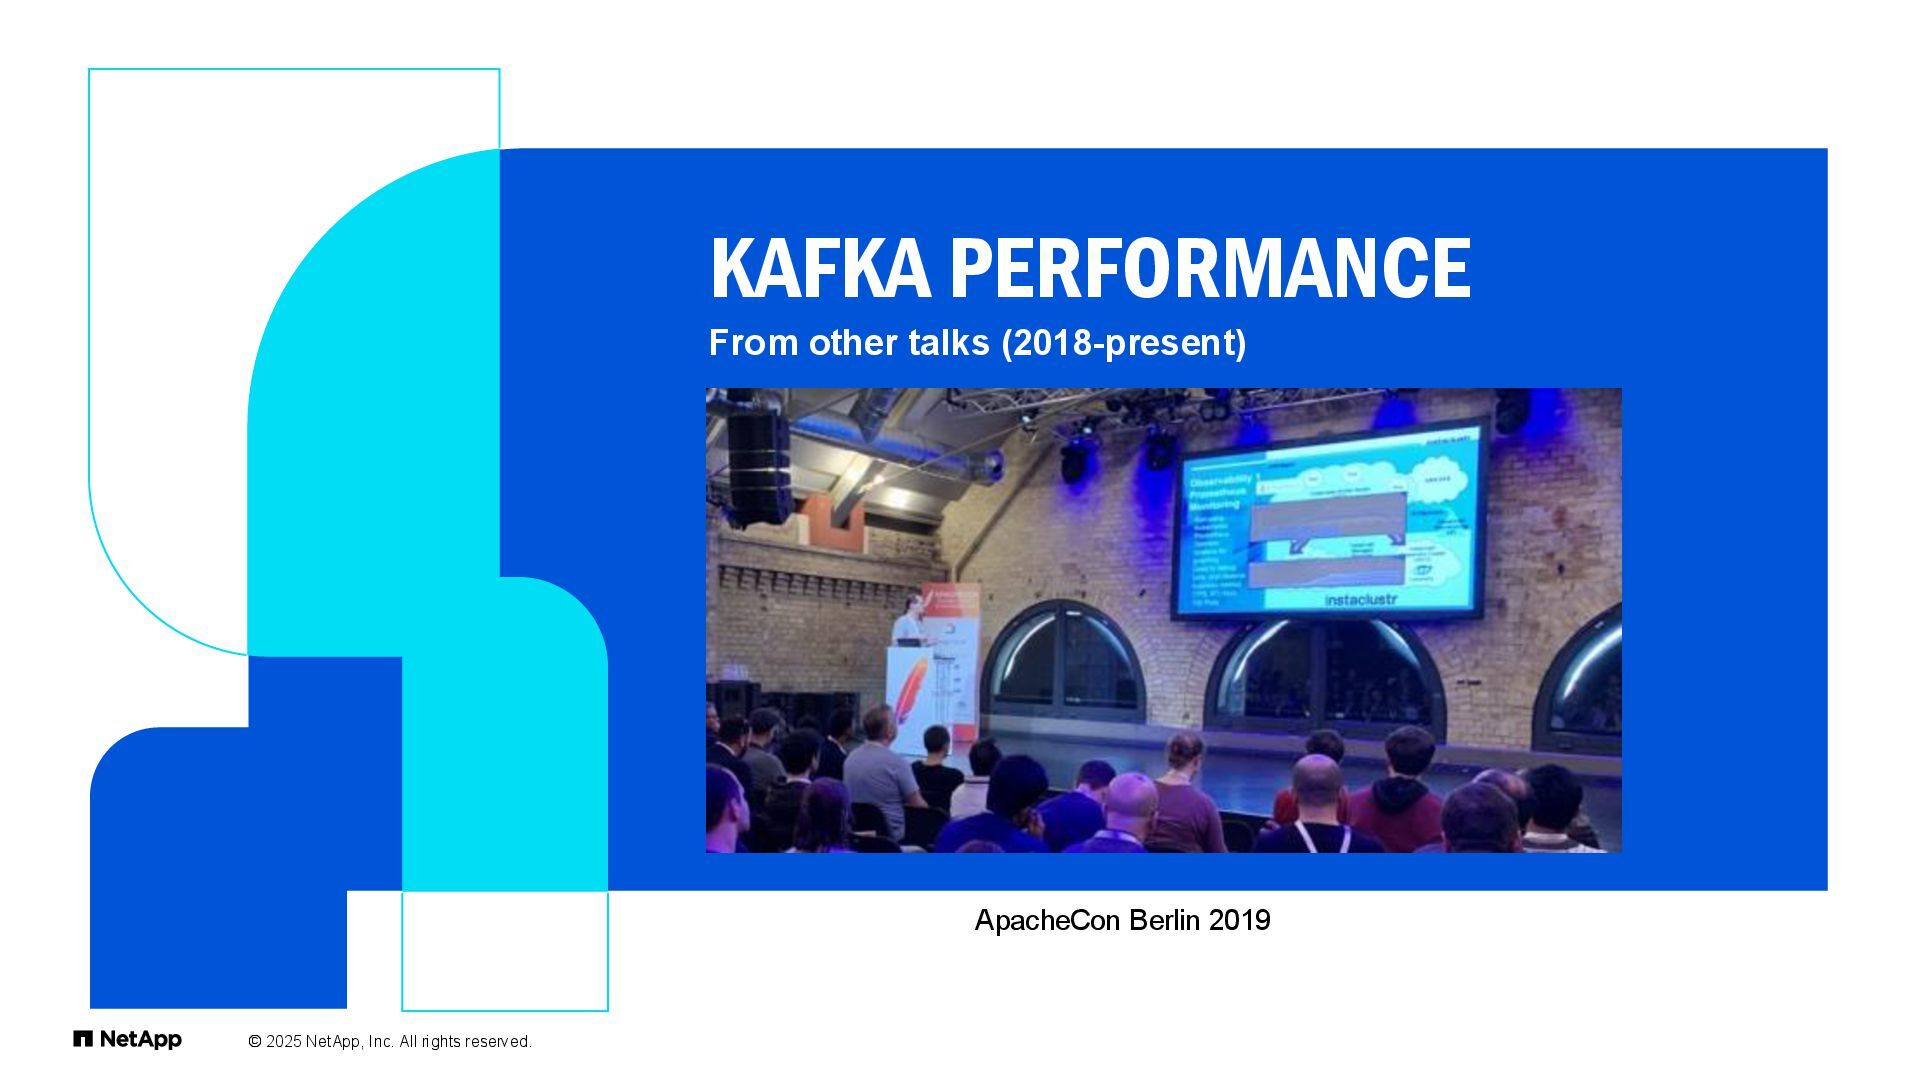
  8. KAFKA PERFORMANCE © 2025 NetApp, Inc. All rights reserved. From

    other talks (2018-present) ApacheCon Berlin 2019
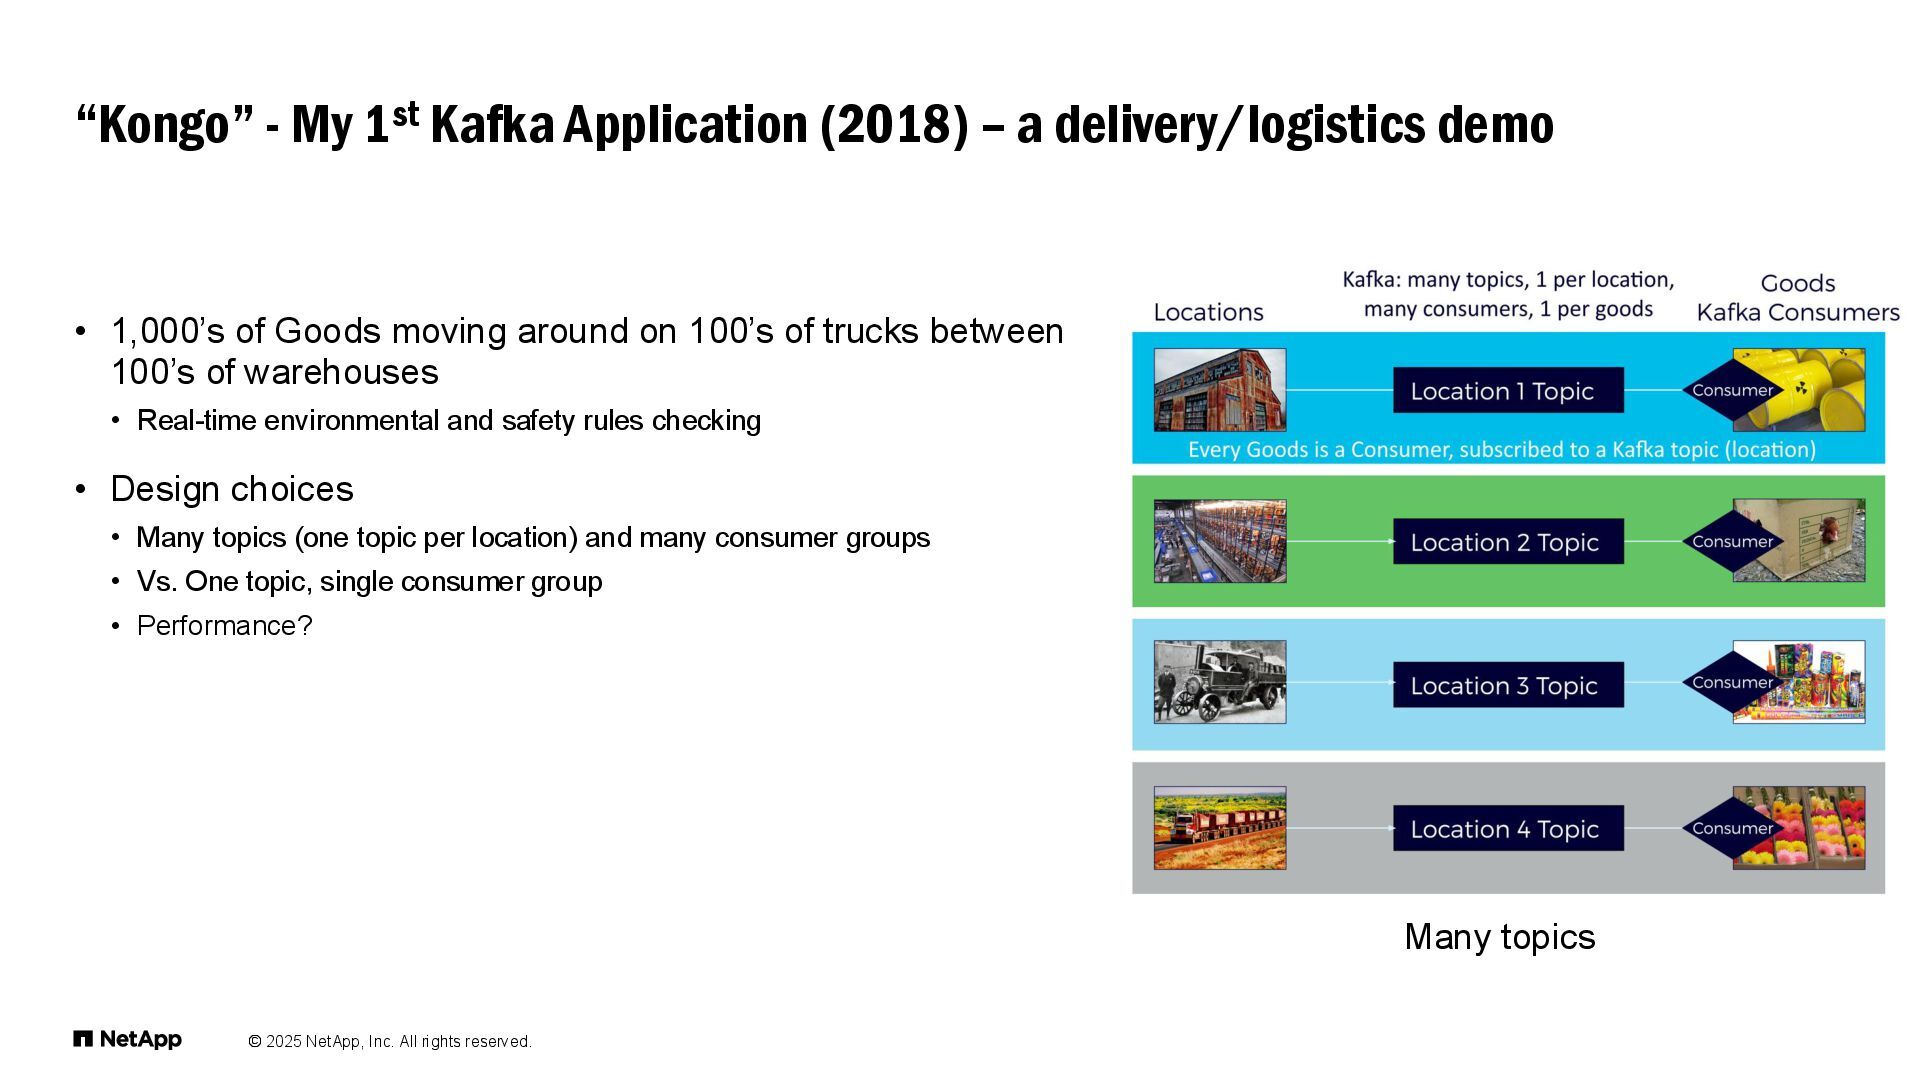
  9. © 2025 NetApp, Inc. All rights reserved. • 1,000’s of

    Goods moving around on 100’s of trucks between 100’s of warehouses • Real-time environmental and safety rules checking • Design choices • Many topics (one topic per location) and many consumer groups • Vs. One topic, single consumer group • Performance? “Kongo” - My 1st Kafka Application (2018) – a delivery/logistics demo Many topics
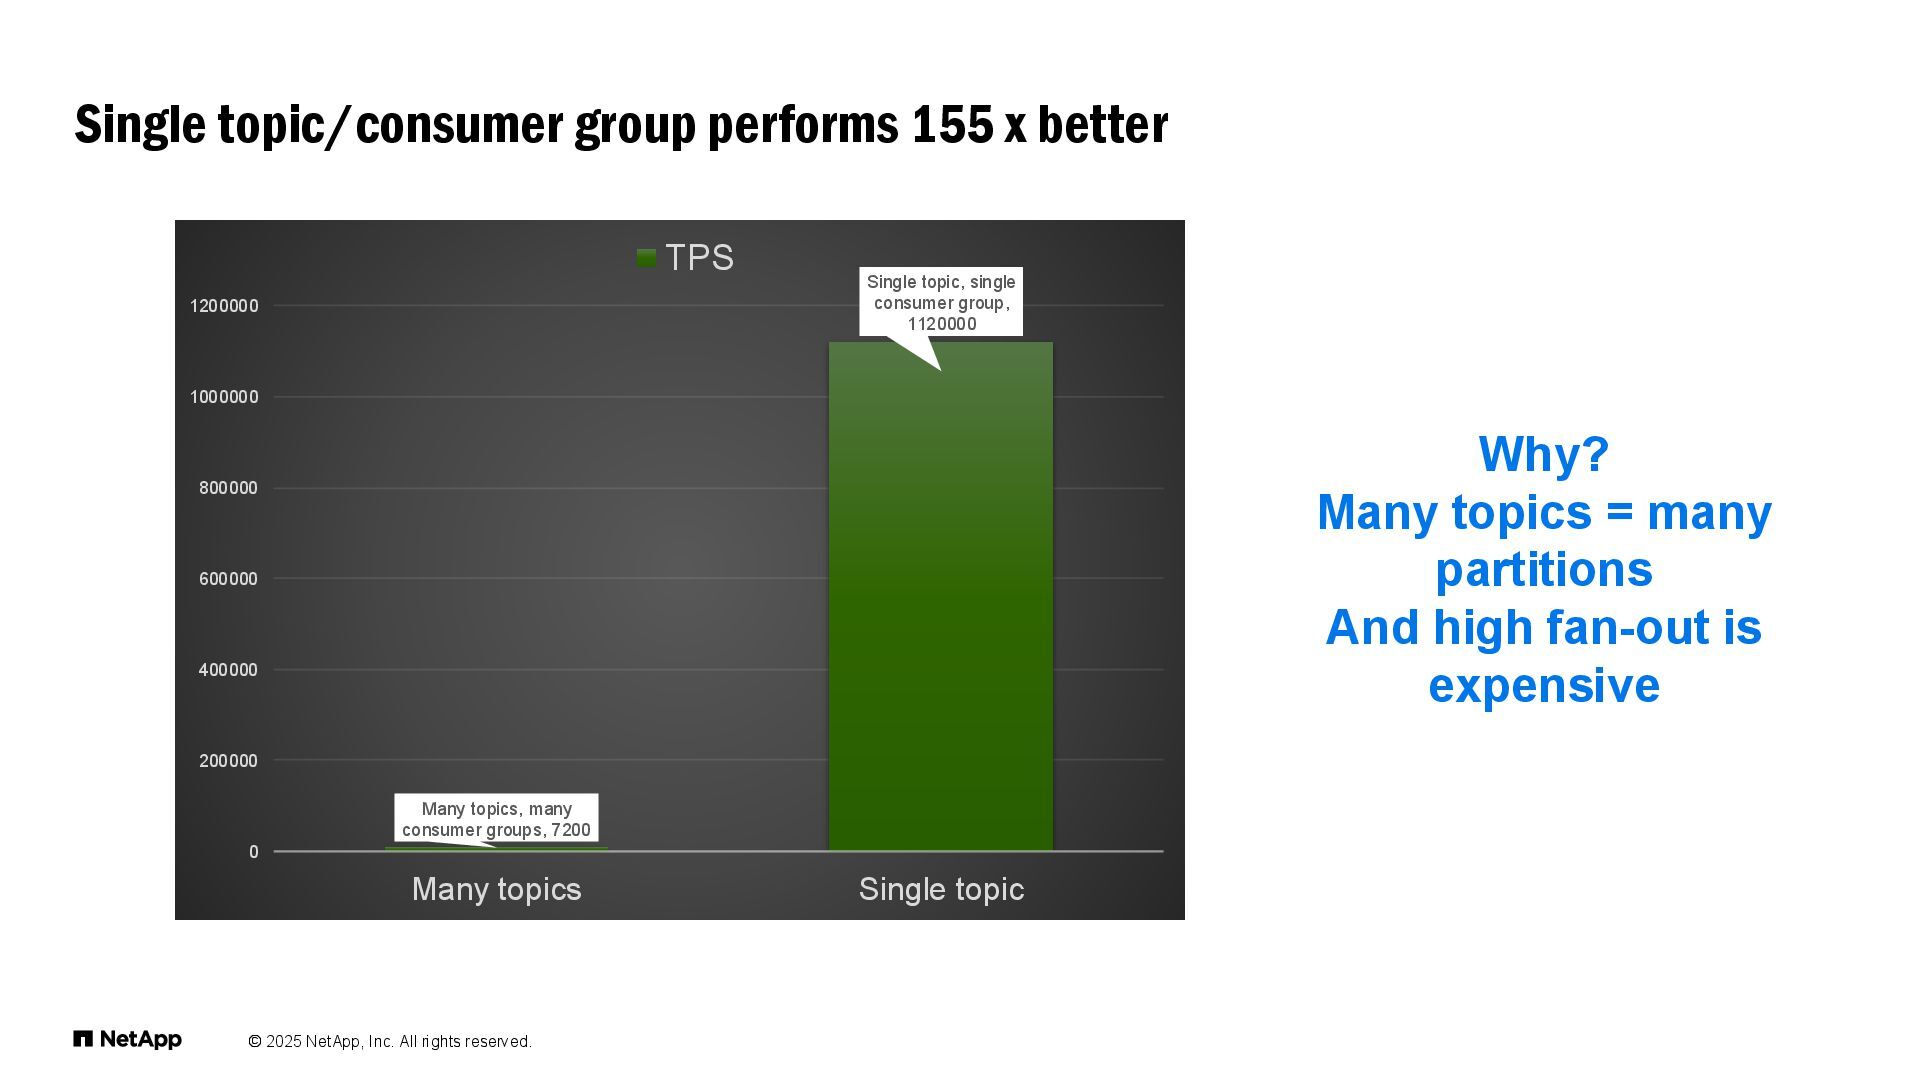
  10. © 2025 NetApp, Inc. All rights reserved. Single topic/consumer group

    performs 155 x better Many topics, many consumer groups, 7200 Single topic, single consumer group, 1120000 0 200000 400000 600000 800000 1000000 1200000 Many topics Single topic TPS Why? Many topics = many partitions And high fan-out is expensive
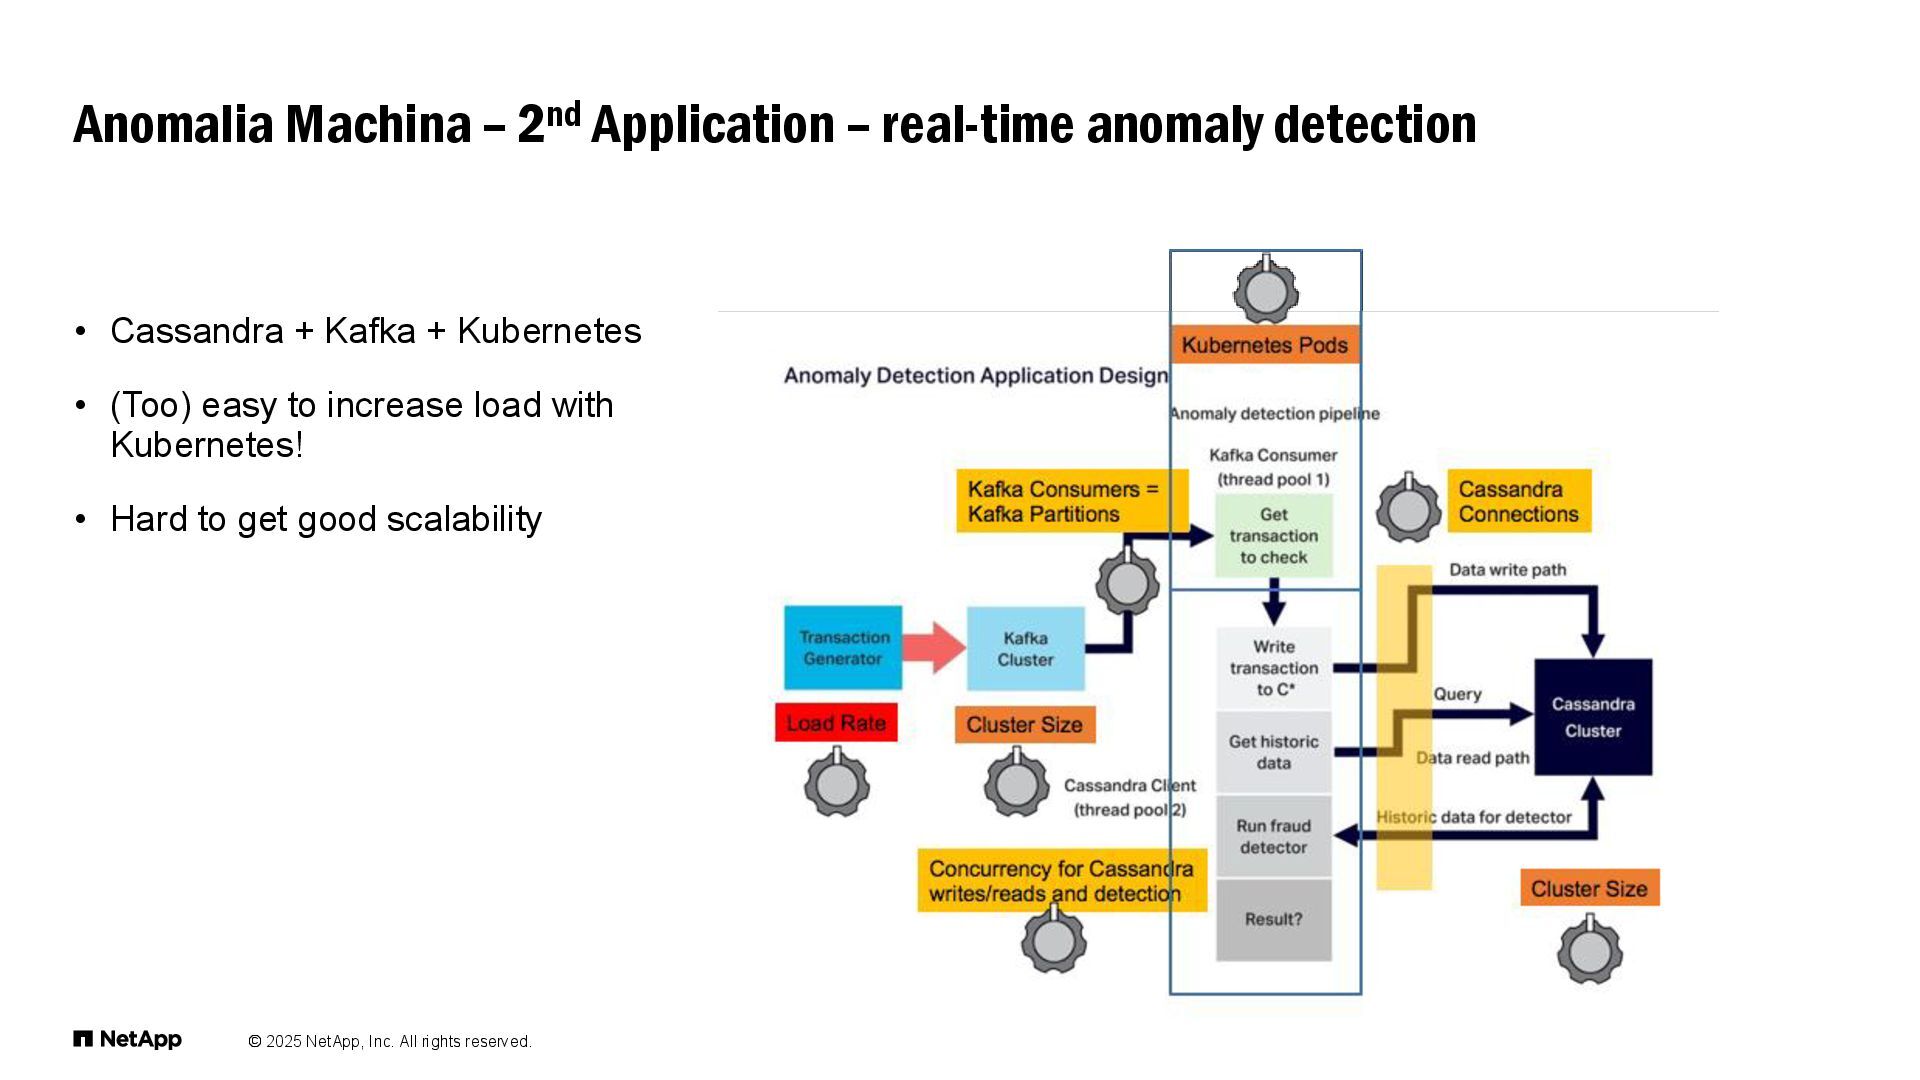
  11. © 2025 NetApp, Inc. All rights reserved. • Cassandra +

    Kafka + Kubernetes • (Too) easy to increase load with Kubernetes! • Hard to get good scalability Anomalia Machina – 2nd Application – real-time anomaly detection
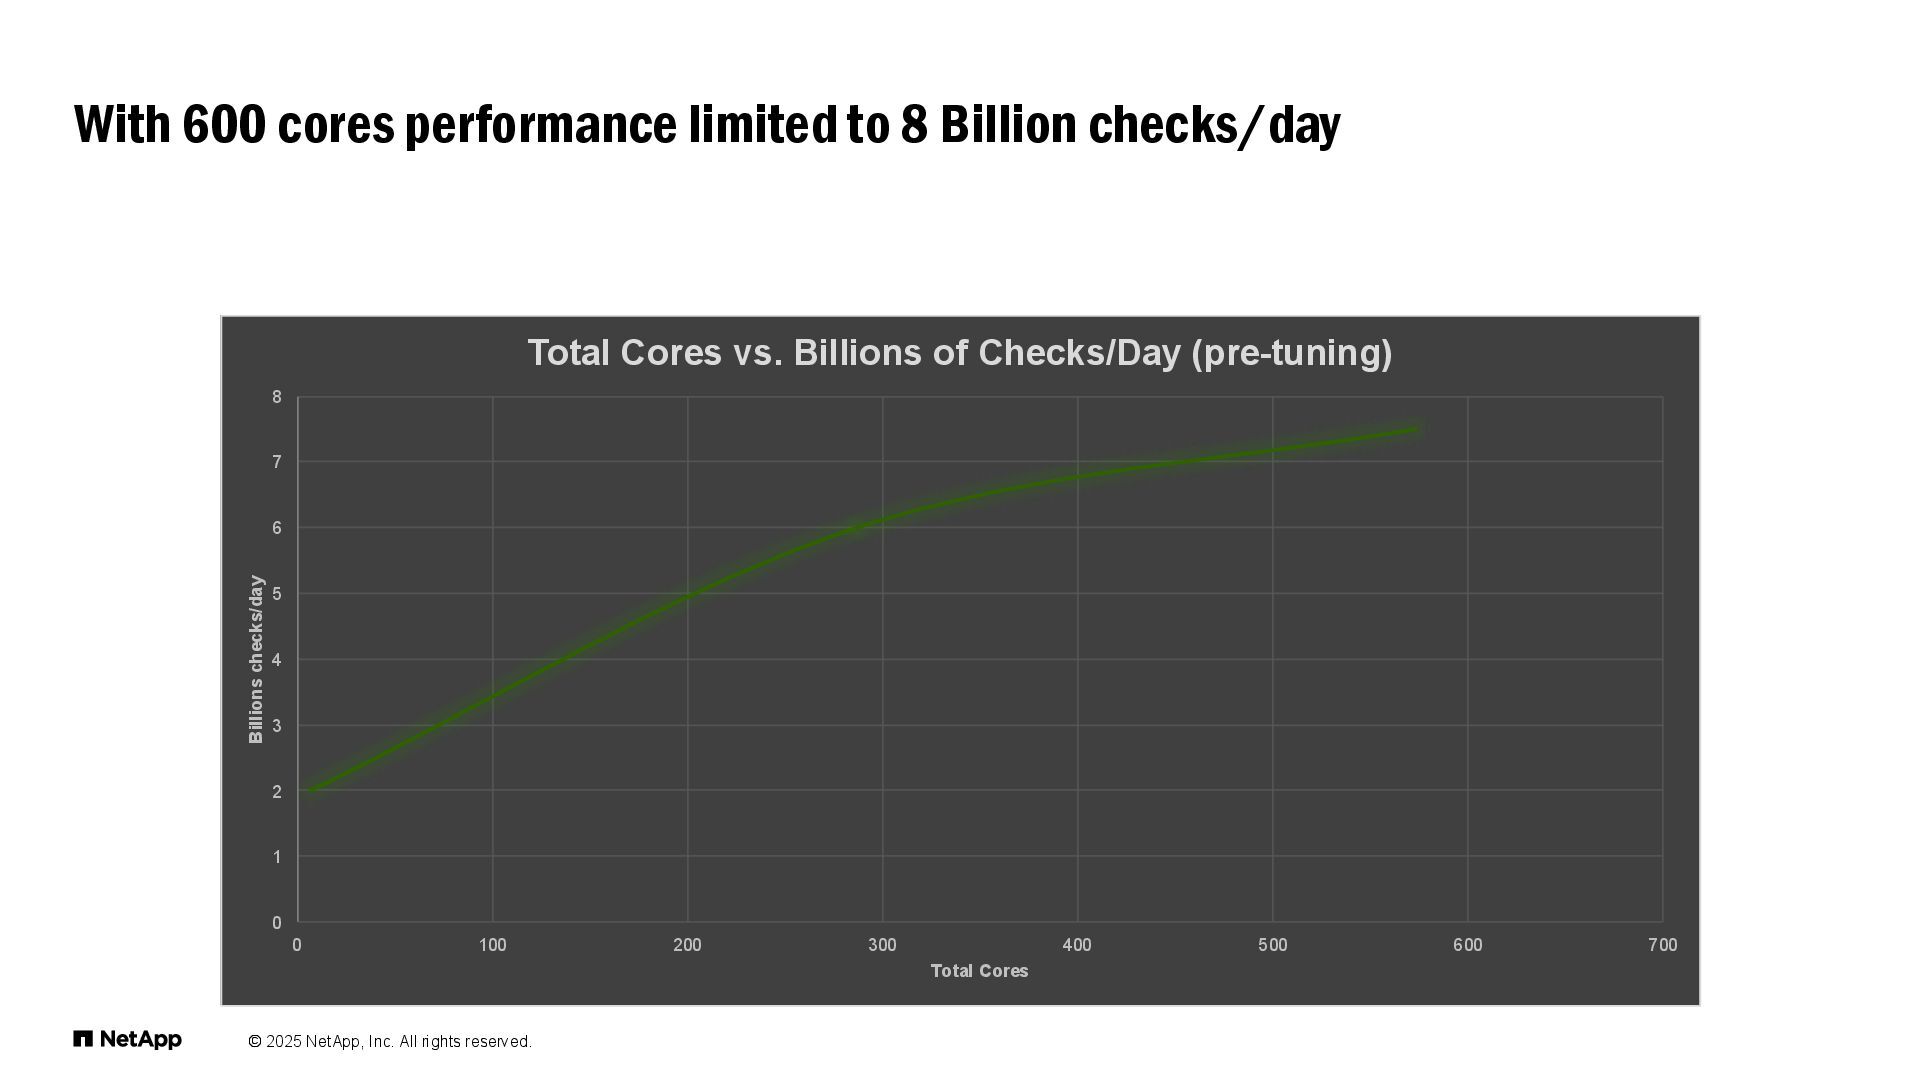
  12. © 2025 NetApp, Inc. All rights reserved. With 600 cores

    performance limited to 8 Billion checks/day 0 1 2 3 4 5 6 7 8 0 100 200 300 400 500 600 700 Billions checks/day Total Cores Total Cores vs. Billions of Checks/Day (pre-tuning)
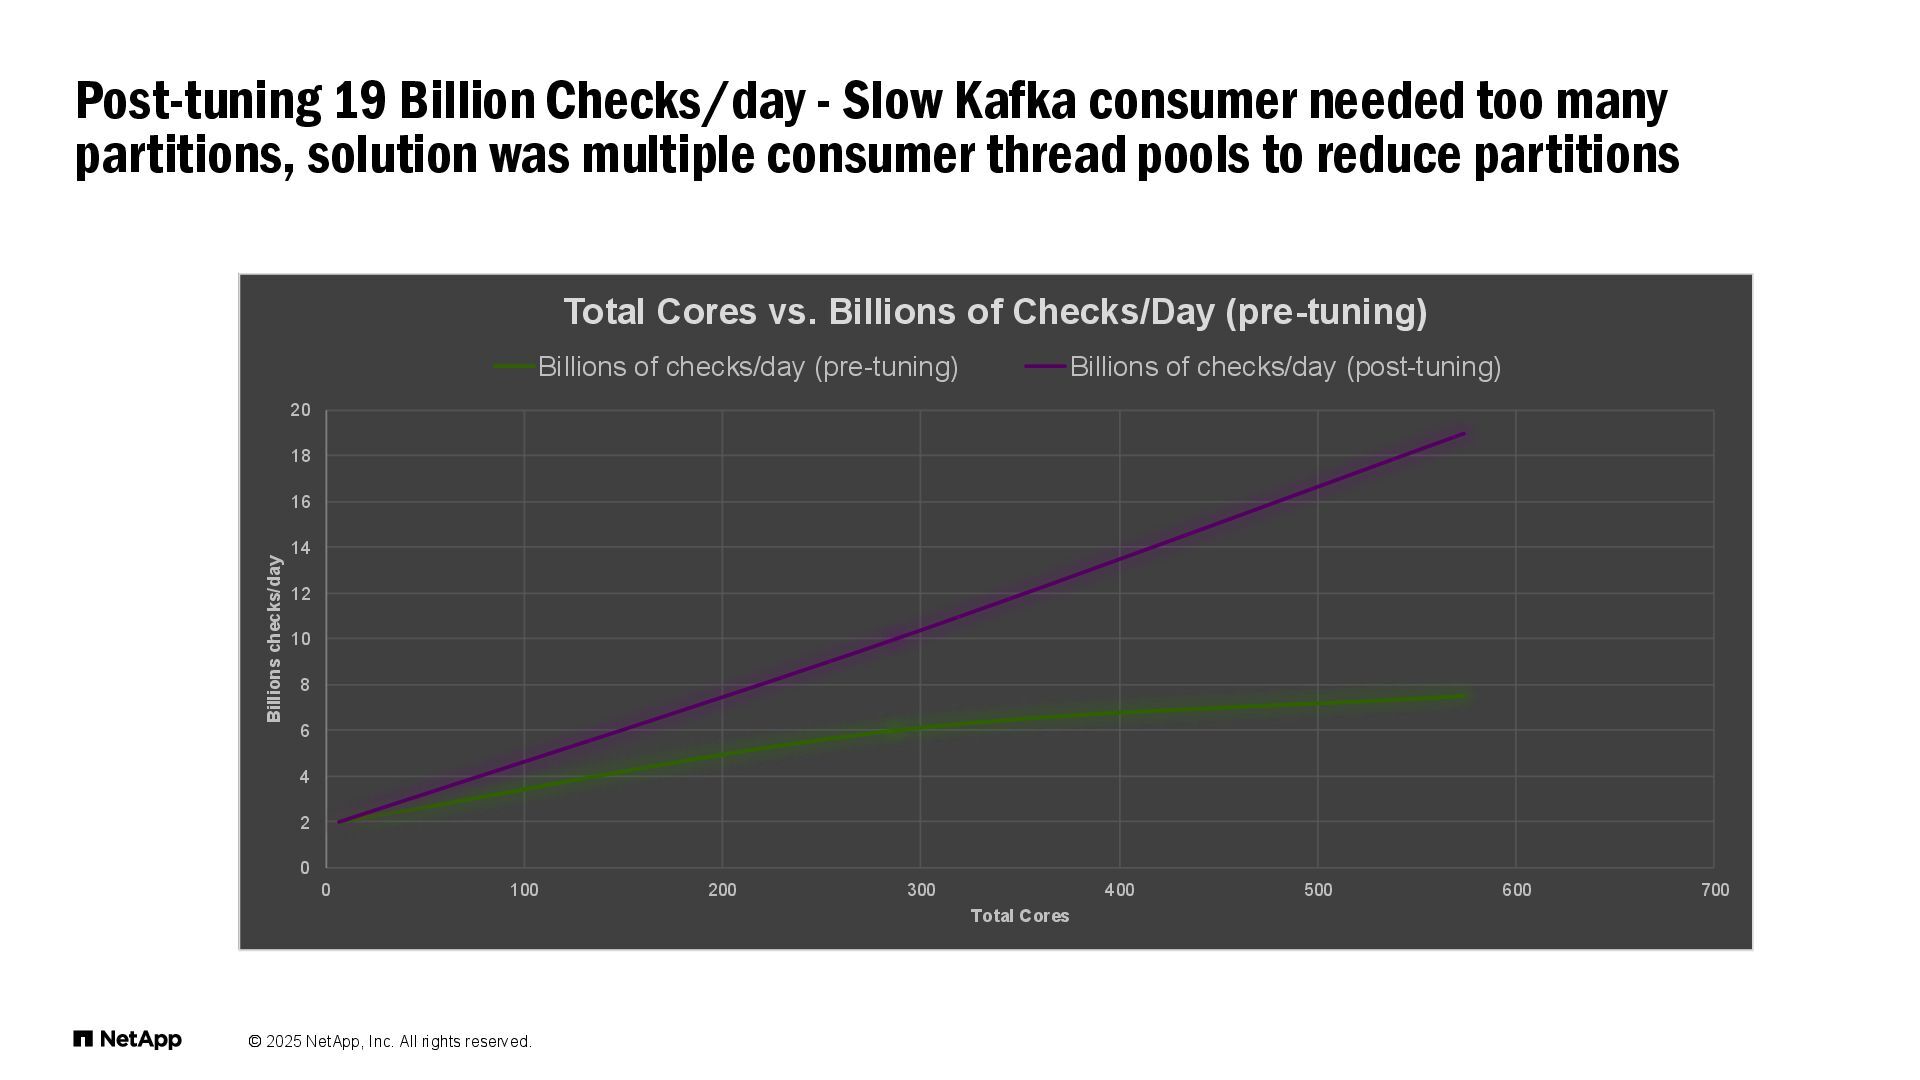
  13. © 2025 NetApp, Inc. All rights reserved. Post-tuning 19 Billion

    Checks/day - Slow Kafka consumer needed too many partitions, solution was multiple consumer thread pools to reduce partitions 0 2 4 6 8 10 12 14 16 18 20 0 100 200 300 400 500 600 700 Billions checks/day Total Cores Total Cores vs. Billions of Checks/Day (pre-tuning) Billions of checks/day (pre-tuning) Billions of checks/day (post-tuning)
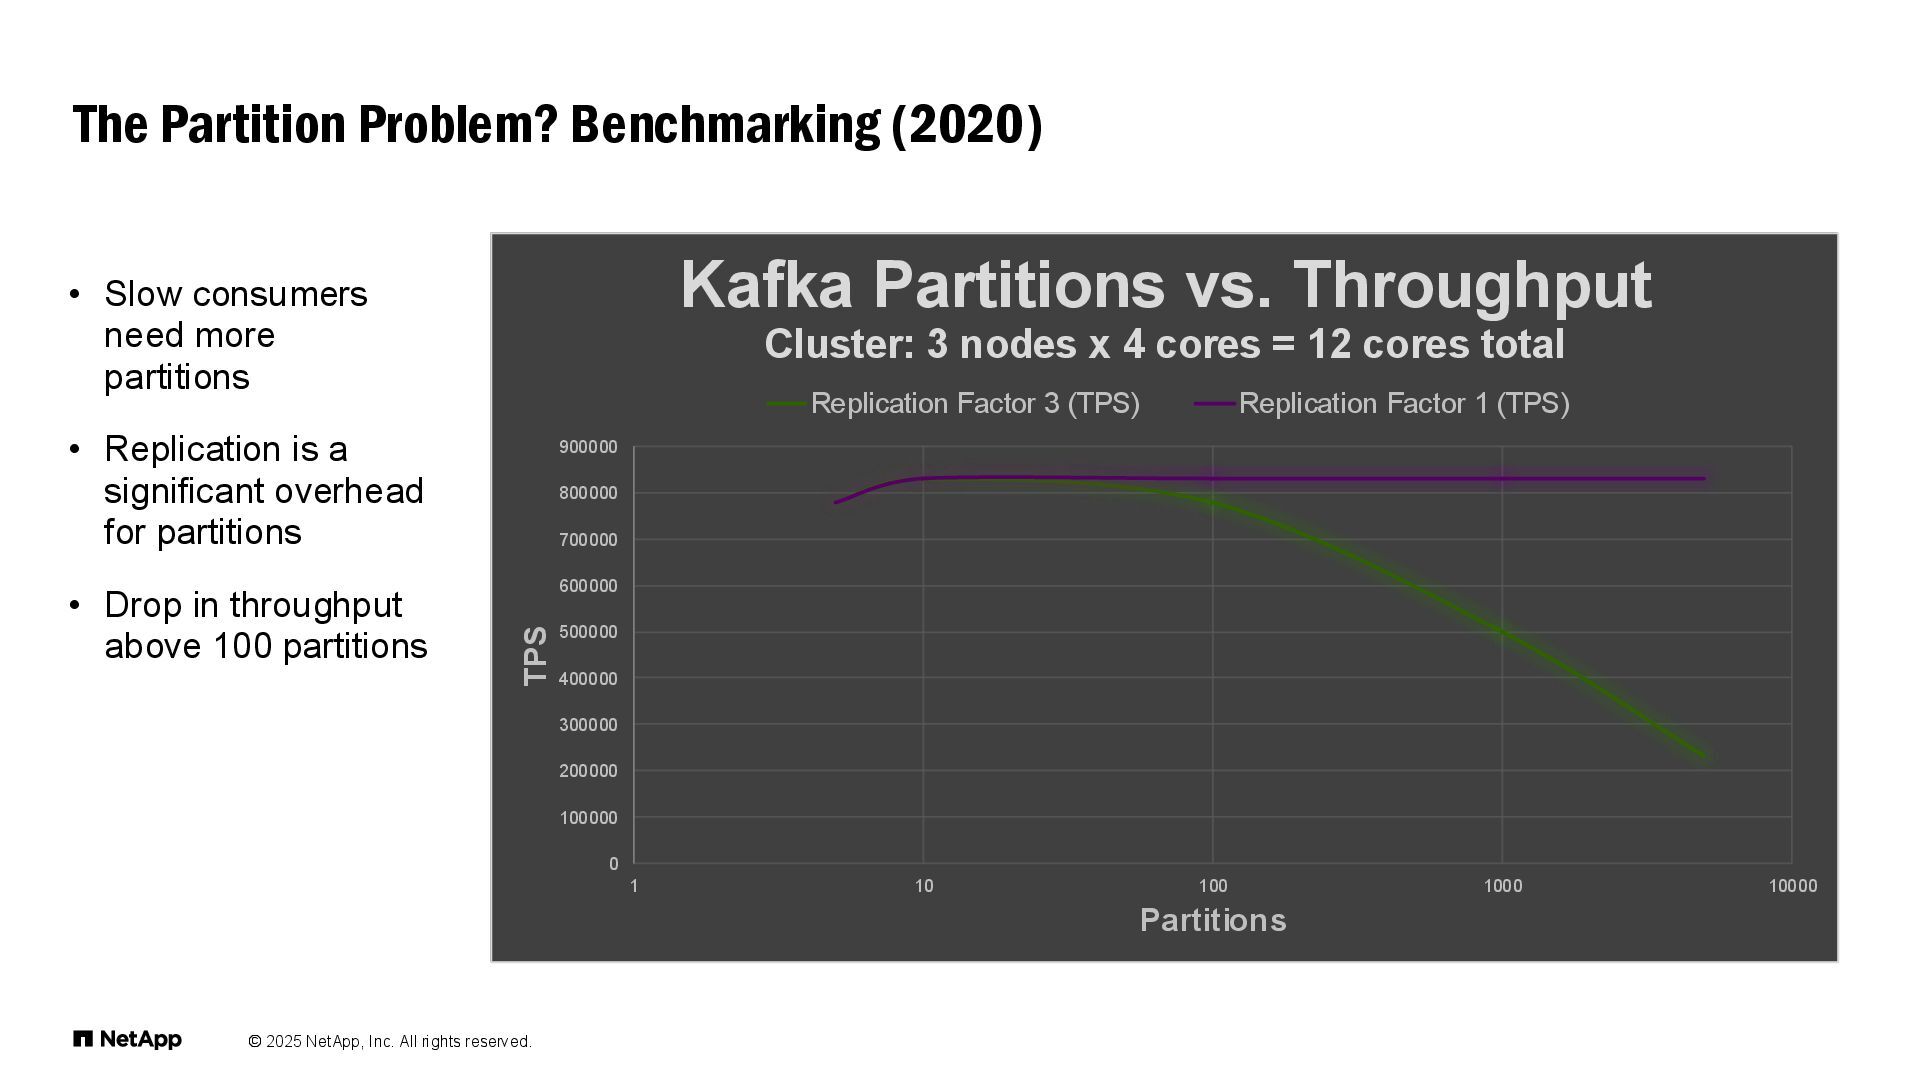
  14. © 2025 NetApp, Inc. All rights reserved. • Slow consumers

    need more partitions • Replication is a significant overhead for partitions • Drop in throughput above 100 partitions The Partition Problem? Benchmarking (2020) 0 100000 200000 300000 400000 500000 600000 700000 800000 900000 1 10 100 1000 10000 TPS Partitions Kafka Partitions vs. Throughput Cluster: 3 nodes x 4 cores = 12 cores total Replication Factor 3 (TPS) Replication Factor 1 (TPS)
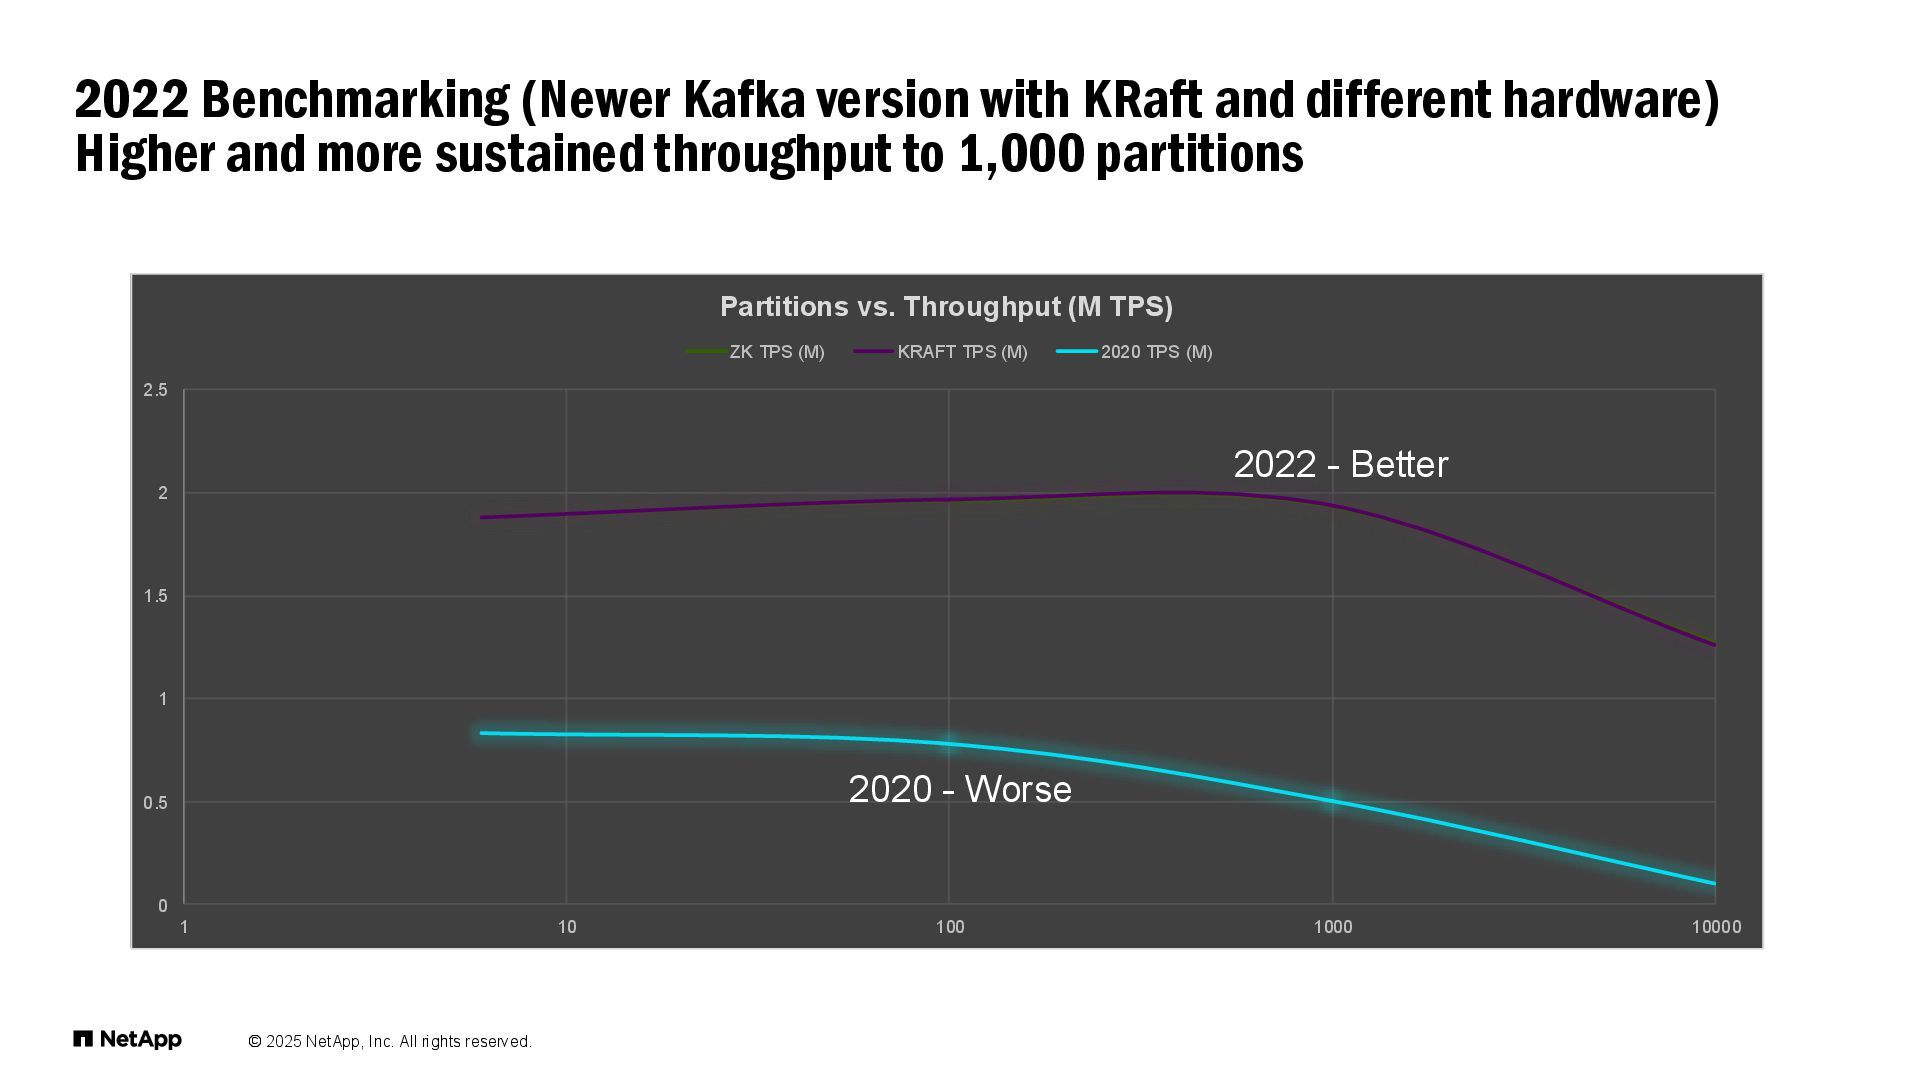
  15. © 2025 NetApp, Inc. All rights reserved. 2022 Benchmarking (Newer

    Kafka version with KRaft and different hardware) Higher and more sustained throughput to 1,000 partitions 0 0.5 1 1.5 2 2.5 1 10 100 1000 10000 Partitions vs. Throughput (M TPS) ZK TPS (M) KRAFT TPS (M) 2020 TPS (M) 2022 - Better 2020 - Worse
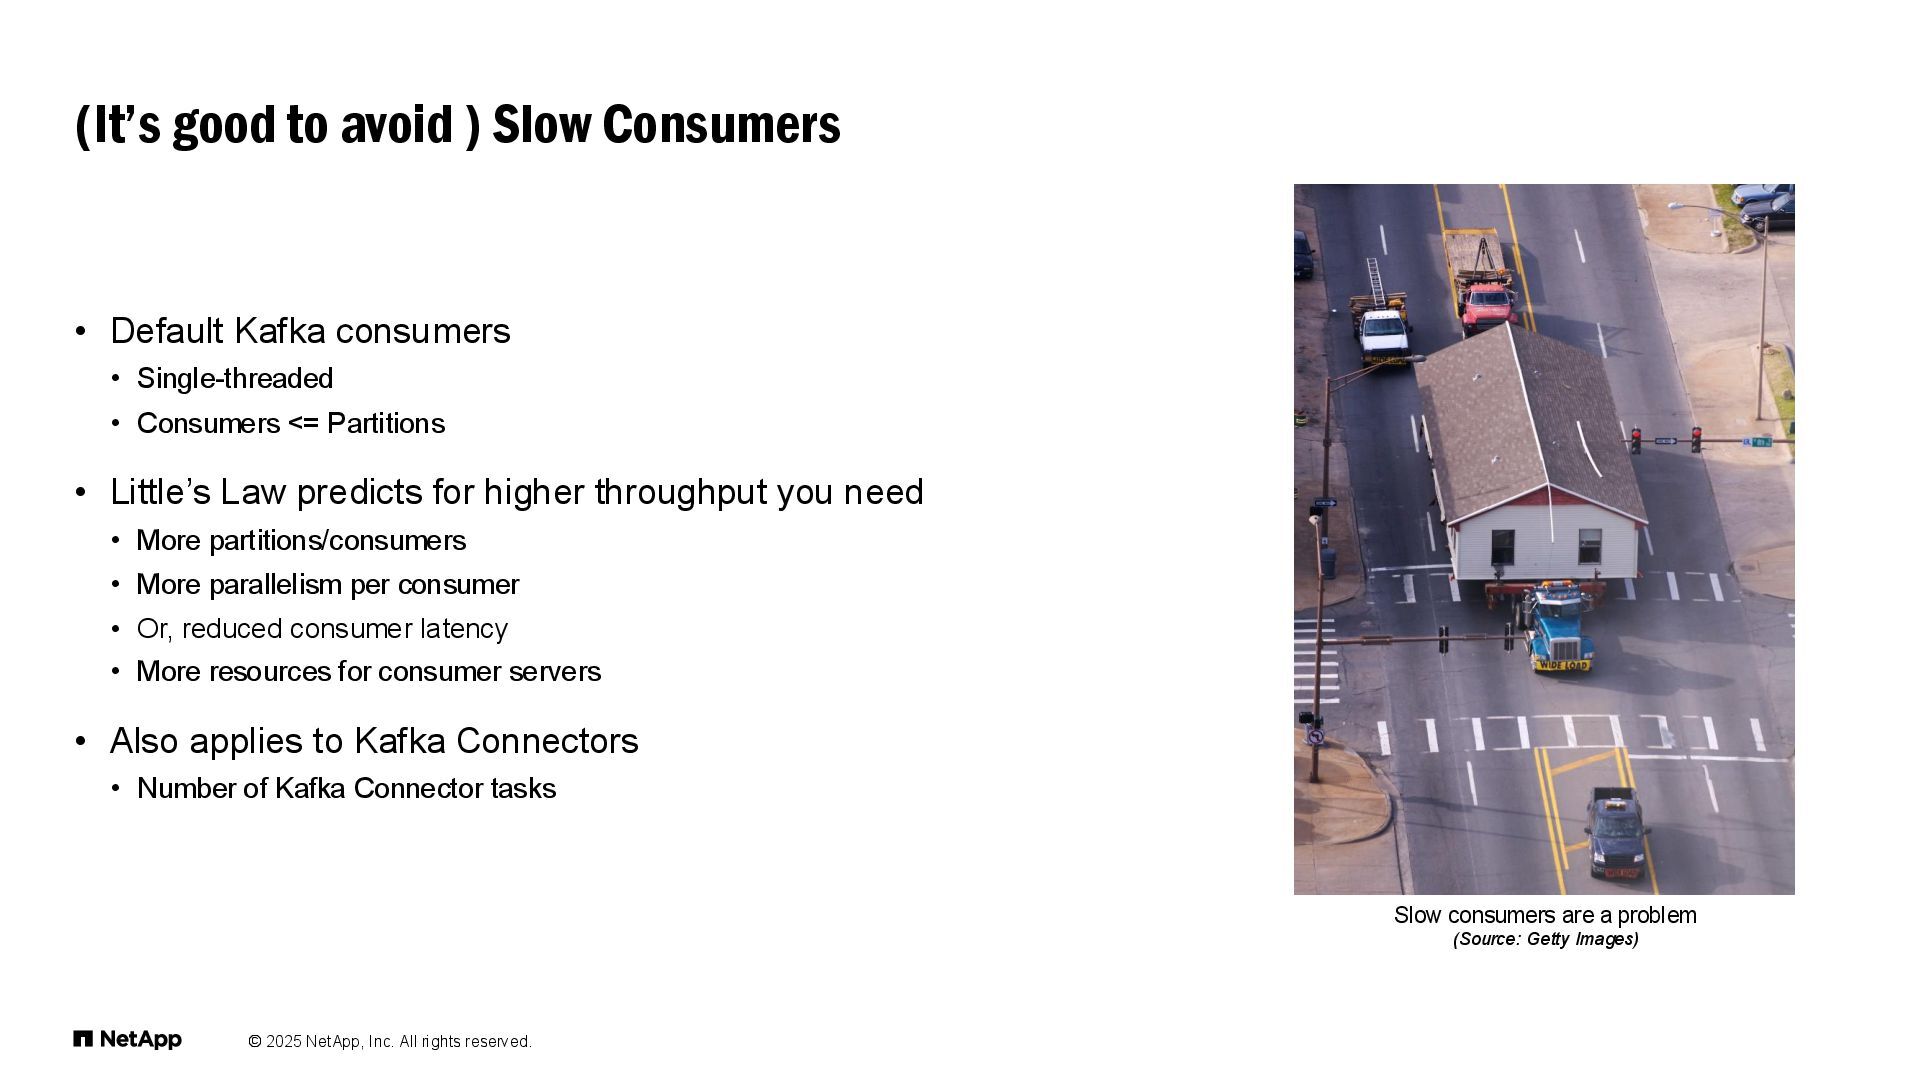
  16. © 2025 NetApp, Inc. All rights reserved. • Default Kafka

    consumers • Single-threaded • Consumers <= Partitions • Little’s Law predicts for higher throughput you need • More partitions/consumers • More parallelism per consumer • Or, reduced consumer latency • More resources for consumer servers • Also applies to Kafka Connectors • Number of Kafka Connector tasks (It’s good to avoid ) Slow Consumers Slow consumers are a problem (Source: Getty Images)
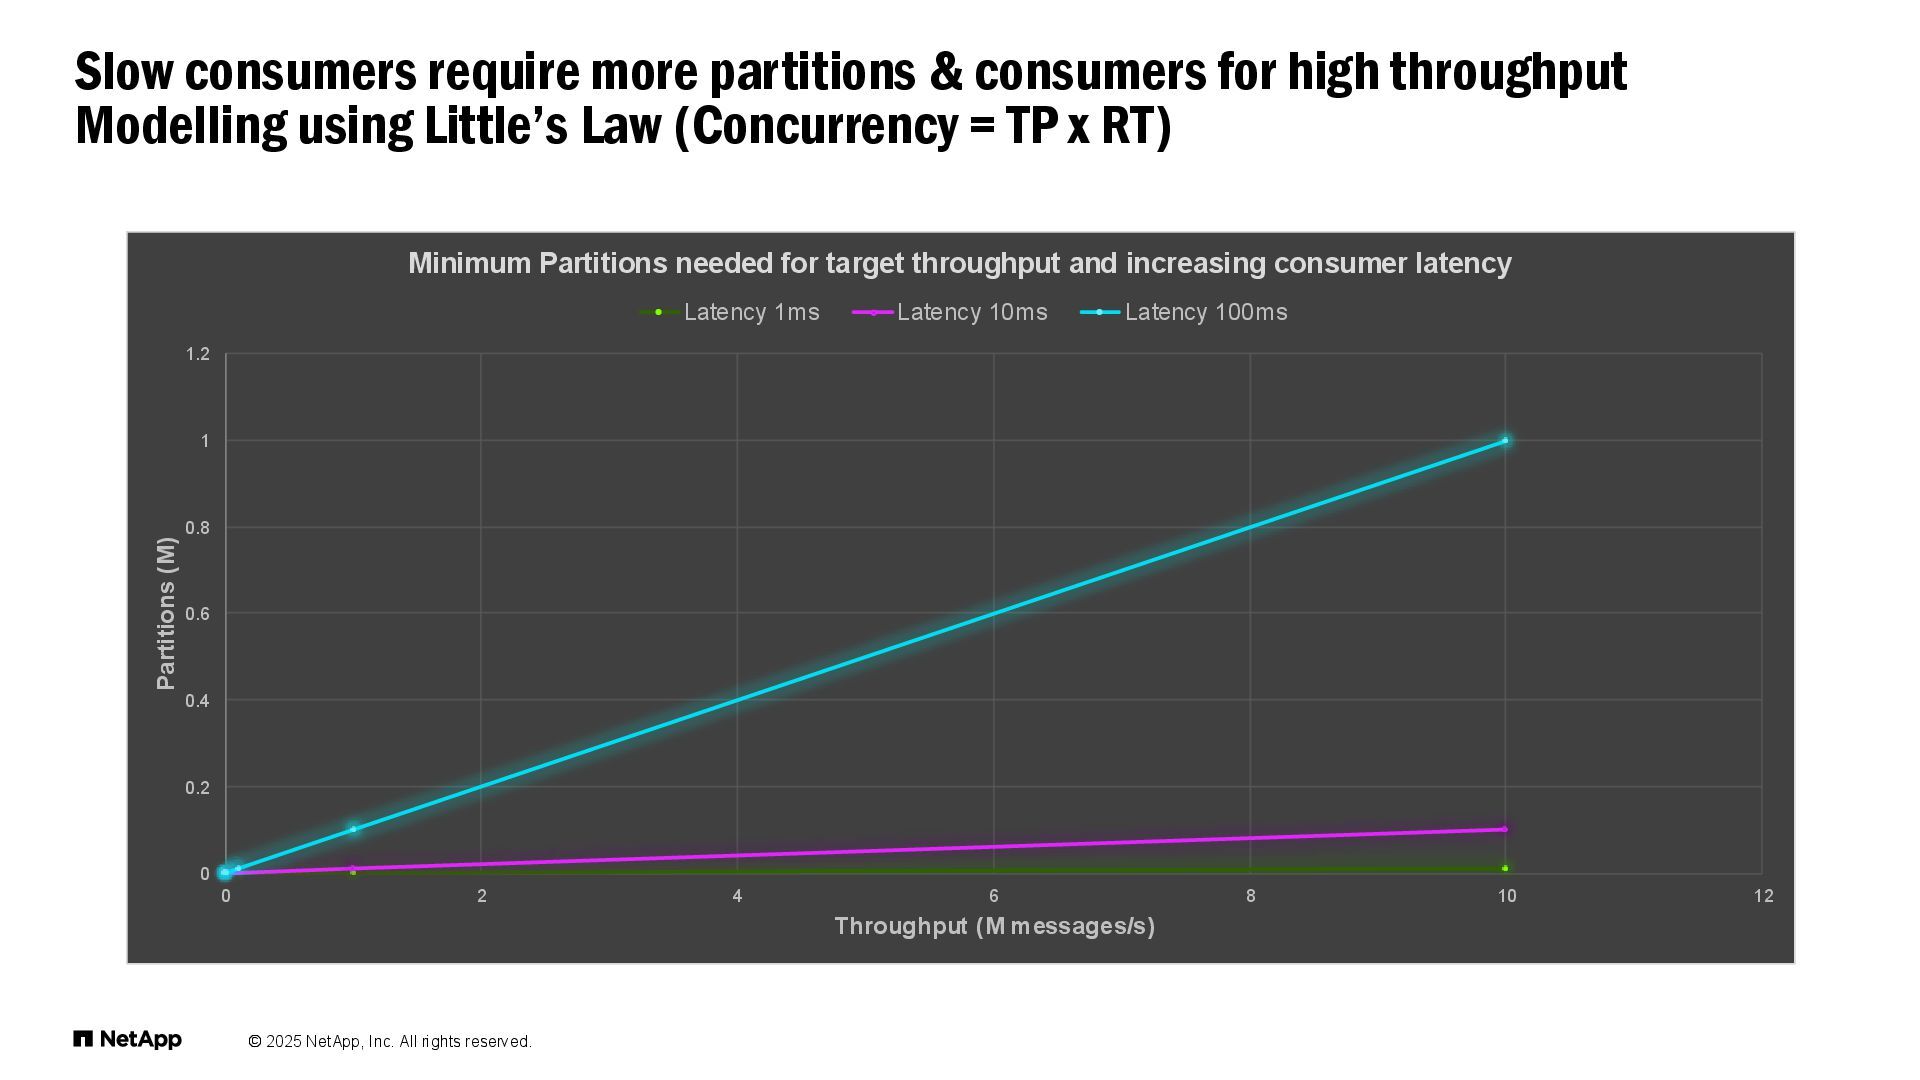
  17. © 2025 NetApp, Inc. All rights reserved. Slow consumers require

    more partitions & consumers for high throughput Modelling using Little’s Law (Concurrency = TP x RT) 0 0.2 0.4 0.6 0.8 1 1.2 0 2 4 6 8 10 12 Partitions (M) Throughput (M messages/s) Minimum Partitions needed for target throughput and increasing consumer latency Latency 1ms Latency 10ms Latency 100ms
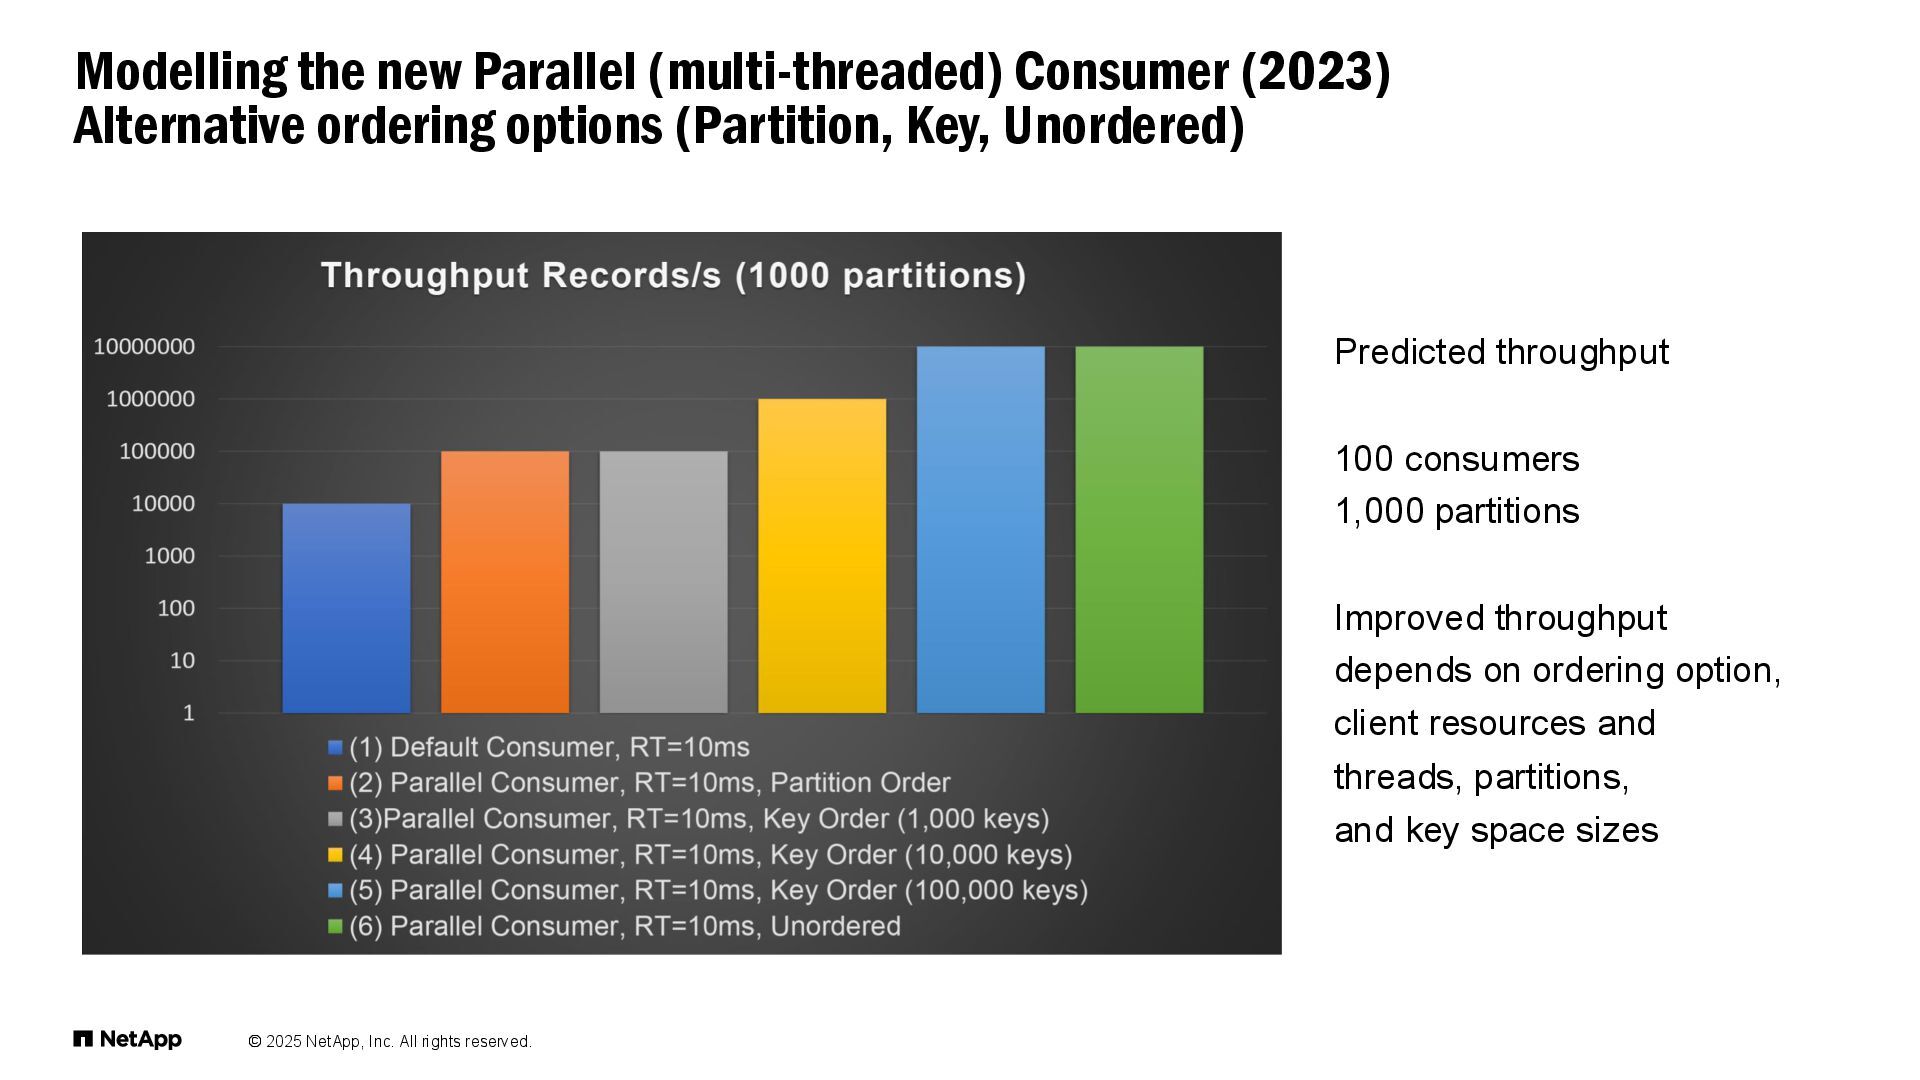
  18. © 2025 NetApp, Inc. All rights reserved. Modelling the new

    Parallel (multi-threaded) Consumer (2023) Alternative ordering options (Partition, Key, Unordered) Predicted throughput 100 consumers 1,000 partitions Improved throughput depends on ordering option, client resources and threads, partitions, and key space sizes
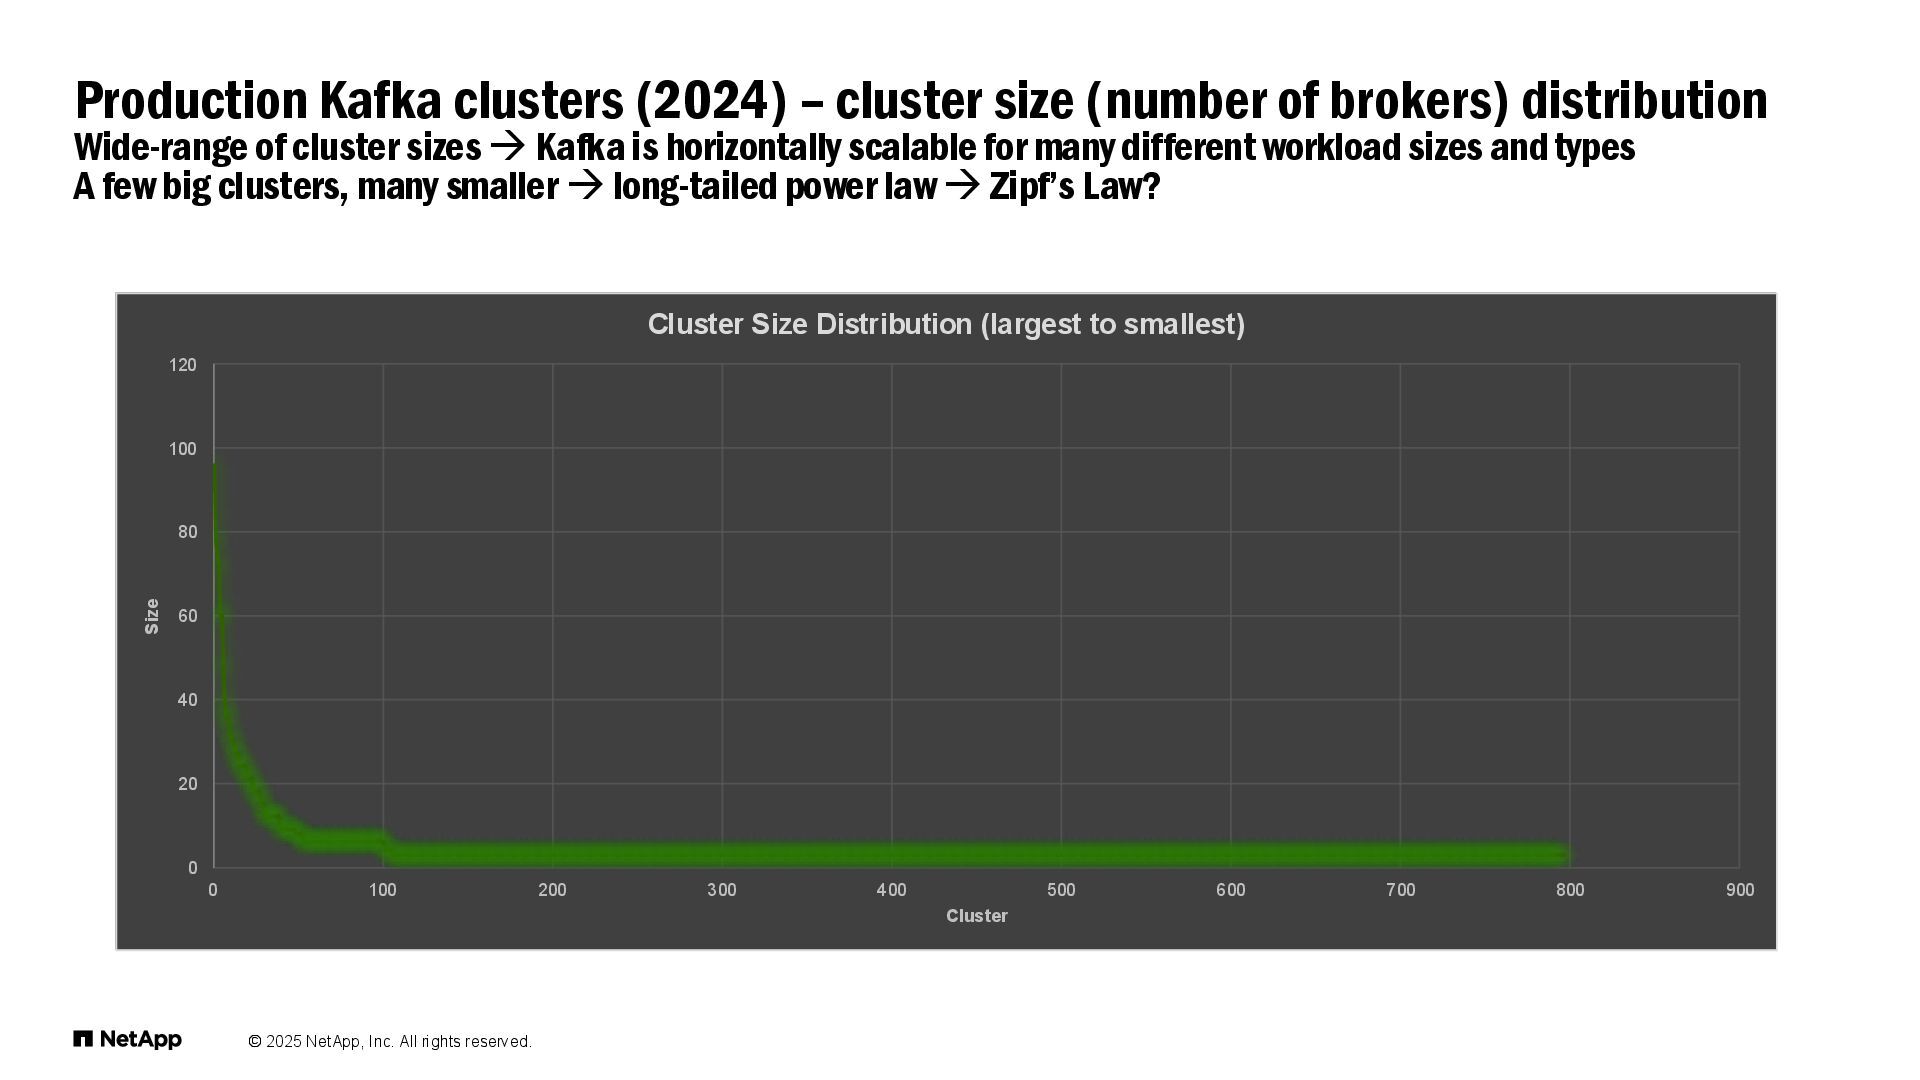
  19. © 2025 NetApp, Inc. All rights reserved. Production Kafka clusters

    (2024) – cluster size (number of brokers) distribution Wide-range of cluster sizes → Kafka is horizontally scalable for many different workload sizes and types A few big clusters, many smaller → long-tailed power law → Zipf’s Law? 0 20 40 60 80 100 120 0 100 200 300 400 500 600 700 800 900 Size Cluster Cluster Size Distribution (largest to smallest)
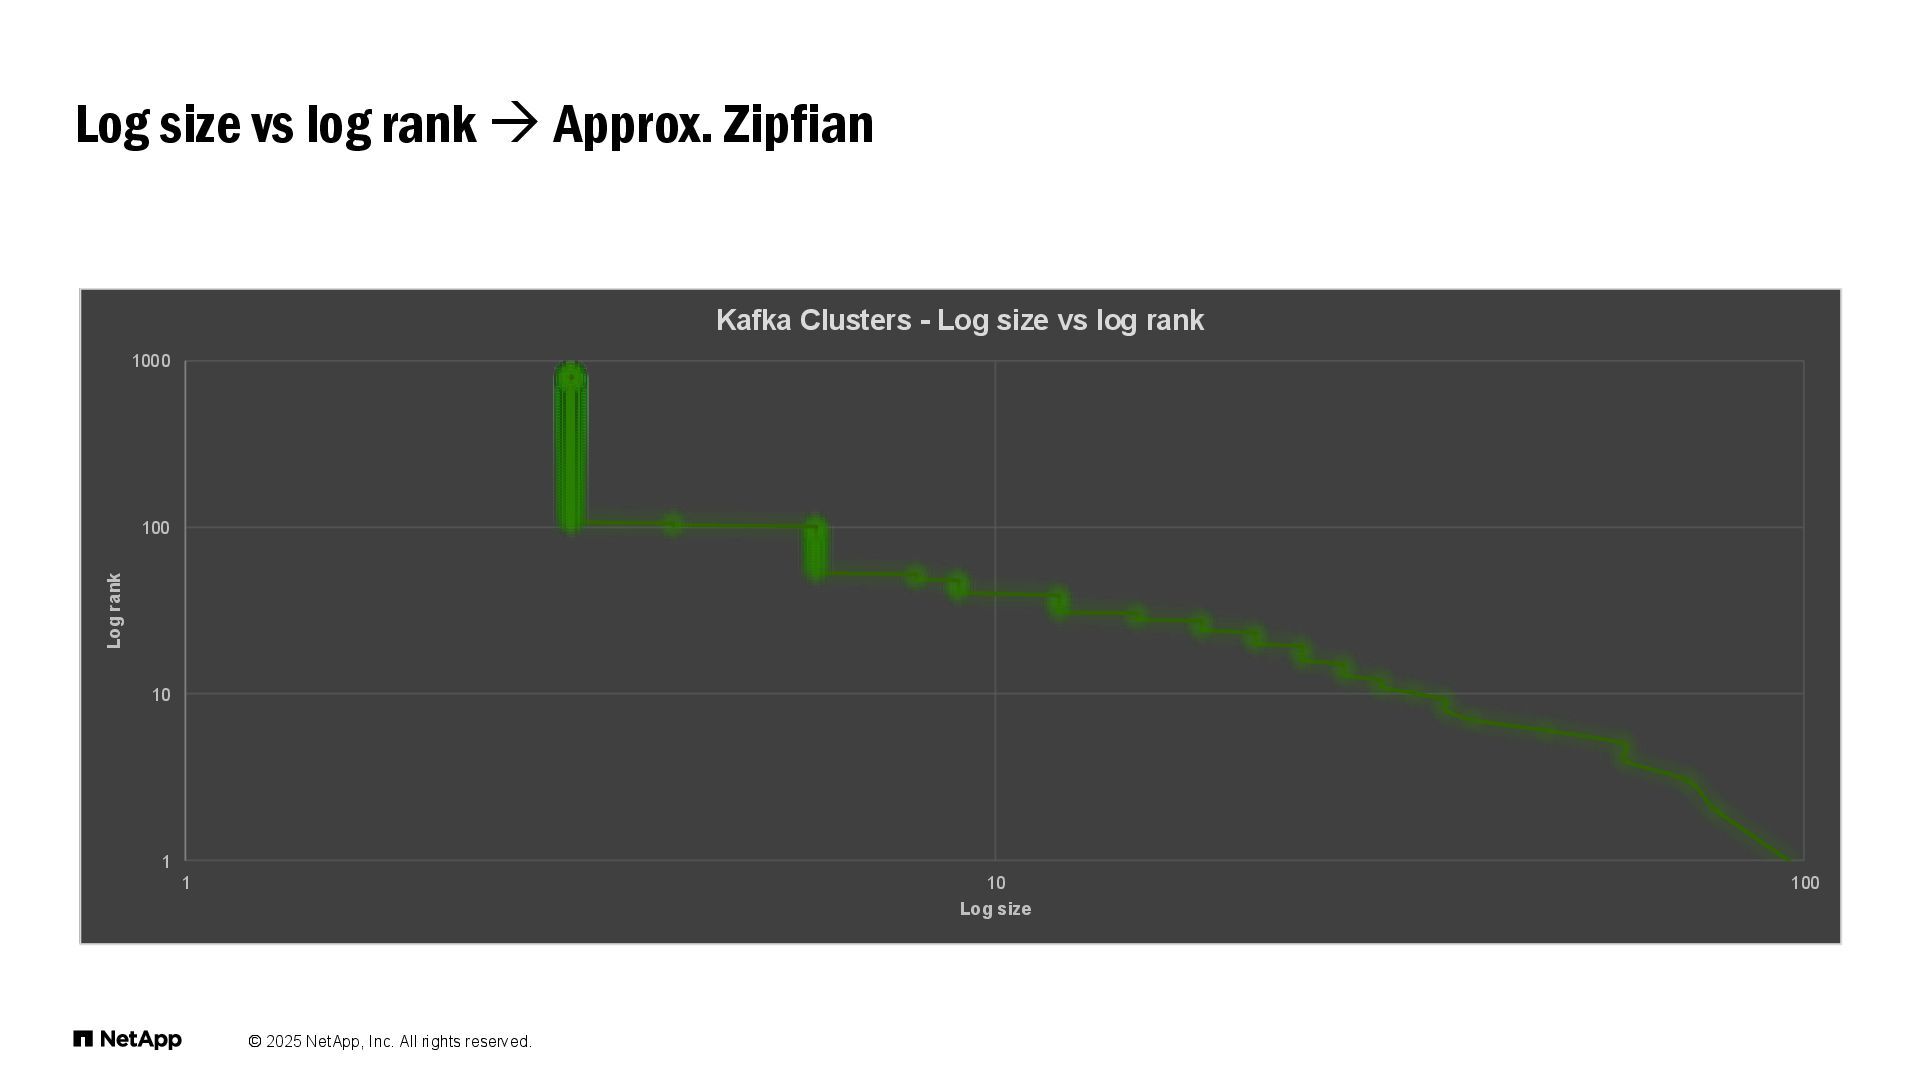
  20. © 2025 NetApp, Inc. All rights reserved. Log size vs

    log rank → Approx. Zipfian 1 10 100 1000 1 10 100 Log rank Log size Kafka Clusters - Log size vs log rank
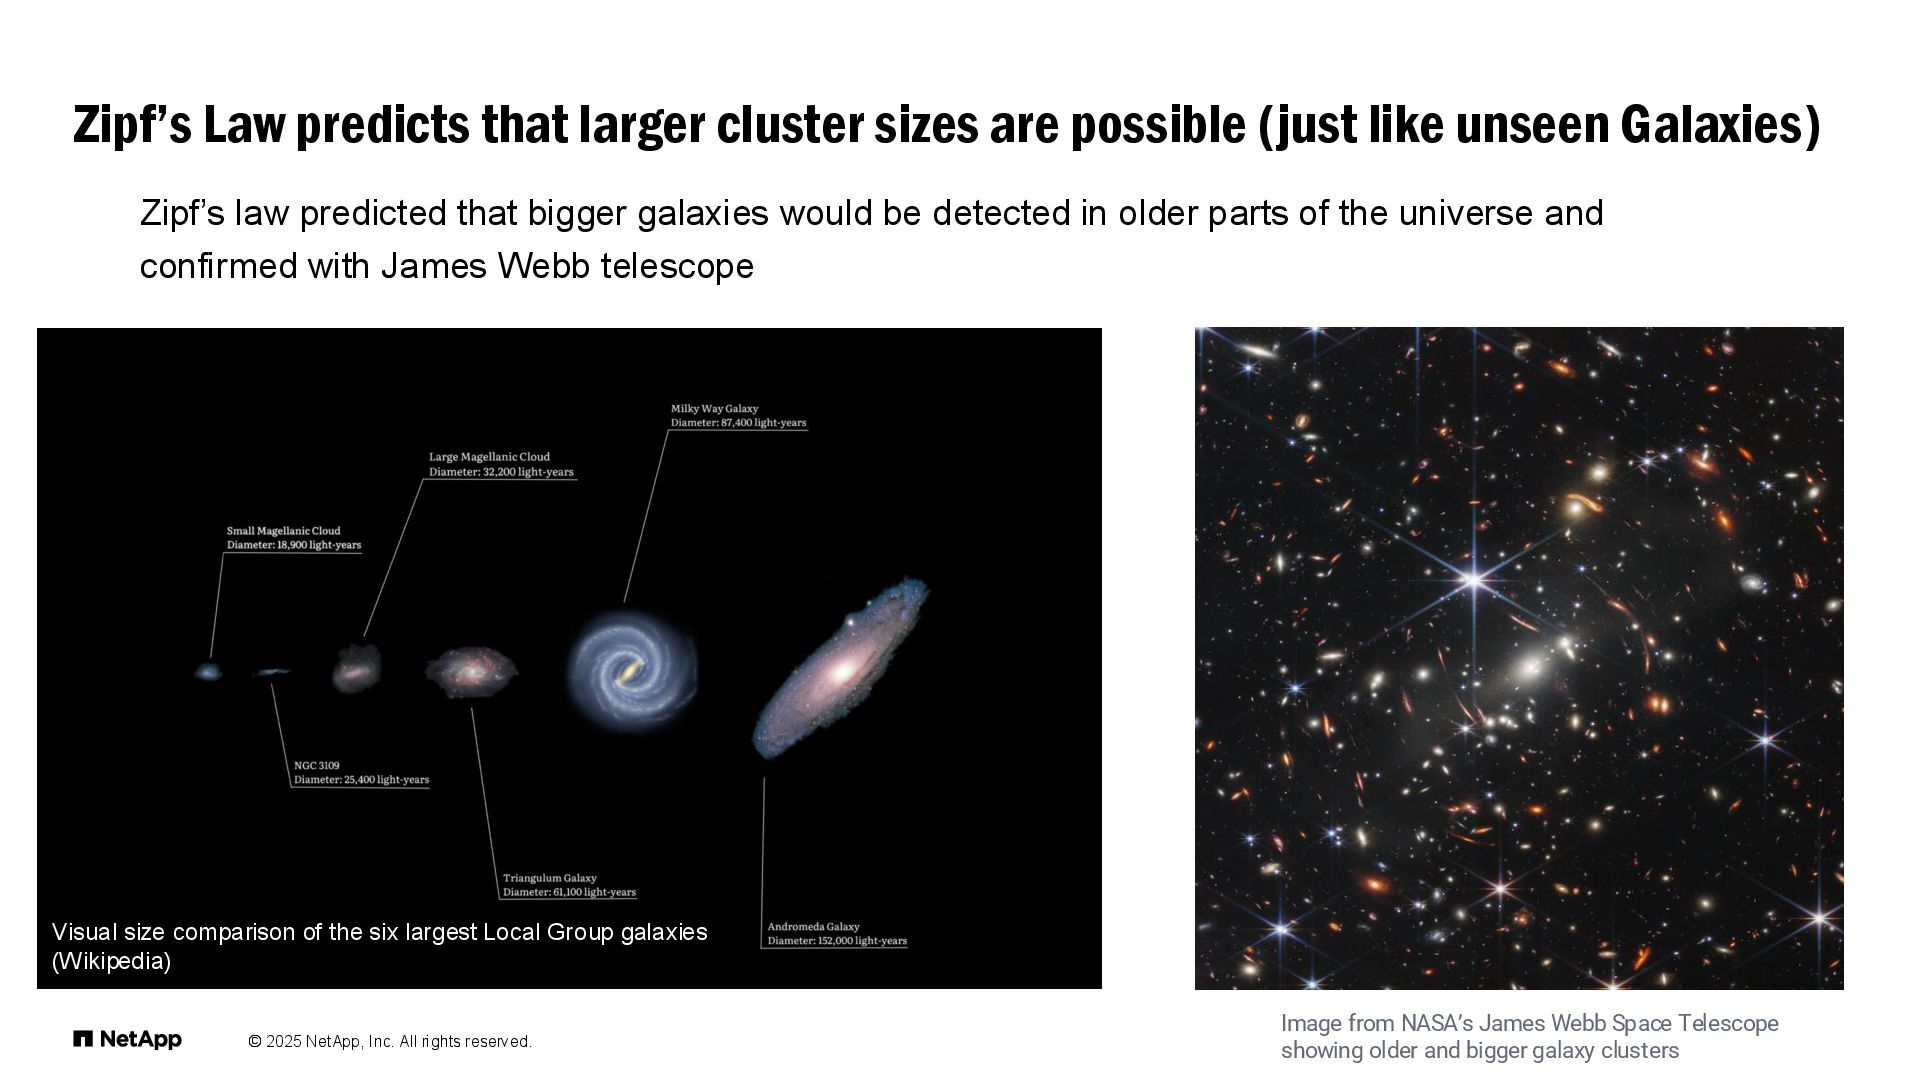
  21. © 2025 NetApp, Inc. All rights reserved. Zipf’s Law predicts

    that larger cluster sizes are possible (just like unseen Galaxies) Zipf’s law predicted that bigger galaxies would be detected in older parts of the universe and confirmed with James Webb telescope Visual size comparison of the six largest Local Group galaxies (Wikipedia) Image from NASA’s James Webb Space Telescope showing older and bigger galaxy clusters
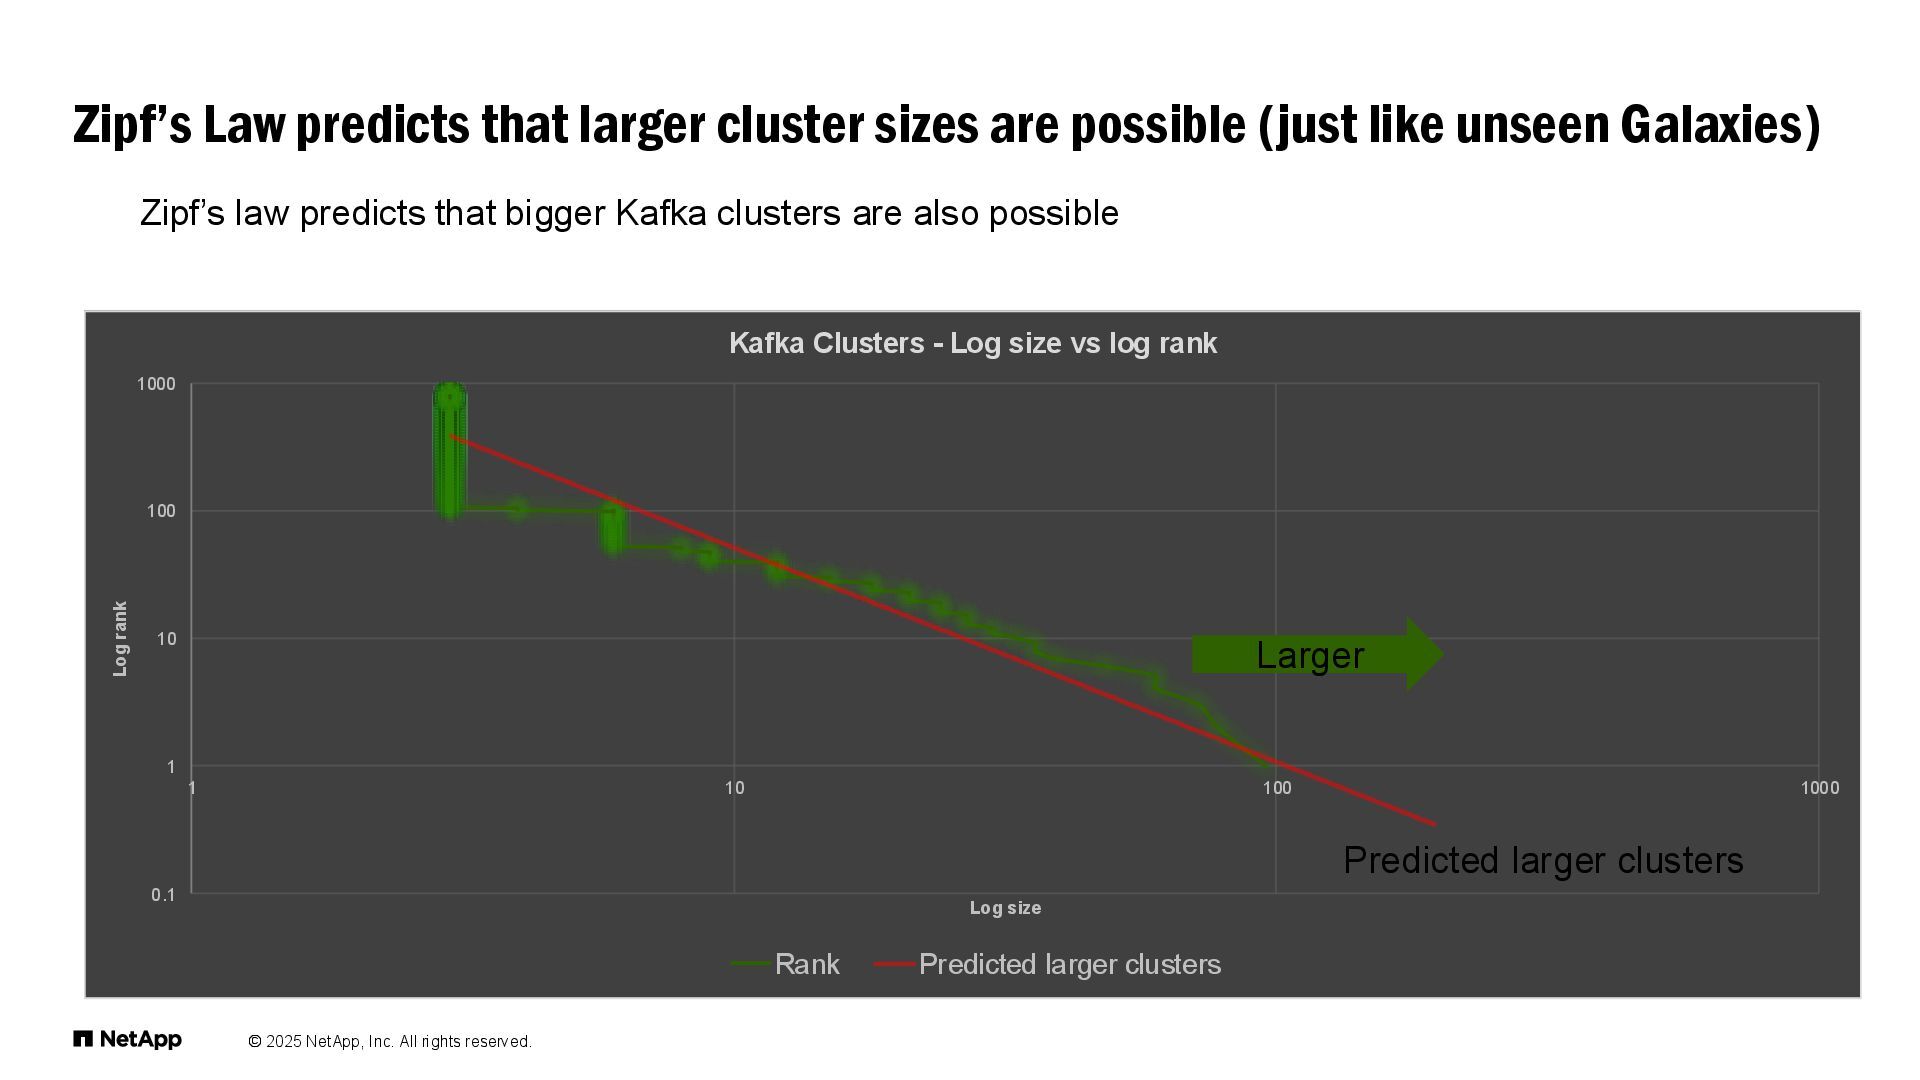
  22. © 2025 NetApp, Inc. All rights reserved. Zipf’s Law predicts

    that larger cluster sizes are possible (just like unseen Galaxies) Zipf’s law predicts that bigger Kafka clusters are also possible 0.1 1 10 100 1000 1 10 100 1000 Log rank Log size Kafka Clusters - Log size vs log rank Rank Predicted larger clusters Predicted larger clusters Larger
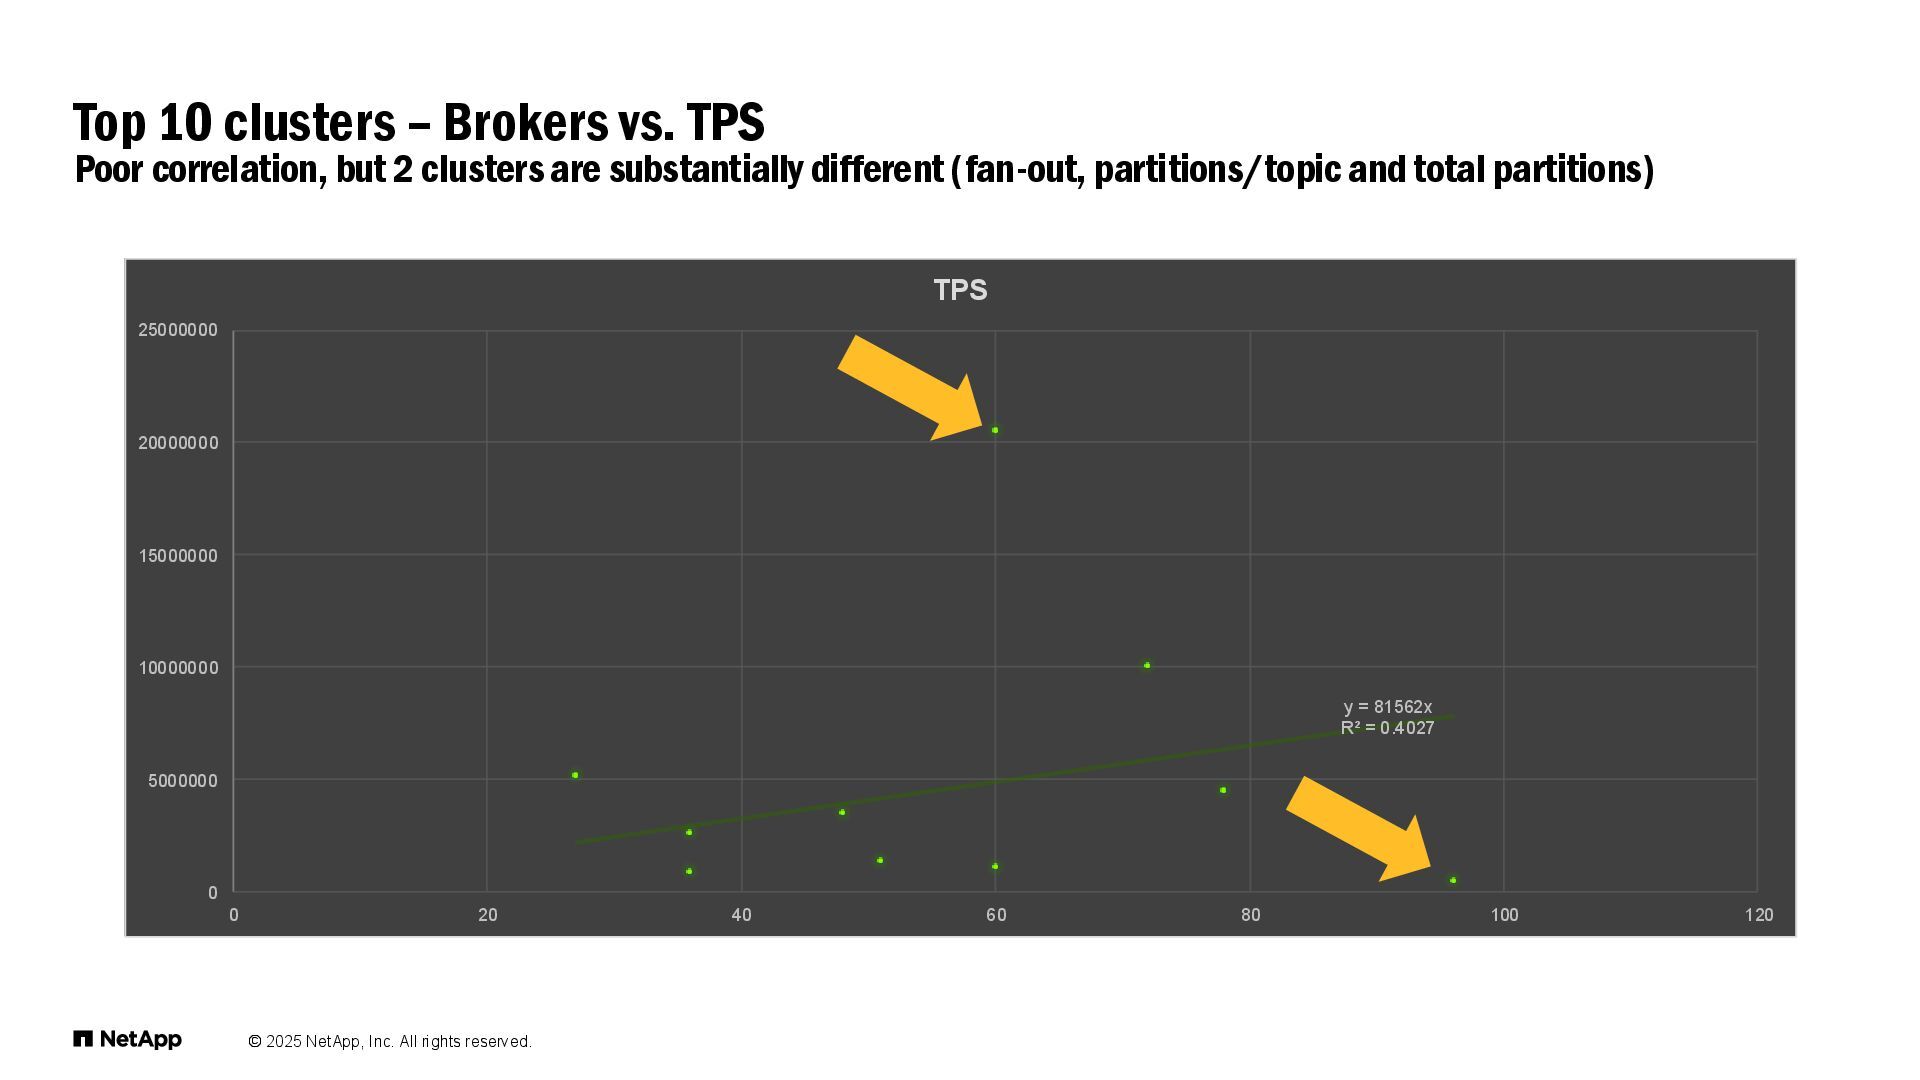
  23. © 2025 NetApp, Inc. All rights reserved. Top 10 clusters

    – Brokers vs. TPS Poor correlation, but 2 clusters are substantially different (fan-out, partitions/topic and total partitions) y = 81562x R² = 0.4027 0 5000000 10000000 15000000 20000000 25000000 0 20 40 60 80 100 120 TPS
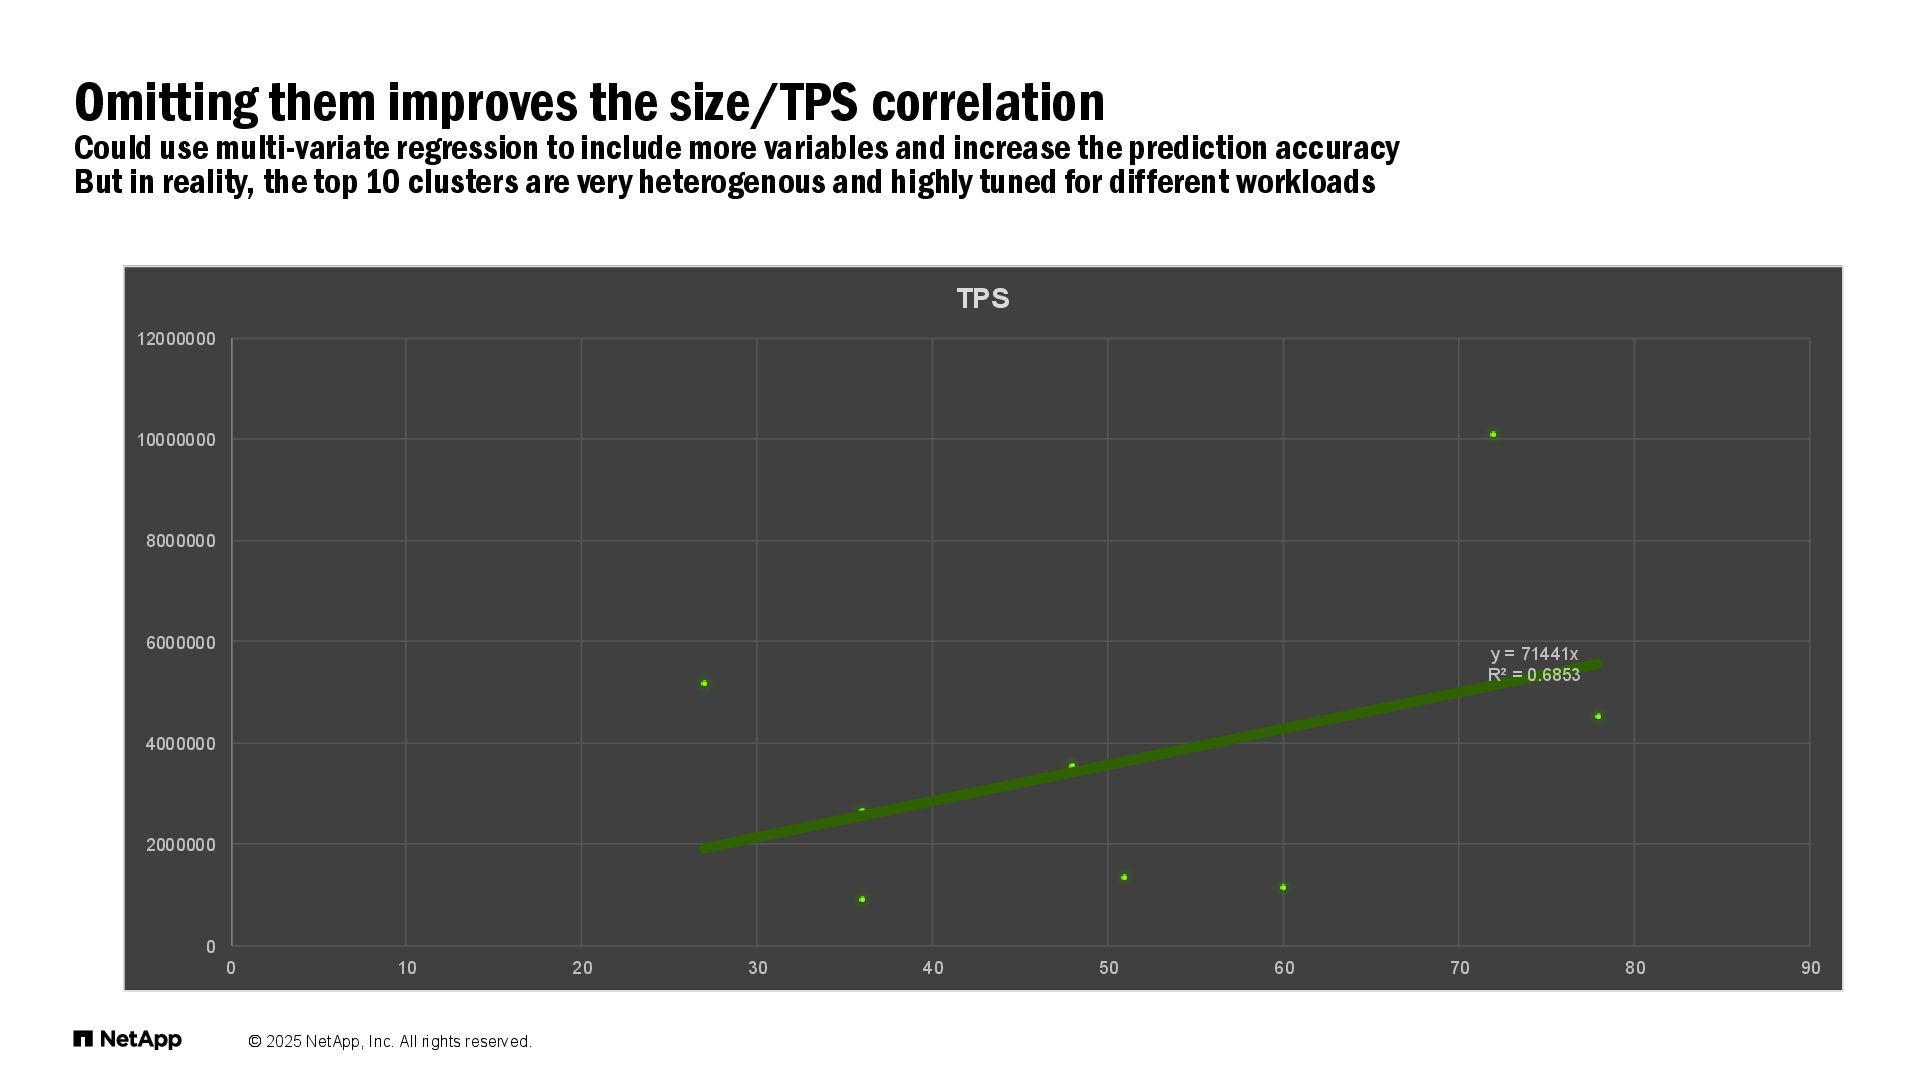
  24. © 2025 NetApp, Inc. All rights reserved. Omitting them improves

    the size/TPS correlation Could use multi-variate regression to include more variables and increase the prediction accuracy But in reality, the top 10 clusters are very heterogenous and highly tuned for different workloads y = 71441x R² = 0.6853 0 2000000 4000000 6000000 8000000 10000000 12000000 0 10 20 30 40 50 60 70 80 90 TPS
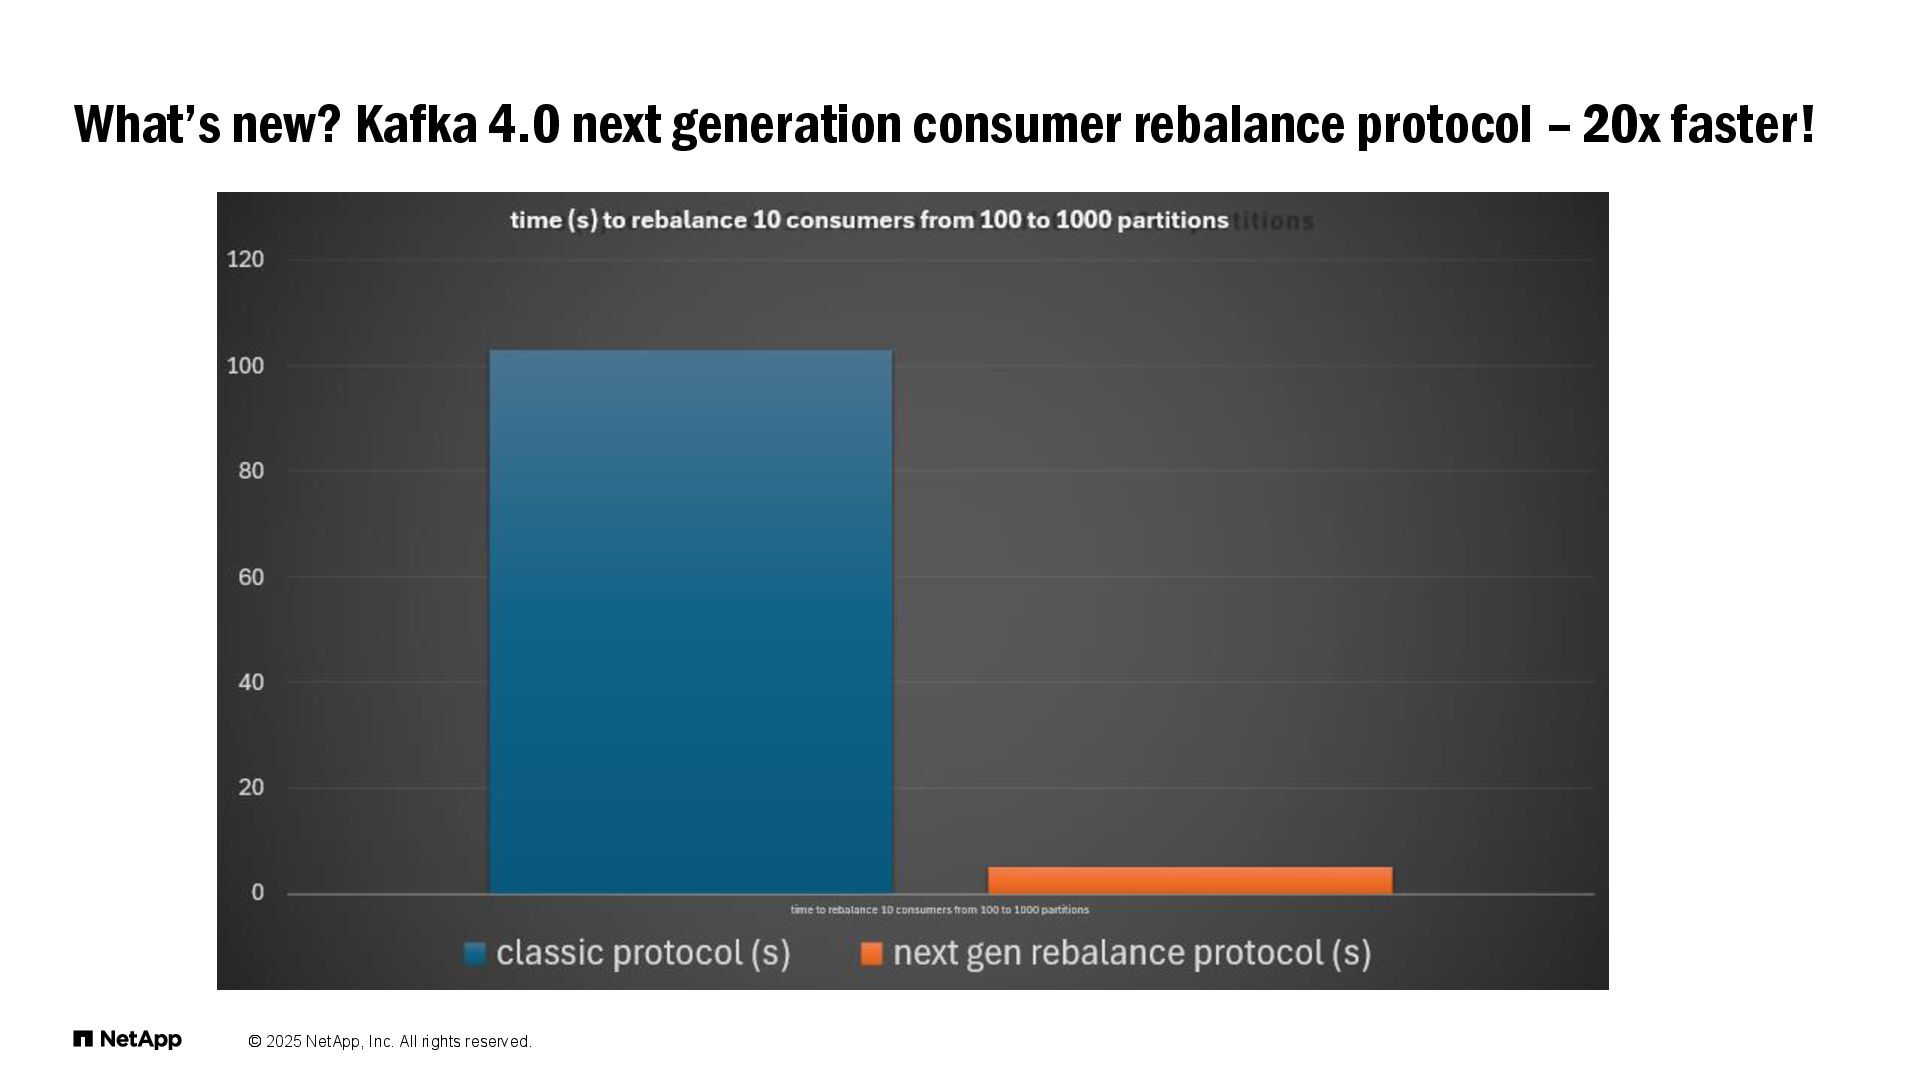
  25. © 2025 NetApp, Inc. All rights reserved. What’s new? Kafka

    4.0 next generation consumer rebalance protocol – 20x faster!
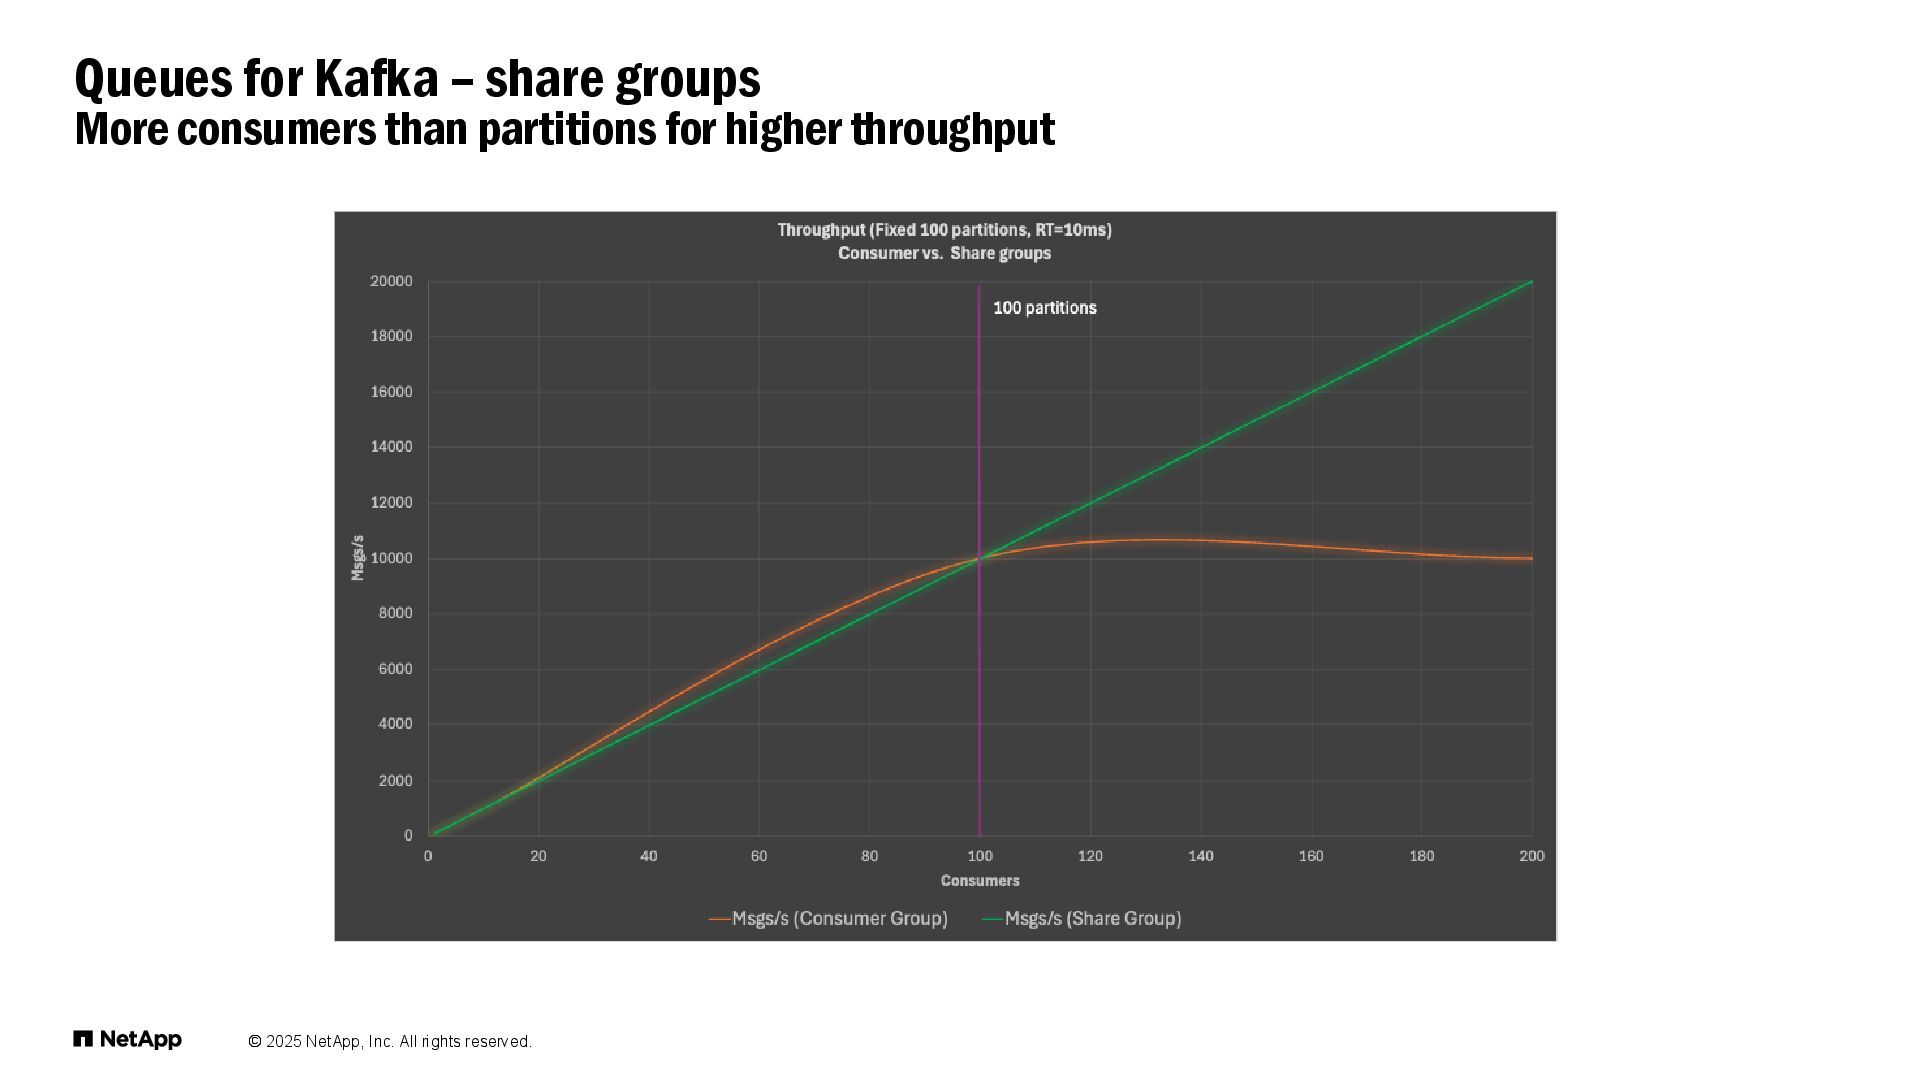
  26. © 2025 NetApp, Inc. All rights reserved. Queues for Kafka

    – share groups More consumers than partitions for higher throughput
  27. © 2025 NetApp, Inc. All rights reserved. Process 1 record

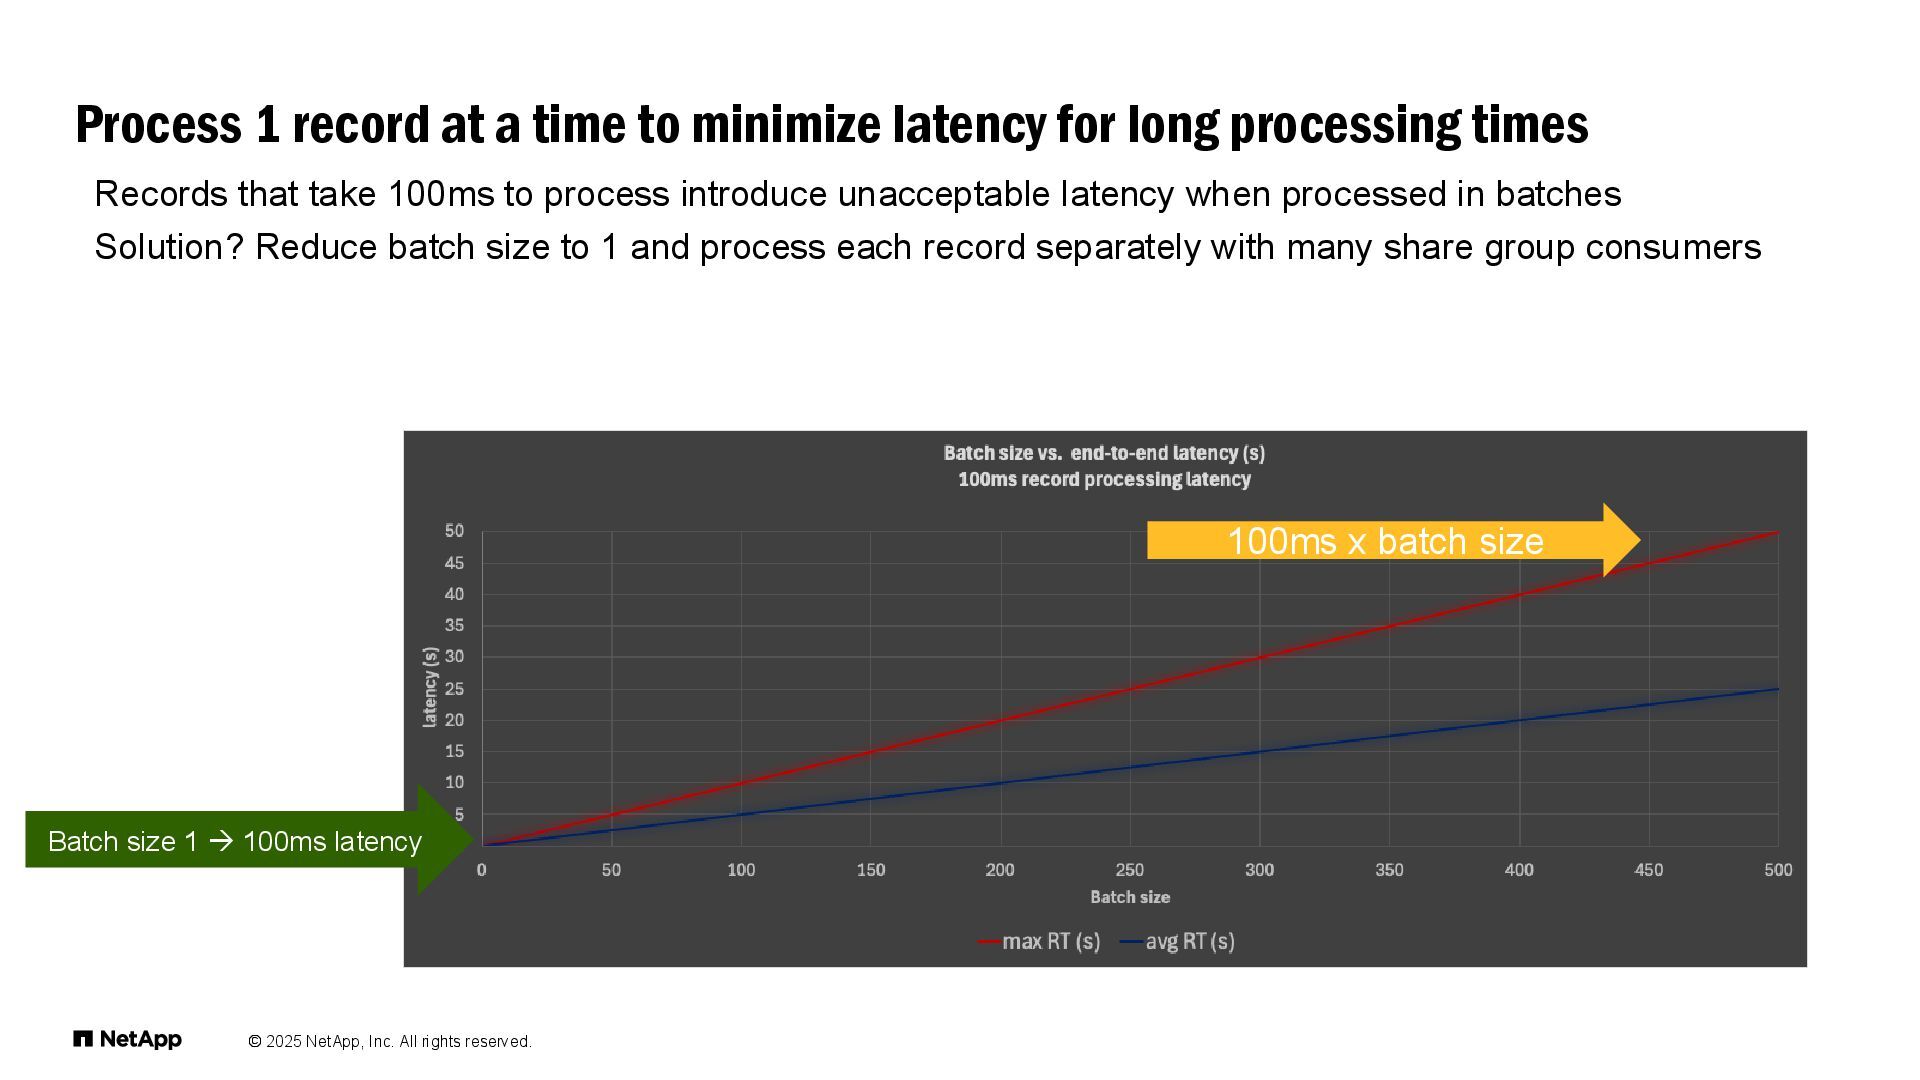
    at a time to minimize latency for long processing times Records that take 100ms to process introduce unacceptable latency when processed in batches Solution? Reduce batch size to 1 and process each record separately with many share group consumers Batch size 1 → 100ms latency 100ms x batch size
  28. © 2025 NetApp, Inc. All rights reserved. Performance regression from

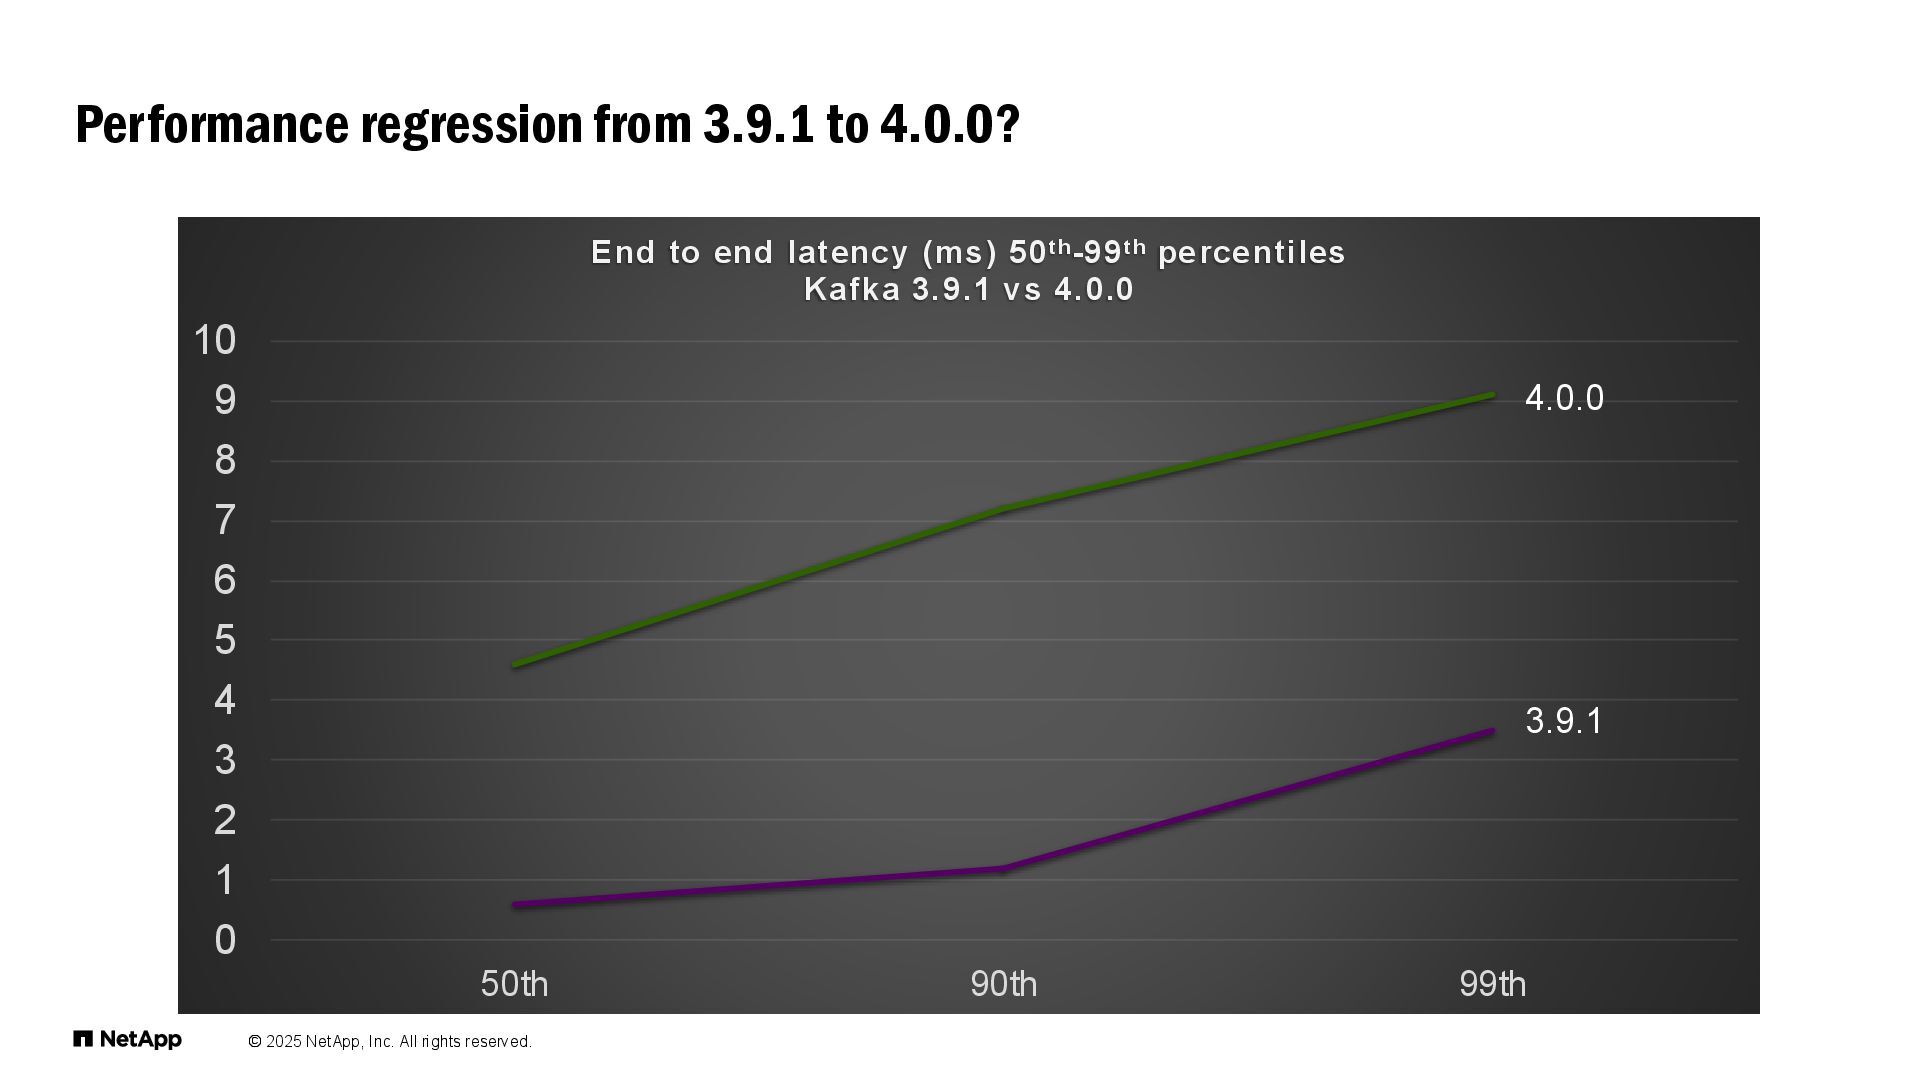
    3.9.1 to 4.0.0? 0 1 2 3 4 5 6 7 8 9 10 50th 90th 99th End to end latency (ms) 50th-99th percentiles Kafka 3.9.1 vs 4.0.0 4.0.0 3.9.1
  29. © 2025 NetApp, Inc. All rights reserved. • 5 to

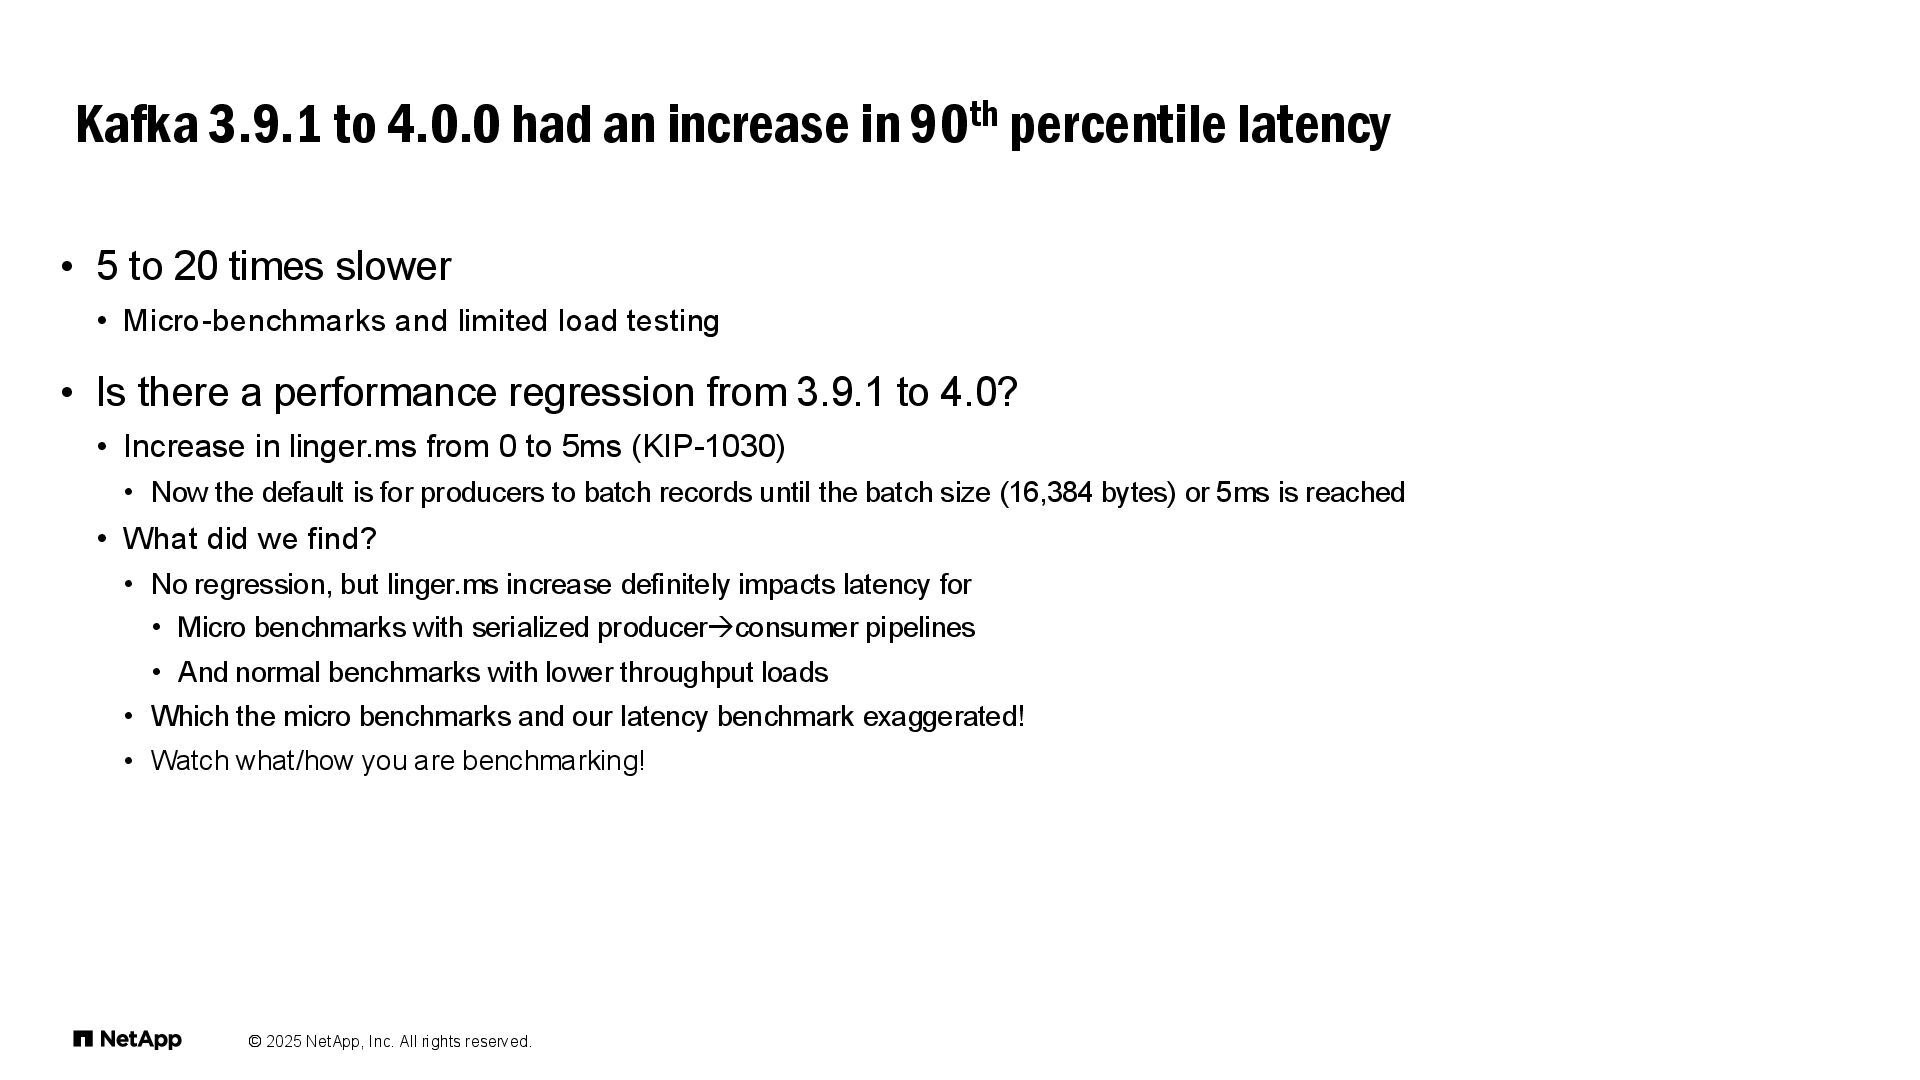
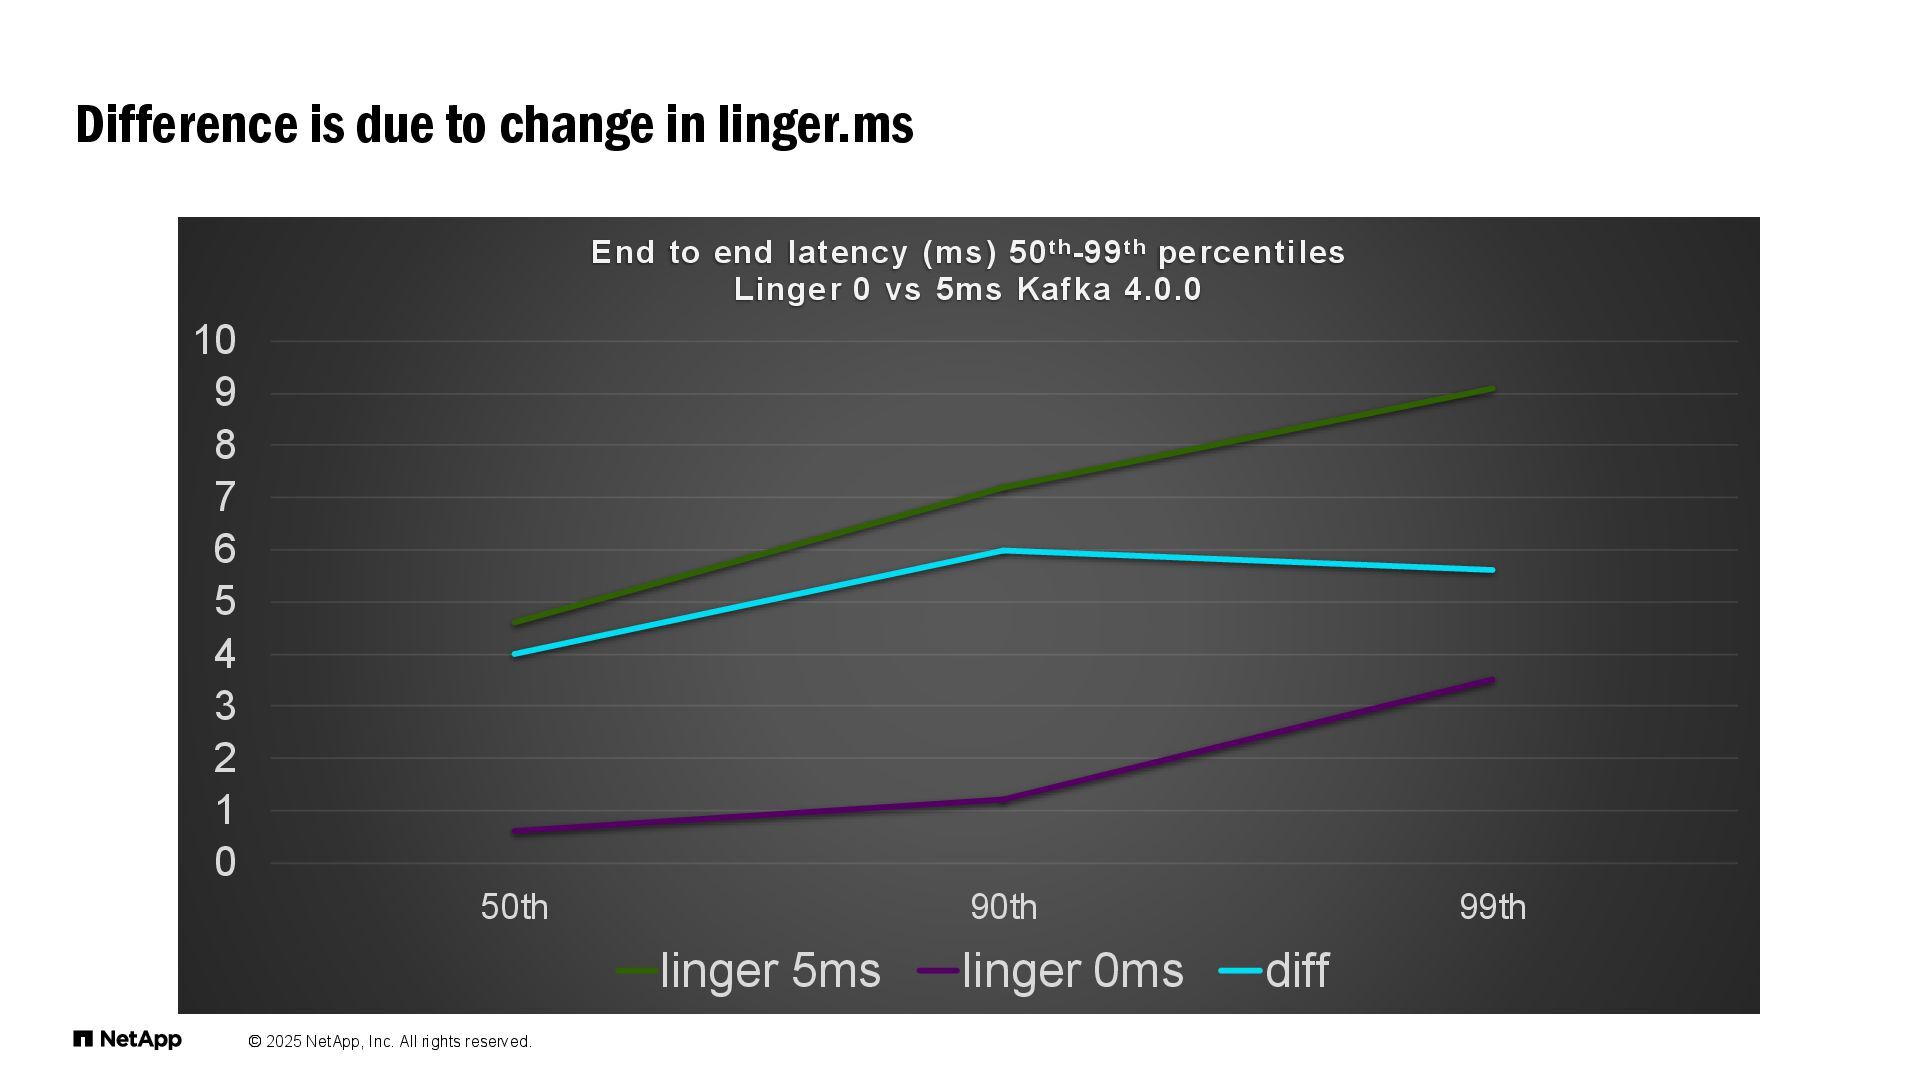
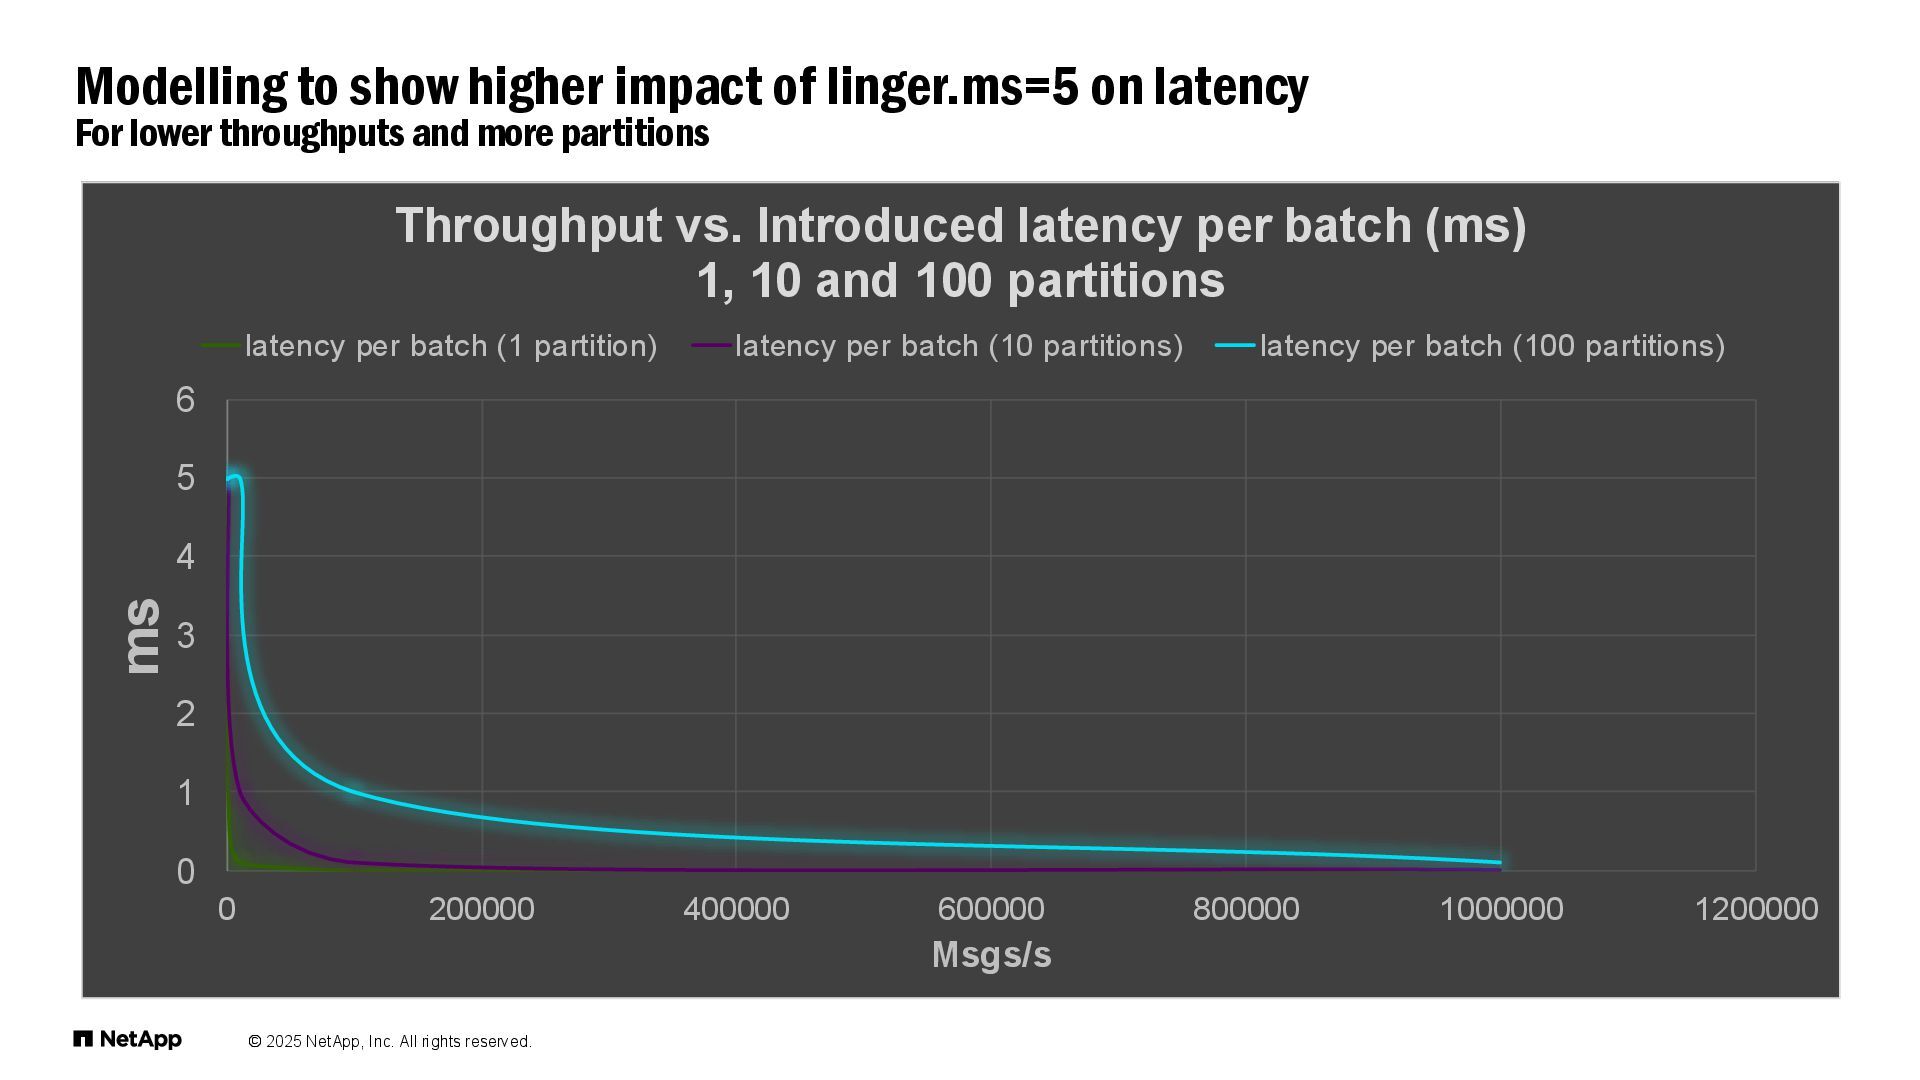
    20 times slower • Micro-benchmarks and limited load testing • Is there a performance regression from 3.9.1 to 4.0? • Increase in linger.ms from 0 to 5ms (KIP-1030) • Now the default is for producers to batch records until the batch size (16,384 bytes) or 5ms is reached • What did we find? • No regression, but linger.ms increase definitely impacts latency for • Micro benchmarks with serialized producer→consumer pipelines • And normal benchmarks with lower throughput loads • Which the micro benchmarks and our latency benchmark exaggerated! • Watch what/how you are benchmarking! Kafka 3.9.1 to 4.0.0 had an increase in 90th percentile latency
  30. © 2025 NetApp, Inc. All rights reserved. Difference is due

    to change in linger.ms 0 1 2 3 4 5 6 7 8 9 10 50th 90th 99th End to end latency (ms) 50th-99th percentiles Linger 0 vs 5ms Kafka 4.0.0 linger 5ms linger 0ms diff
  31. © 2025 NetApp, Inc. All rights reserved. Modelling to show

    higher impact of linger.ms=5 on latency For lower throughputs and more partitions 0 1 2 3 4 5 6 0 200000 400000 600000 800000 1000000 1200000 ms Msgs/s Throughput vs. Introduced latency per batch (ms) 1, 10 and 100 partitions latency per batch (1 partition) latency per batch (10 partitions) latency per batch (100 partitions)
  32. © 2025 NetApp, Inc. All rights reserved. • Terra Locus

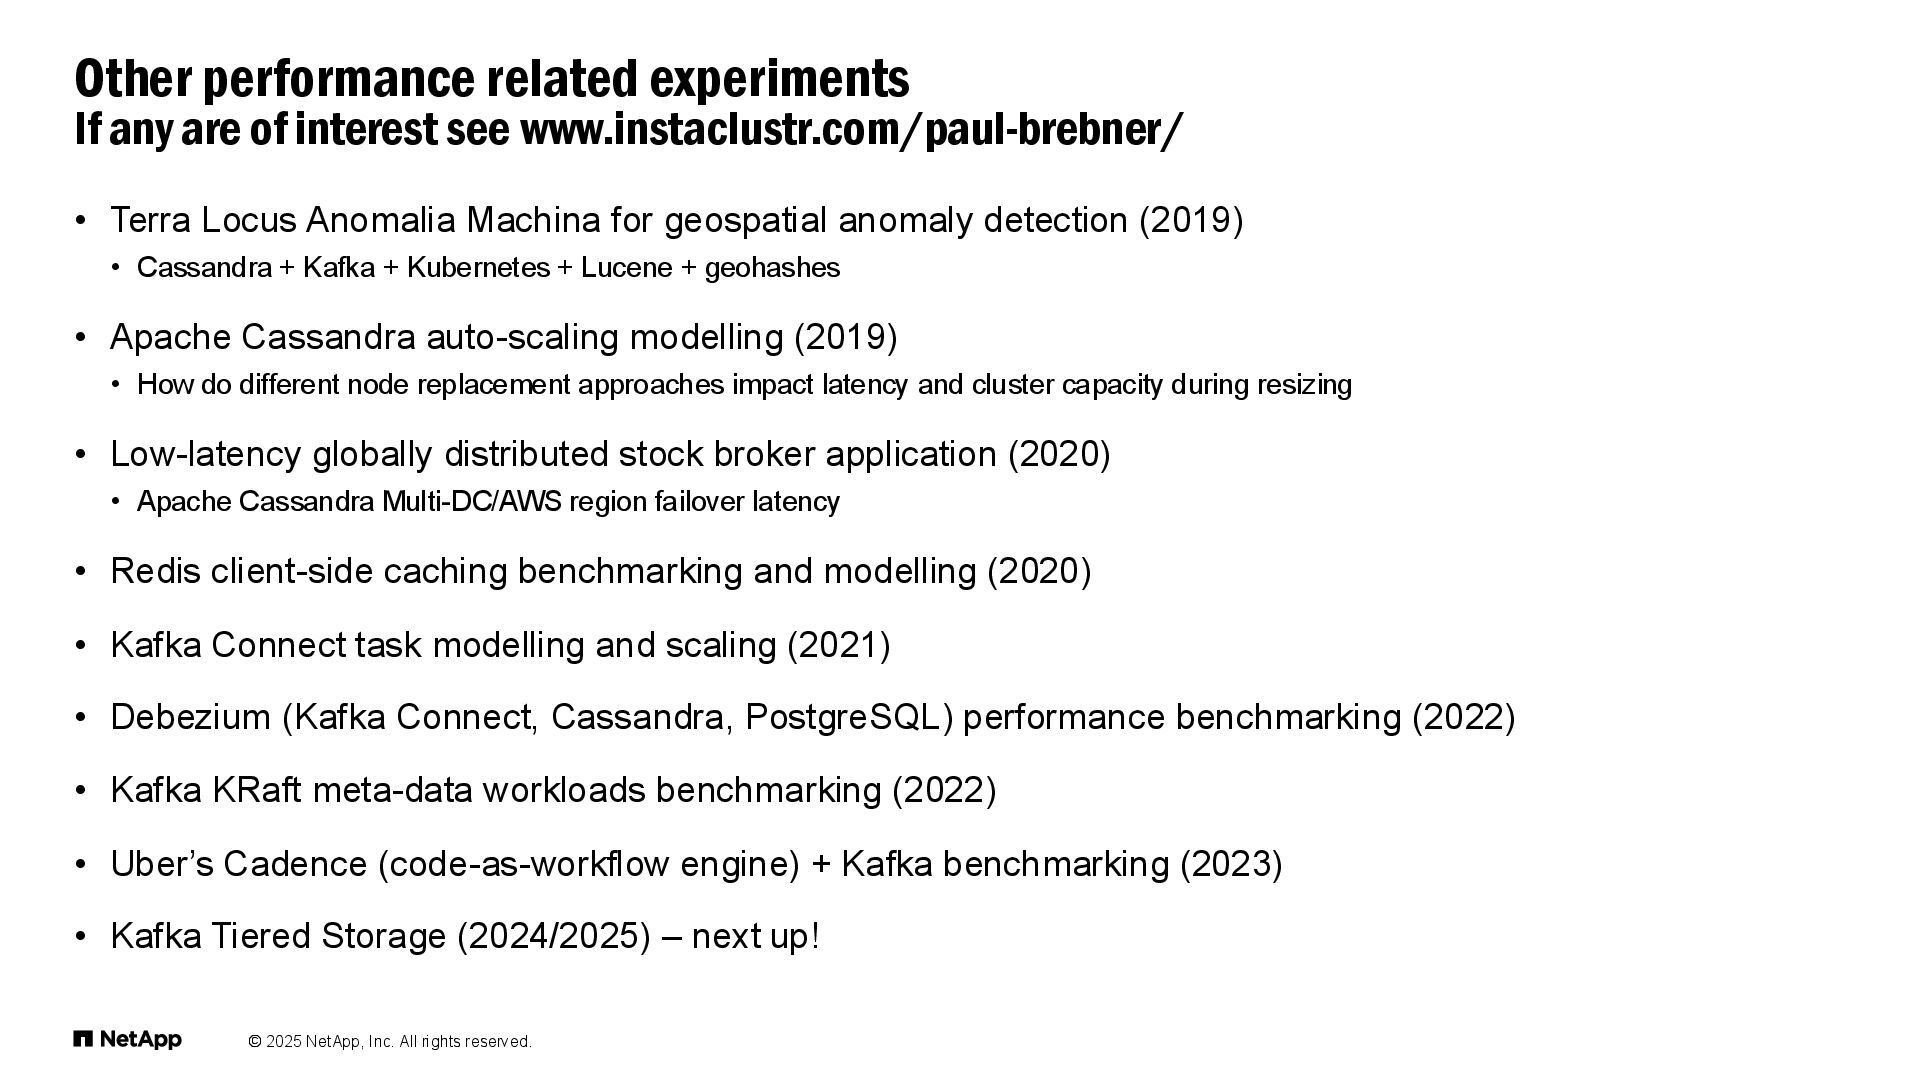
    Anomalia Machina for geospatial anomaly detection (2019) • Cassandra + Kafka + Kubernetes + Lucene + geohashes • Apache Cassandra auto-scaling modelling (2019) • How do different node replacement approaches impact latency and cluster capacity during resizing • Low-latency globally distributed stock broker application (2020) • Apache Cassandra Multi-DC/AWS region failover latency • Redis client-side caching benchmarking and modelling (2020) • Kafka Connect task modelling and scaling (2021) • Debezium (Kafka Connect, Cassandra, PostgreSQL) performance benchmarking (2022) • Kafka KRaft meta-data workloads benchmarking (2022) • Uber’s Cadence (code-as-workflow engine) + Kafka benchmarking (2023) • Kafka Tiered Storage (2024/2025) – next up! Other performance related experiments If any are of interest see www.instaclustr.com/paul-brebner/
  33. KAFKA TIERED STORAGE © 2025 NetApp, Inc. All rights reserved.

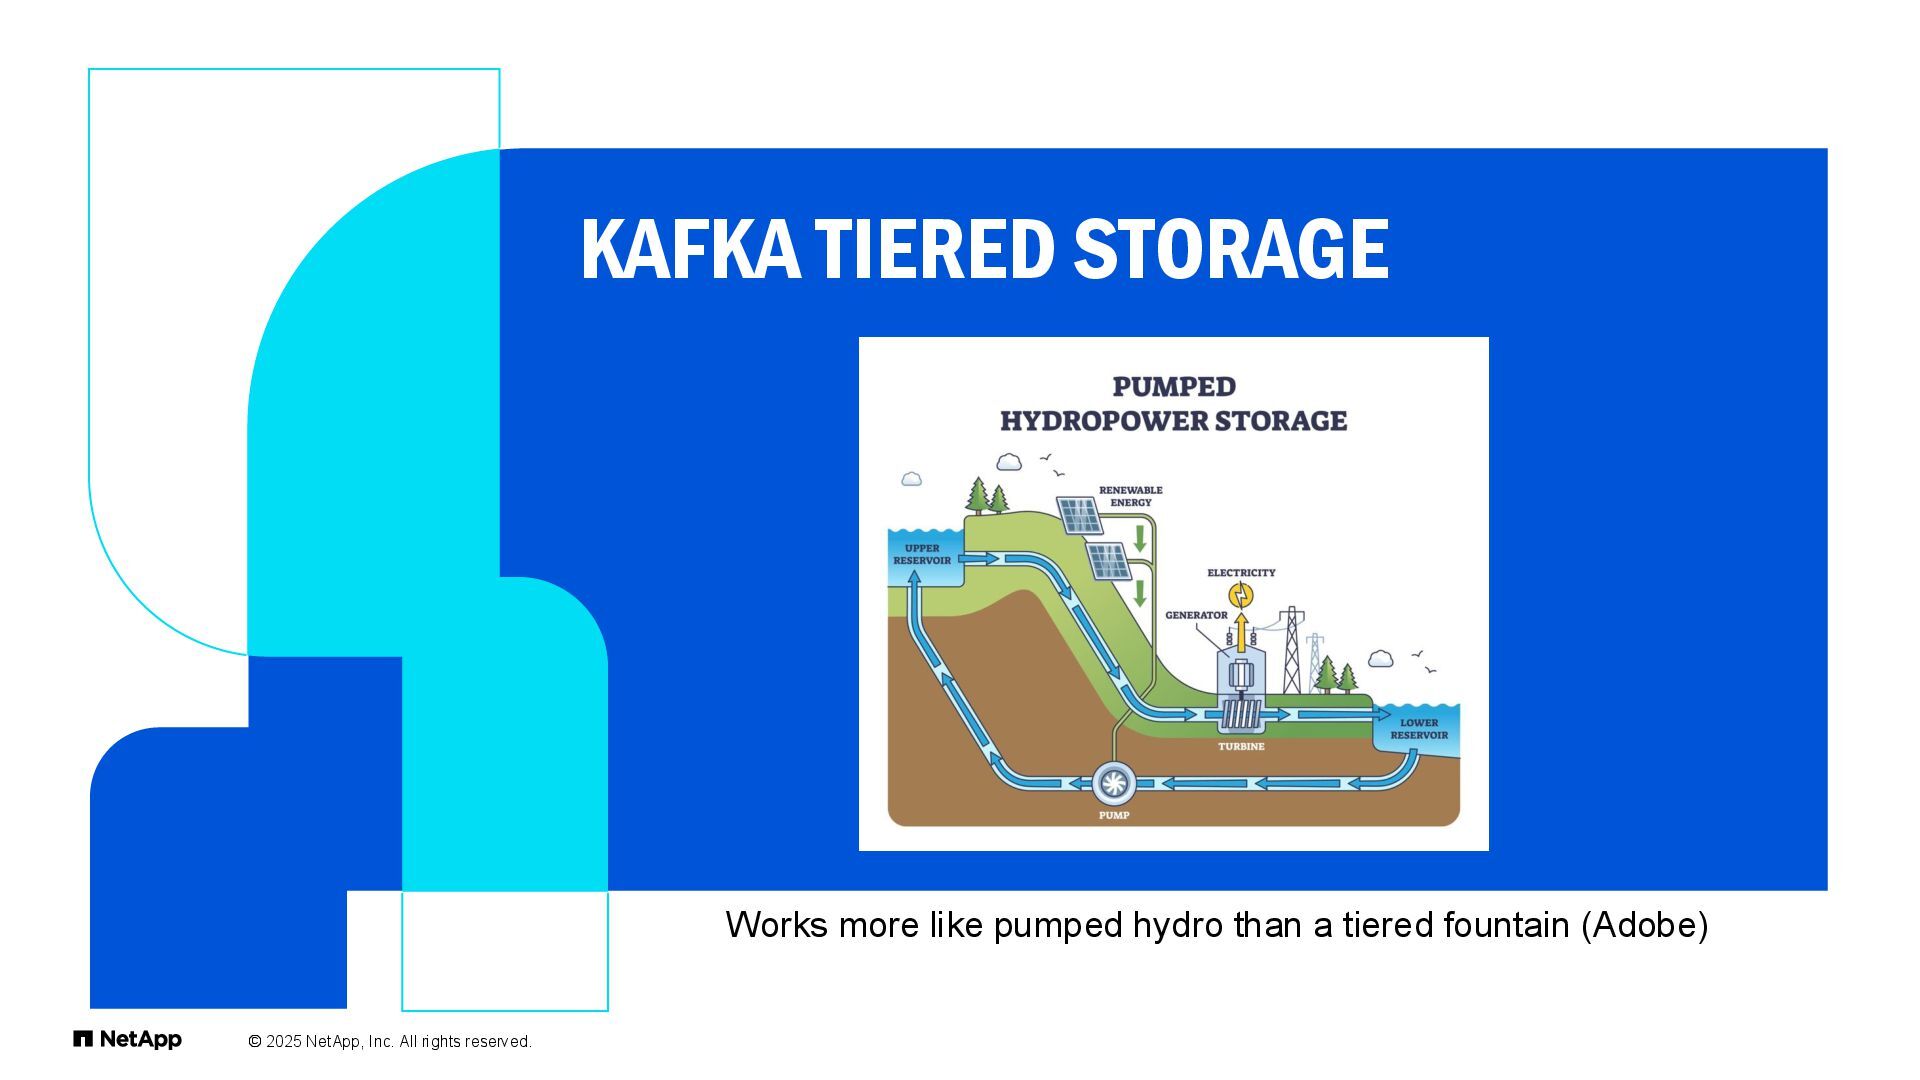
    Works more like pumped hydro than a tiered fountain (Adobe)
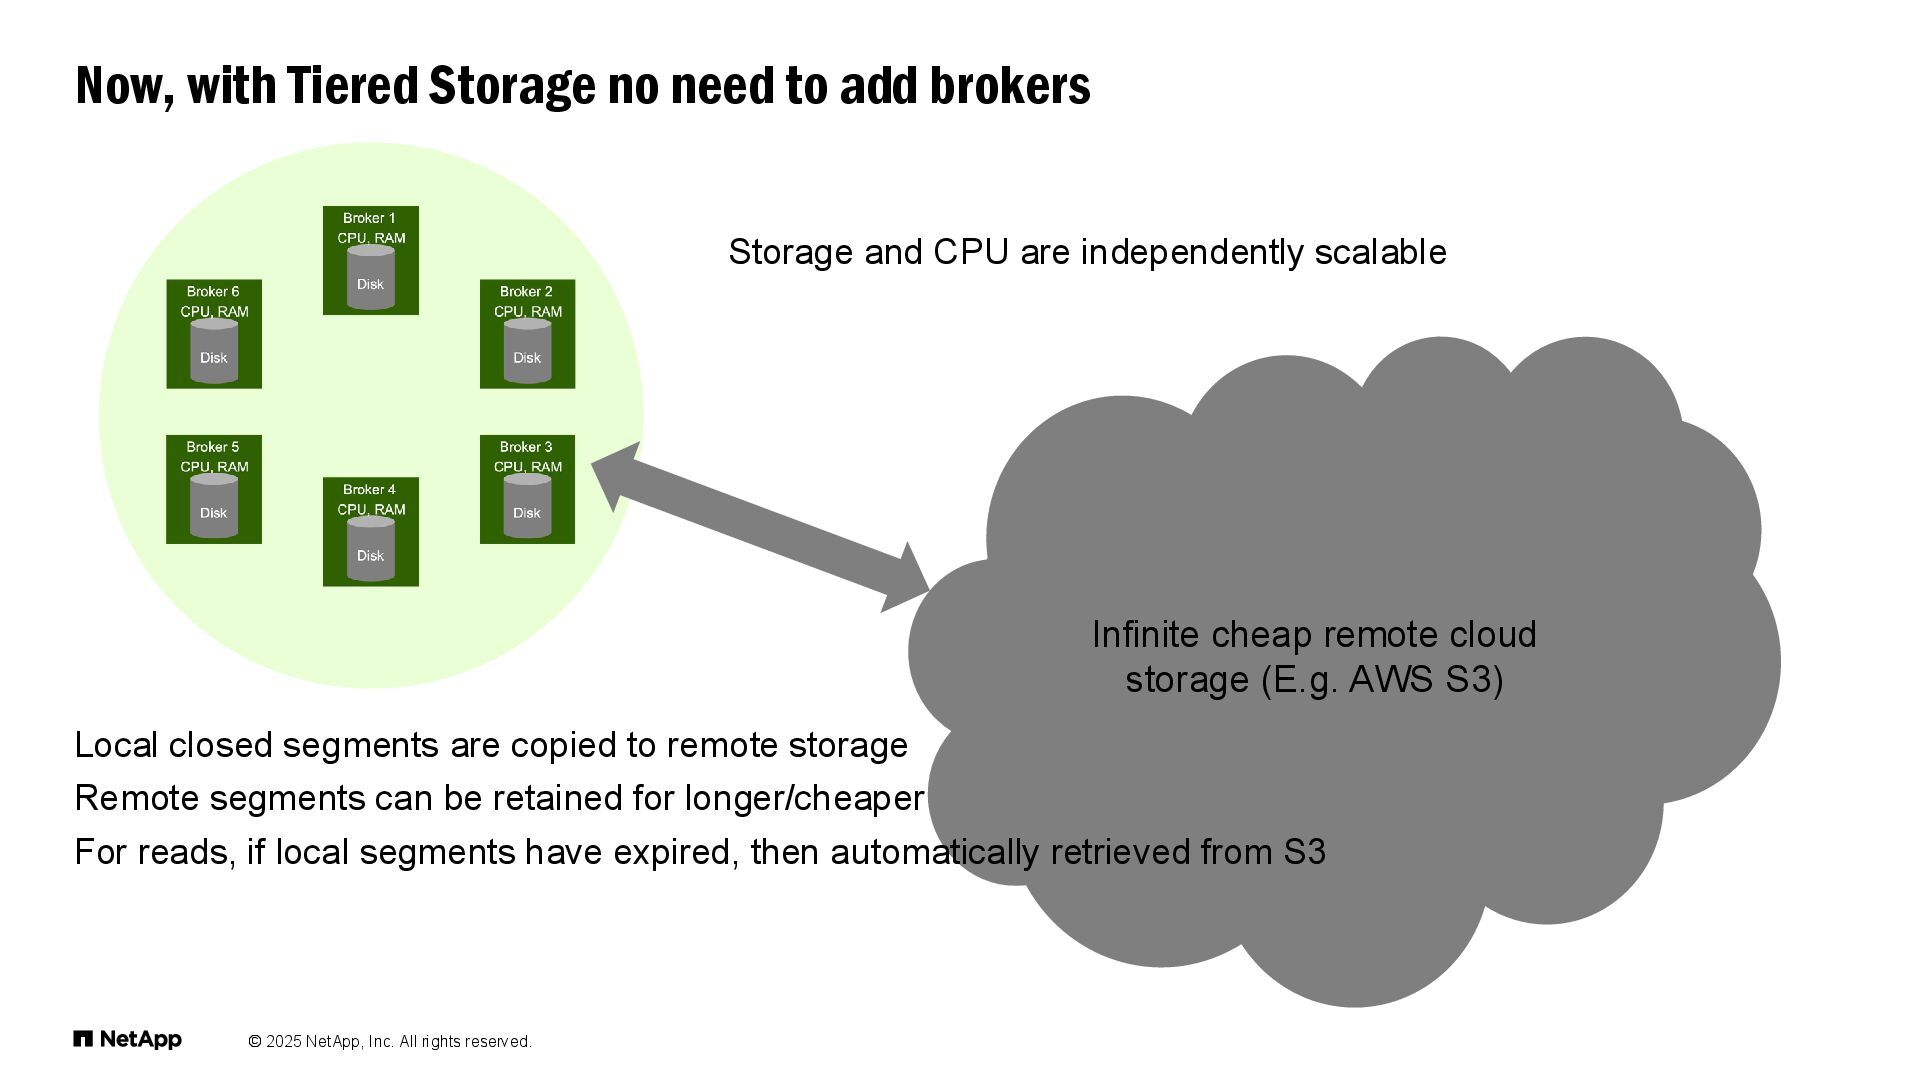
  34. © 2025 NetApp, Inc. All rights reserved. Previously, to increase

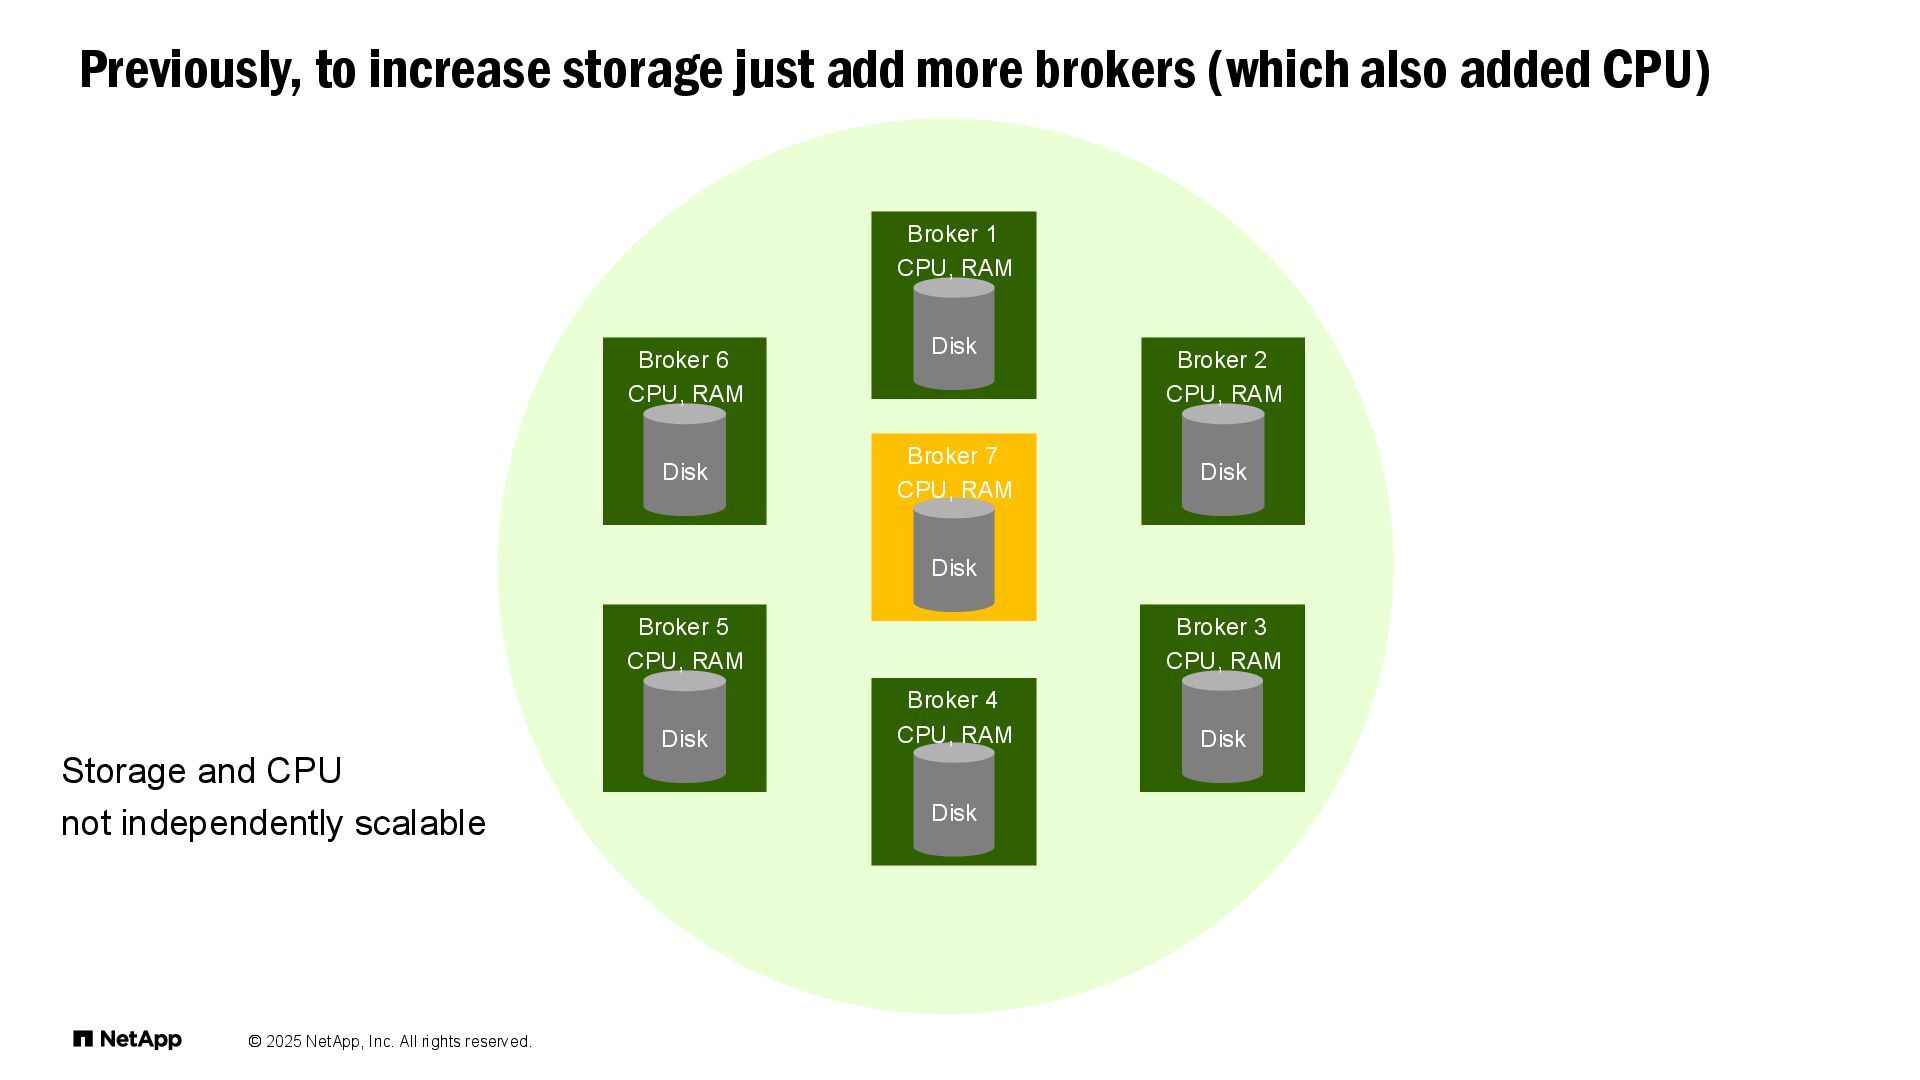
    storage just add more brokers (which also added CPU) Broker 6 CPU, RAM Disk Broker 1 CPU, RAM Disk Broker 2 CPU, RAM Disk Broker 5 CPU, RAM Disk Broker 3 CPU, RAM Disk Broker 4 CPU, RAM Disk Broker 7 CPU, RAM Disk Storage and CPU not independently scalable
  35. © 2025 NetApp, Inc. All rights reserved. Now, with Tiered

    Storage no need to add brokers Infinite cheap remote cloud storage (E.g. AWS S3) Local closed segments are copied to remote storage Remote segments can be retained for longer/cheaper For reads, if local segments have expired, then automatically retrieved from S3 Storage and CPU are independently scalable
  36. © 2025 NetApp, Inc. All rights reserved. • The good

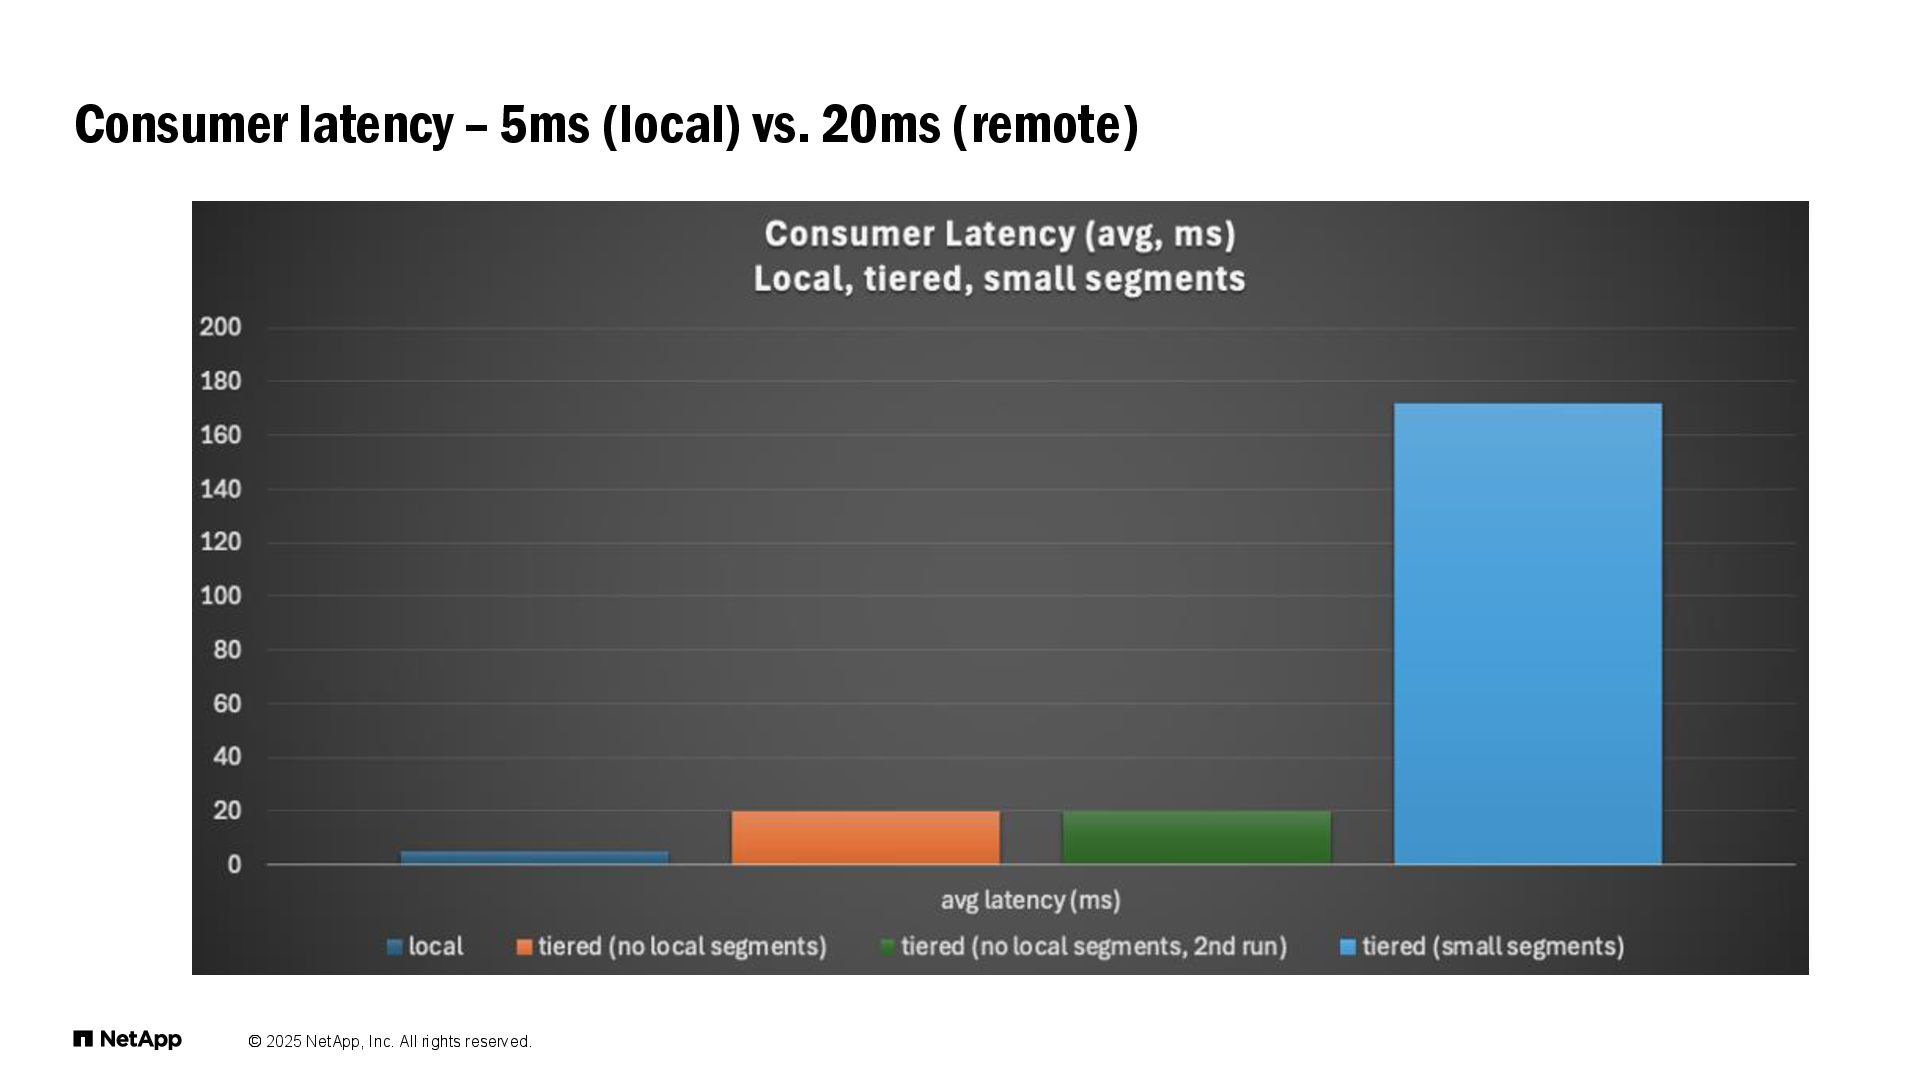
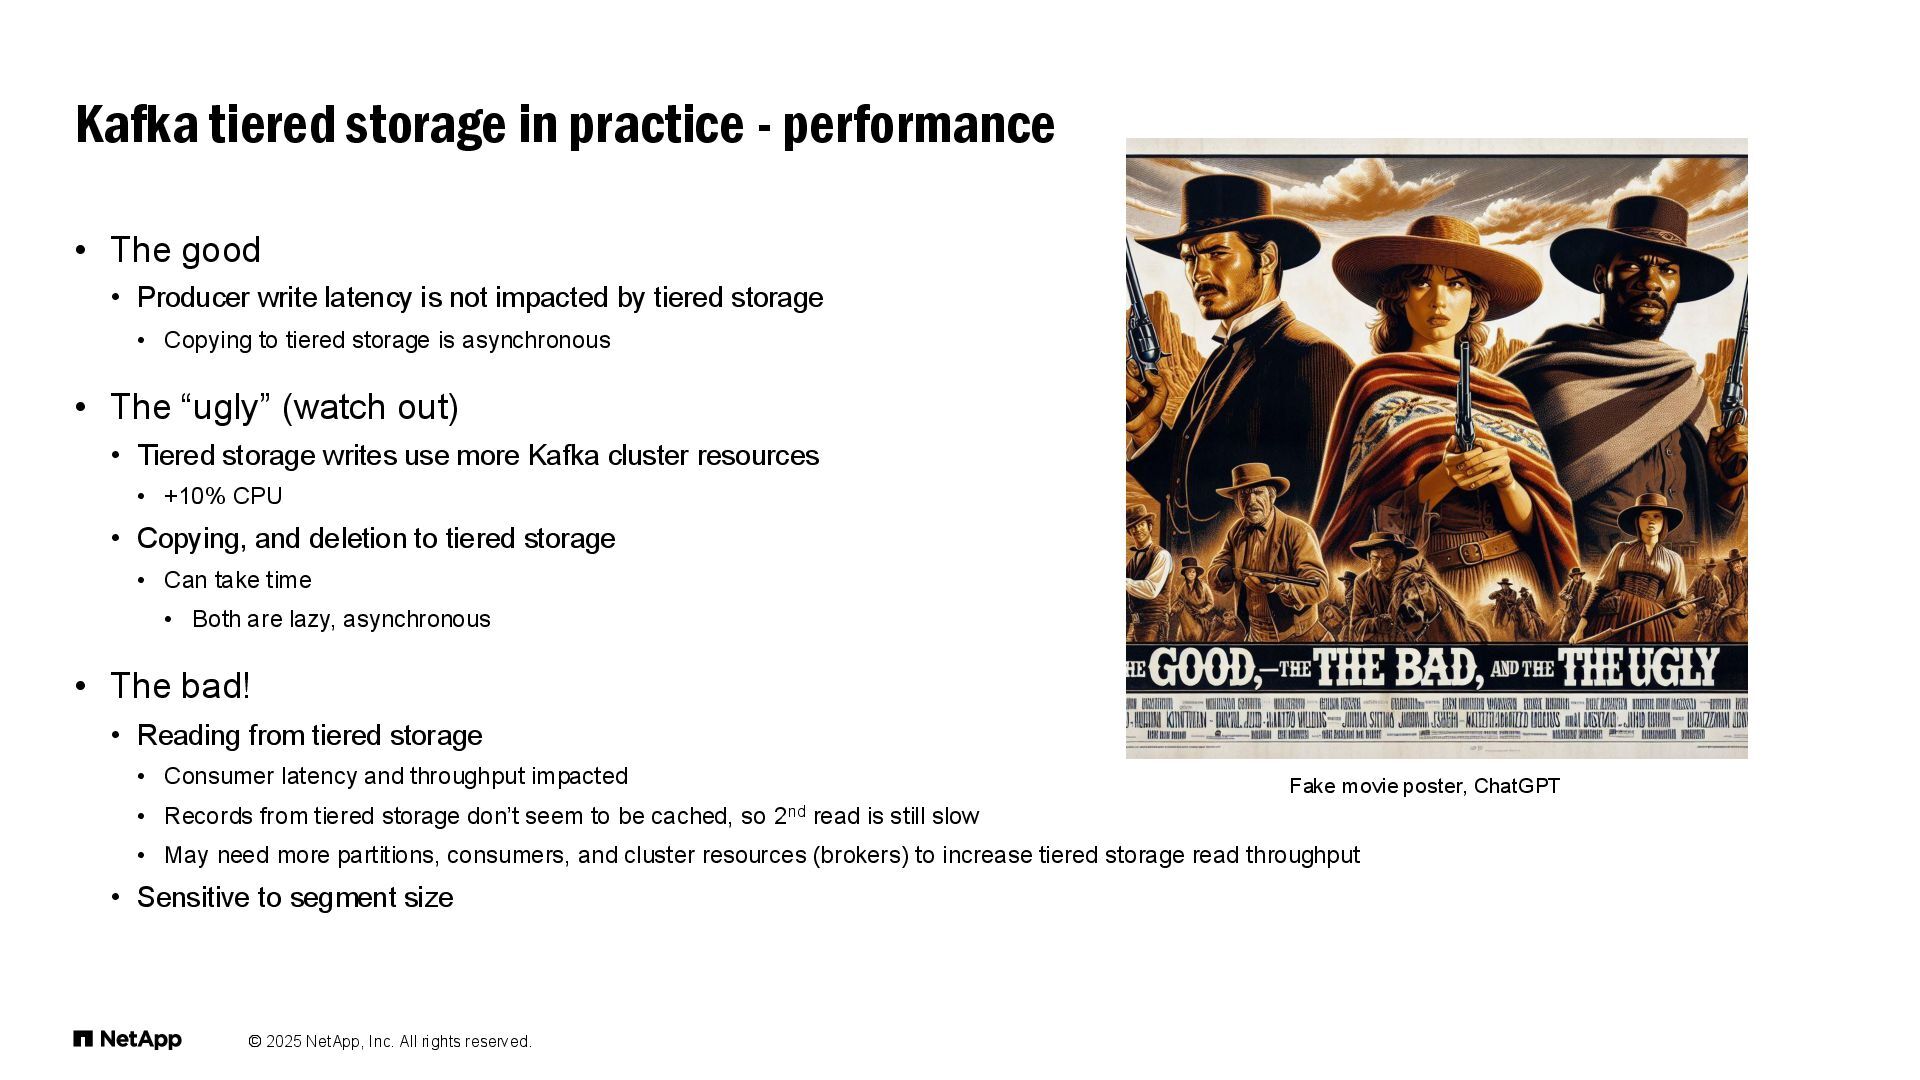
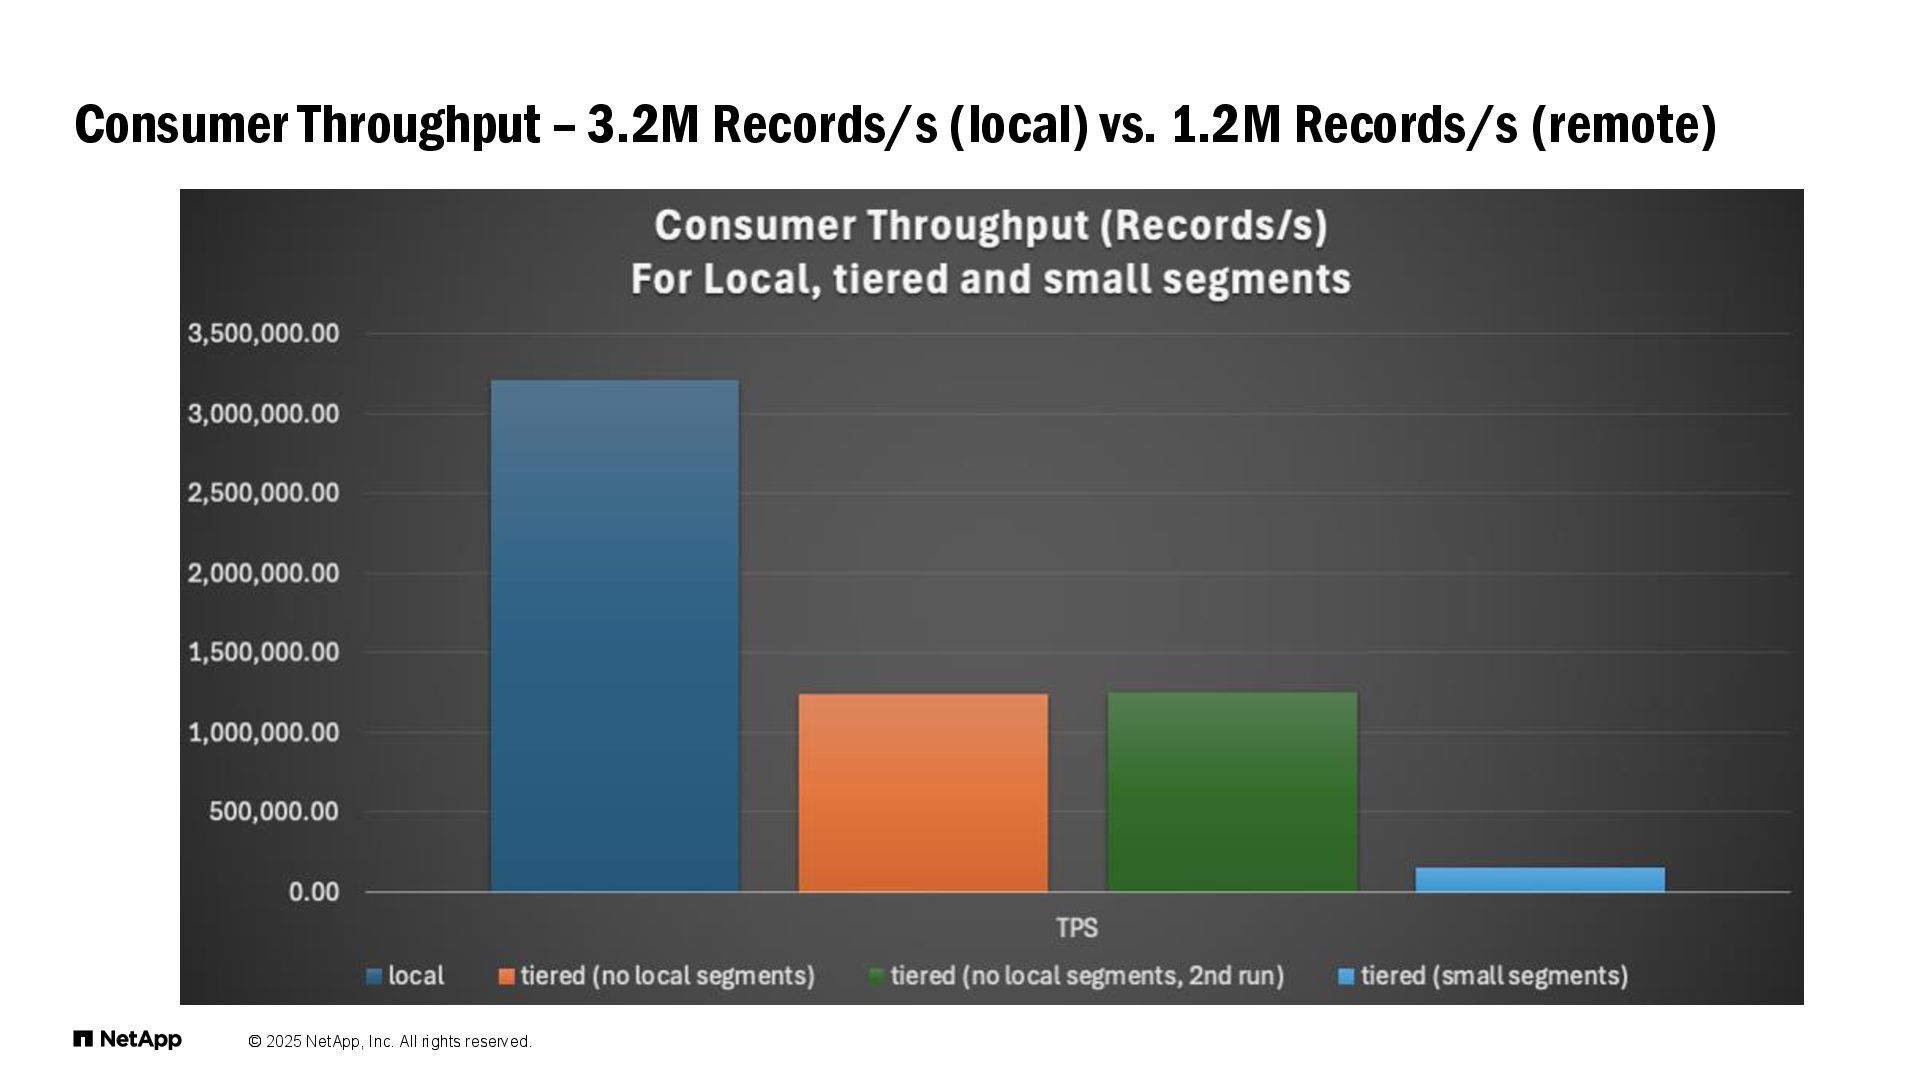
    • Producer write latency is not impacted by tiered storage • Copying to tiered storage is asynchronous • The “ugly” (watch out) • Tiered storage writes use more Kafka cluster resources • +10% CPU • Copying, and deletion to tiered storage • Can take time • Both are lazy, asynchronous • The bad! • Reading from tiered storage • Consumer latency and throughput impacted • Records from tiered storage don’t seem to be cached, so 2nd read is still slow • May need more partitions, consumers, and cluster resources (brokers) to increase tiered storage read throughput • Sensitive to segment size Kafka tiered storage in practice - performance Fake movie poster, ChatGPT
  37. © 2025 NetApp, Inc. All rights reserved. Consumer Throughput –

    3.2M Records/s (local) vs. 1.2M Records/s (remote)
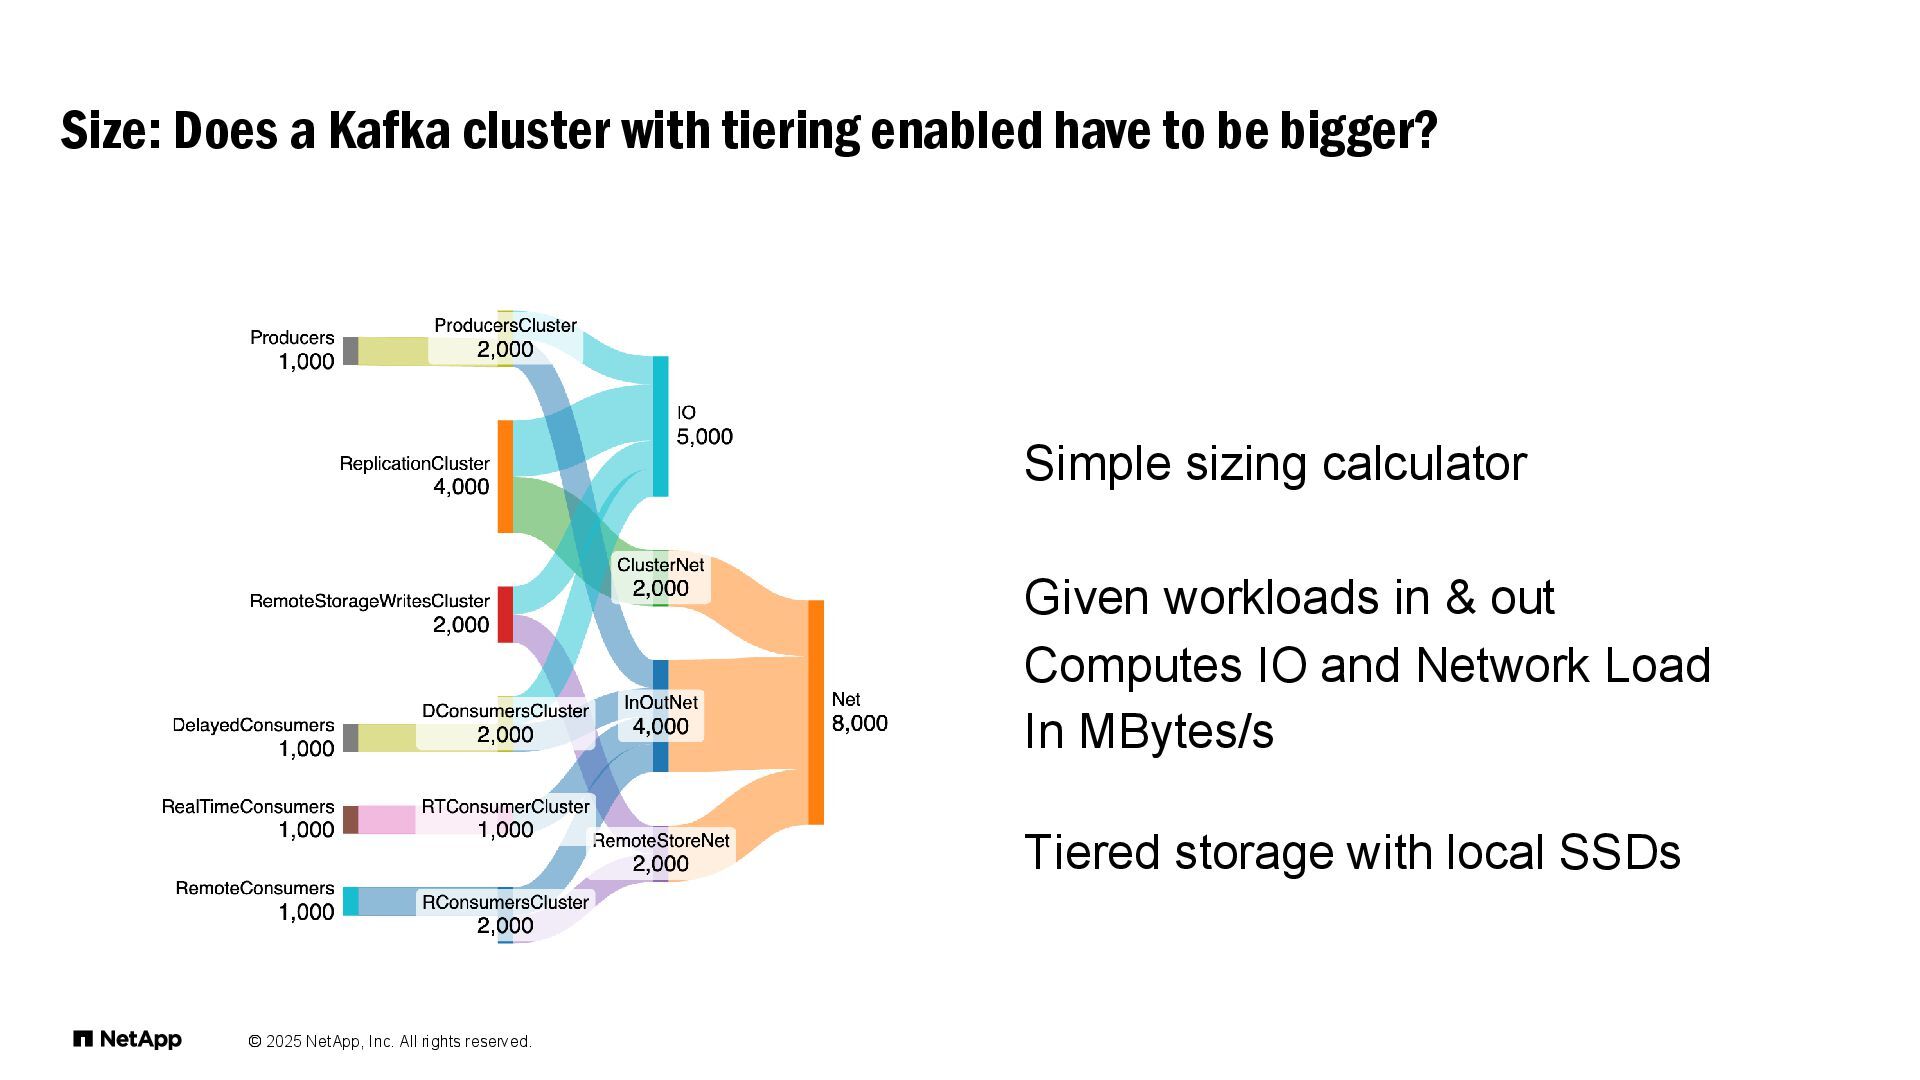
  38. © 2025 NetApp, Inc. All rights reserved. Size: Does a

    Kafka cluster with tiering enabled have to be bigger? Simple sizing calculator Given workloads in & out Computes IO and Network Load In MBytes/s Tiered storage with local SSDs
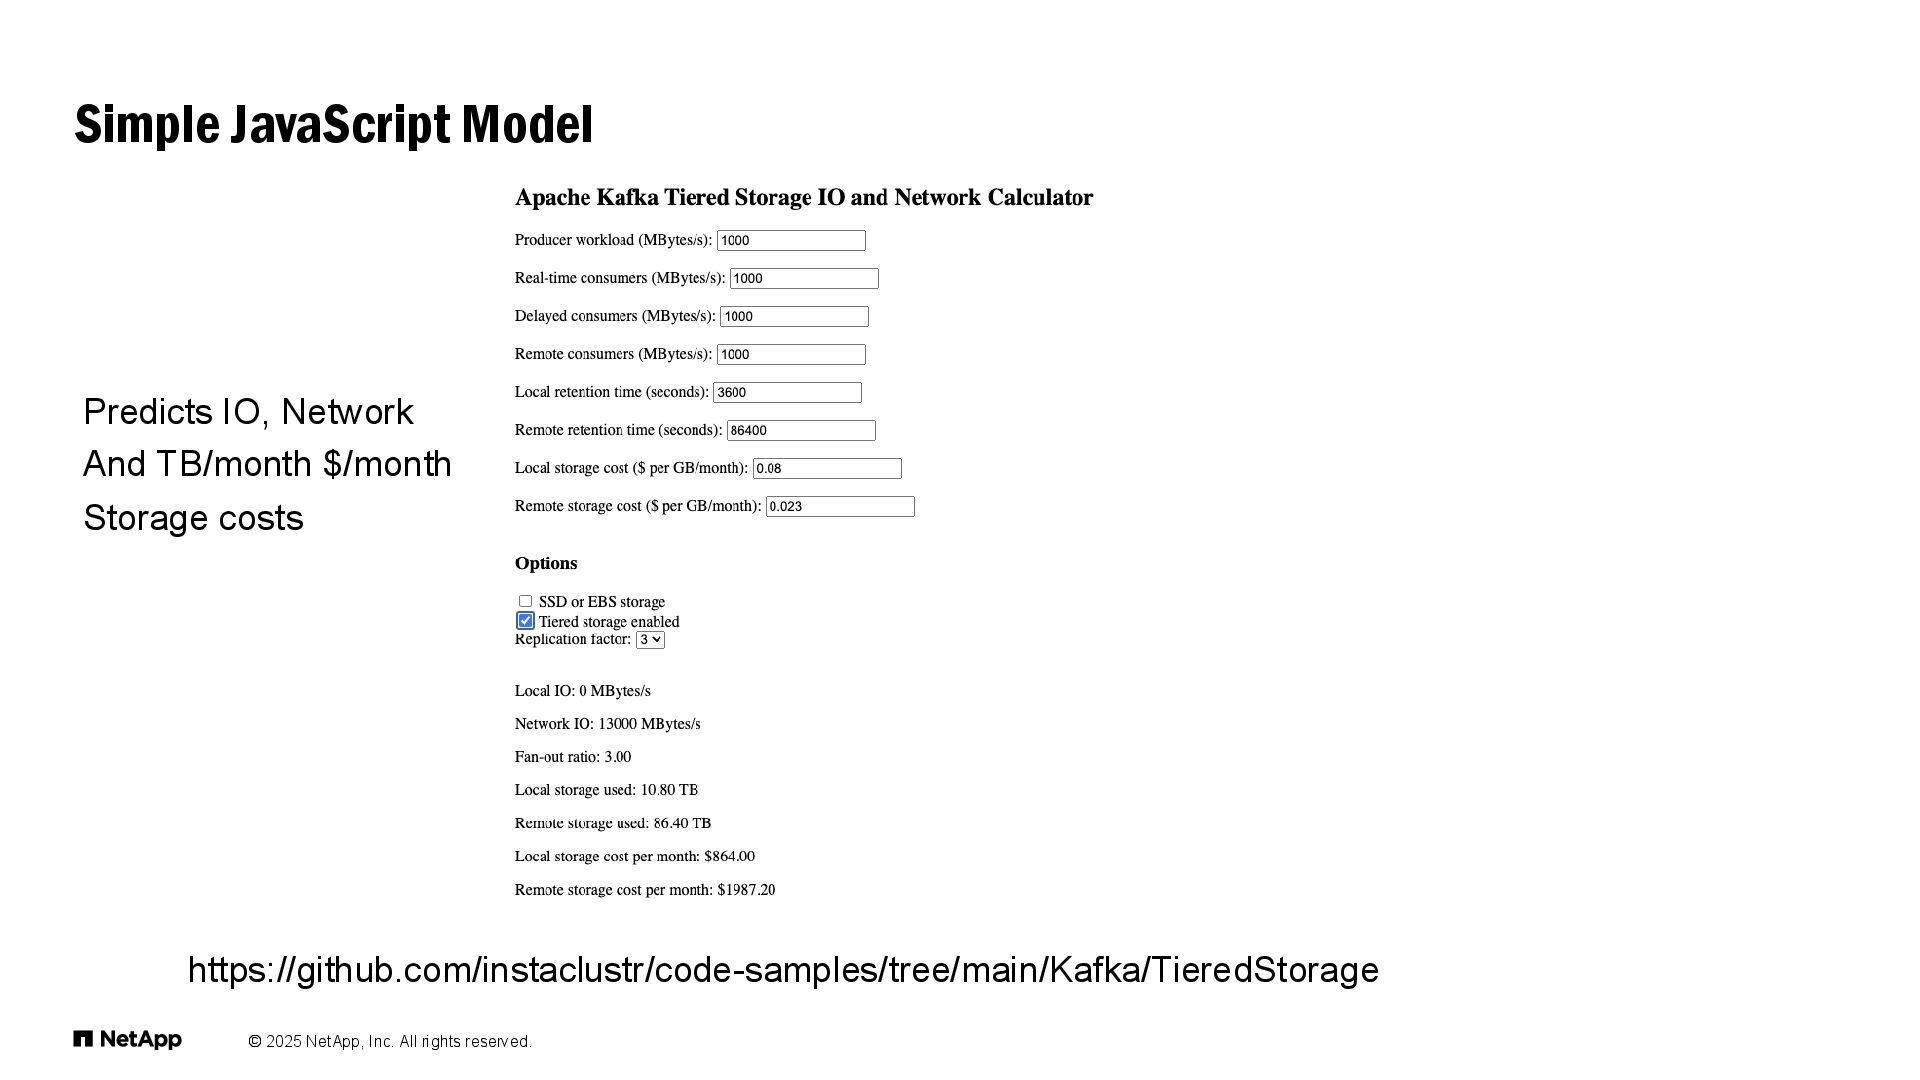
  39. © 2025 NetApp, Inc. All rights reserved. Simple JavaScript Model

    Predicts IO, Network And TB/month $/month Storage costs https://github.com/instaclustr/code-samples/tree/main/Kafka/TieredStorage
  40. © 2025 NetApp, Inc. All rights reserved. Overhead of tiered

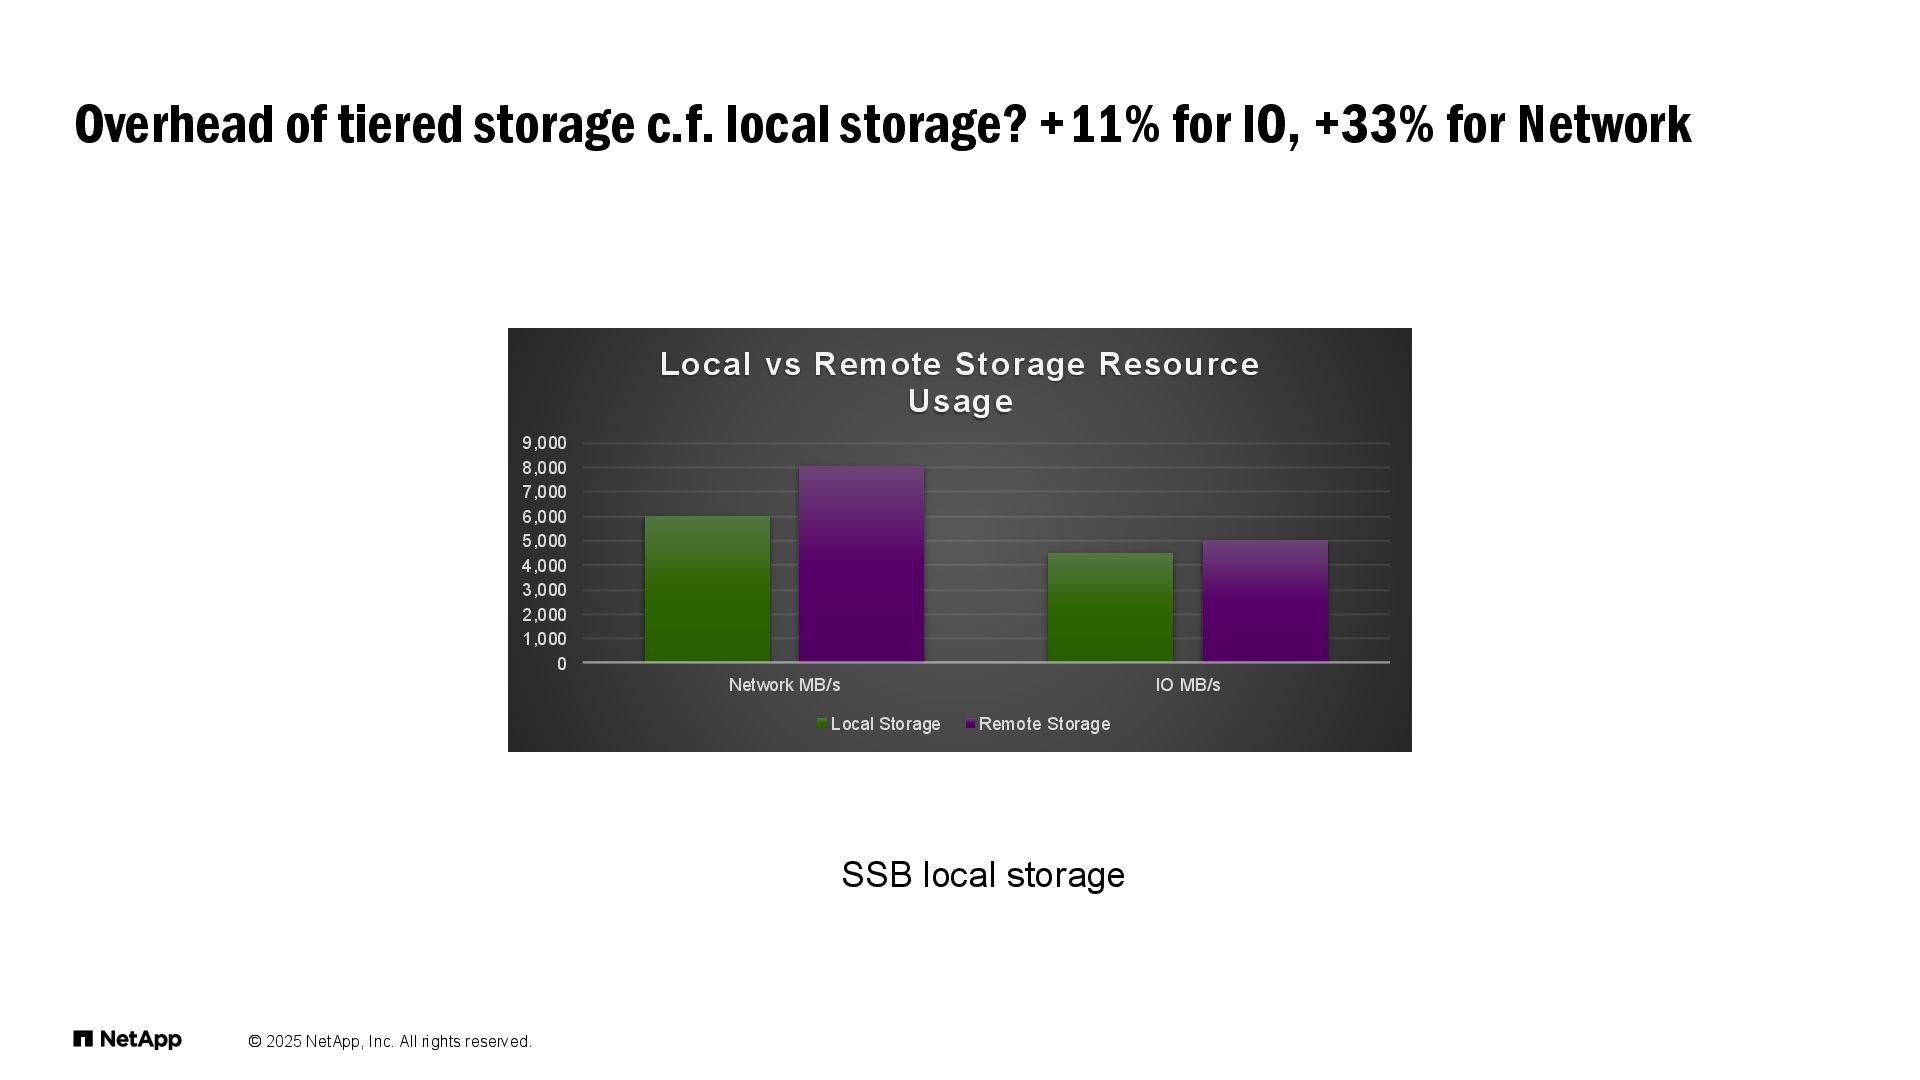
    storage c.f. local storage? +11% for IO, +33% for Network 0 1,000 2,000 3,000 4,000 5,000 6,000 7,000 8,000 9,000 Network MB/s IO MB/s Local vs Remote Storage Resource Usage Local Storage Remote Storage SSB local storage
  41. © 2025 NetApp, Inc. All rights reserved. Include EBS local

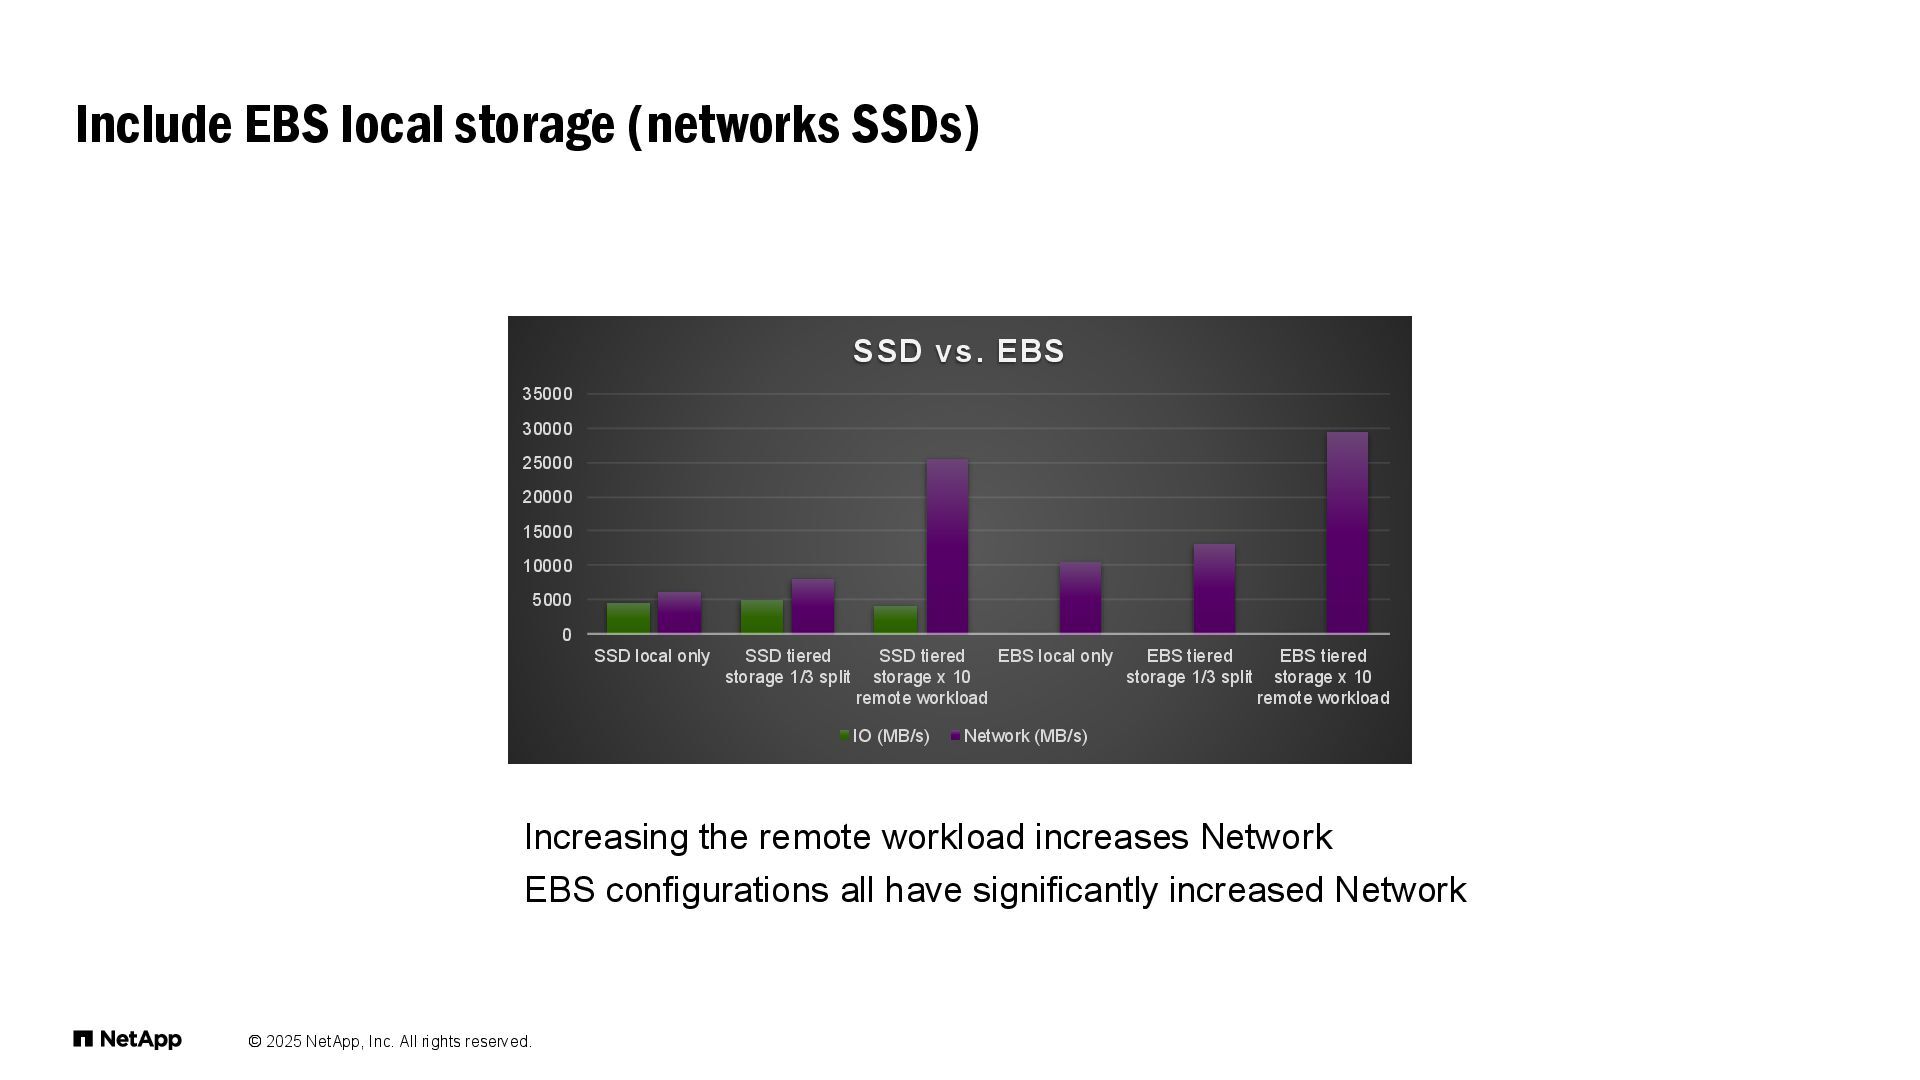
    storage (networks SSDs) 0 5000 10000 15000 20000 25000 30000 35000 SSD local only SSD tiered storage 1/3 split SSD tiered storage x 10 remote workload EBS local only EBS tiered storage 1/3 split EBS tiered storage x 10 remote workload SSD vs. EBS IO (MB/s) Network (MB/s) Increasing the remote workload increases Network EBS configurations all have significantly increased Network
  42. © 2025 NetApp, Inc. All rights reserved. What use is

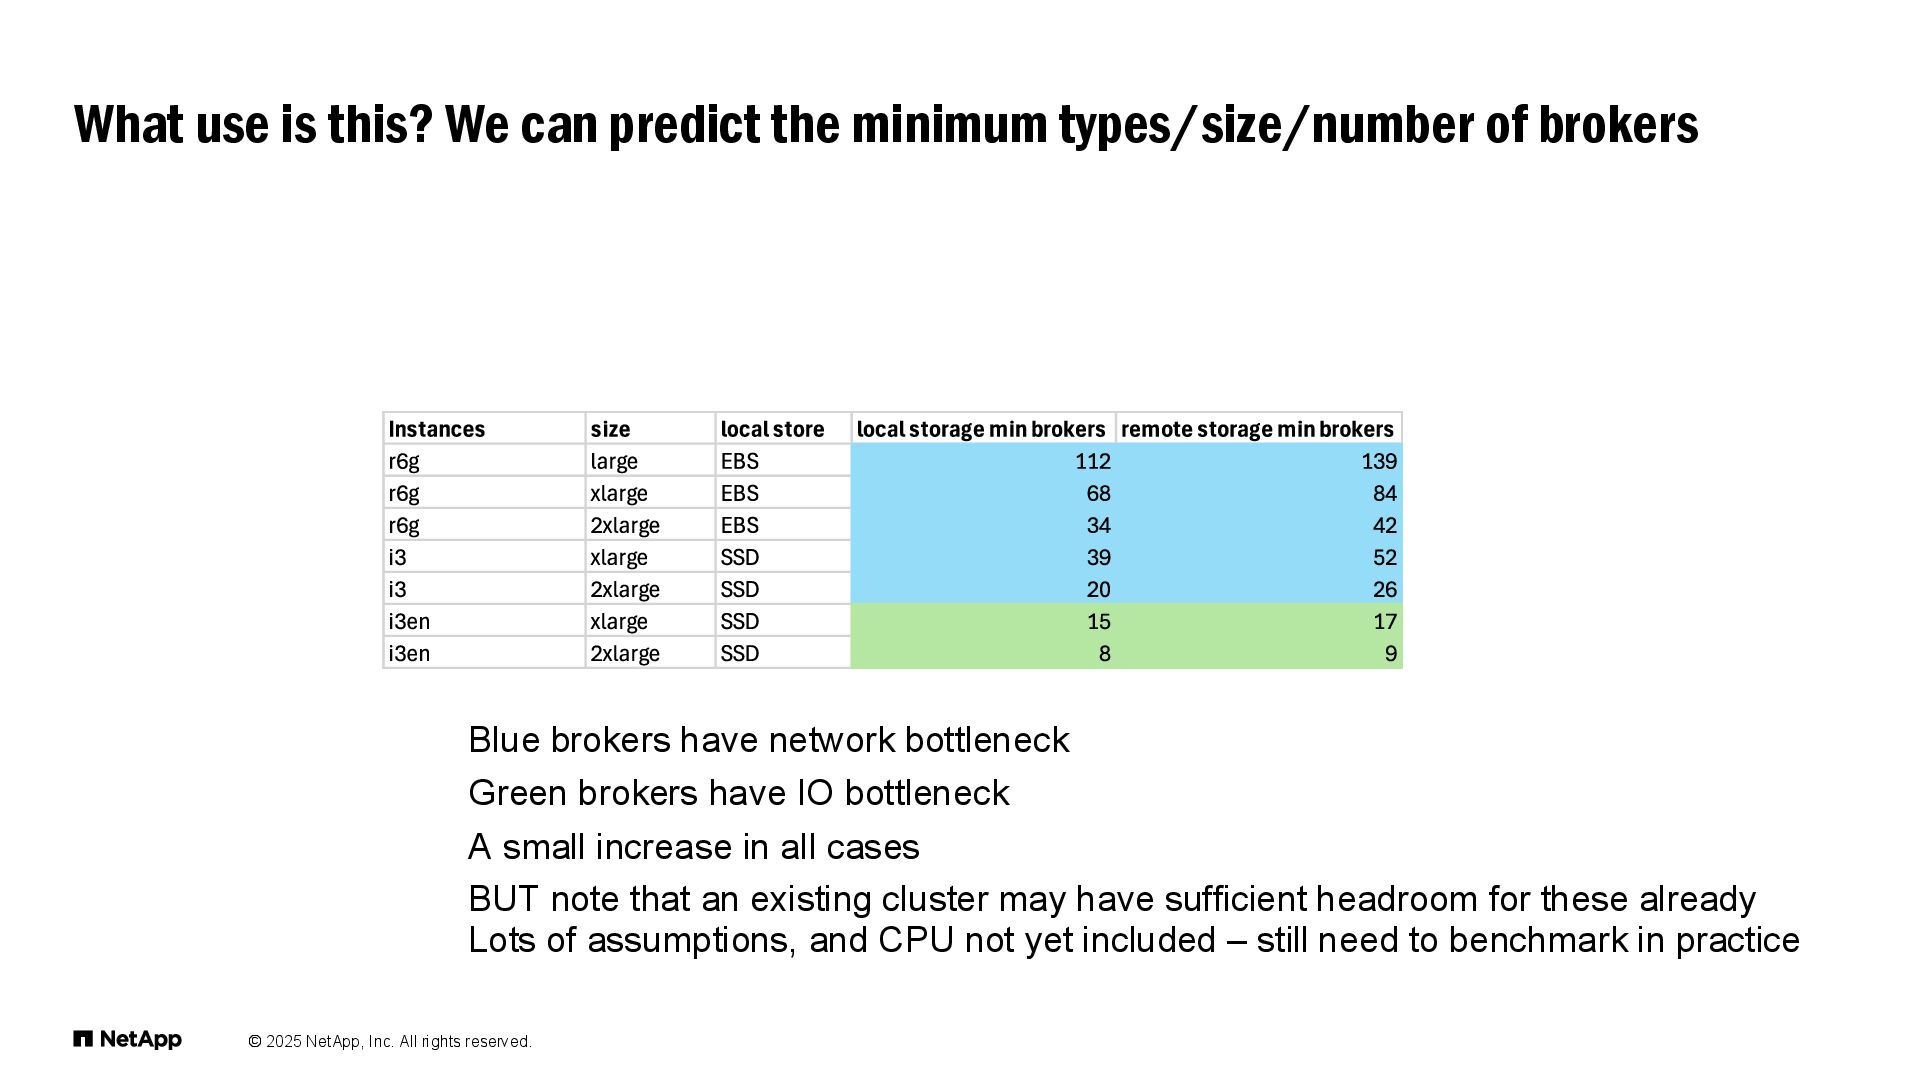
    this? We can predict the minimum types/size/number of brokers Blue brokers have network bottleneck Green brokers have IO bottleneck A small increase in all cases BUT note that an existing cluster may have sufficient headroom for these already Lots of assumptions, and CPU not yet included – still need to benchmark in practice
  43. What don’t we know about Kafka Performance? But could if

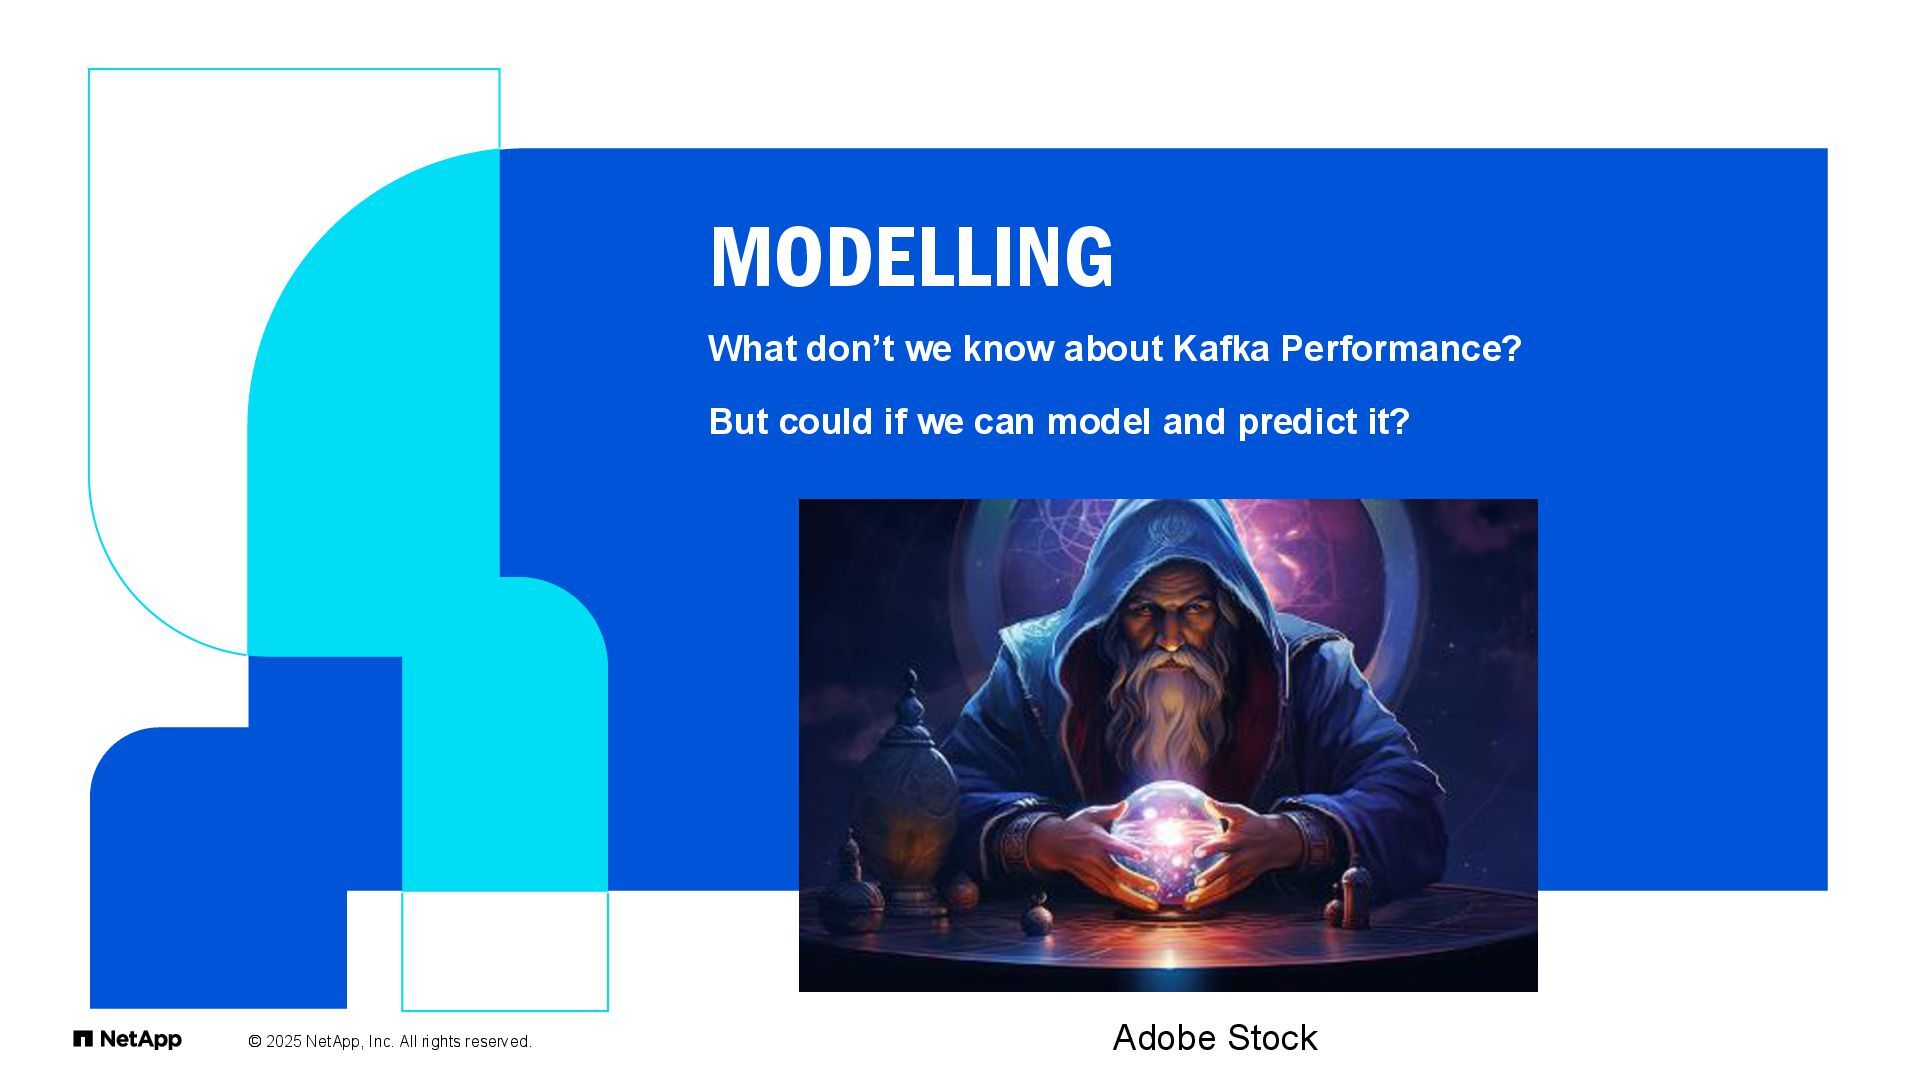
    we can model and predict it? MODELLING © 2025 NetApp, Inc. All rights reserved. Adobe Stock
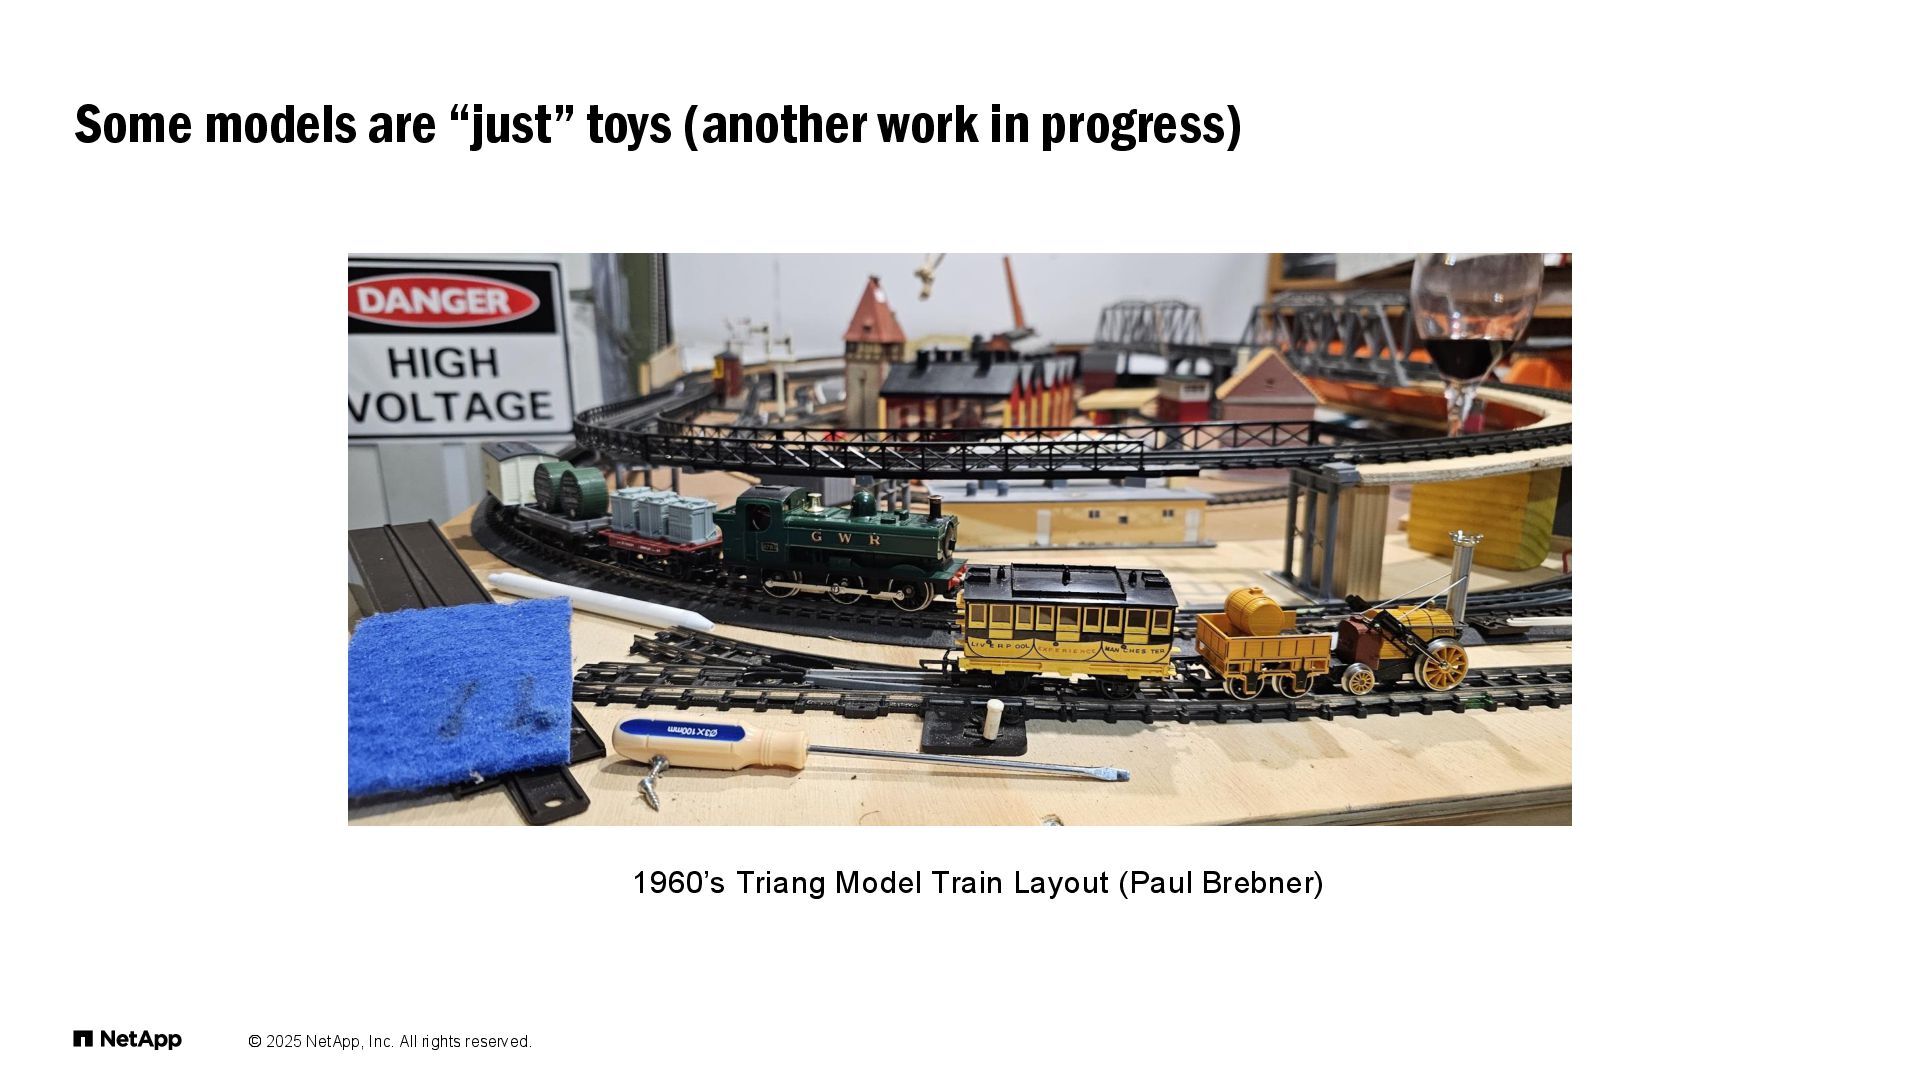
  44. © 2025 NetApp, Inc. All rights reserved. Some models are

    “just” toys (another work in progress) 1960’s Triang Model Train Layout (Paul Brebner)
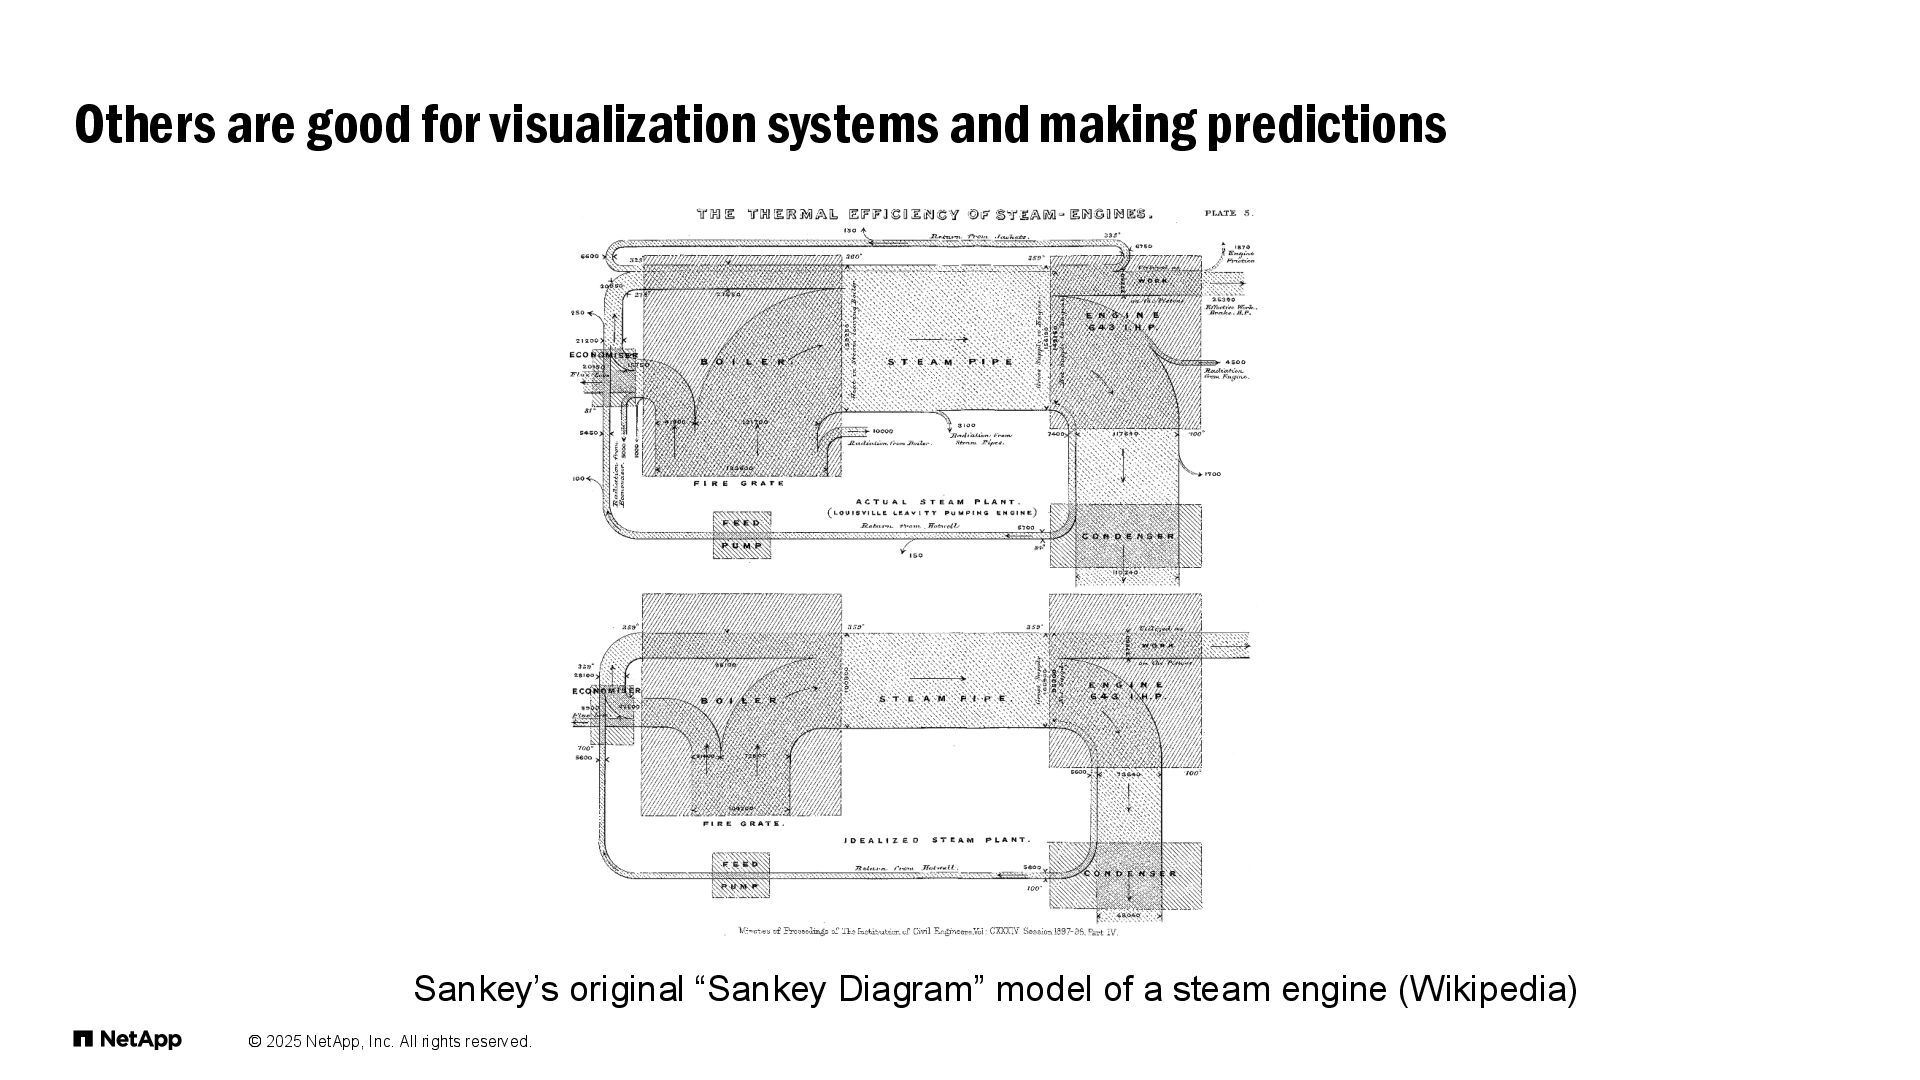
  45. © 2025 NetApp, Inc. All rights reserved. Others are good

    for visualization systems and making predictions Sankey’s original “Sankey Diagram” model of a steam engine (Wikipedia)
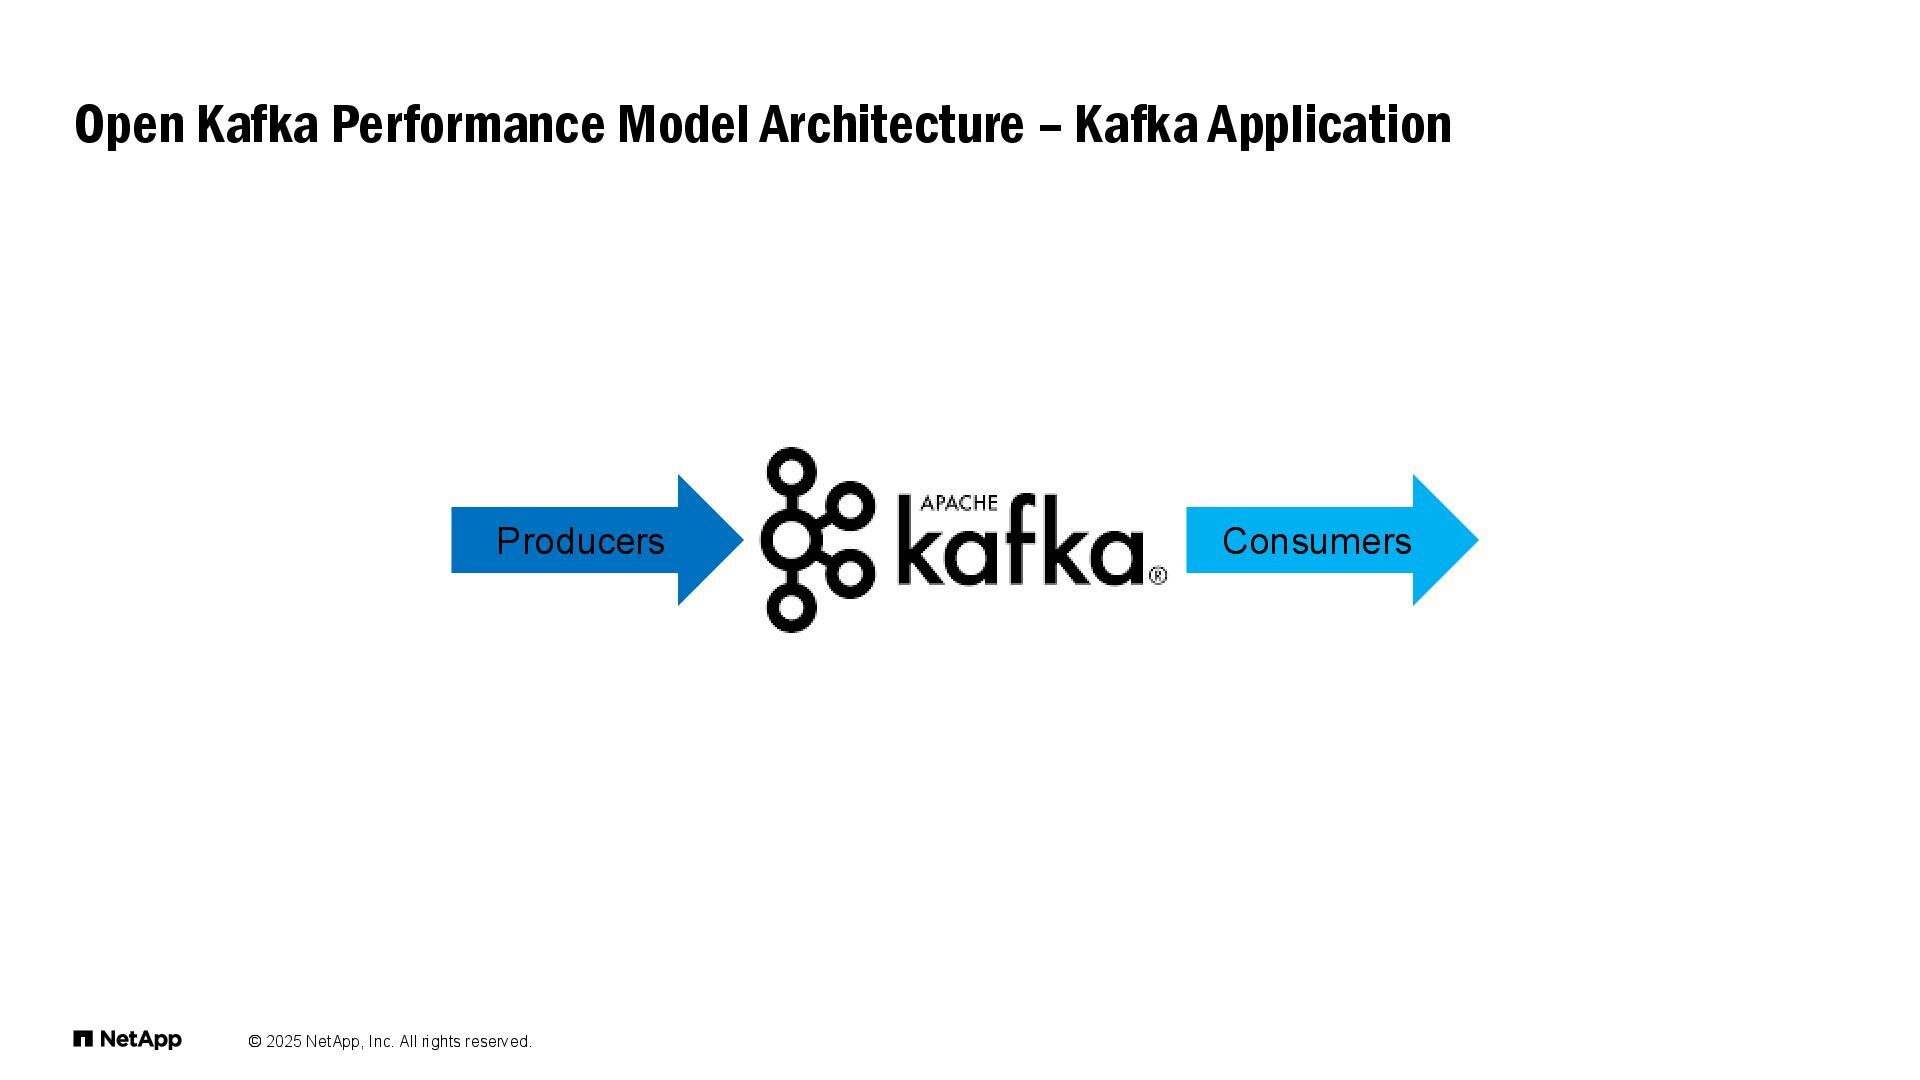
  46. © 2025 NetApp, Inc. All rights reserved. Open Kafka Performance

    Model Architecture – Kafka Application Producers Consumers
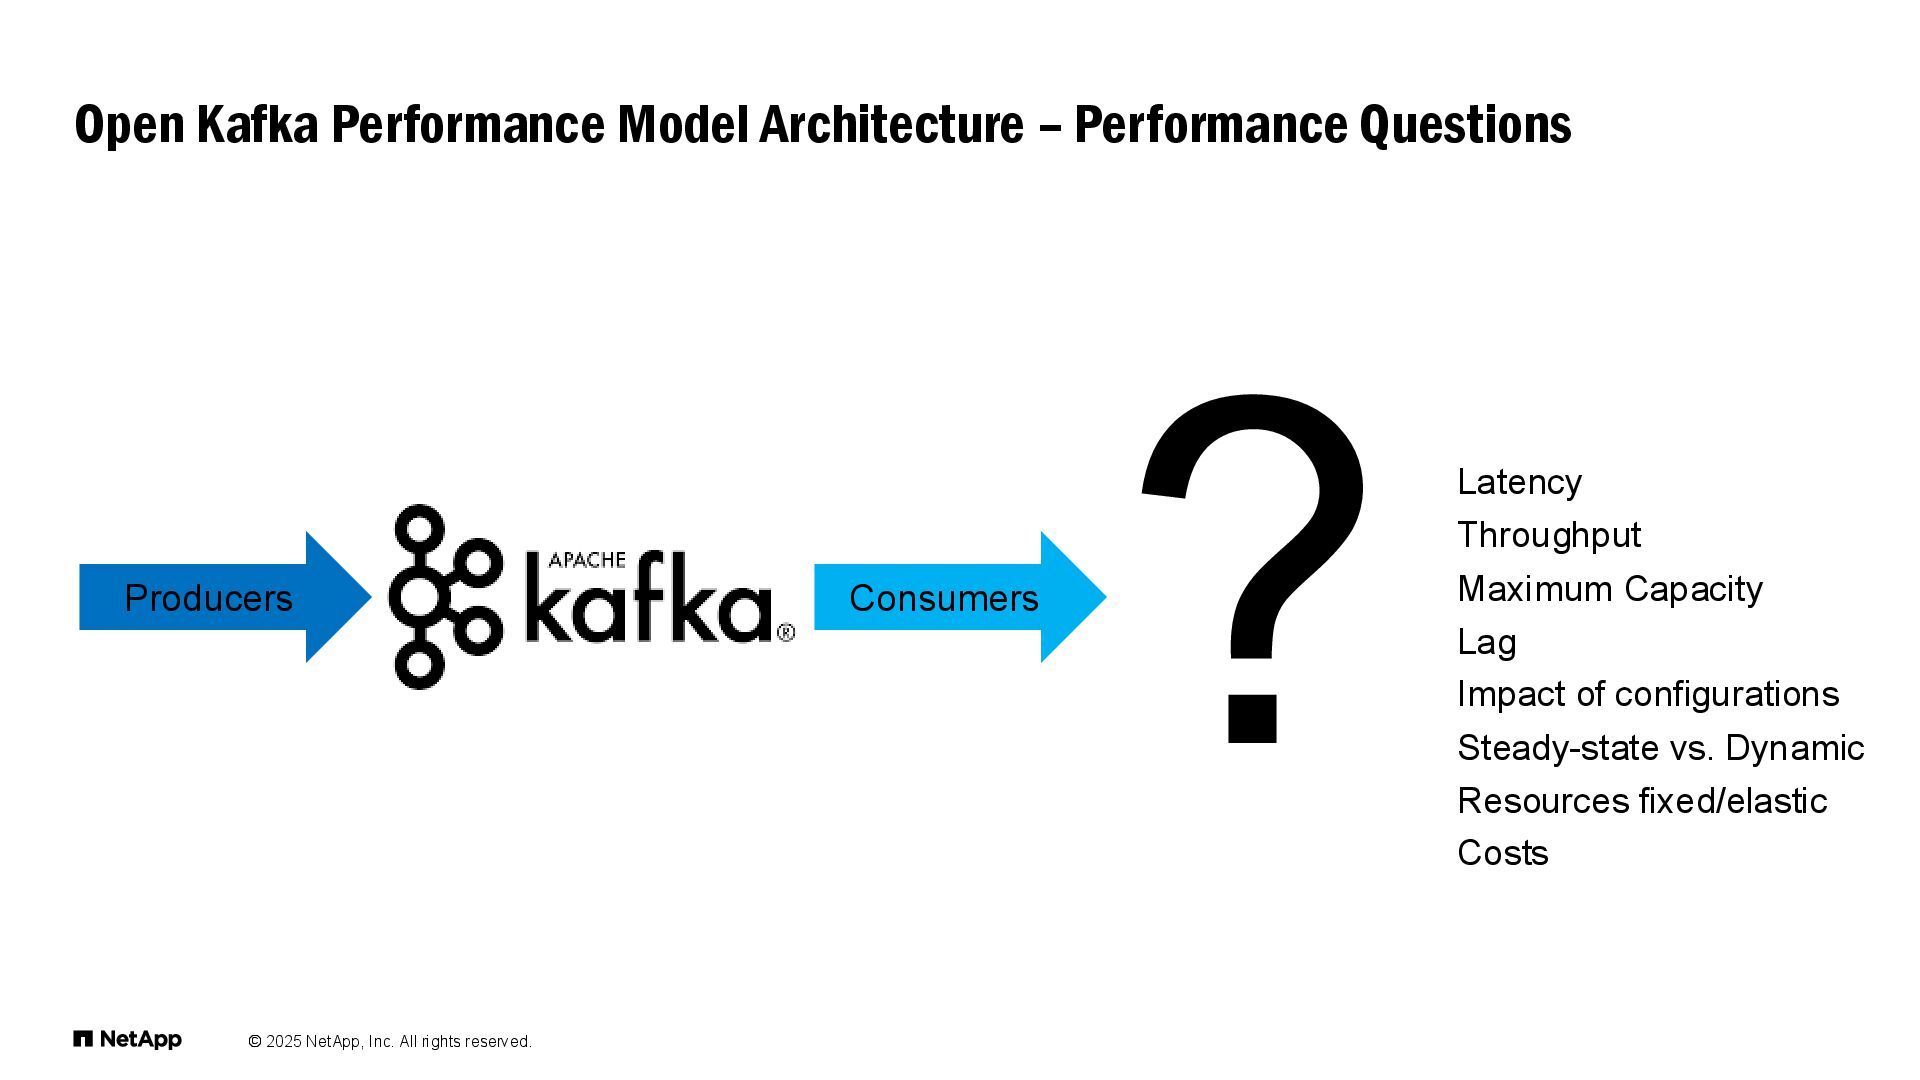
  47. © 2025 NetApp, Inc. All rights reserved. Open Kafka Performance

    Model Architecture – Performance Questions Producers Consumers Latency Throughput Maximum Capacity Lag Impact of configurations Steady-state vs. Dynamic Resources fixed/elastic Costs
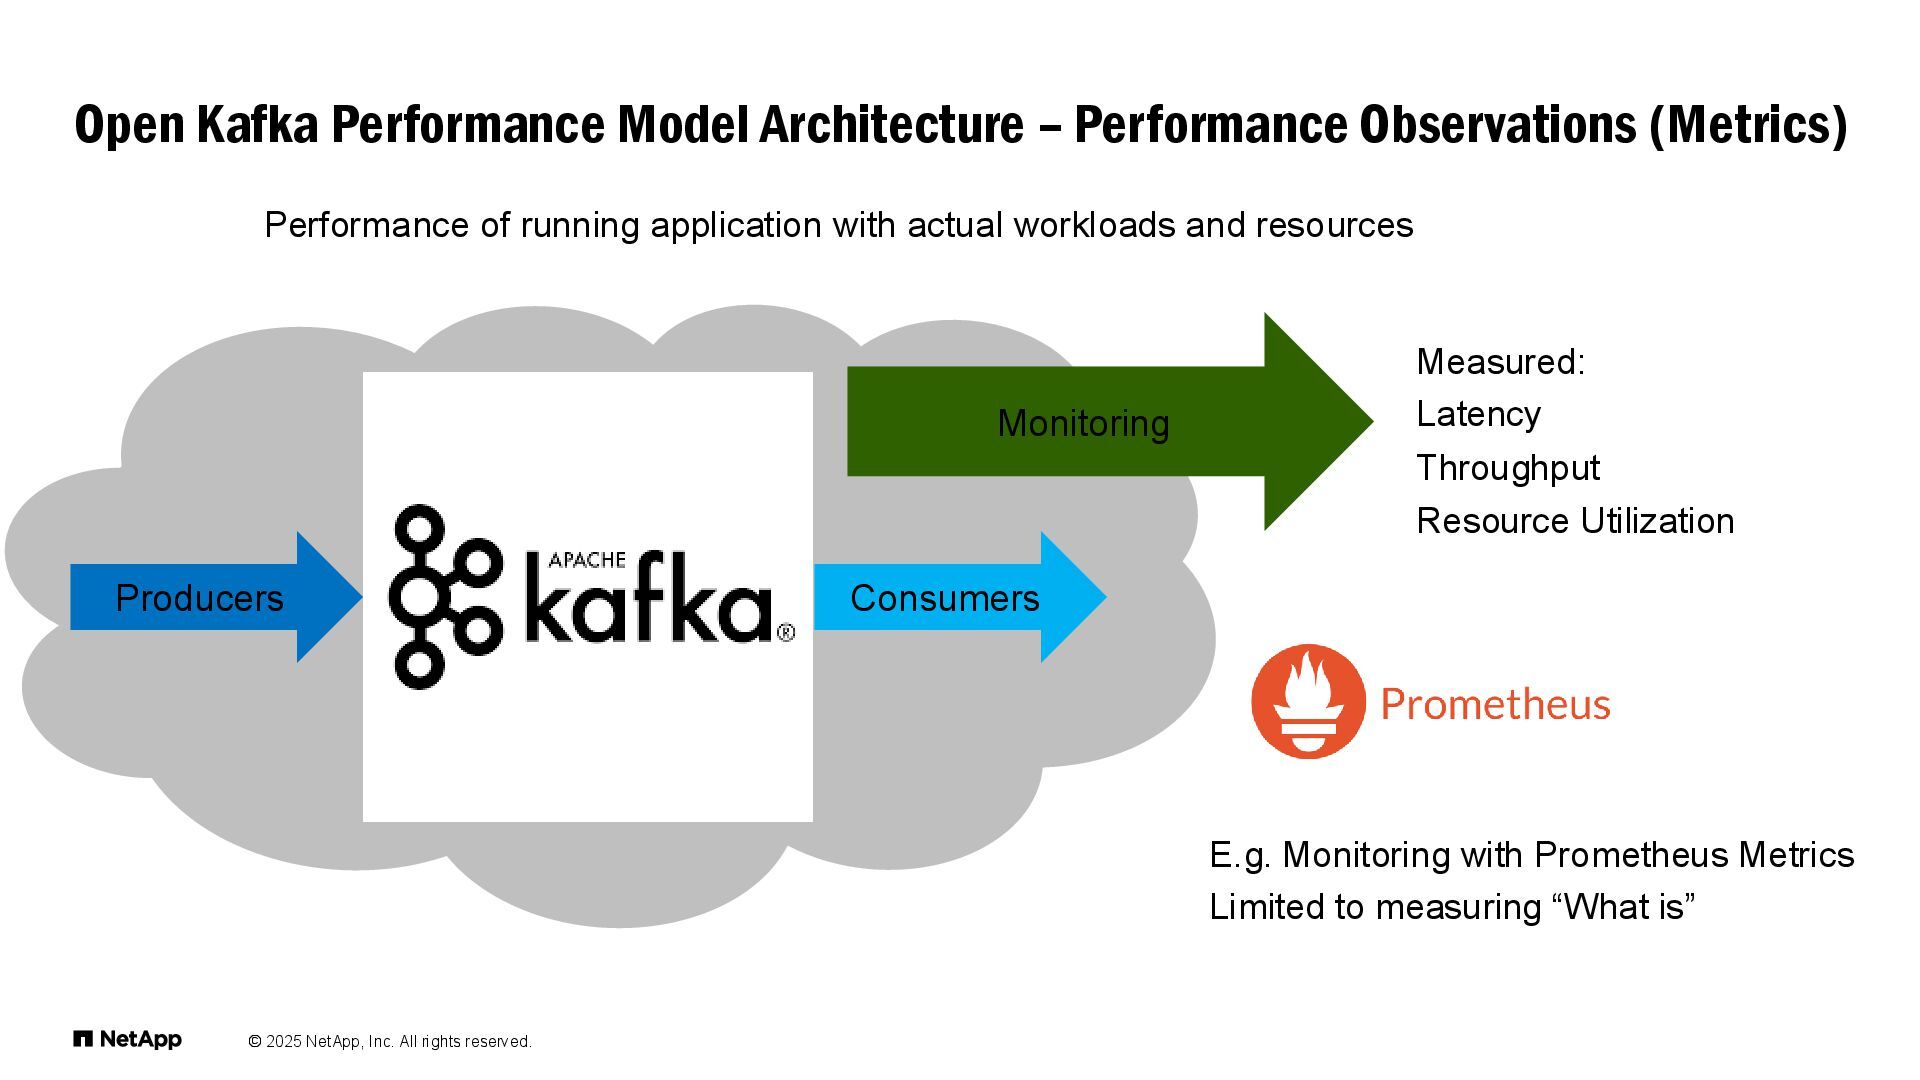
  48. © 2025 NetApp, Inc. All rights reserved. Open Kafka Performance

    Model Architecture – Performance Observations (Metrics) Producers Consumers Measured: Latency Throughput Resource Utilization Monitoring E.g. Monitoring with Prometheus Metrics Limited to measuring “What is” Performance of running application with actual workloads and resources
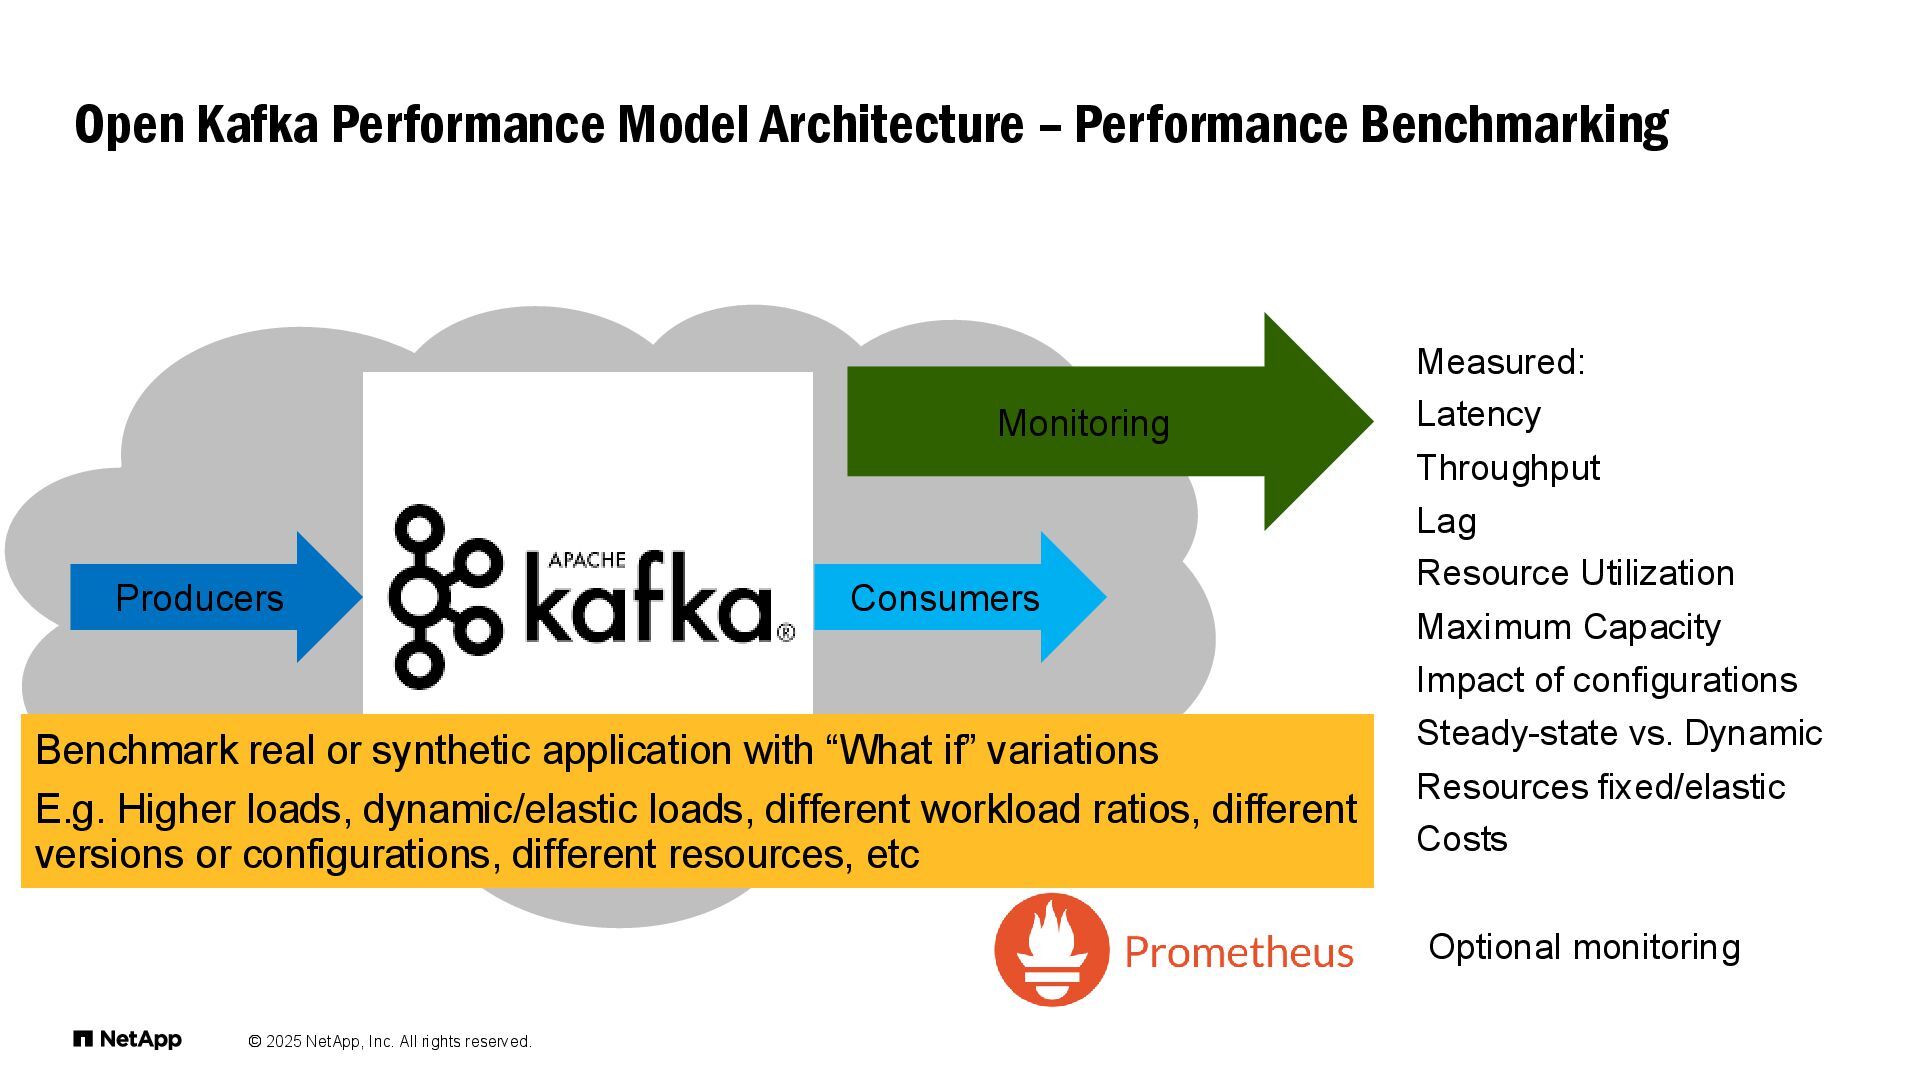
  49. © 2025 NetApp, Inc. All rights reserved. Open Kafka Performance

    Model Architecture – Performance Benchmarking Producers Consumers Measured: Latency Throughput Lag Resource Utilization Maximum Capacity Impact of configurations Steady-state vs. Dynamic Resources fixed/elastic Costs Monitoring Optional monitoring Benchmark real or synthetic application with “What if” variations E.g. Higher loads, dynamic/elastic loads, different workload ratios, different versions or configurations, different resources, etc
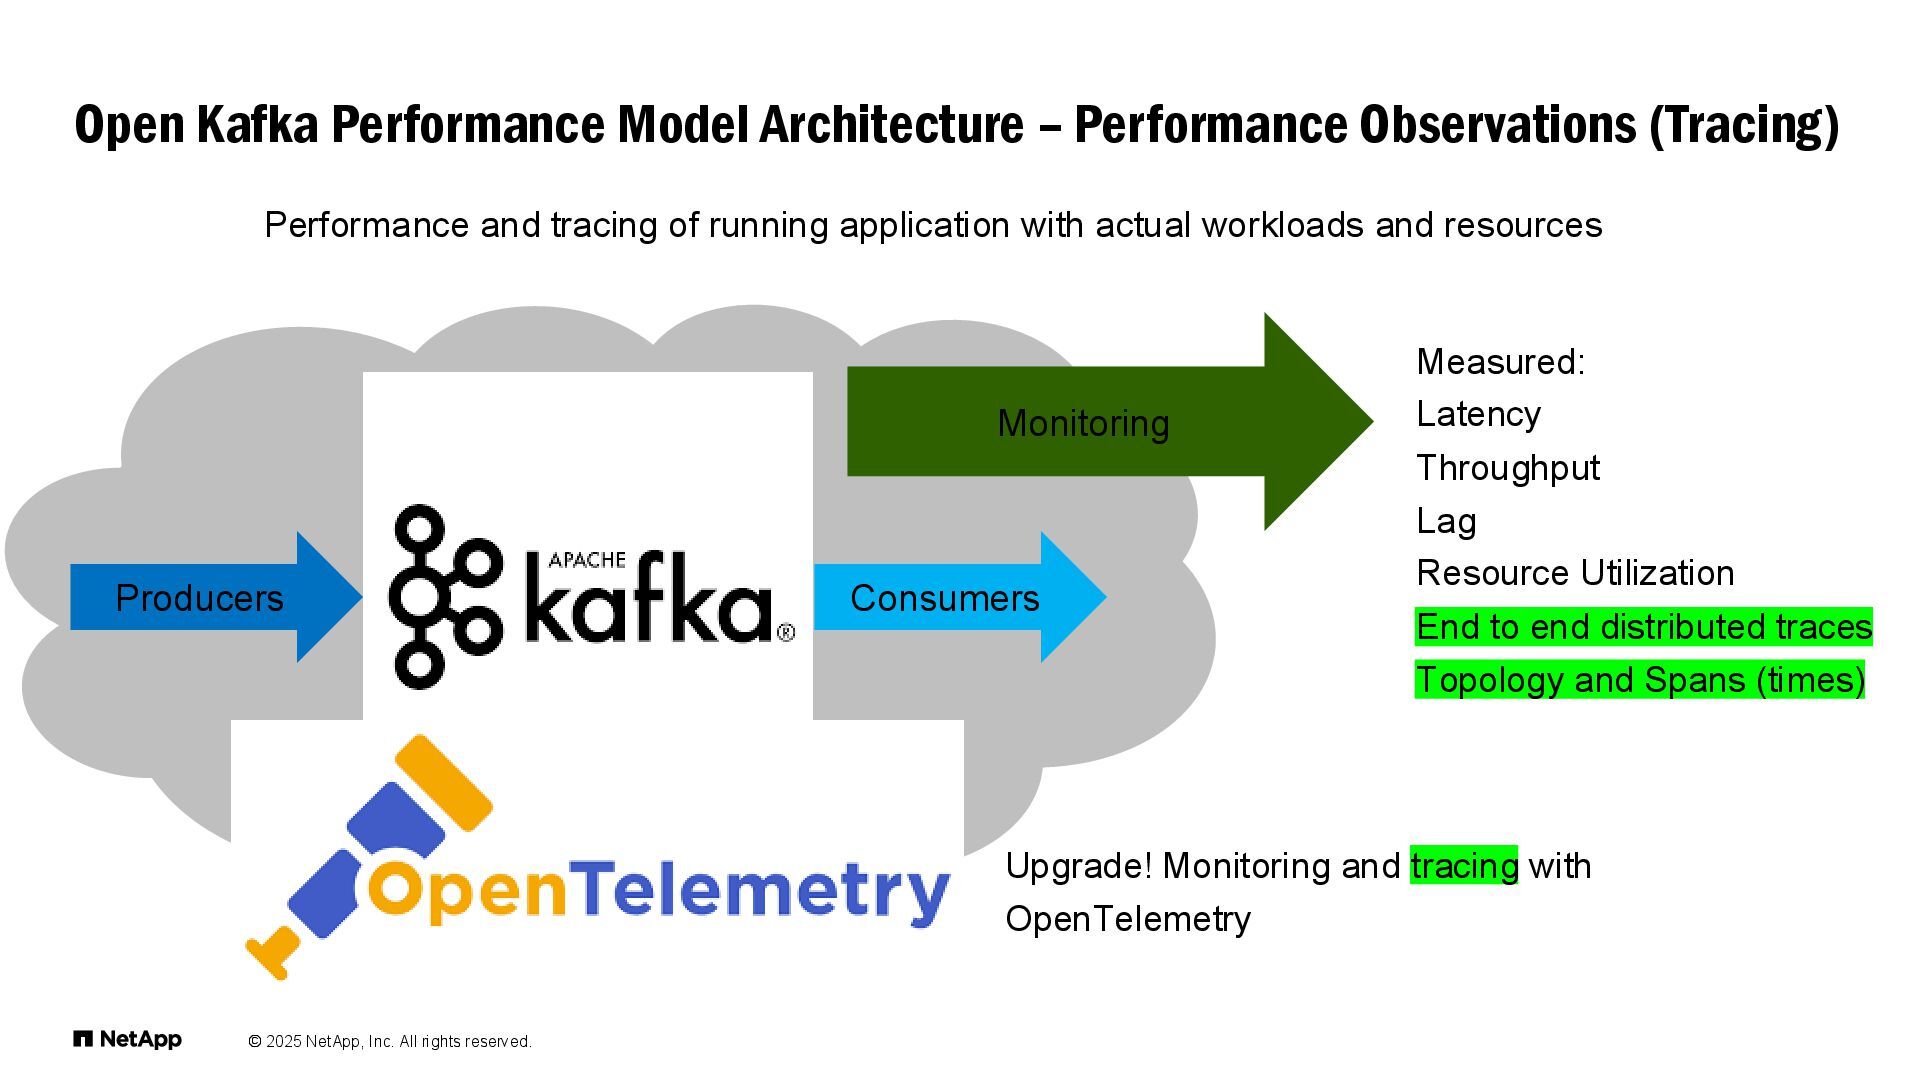
  50. © 2025 NetApp, Inc. All rights reserved. Open Kafka Performance

    Model Architecture – Performance Observations (Tracing) Producers Consumers Measured: Latency Throughput Lag Resource Utilization End to end distributed traces Topology and Spans (times) Monitoring Upgrade! Monitoring and tracing with OpenTelemetry Performance and tracing of running application with actual workloads and resources
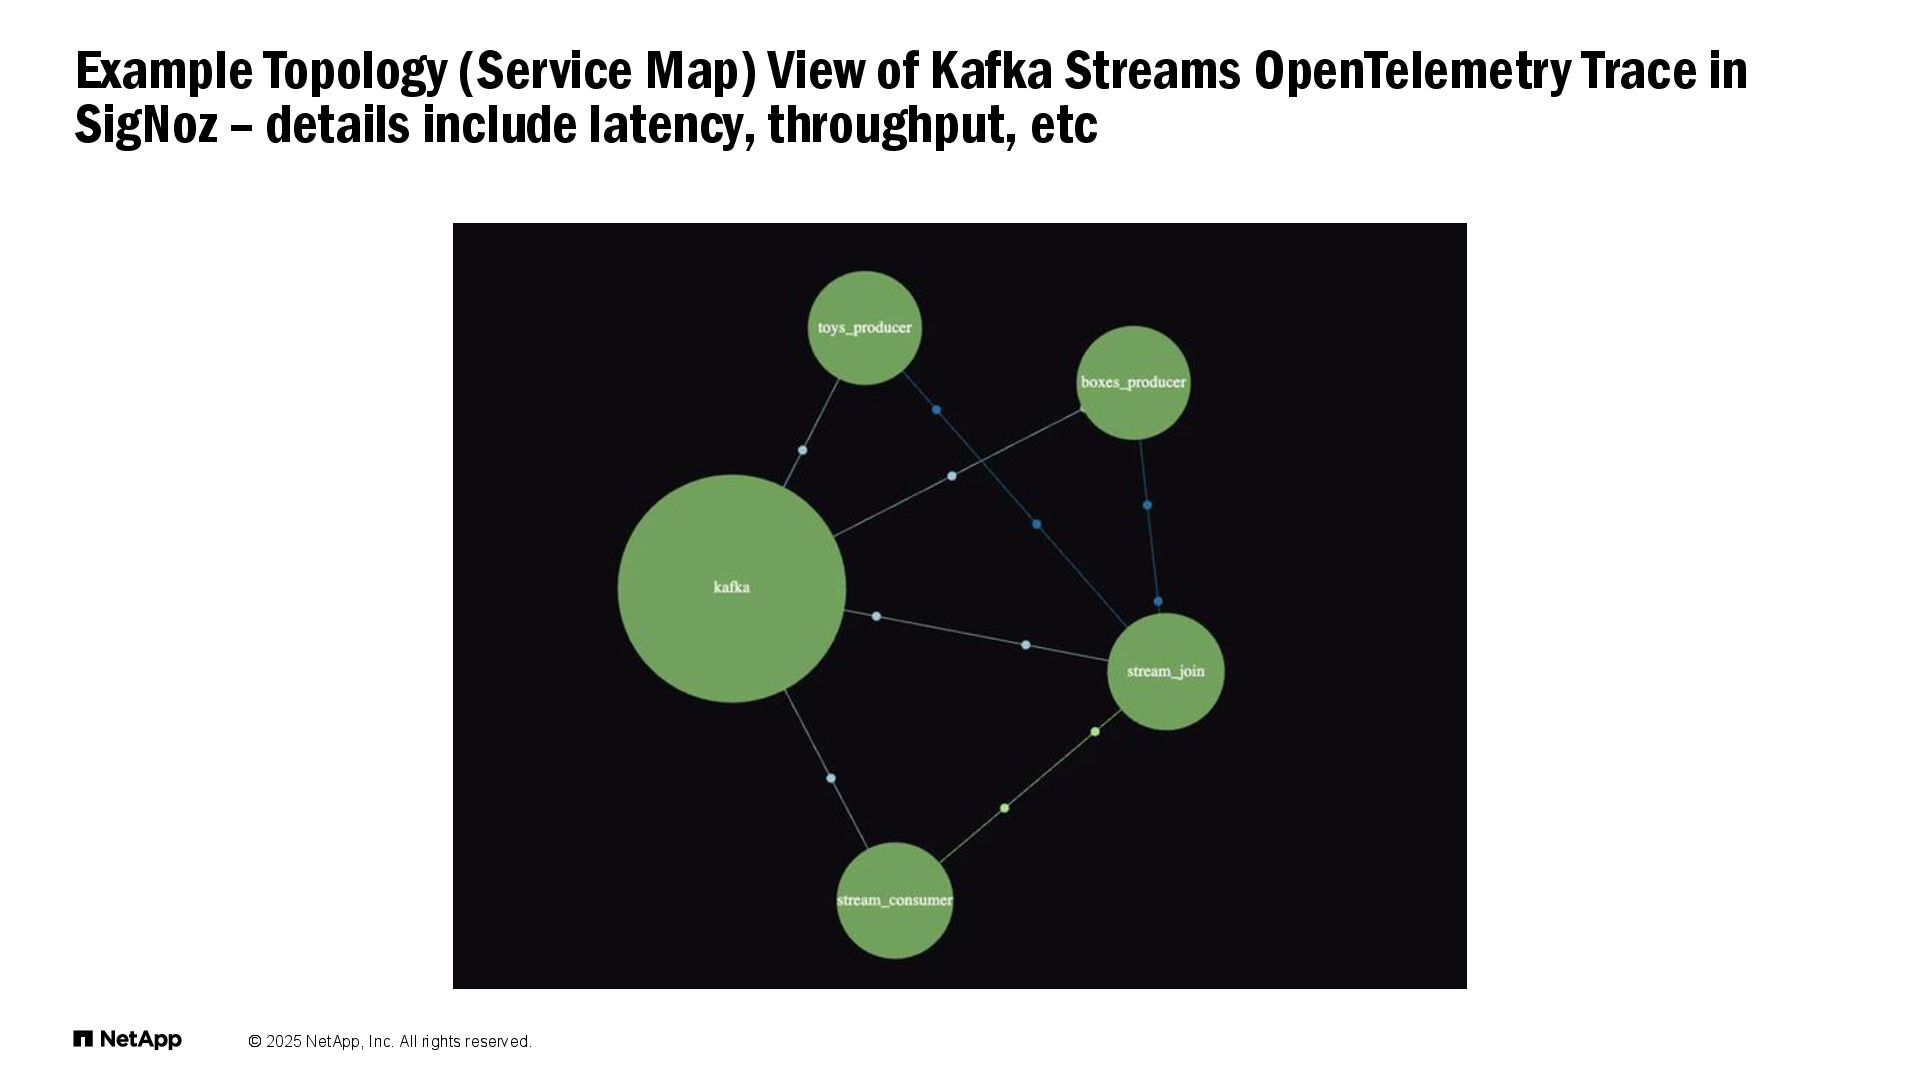
  51. © 2025 NetApp, Inc. All rights reserved. Example Topology (Service

    Map) View of Kafka Streams OpenTelemetry Trace in SigNoz – details include latency, throughput, etc
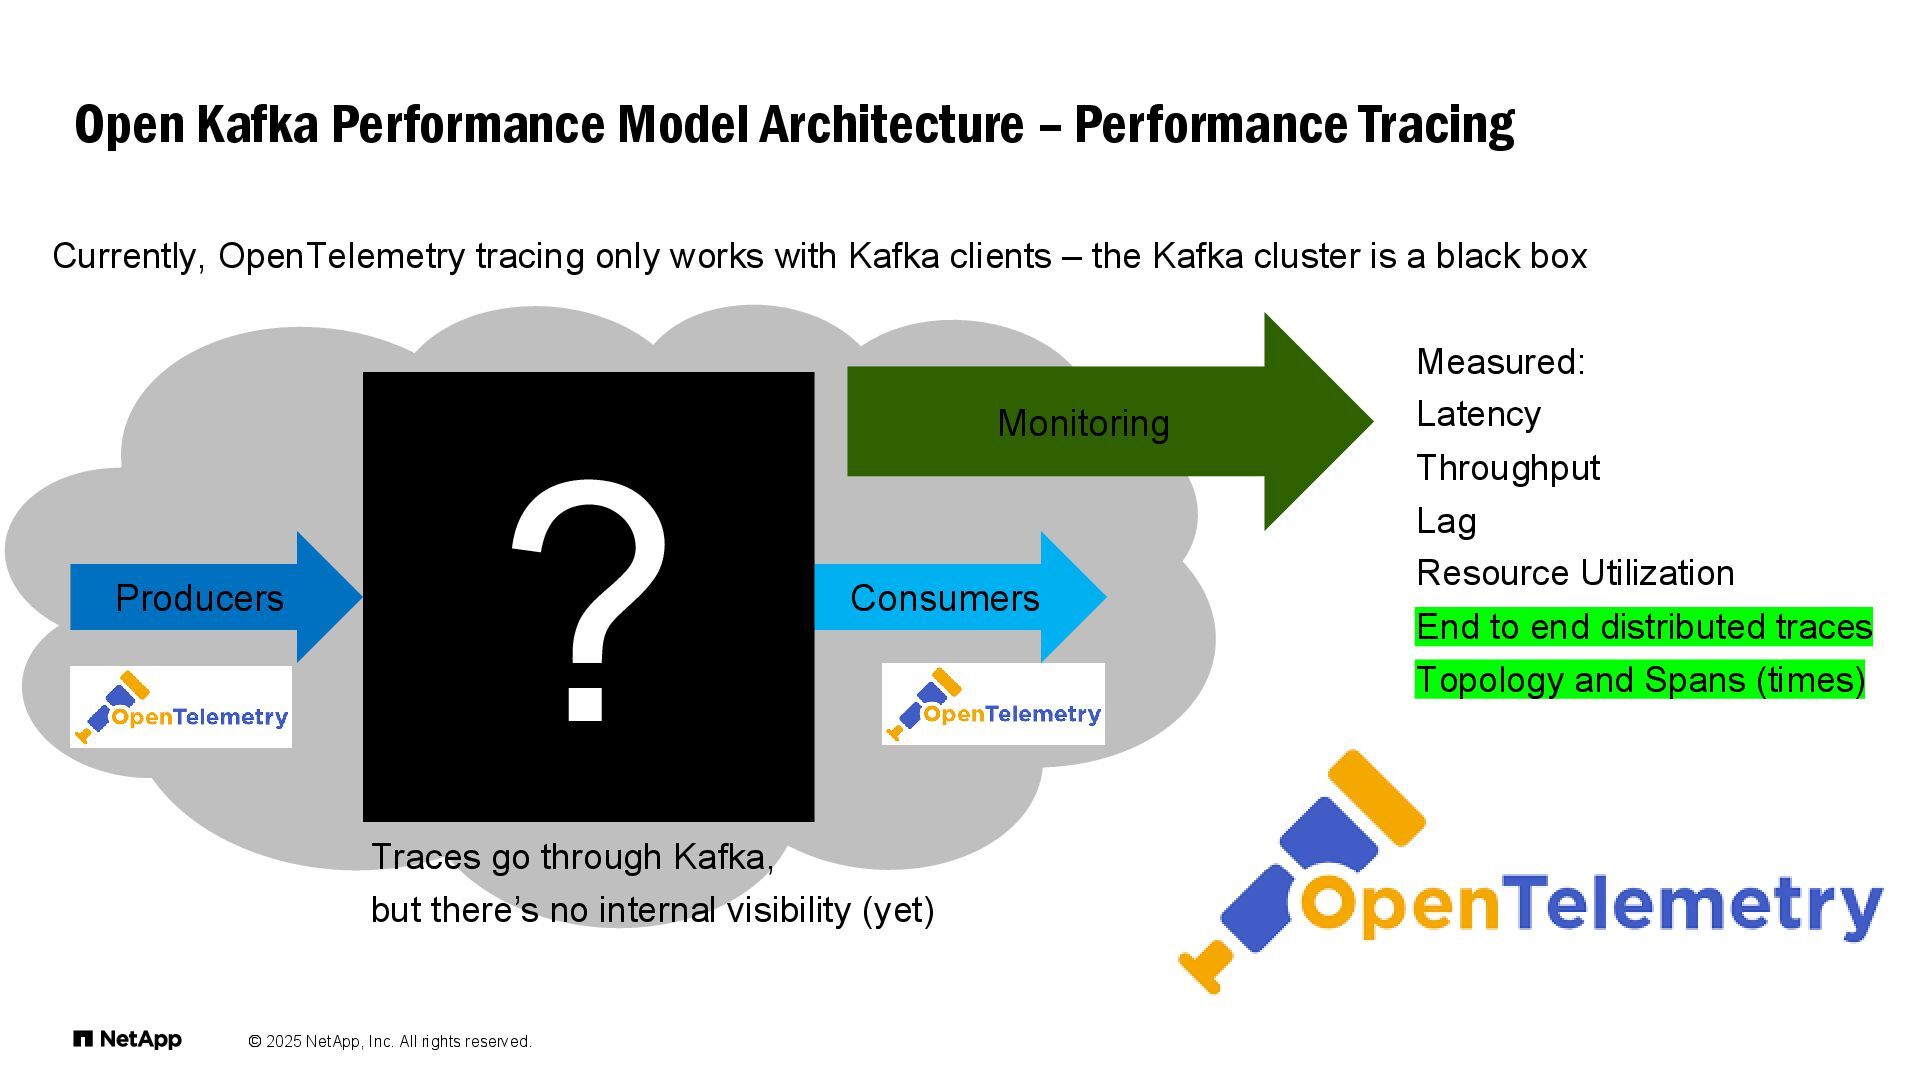
  52. © 2025 NetApp, Inc. All rights reserved. Open Kafka Performance

    Model Architecture – Performance Tracing Producers Consumers Measured: Latency Throughput Lag Resource Utilization End to end distributed traces Topology and Spans (times) Monitoring Currently, OpenTelemetry tracing only works with Kafka clients – the Kafka cluster is a black box ? Traces go through Kafka, but there’s no internal visibility (yet)
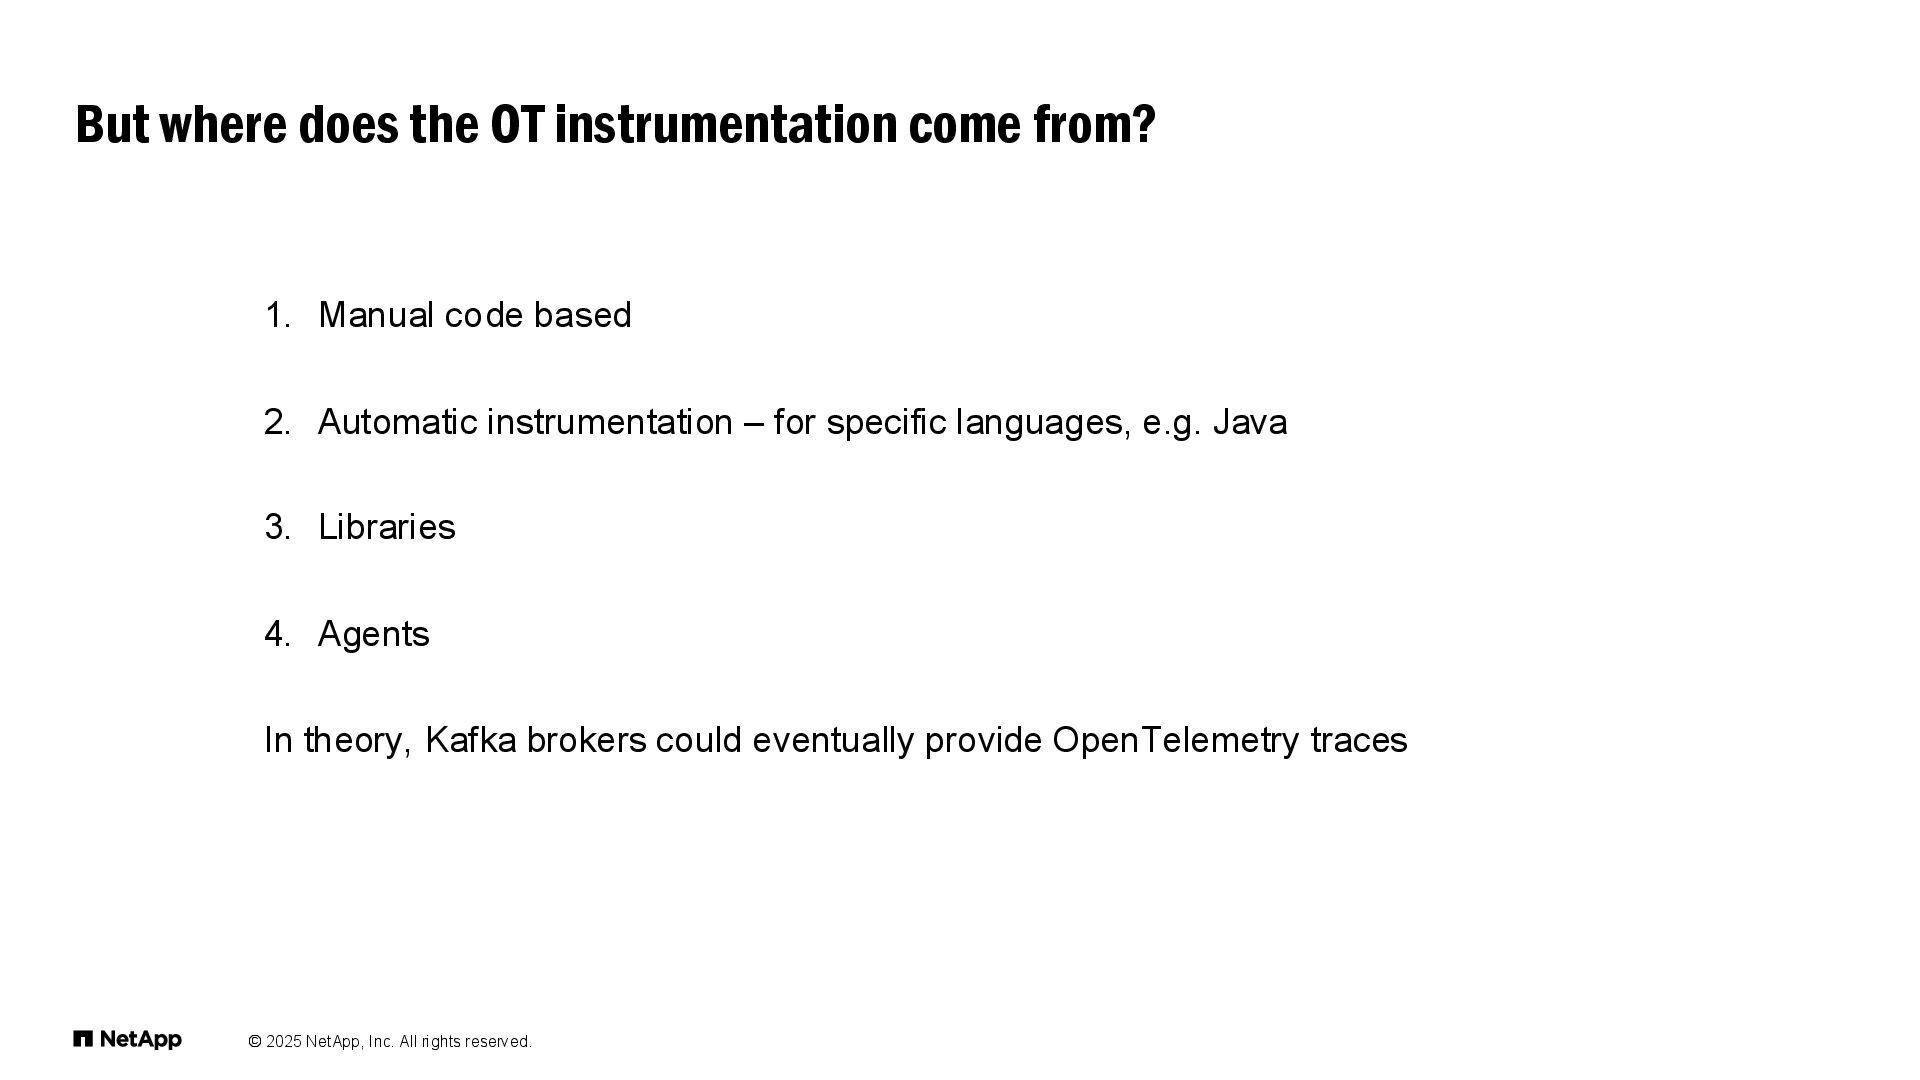
  53. © 2025 NetApp, Inc. All rights reserved. But where does

    the OT instrumentation come from? 1. Manual code based 2. Automatic instrumentation – for specific languages, e.g. Java 3. Libraries 4. Agents In theory, Kafka brokers could eventually provide OpenTelemetry traces
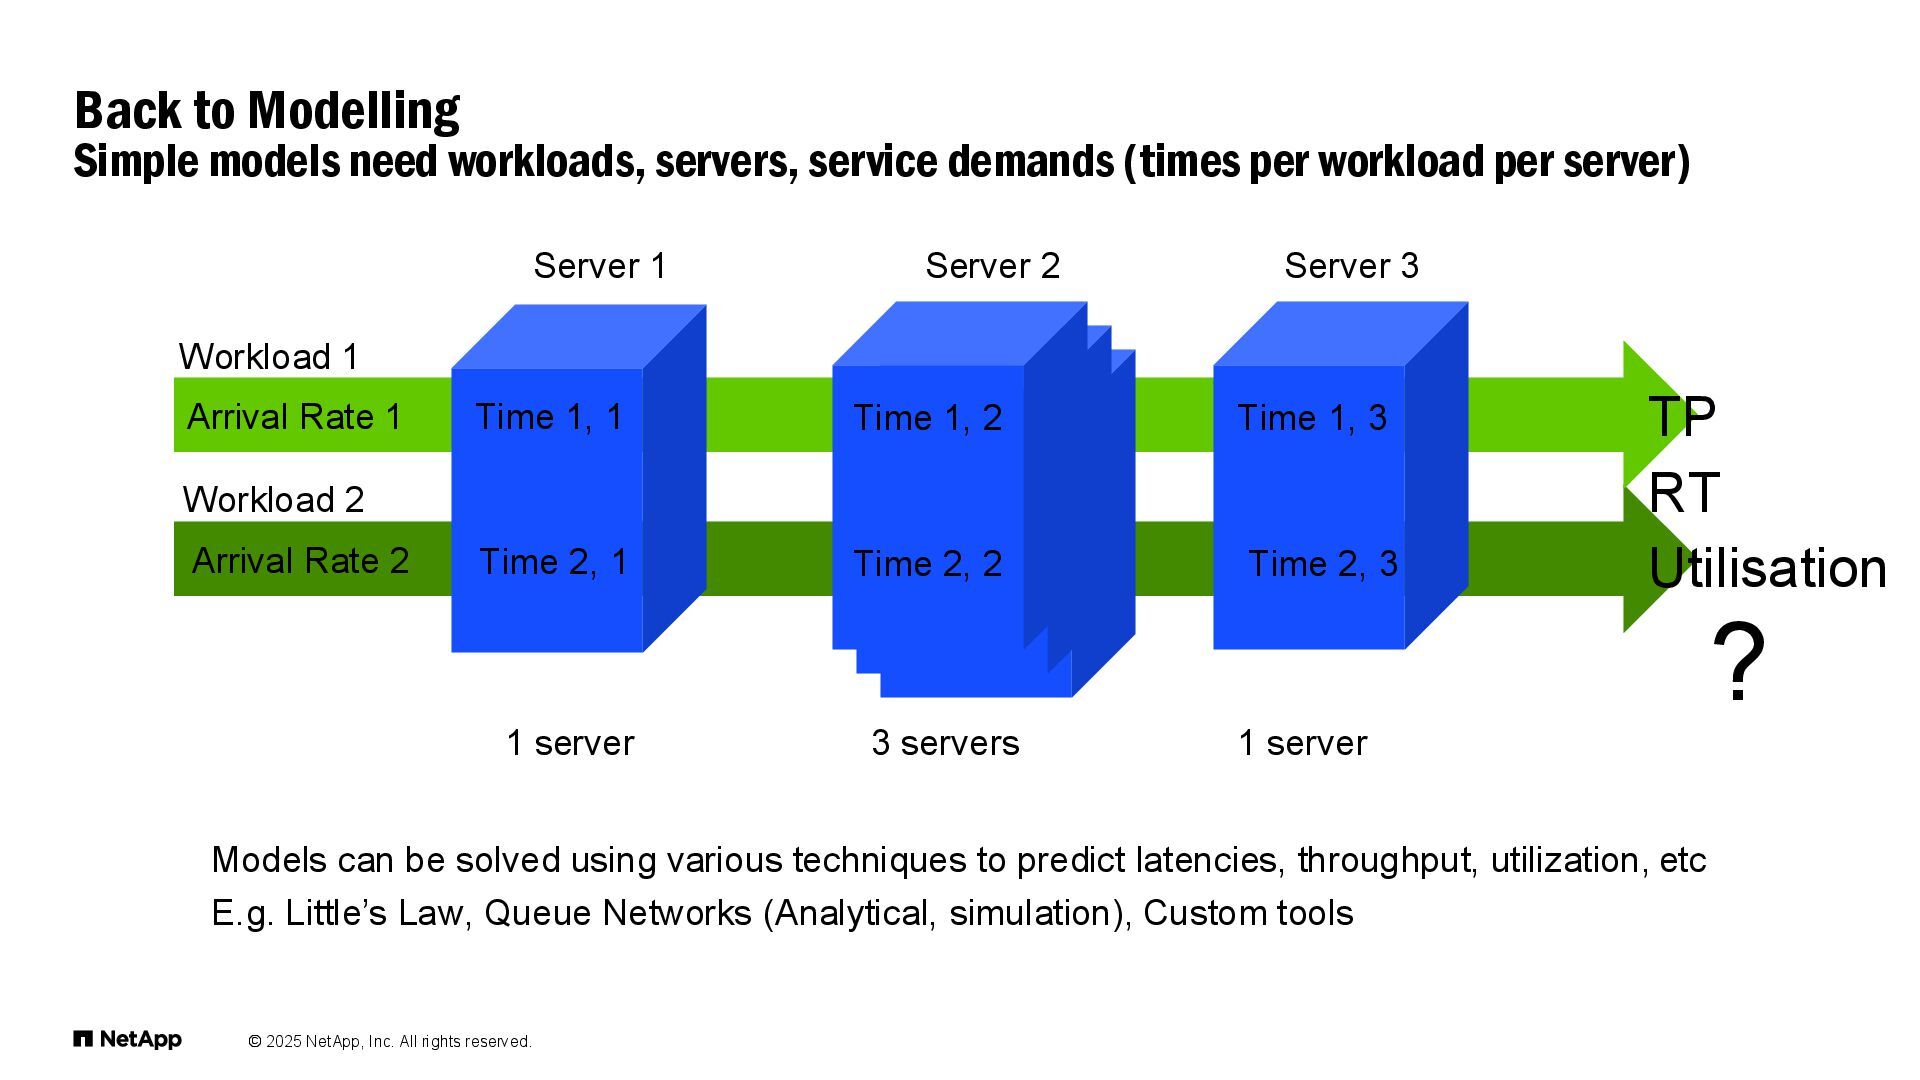
  54. © 2025 NetApp, Inc. All rights reserved. Back to Modelling

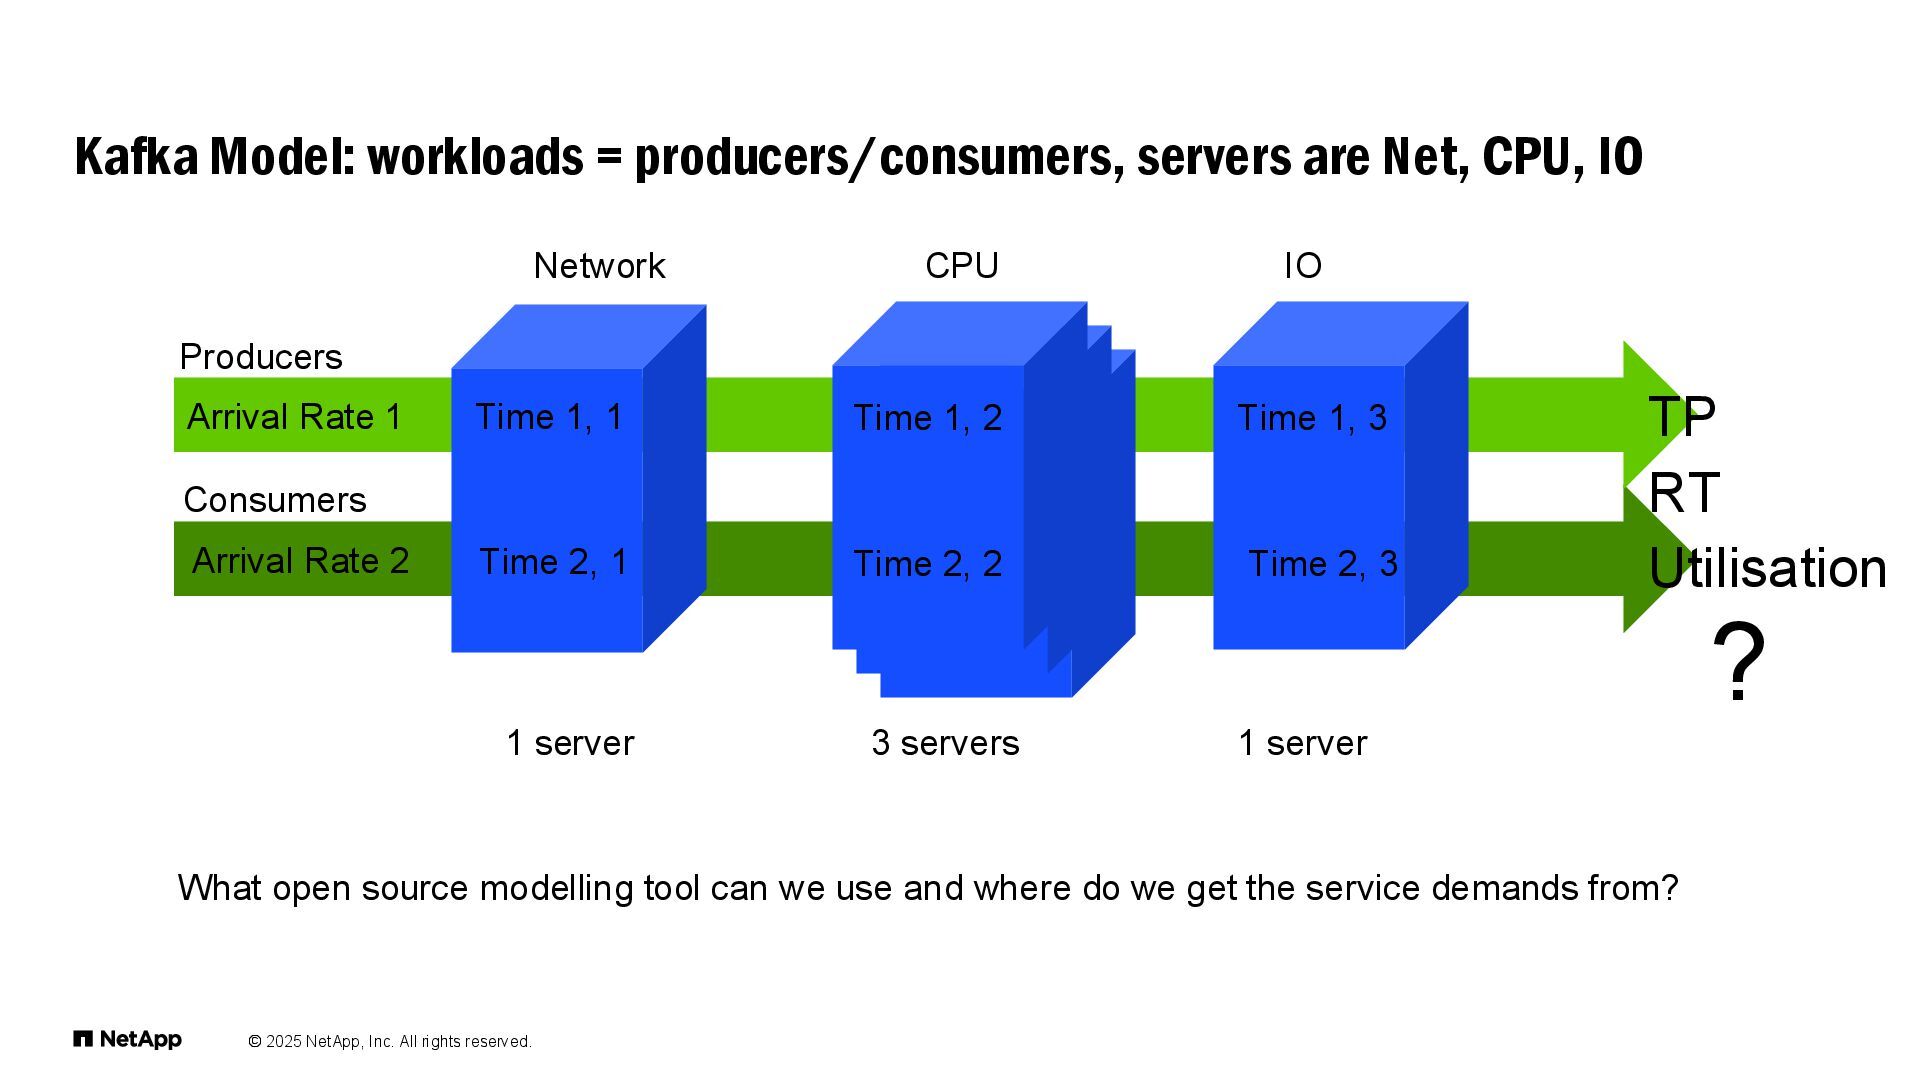
    Simple models need workloads, servers, service demands (times per workload per server) Workload 1 Server 1 Server 2 Server 3 Workload 2 Arrival Rate 1 Arrival Rate 2 Time 1, 1 Time 1, 2 Time 1, 3 Time 2, 1 Time 2, 2 Time 2, 3 1 server 3 servers 1 server Models can be solved using various techniques to predict latencies, throughput, utilization, etc E.g. Little’s Law, Queue Networks (Analytical, simulation), Custom tools TP RT Utilisation ?
  55. © 2025 NetApp, Inc. All rights reserved. Kafka Model: workloads

    = producers/consumers, servers are Net, CPU, IO Producers Network CPU IO Consumers Arrival Rate 1 Arrival Rate 2 Time 1, 1 Time 1, 2 Time 1, 3 Time 2, 1 Time 2, 2 Time 2, 3 1 server 3 servers 1 server TP RT Utilisation ? What open source modelling tool can we use and where do we get the service demands from?
  56. © 2025 NetApp, Inc. All rights reserved. Going back to

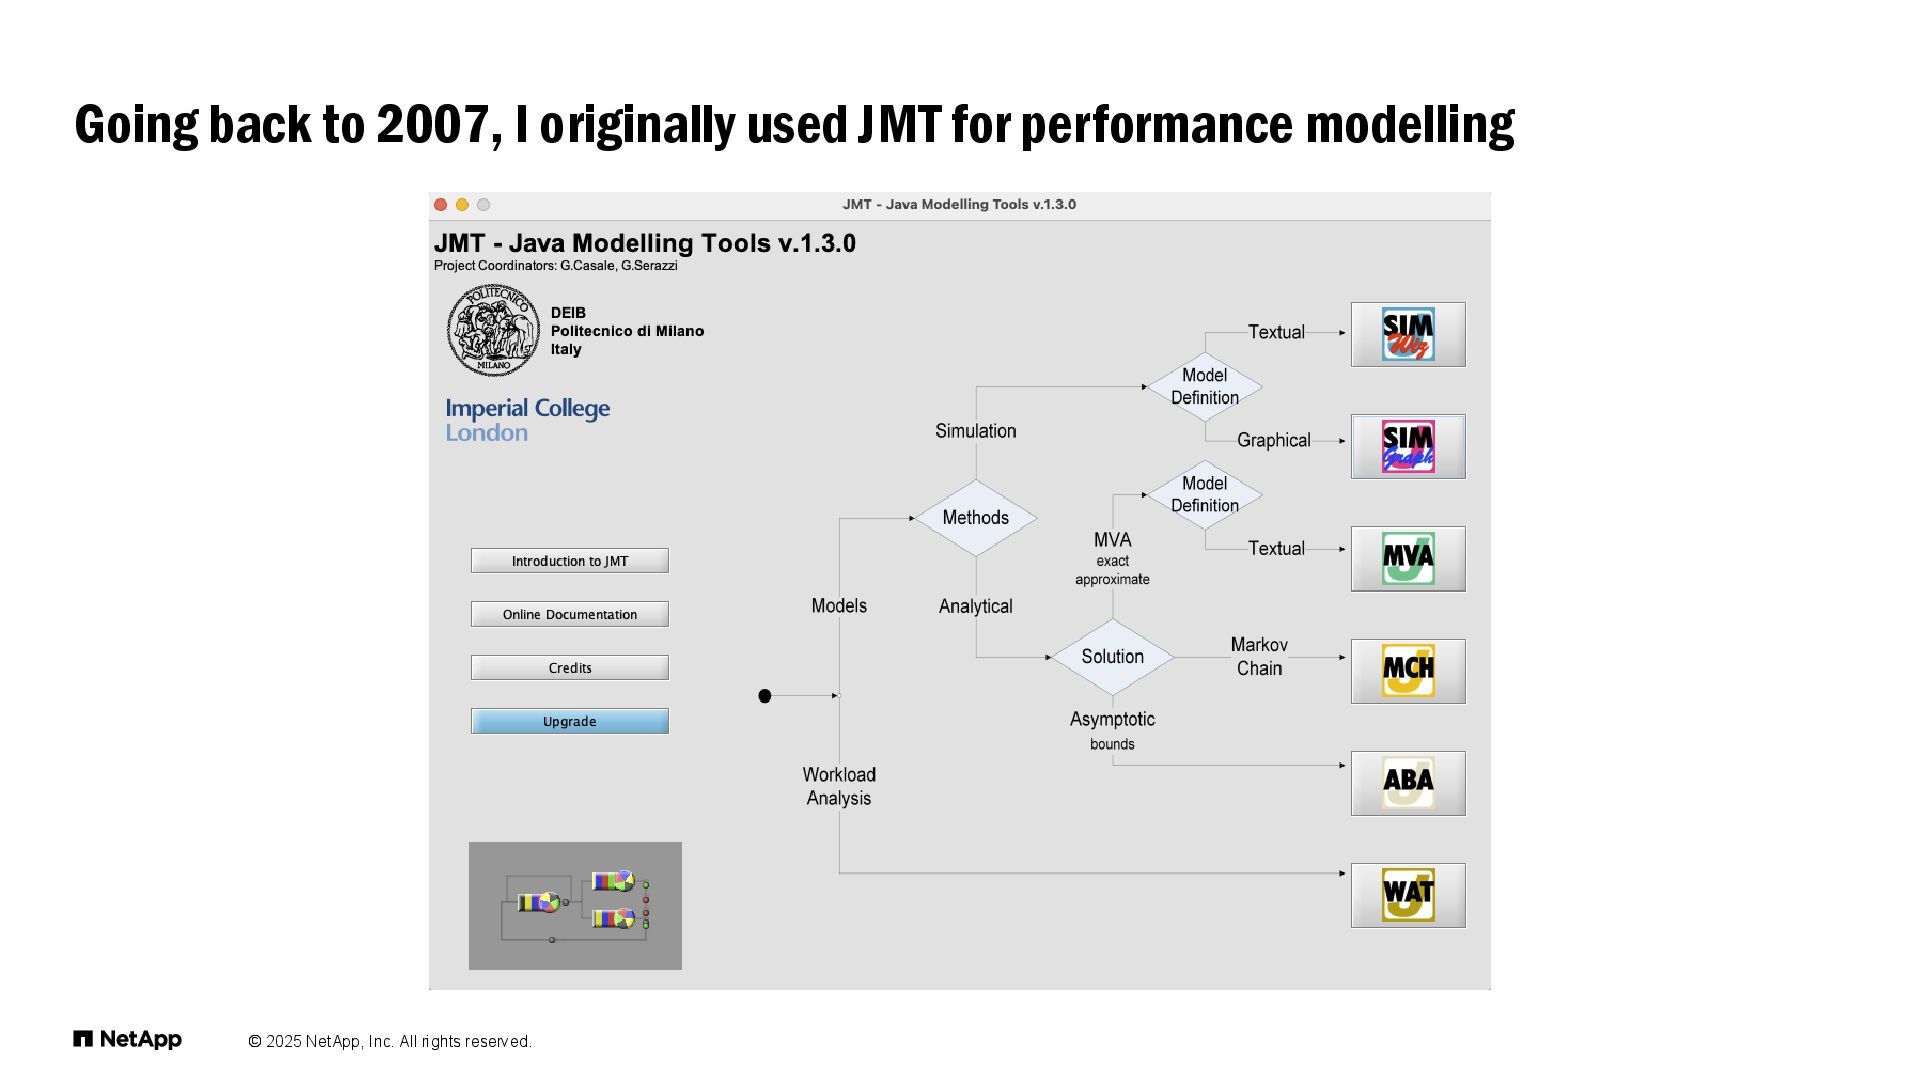
    2007, I originally used JMT for performance modelling
  57. © 2025 NetApp, Inc. All rights reserved. Simple Kafka Performance

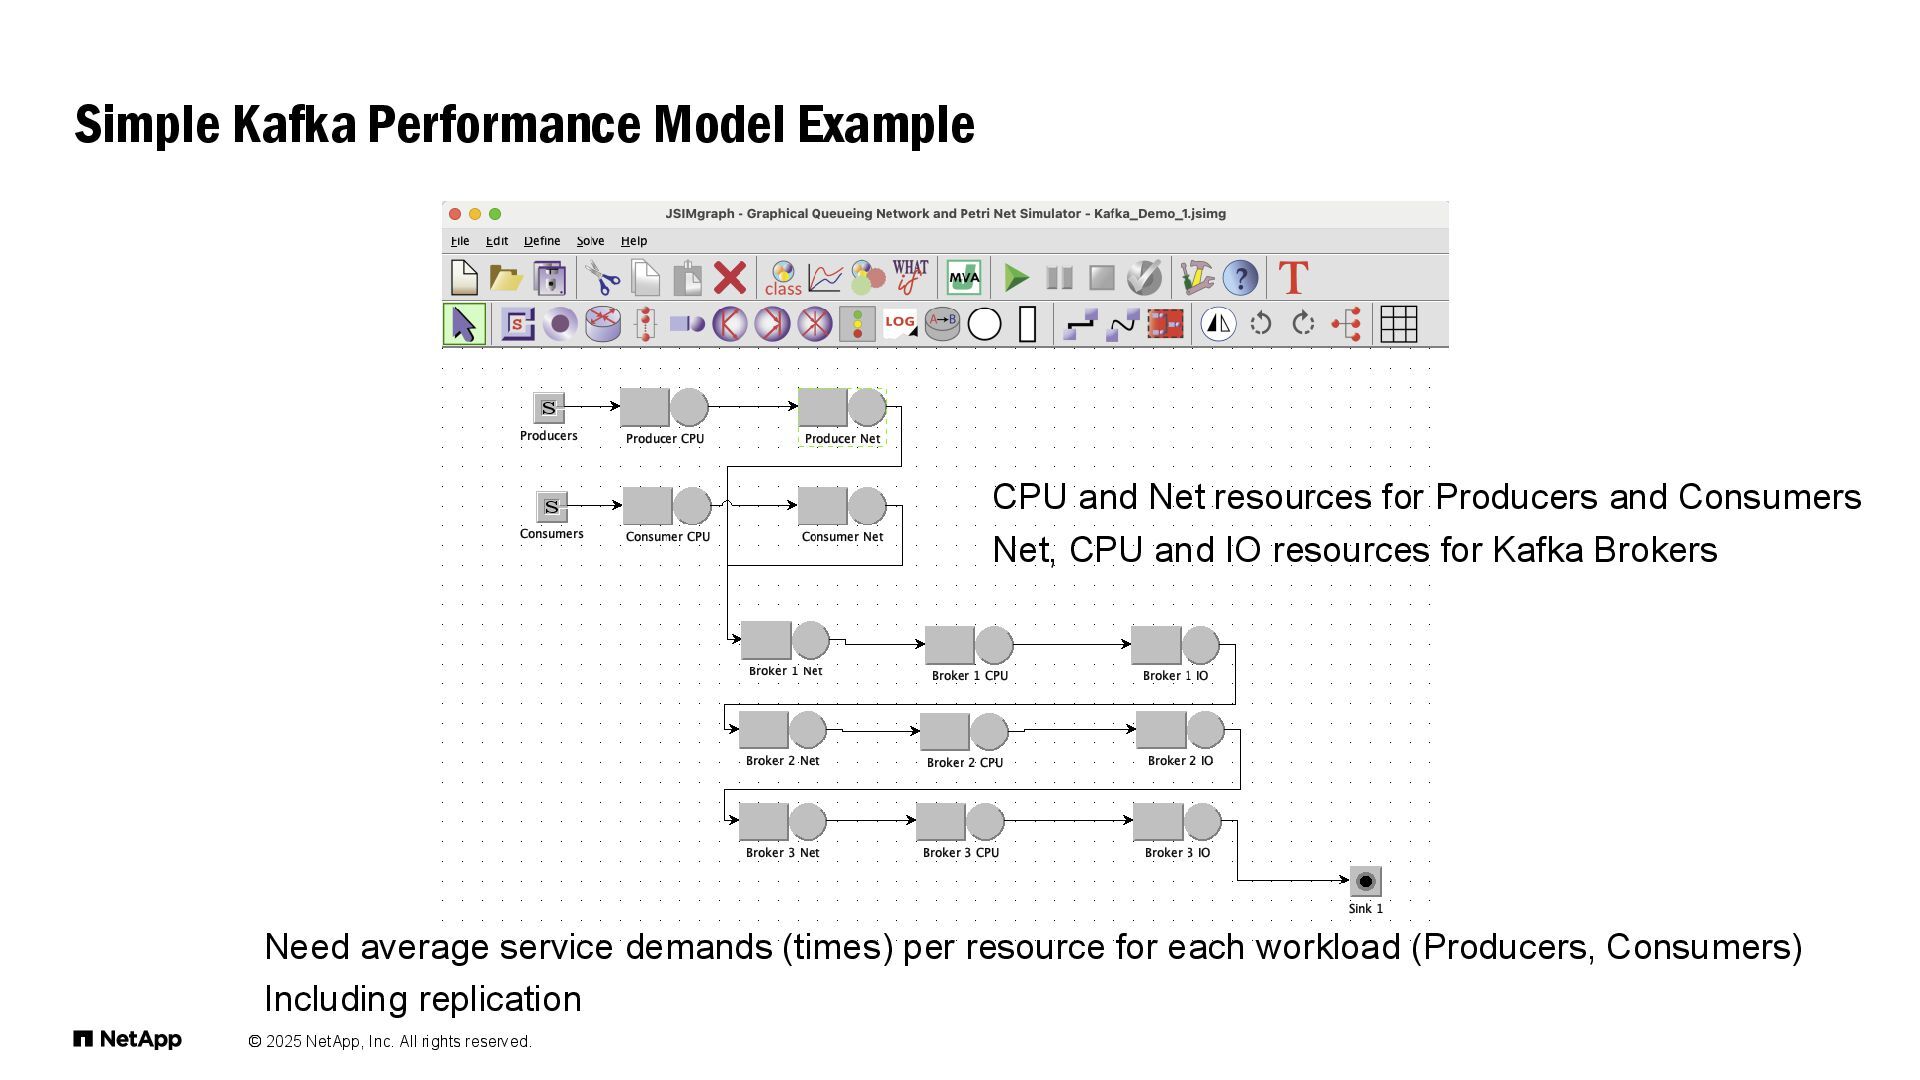
    Model Example CPU and Net resources for Producers and Consumers Net, CPU and IO resources for Kafka Brokers Need average service demands (times) per resource for each workload (Producers, Consumers) Including replication
  58. © 2025 NetApp, Inc. All rights reserved. Simplify multiple brokers

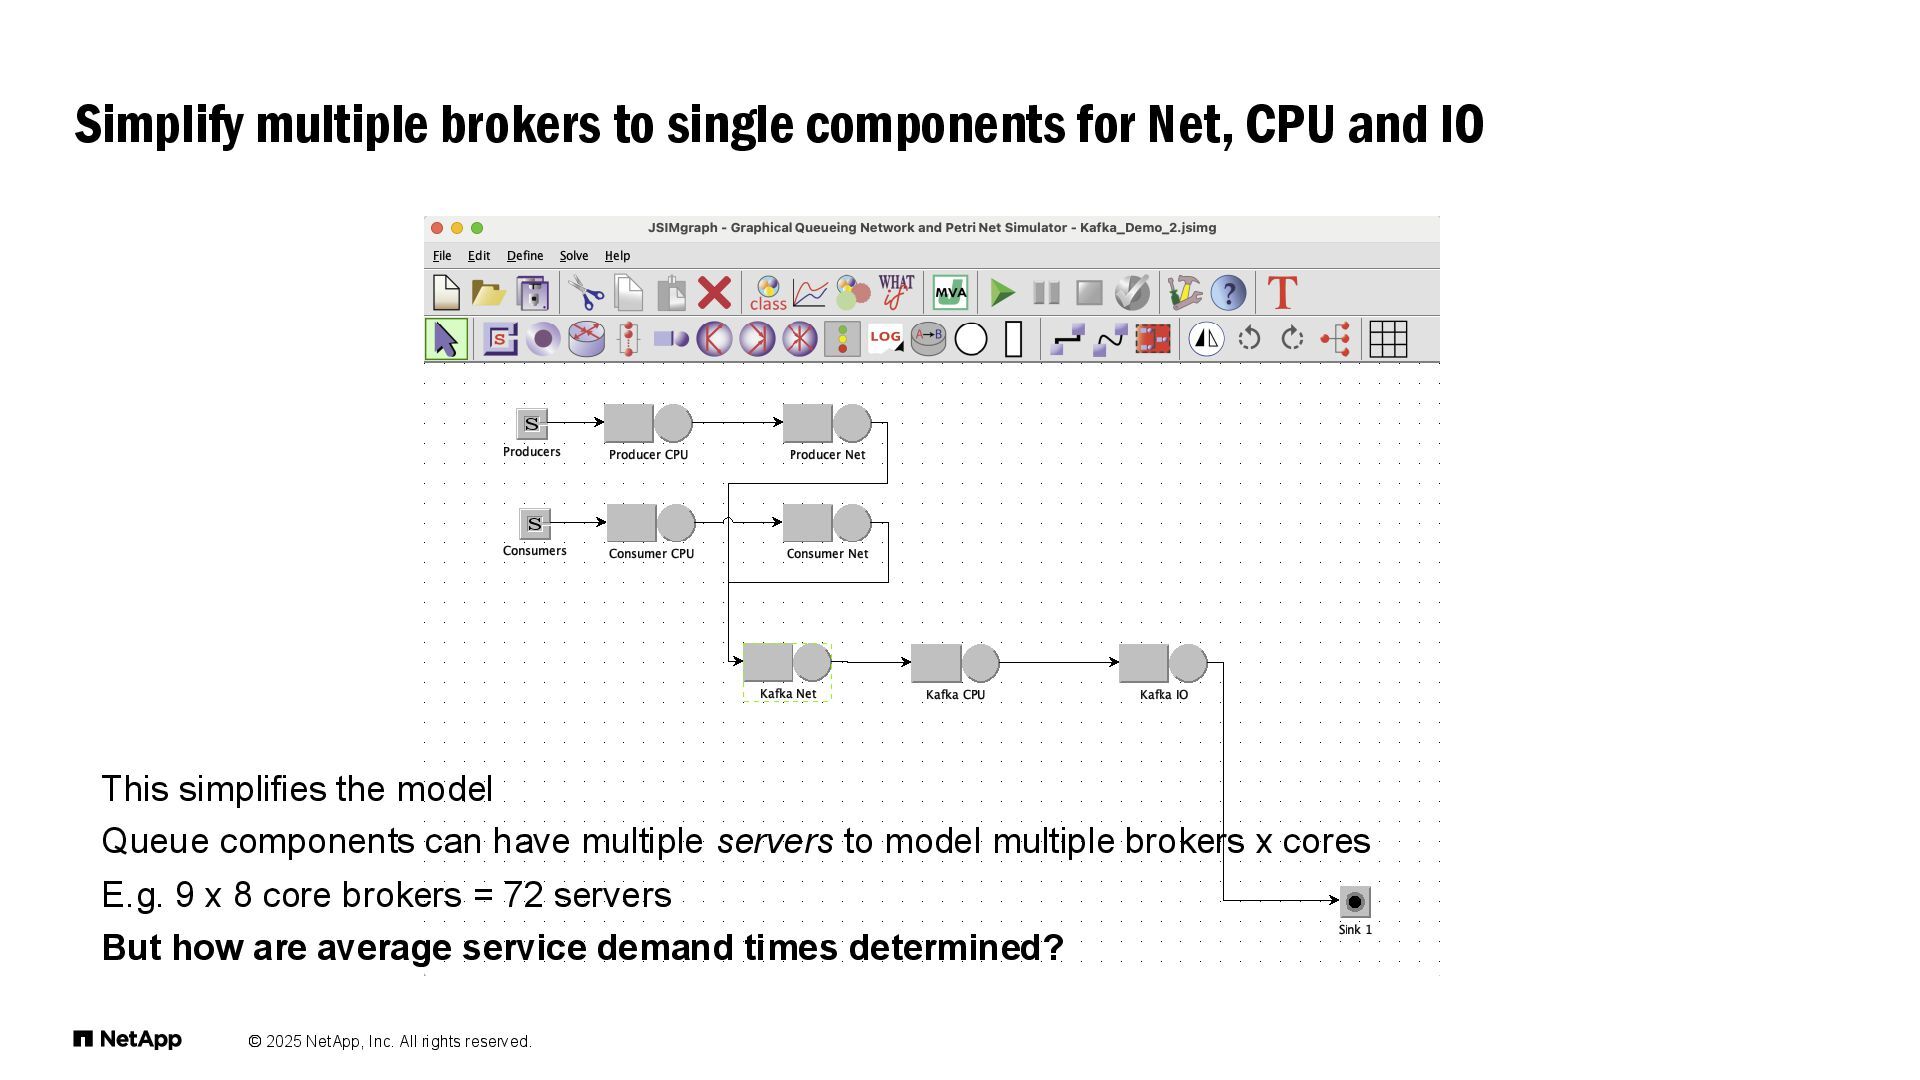
    to single components for Net, CPU and IO This simplifies the model Queue components can have multiple servers to model multiple brokers x cores E.g. 9 x 8 core brokers = 72 servers But how are average service demand times determined?
  59. © 2025 NetApp, Inc. All rights reserved. Simplest possible model

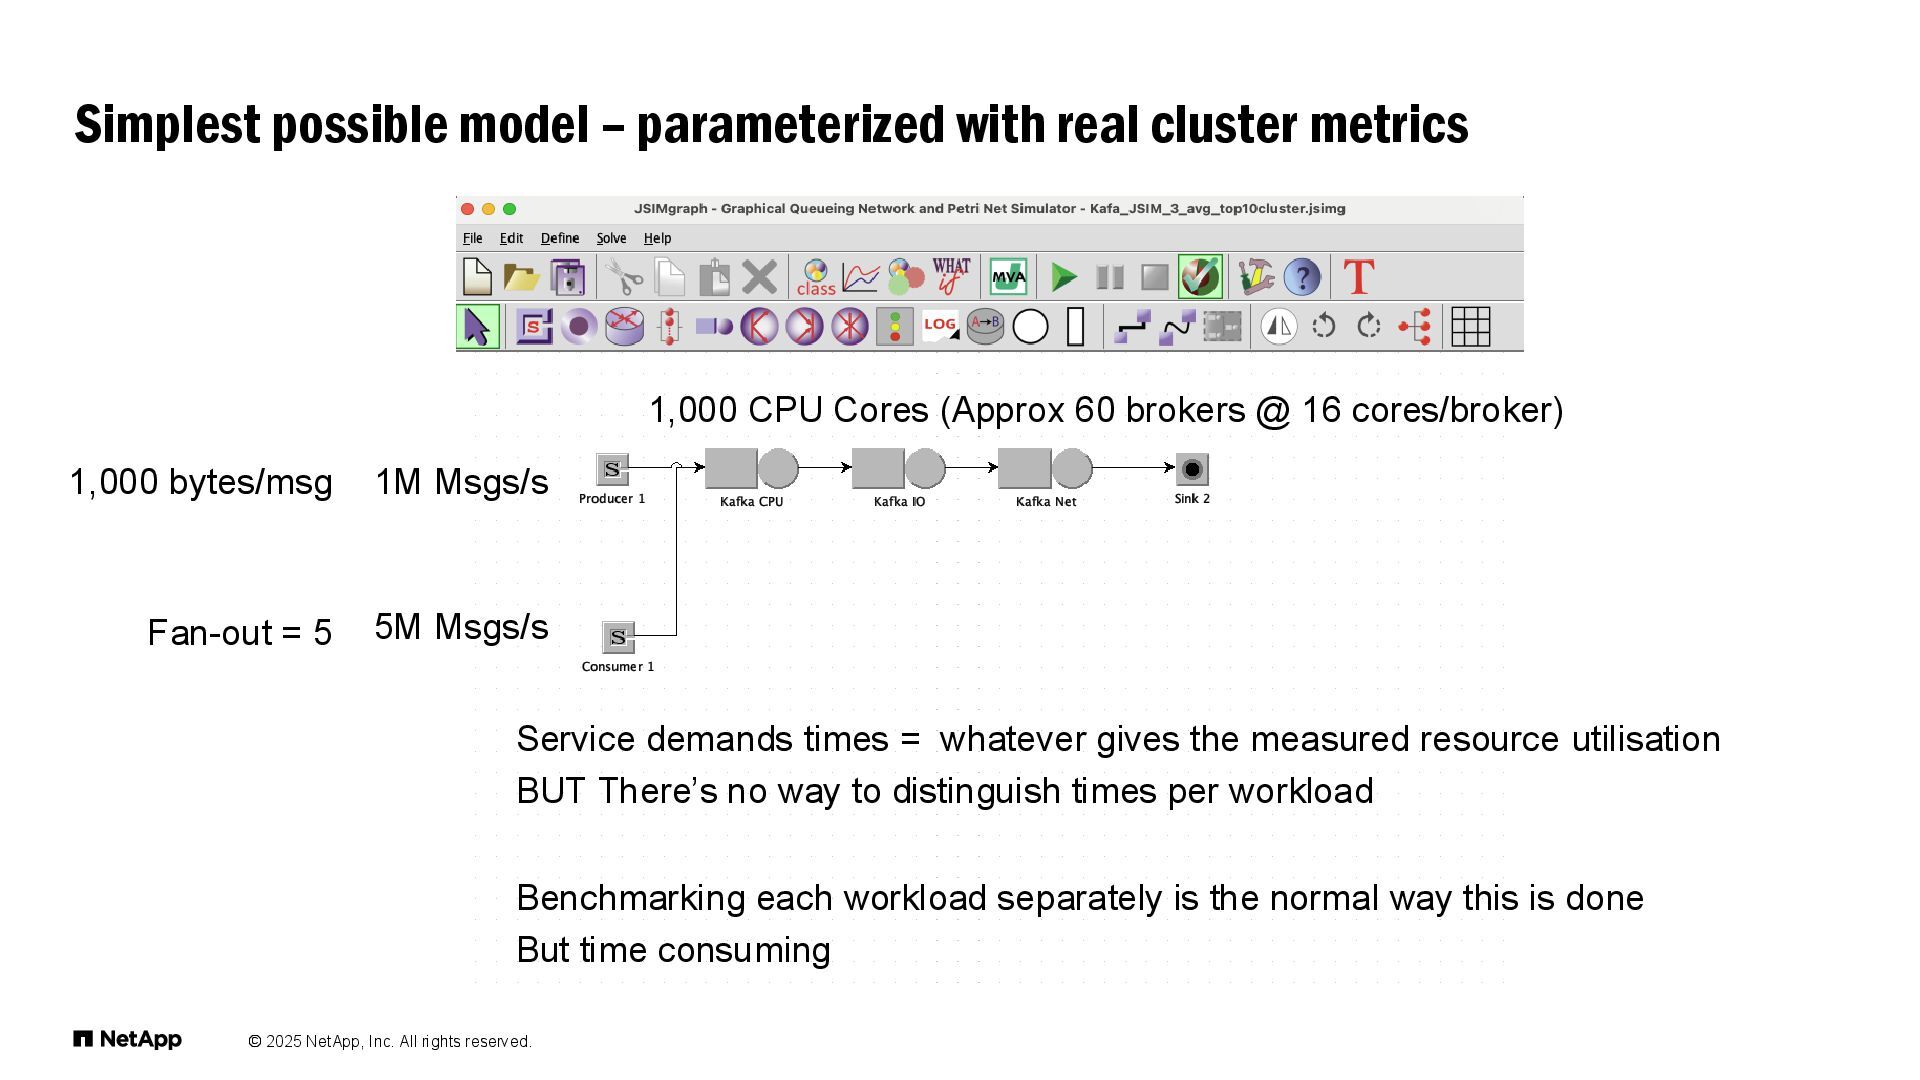
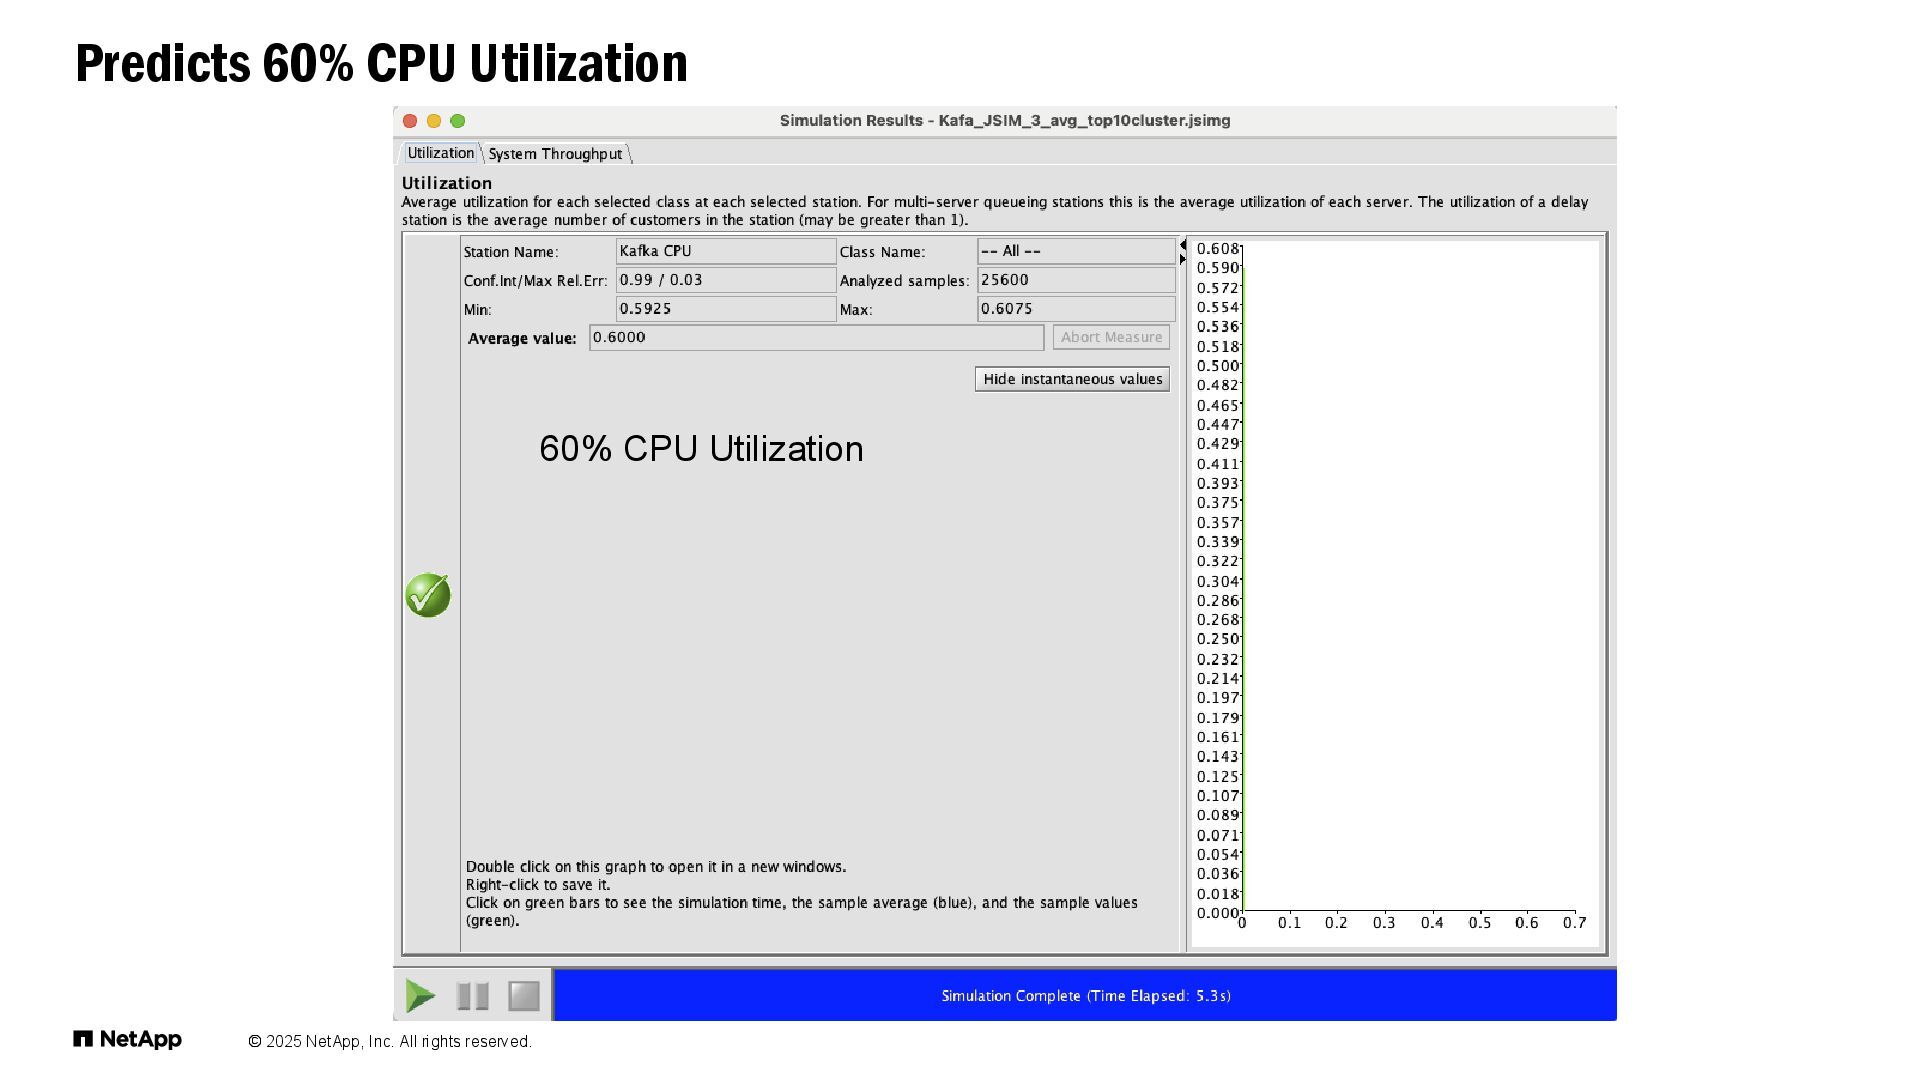
    – parameterized with real cluster metrics 1M Msgs/s 5M Msgs/s 1,000 CPU Cores (Approx 60 brokers @ 16 cores/broker) Fan-out = 5 1,000 bytes/msg Service demands times = whatever gives the measured resource utilisation BUT There’s no way to distinguish times per workload Benchmarking each workload separately is the normal way this is done But time consuming
  60. © 2025 NetApp, Inc. All rights reserved. Simplest possible Kafka

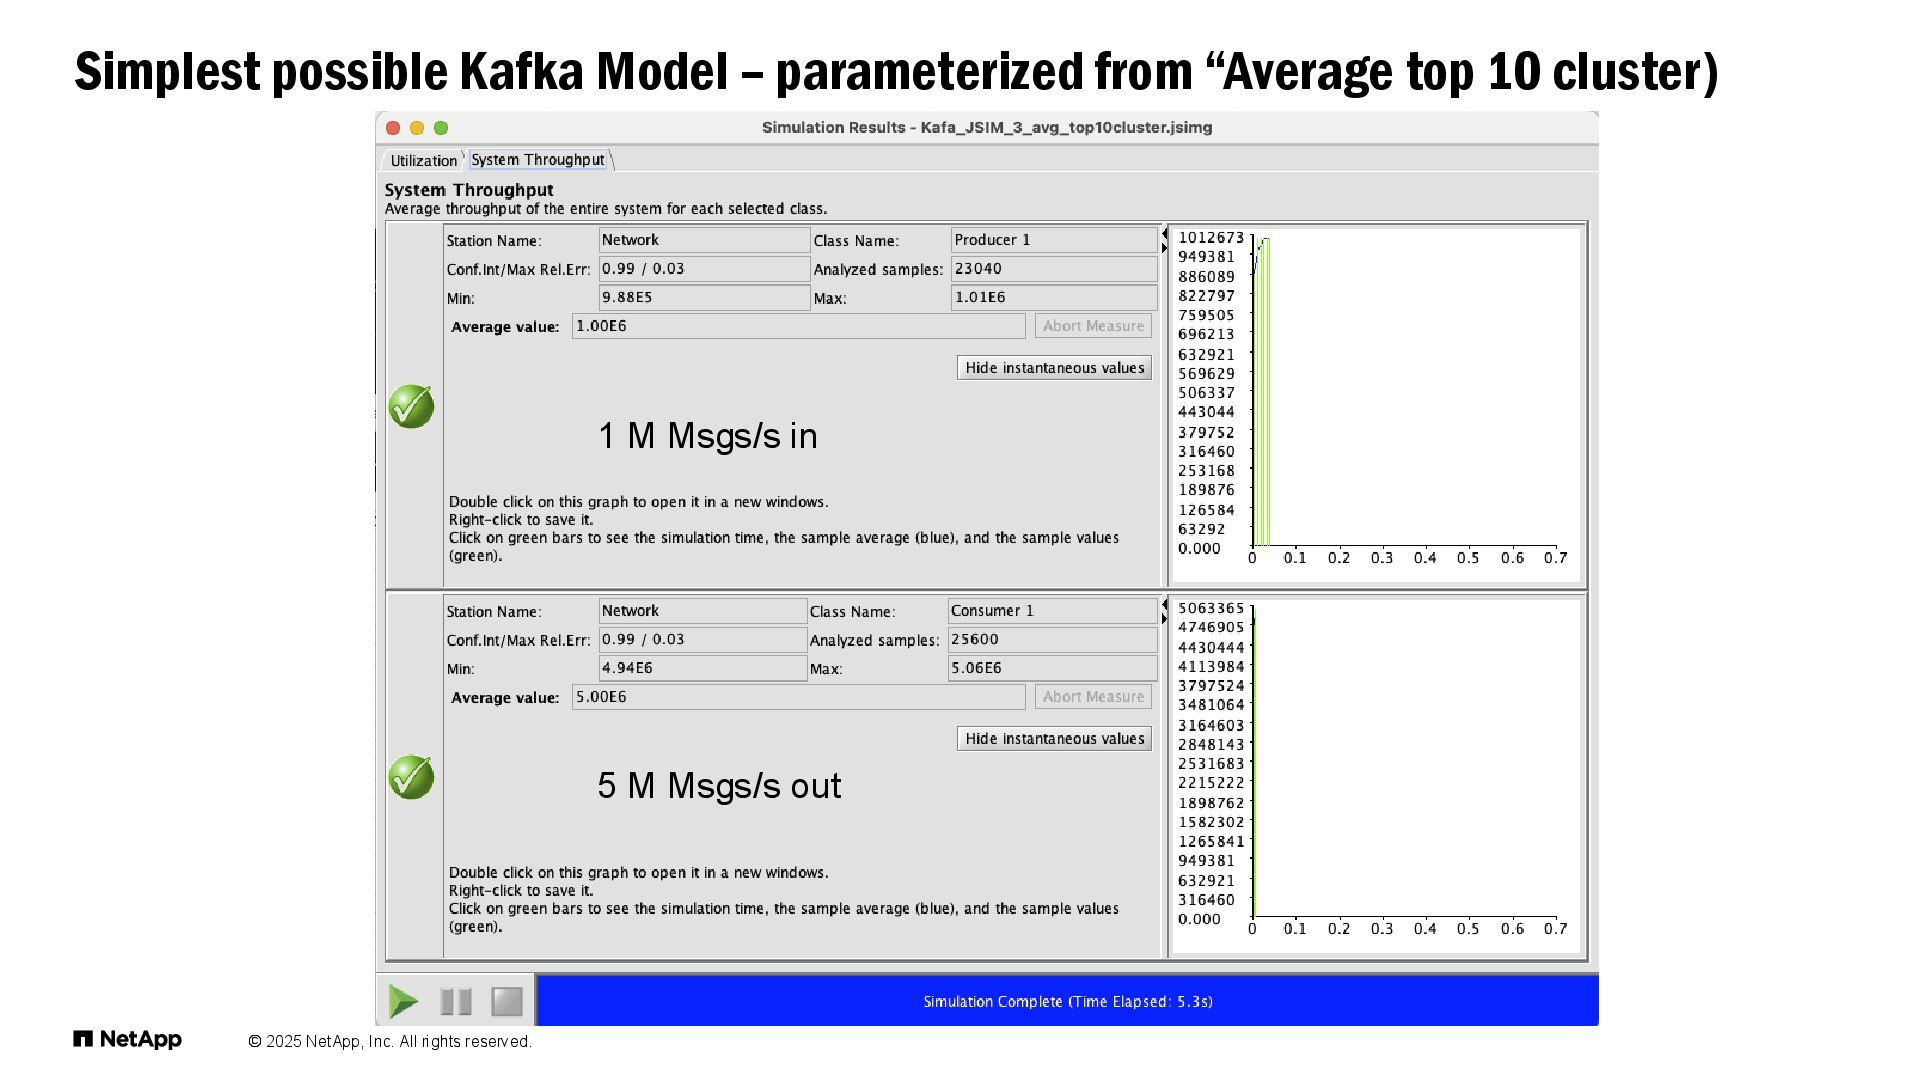
    Model – parameterized from “Average top 10 cluster) 1 M Msgs/s in 5 M Msgs/s out
  61. © 2025 NetApp, Inc. All rights reserved. Performance Modelling Tool:

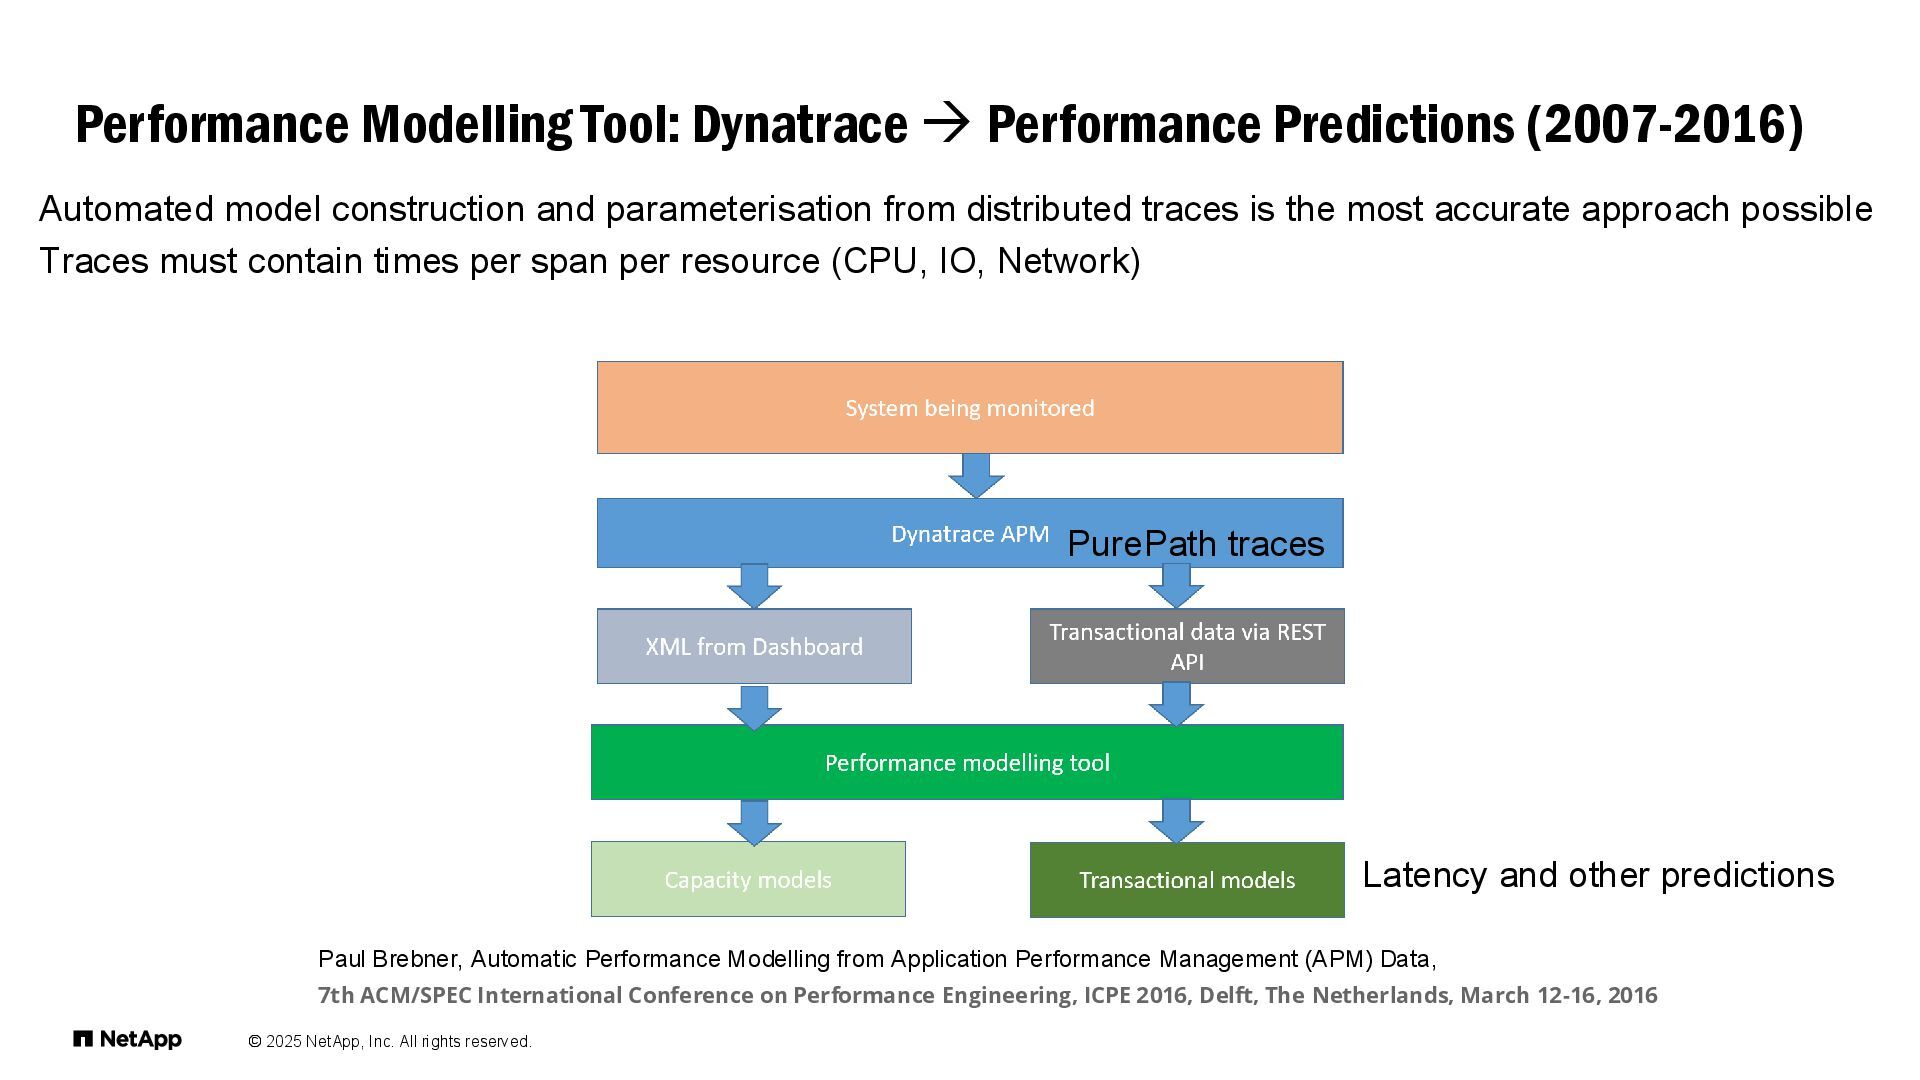
    Dynatrace → Performance Predictions (2007-2016) Paul Brebner, Automatic Performance Modelling from Application Performance Management (APM) Data, 7th ACM/SPEC International Conference on Performance Engineering, ICPE 2016, Delft, The Netherlands, March 12-16, 2016 PurePath traces Latency and other predictions Automated model construction and parameterisation from distributed traces is the most accurate approach possible Traces must contain times per span per resource (CPU, IO, Network)
  62. © 2025 NetApp, Inc. All rights reserved. Performance Modelling Tool

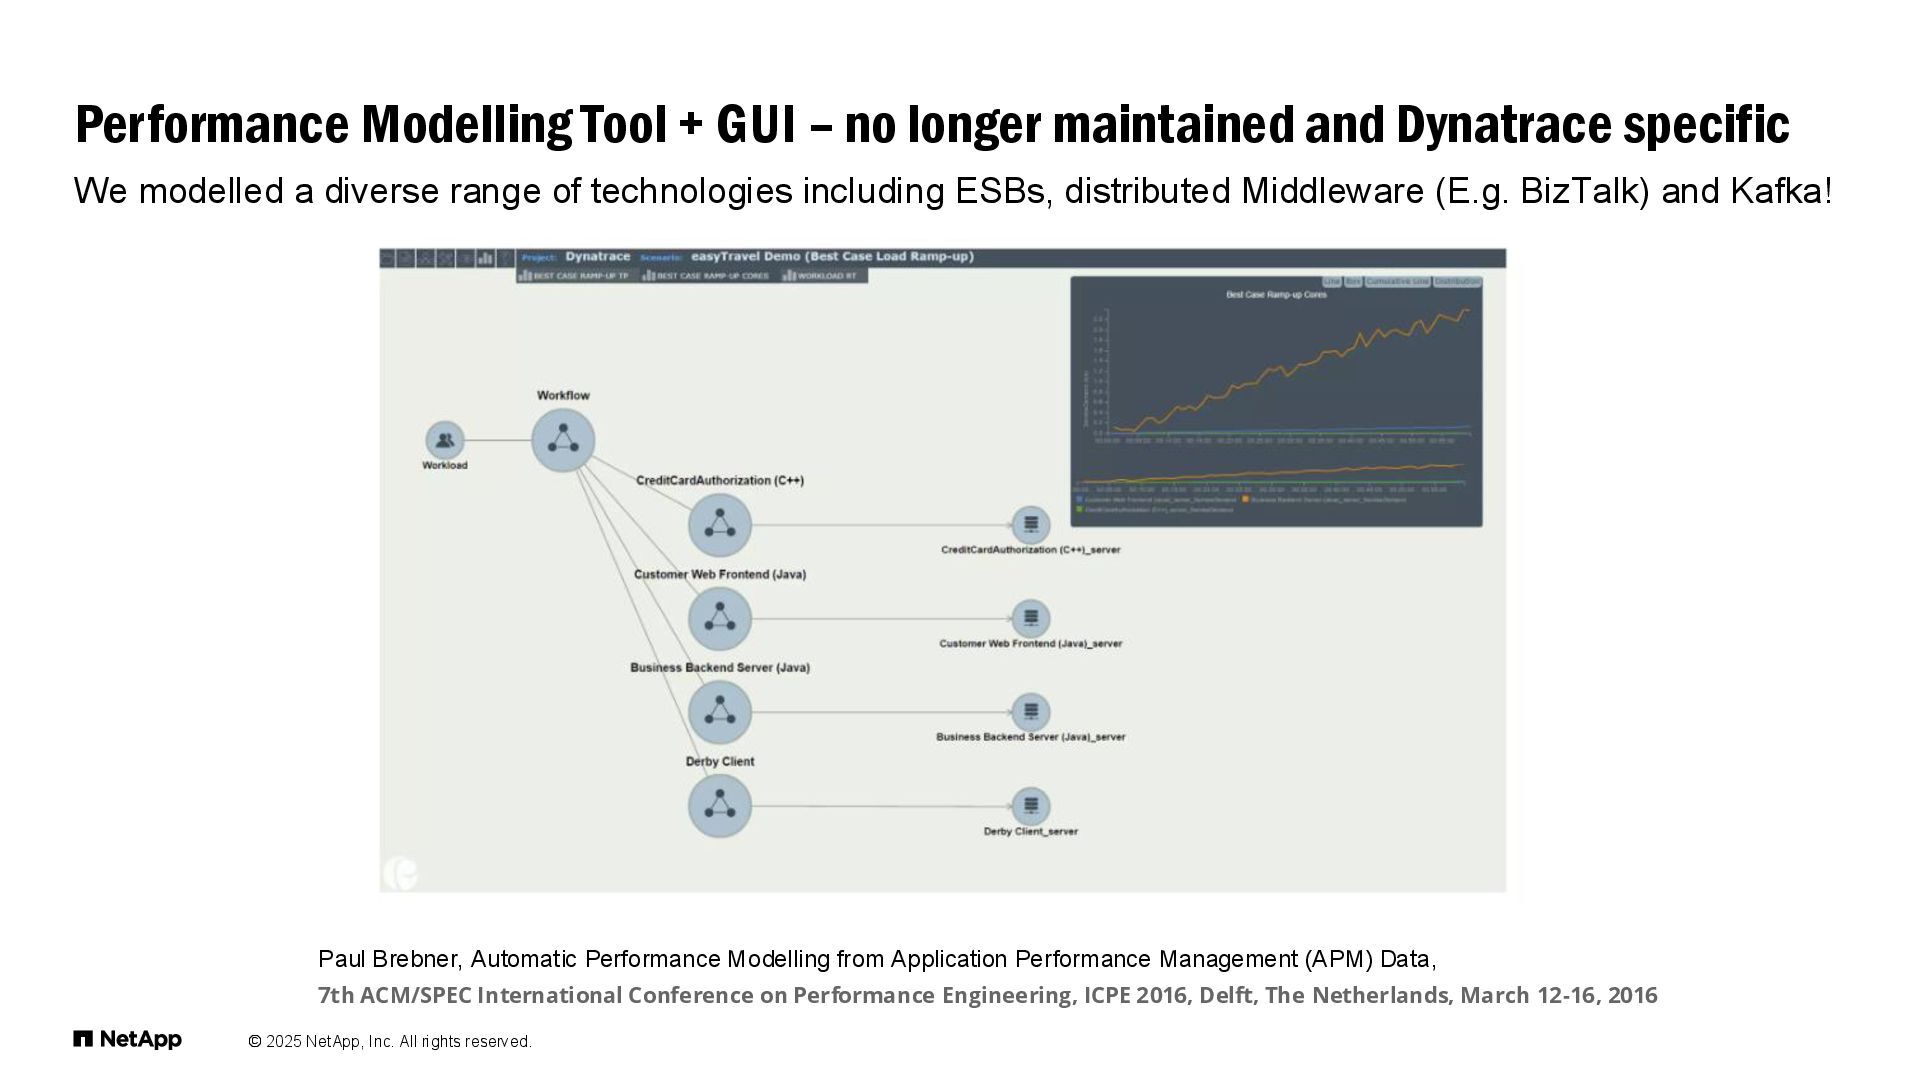
    + GUI – no longer maintained and Dynatrace specific Paul Brebner, Automatic Performance Modelling from Application Performance Management (APM) Data, 7th ACM/SPEC International Conference on Performance Engineering, ICPE 2016, Delft, The Netherlands, March 12-16, 2016 We modelled a diverse range of technologies including ESBs, distributed Middleware (E.g. BizTalk) and Kafka!
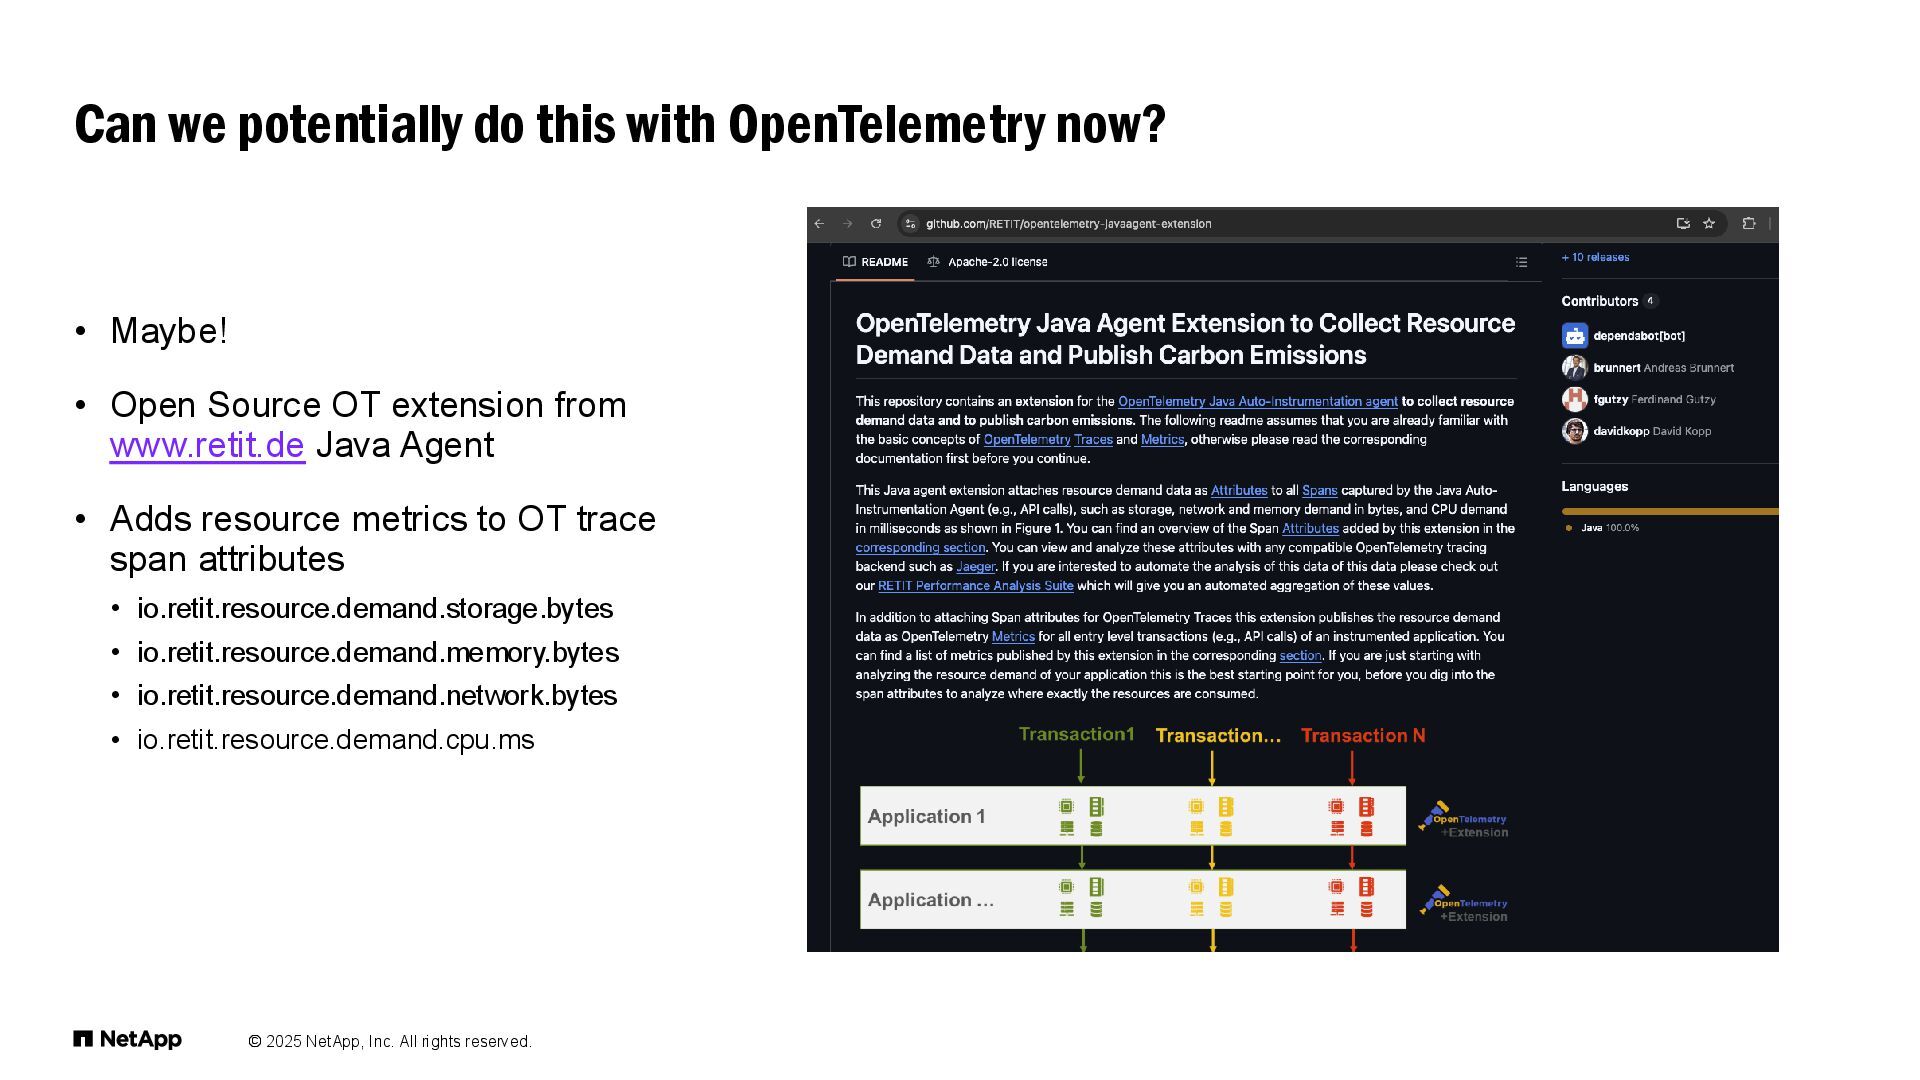
  63. © 2025 NetApp, Inc. All rights reserved. • Maybe! •

    Open Source OT extension from www.retit.de Java Agent • Adds resource metrics to OT trace span attributes • io.retit.resource.demand.storage.bytes • io.retit.resource.demand.memory.bytes • io.retit.resource.demand.network.bytes • io.retit.resource.demand.cpu.ms Can we potentially do this with OpenTelemetry now?
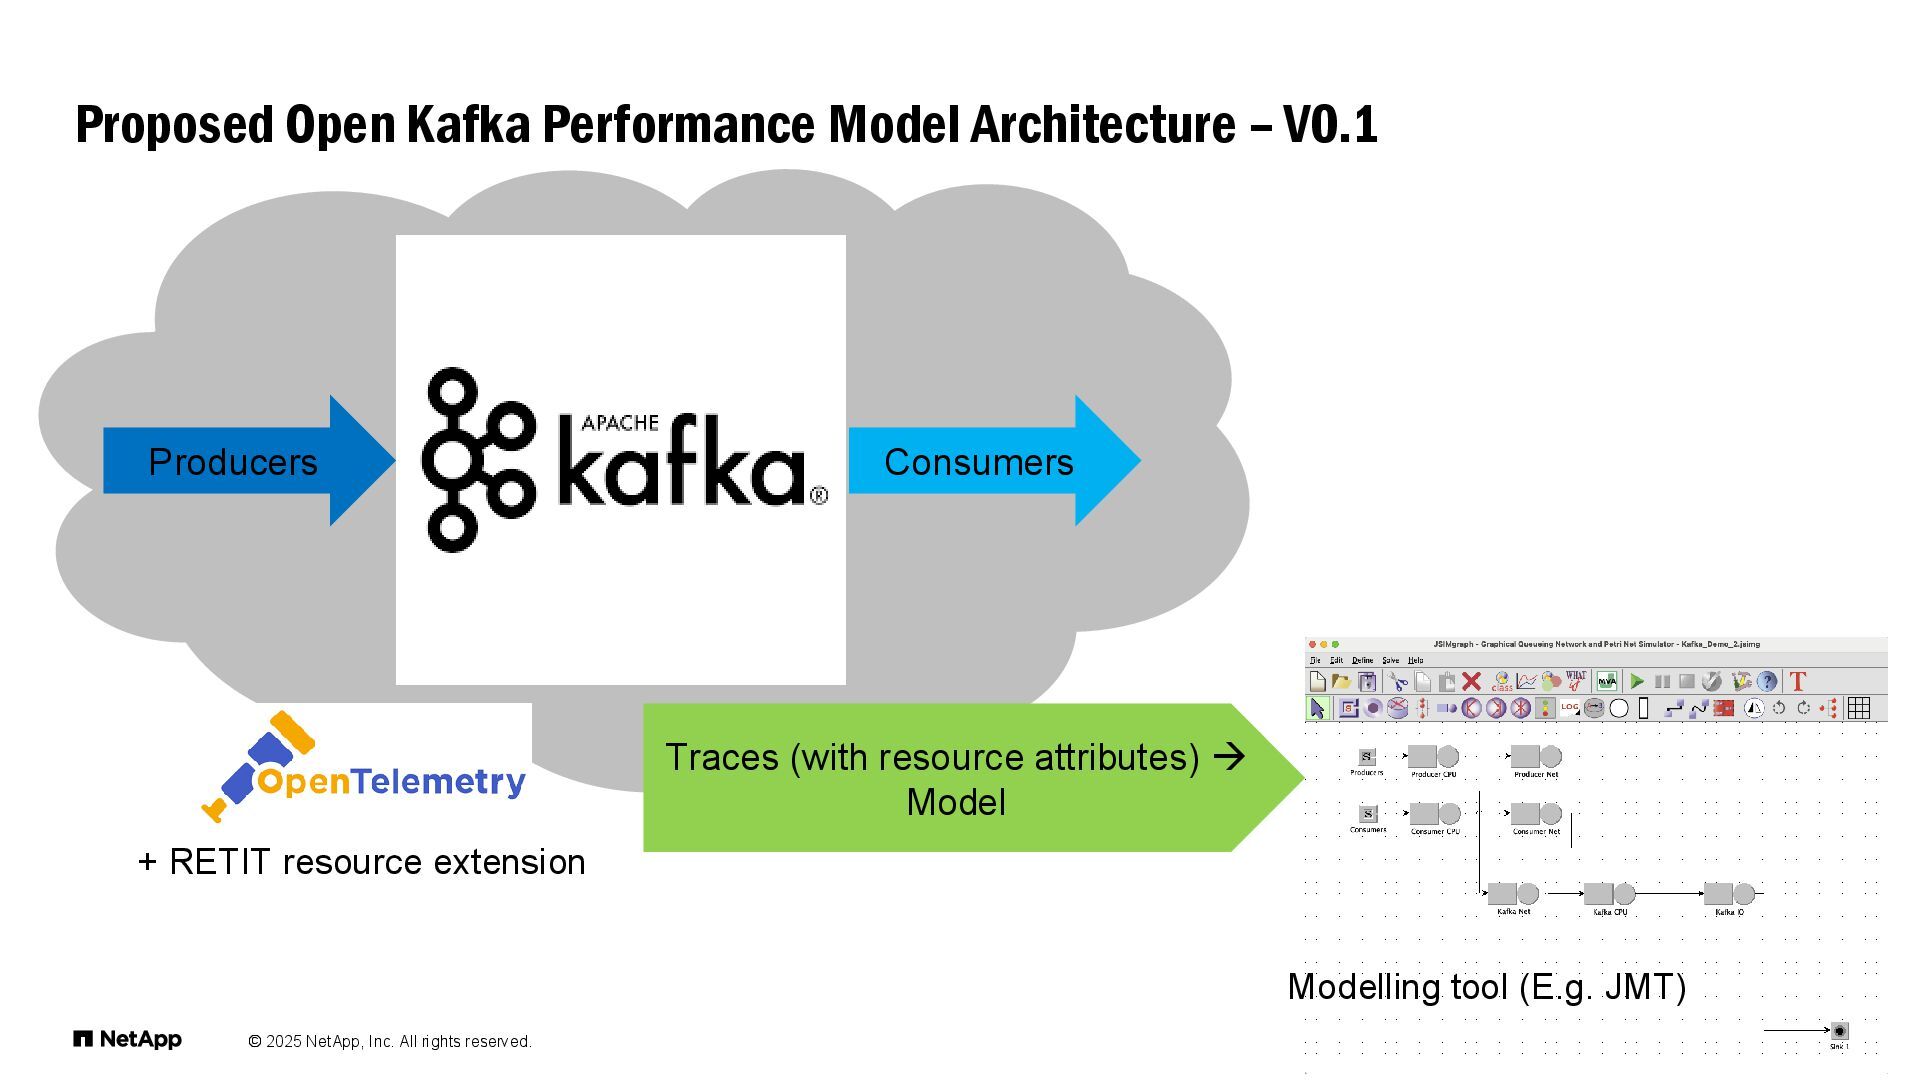
  64. © 2025 NetApp, Inc. All rights reserved. Proposed Open Kafka

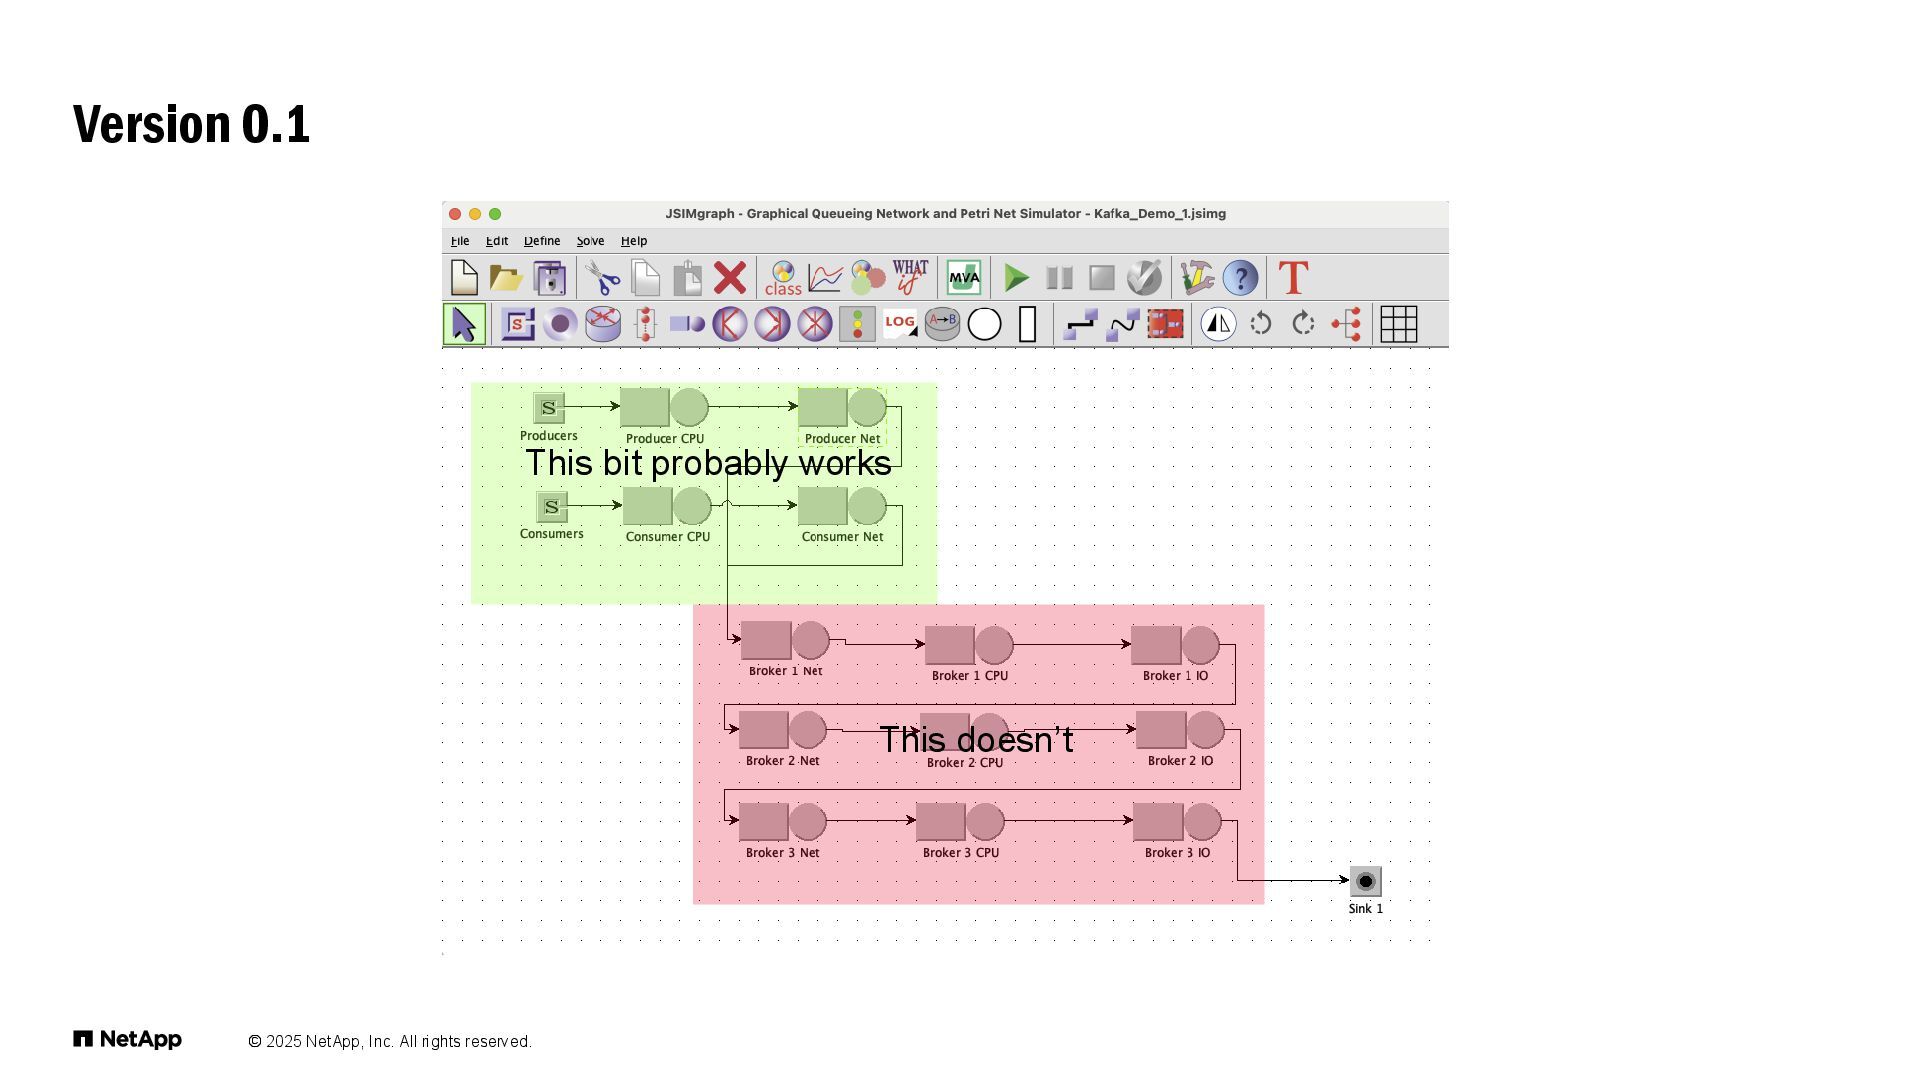
    Performance Model Architecture – V0.1 Producers Consumers + RETIT resource extension Traces (with resource attributes) → Model Modelling tool (E.g. JMT)
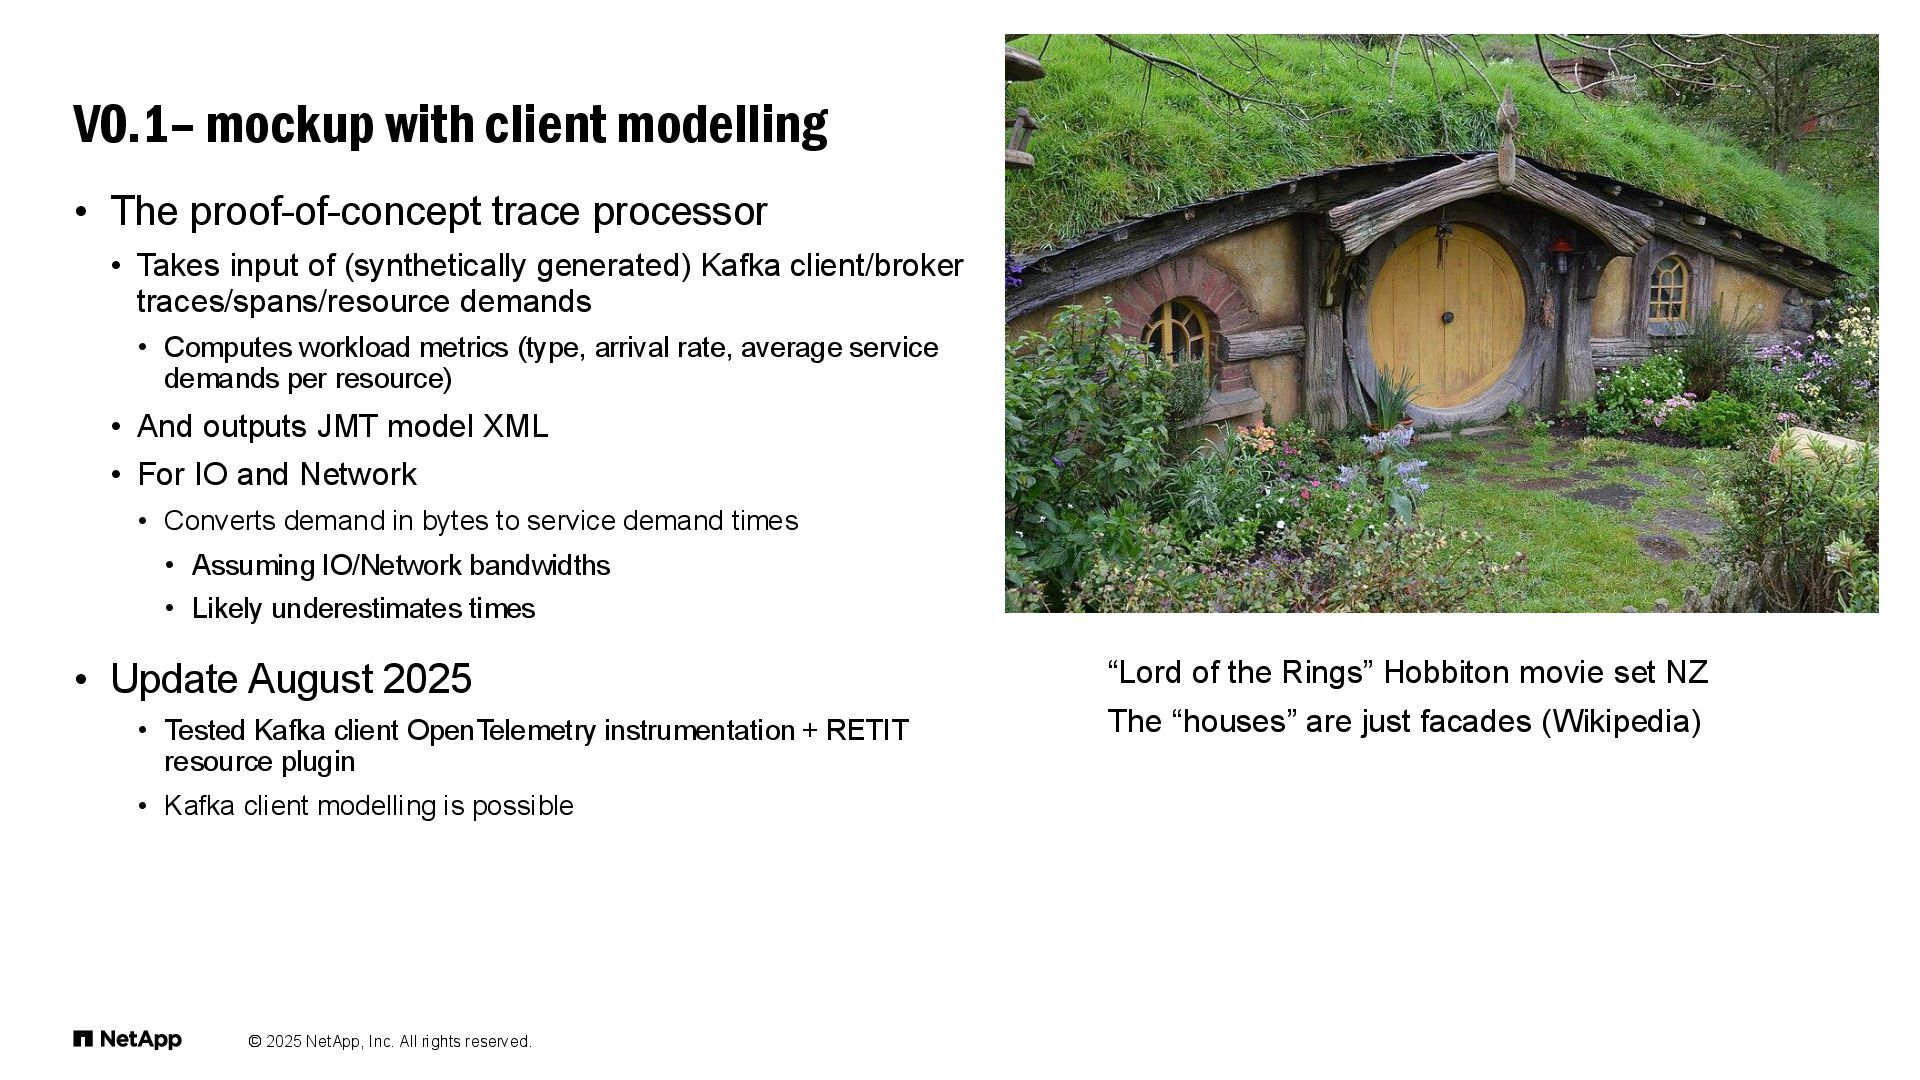
  65. © 2025 NetApp, Inc. All rights reserved. • The proof-of-concept

    trace processor • Takes input of (synthetically generated) Kafka client/broker traces/spans/resource demands • Computes workload metrics (type, arrival rate, average service demands per resource) • And outputs JMT model XML • For IO and Network • Converts demand in bytes to service demand times • Assuming IO/Network bandwidths • Likely underestimates times • Update August 2025 • Tested Kafka client OpenTelemetry instrumentation + RETIT resource plugin • Kafka client modelling is possible V0.1– mockup with client modelling “Lord of the Rings” Hobbiton movie set NZ The “houses” are just facades (Wikipedia)
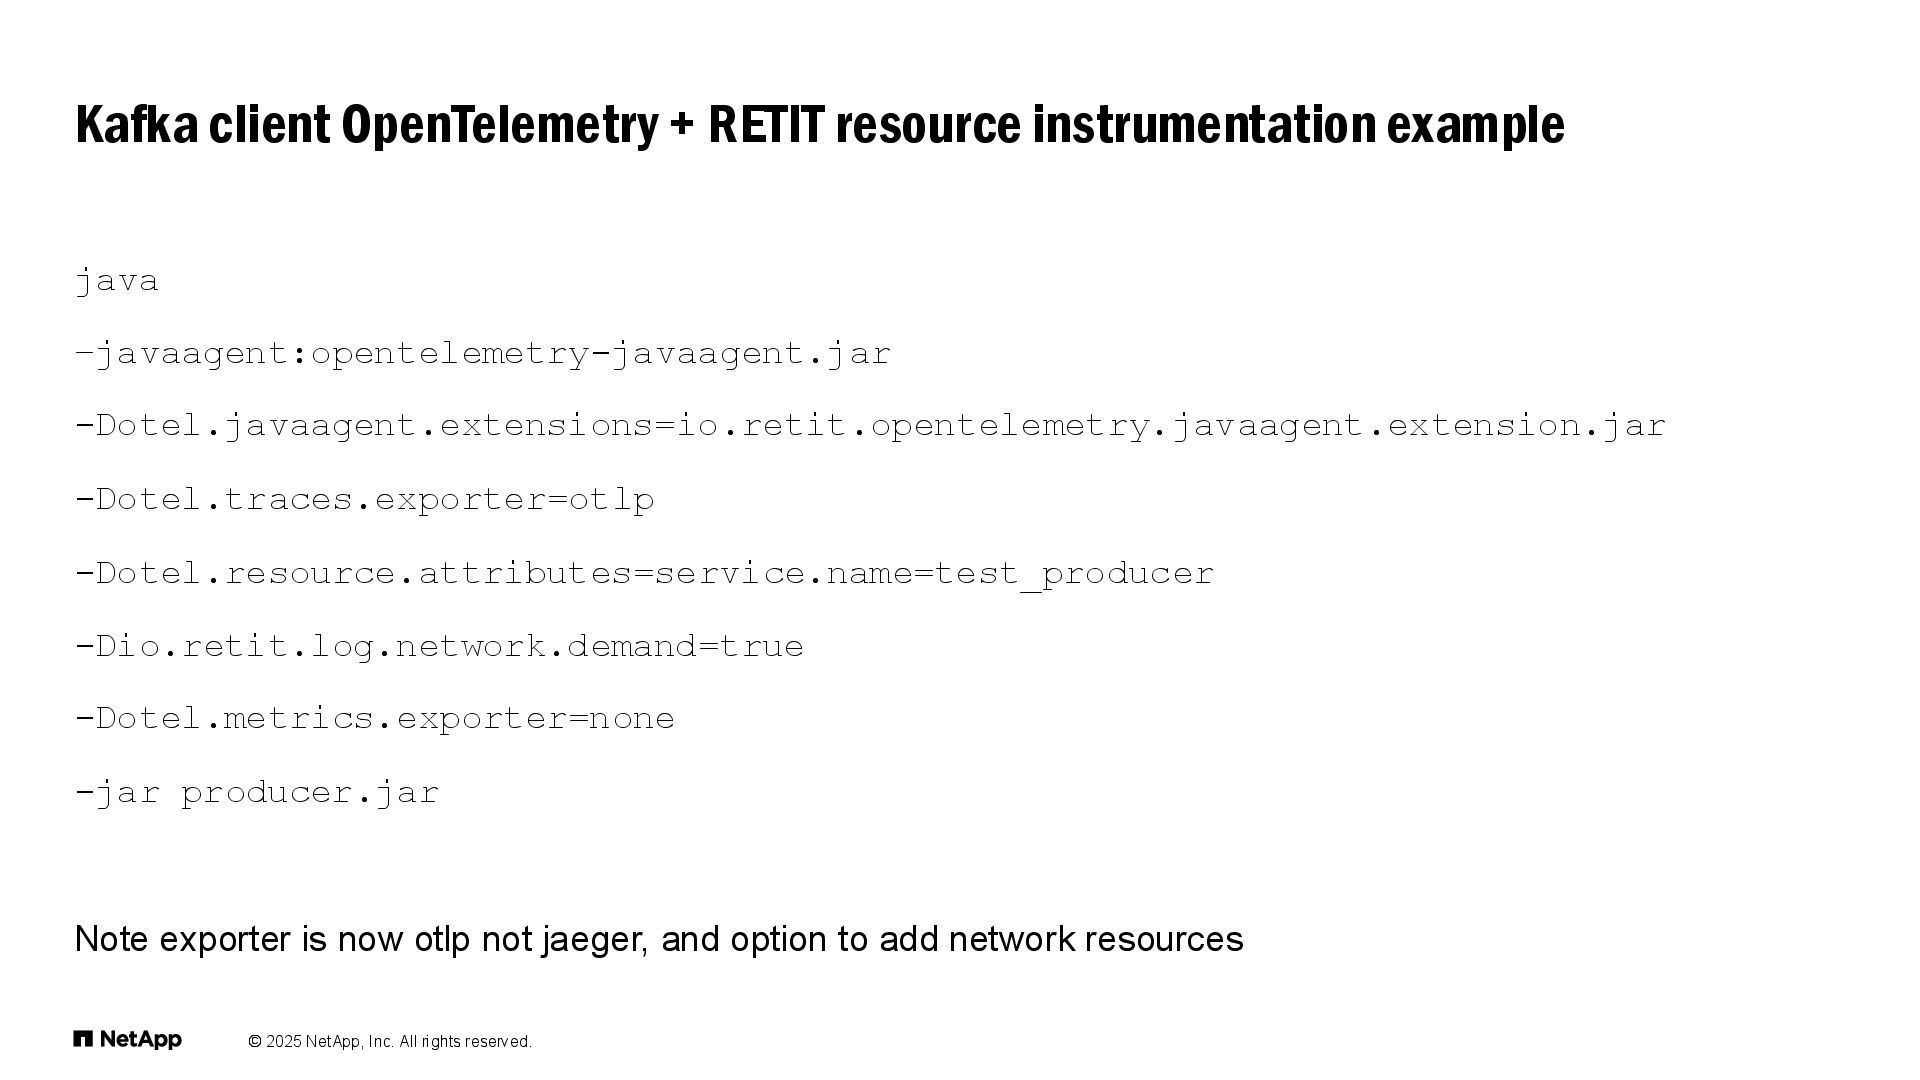
  66. © 2025 NetApp, Inc. All rights reserved. java –javaagent:opentelemetry-javaagent.jar -Dotel.javaagent.extensions=io.retit.opentelemetry.javaagent.extension.jar

    -Dotel.traces.exporter=otlp -Dotel.resource.attributes=service.name=test_producer -Dio.retit.log.network.demand=true -Dotel.metrics.exporter=none -jar producer.jar Note exporter is now otlp not jaeger, and option to add network resources Kafka client OpenTelemetry + RETIT resource instrumentation example
  67. © 2025 NetApp, Inc. All rights reserved. • Model partitions+replication

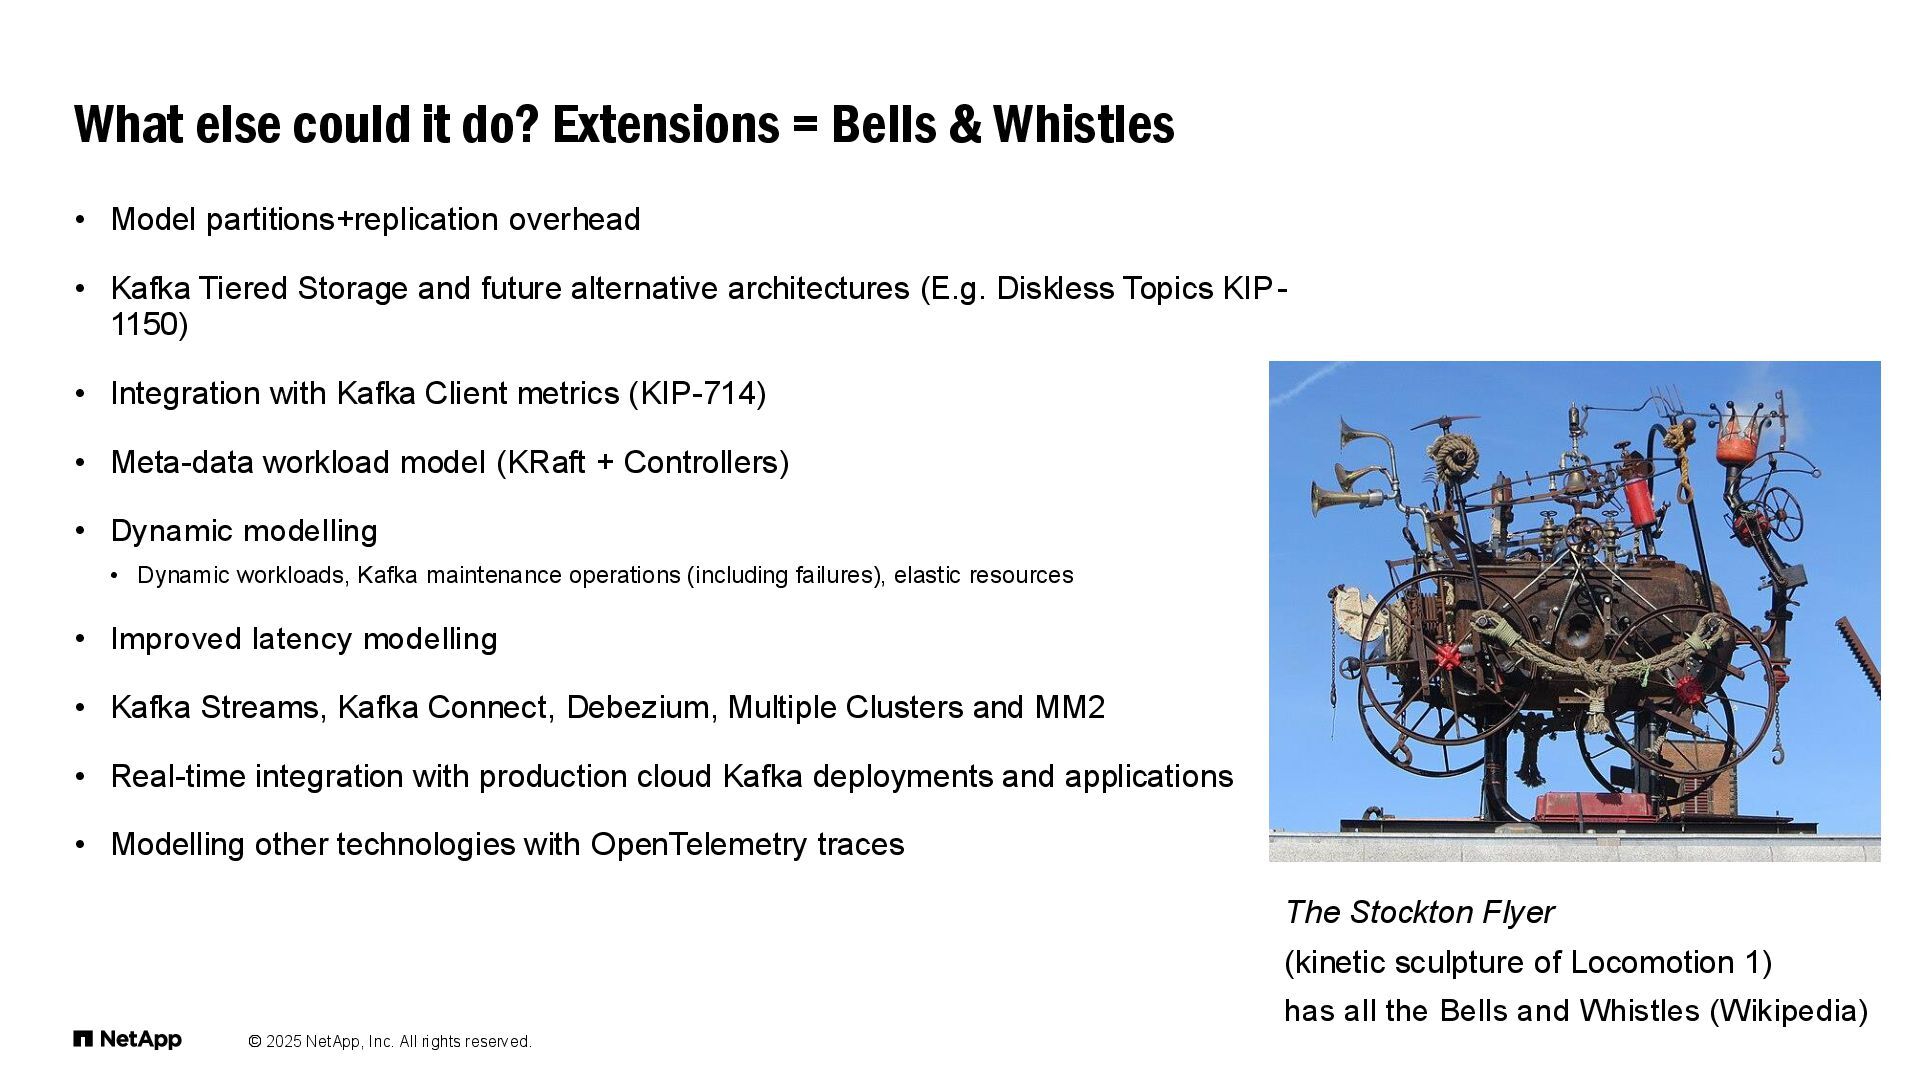
    overhead • Kafka Tiered Storage and future alternative architectures (E.g. Diskless Topics KIP- 1150) • Integration with Kafka Client metrics (KIP-714) • Meta-data workload model (KRaft + Controllers) • Dynamic modelling • Dynamic workloads, Kafka maintenance operations (including failures), elastic resources • Improved latency modelling • Kafka Streams, Kafka Connect, Debezium, Multiple Clusters and MM2 • Real-time integration with production cloud Kafka deployments and applications • Modelling other technologies with OpenTelemetry traces What else could it do? Extensions = Bells & Whistles The Stockton Flyer (kinetic sculpture of Locomotion 1) has all the Bells and Whistles (Wikipedia)
  68. THANK YOU Blogs Instaclustr.com/paul-brebner Try us out! 30 day free

    no obligation trials of Apache Kafka, Apache Cassandra, PostgreSQL, Cadence, OpenSearch & ClickHouse LinkedIn © 2025 NetApp, Inc. All rights reserved.