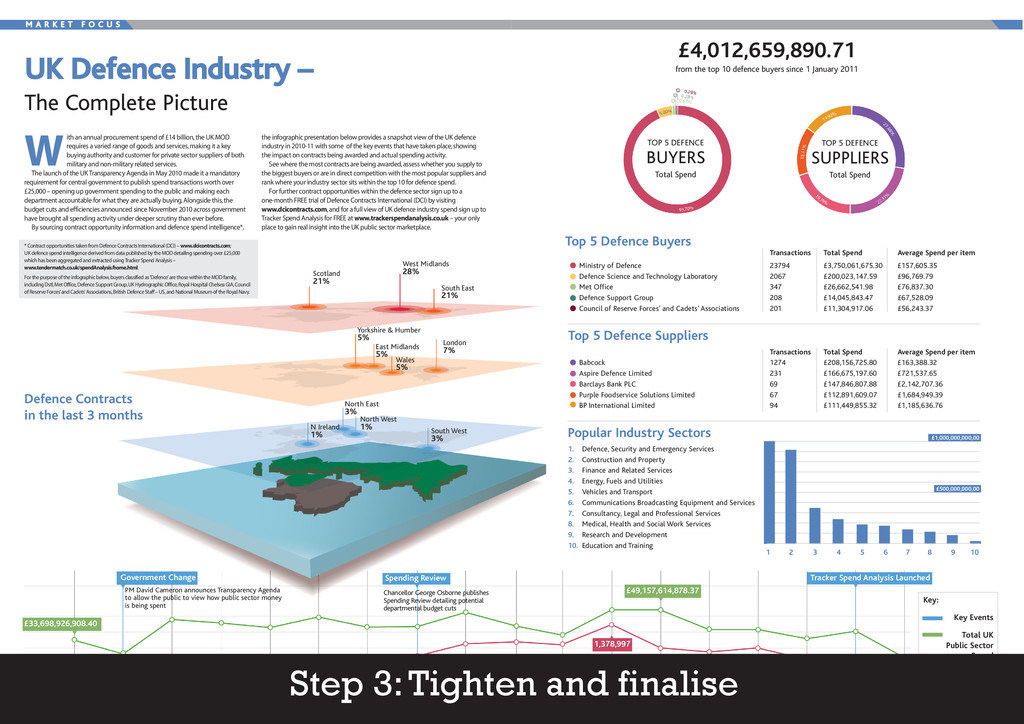
Total Spend £4,012,659,890.71 from the top 10 defence buyers since 1 January 2011 1 2 3 4 5 6 7 8 9 10 Transactions Total Spend Average Spend per item Ministry of Defence 23794 £3,750,061,675.30 £157,605.35 Defence Science and Technology Laboratory 2067 £200,023,147.59 £96,769.79 Met Office 347 £26,662,541.98 £76,837.30 Defence Support Group 208 £14,045,843.47 £67,528.09 Council of Reserve Forces’ and Cadets’ Associations 201 £11,304,917.06 £56,243.37 Transactions Total Spend Average Spend per item Babcock 1274 £208,156,725.80 £163,388.32 Aspire Defence Limited 231 £166,675,197.60 £721,537.65 Barclays Bank PLC 69 £147,846,807.88 £2,142,707.36 Purple Foodservice Solutions Limited 67 £112,891,609.07 £1,684,949.39 BP International Limited 94 £111,449,855.32 £1,185,636.76 1. Defence, Security and Emergency Services 2. Construction and Property 3. Finance and Related Services 4. Energy, Fuels and Utilities 5. Vehicles and Transport 6. Communications Broadcasting Equipment and Services 7. Consultancy, Legal and Professional Services 8. Medical, Health and Social Work Services 9. Research and Development 10. Education and Training 1,378,997 £49,157,614,878.37 Tracker Spend Analysis Launched Key: Key Events Total UK Public Sector Spend Transactions M A R K E T F O C U S www.contracts.mod.uk :: Vol 9 No 24 :: 30 November 2011 :: MOD DCB :: 15 ith an annual procurement spend of £14 billion,the UK MOD requires a varied range of goods and services,making it a key buying authority and customer for private sector suppliers of both military and non-military related services. The launch of the UK Transparency Agenda in May 2010 made it a mandatory requirement for central government to publish spend transactions worth over £25,000 – opening up government spending to the public and making each department accountable for what they are actually buying.Alongside this,the budget cuts and efficiencies announced since November 2010 across government have brought all spending activity under deeper scrutiny than ever before. By sourcing contract opportunity information and defence spend intelligence*, the infographic presentation below provides a snapshot view of the UK defence industry in 2010-11 with some of the key events that have taken place,showing the impact on contracts being awarded and actual spending activity. See where the most contracts are being awarded,assess whether you supply to the biggest buyers or are in direct competition with the most popular suppliers and rank where your industry sector sits within the top 10 for defence spend. For further contract opportunities within the defence sector sign up to a one-month FREE trial of Defence Contracts International (DCI) by visiting www.dcicontracts.com,and for a full view of UK defence industry spend sign up to Tracker Spend Analysis for FREE at www.trackerspendanalysis.co.uk – your only place to gain real insight into the UK public sector marketplace. W UK Defence Industry – The Complete Picture 14 :: MOD DCB :: 30 November 2011 :: Vol 9 No 24 :: www.contracts.mod.uk Government Change PM David Cameron announces Transparency Agenda to allow the public to view how public sector money is being spent £33,698,926,908.40 647,344 Spending Review Chancellor George Osborne publishes Spending Review detailing potential departmental budget cuts Apr 10 May 10 Jun 10 Jul 10 Aug 10 Sep 10 Oct 10 Nov 10 Dec 10 Jan 11 Feb 11 Mar11 Apr 11 May 11 Jun 11 Jul 11 Aug 11 Sep 11 Scotland 21% West Midlands 28% South East 21% Yorkshire & Humber 5% East Midlands 5% Wales 5% London 7% North East 3% North West 1% N Ireland 1% South West 3% Defence Contracts in the last 3 months * Contract opportunities taken from Defence Contracts International (DCI) – www.dcicontracts.com; UK defence spend intelligence derived from data published by the MOD detailing spending over £25,000 which has been aggregated and extracted using Tracker Spend Analysis – www.tendermatch.co.uk/spendAnalysis/home.html. For the purpose of the infographic below,buyers classified as ‘Defence’are those within the MOD family, including Dstl,Met Office,Defence Support Group,UK Hydrographic Office,Royal Hospital Chelsea GIA,Council of Reserve Forces’and Cadets’Associations,British Defence Staff – US,and National Museum of the Royal Navy. Top 5 Defence Buyers Top 5 Defence Suppliers Popular Industry Sectors £1,000,000,000,00 £500,000,000,00 Step 3: Tighten and finalise