Study 1 Investigation Period: August 1 – 31, 2016 Report Date: November 11, 2016 Conducted by: City of Yokohama – Resources and Waste Recycling Bureau, Household Waste Measures Department, Resources and Waste Collection Operation Division Pirika, Inc.
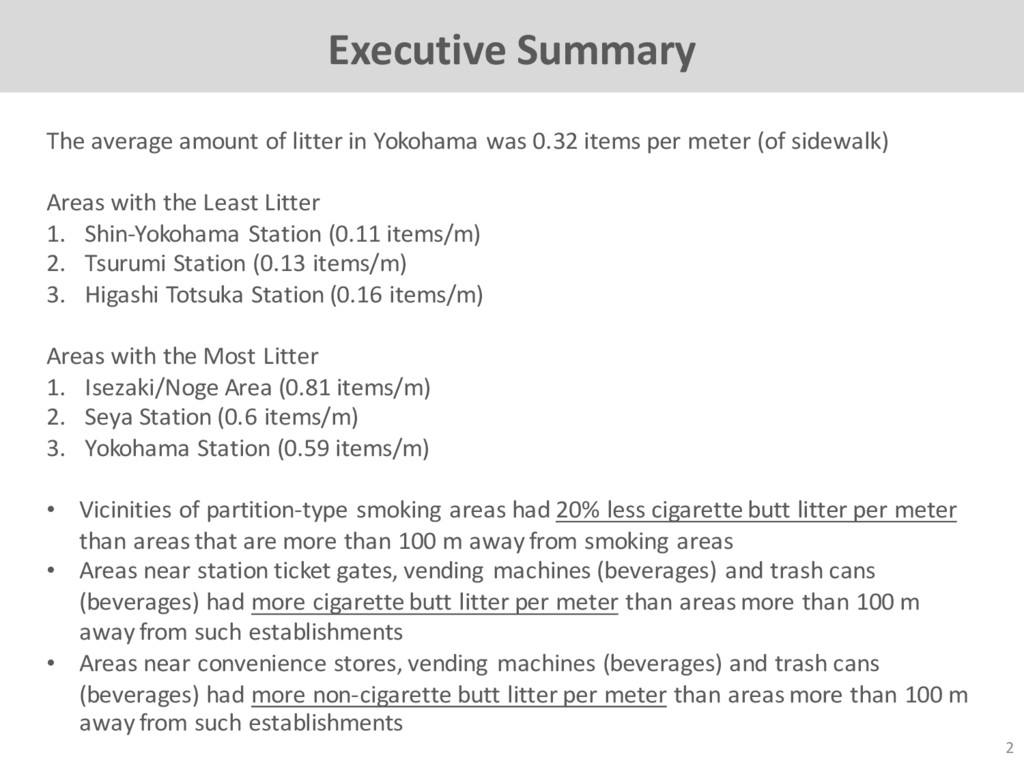
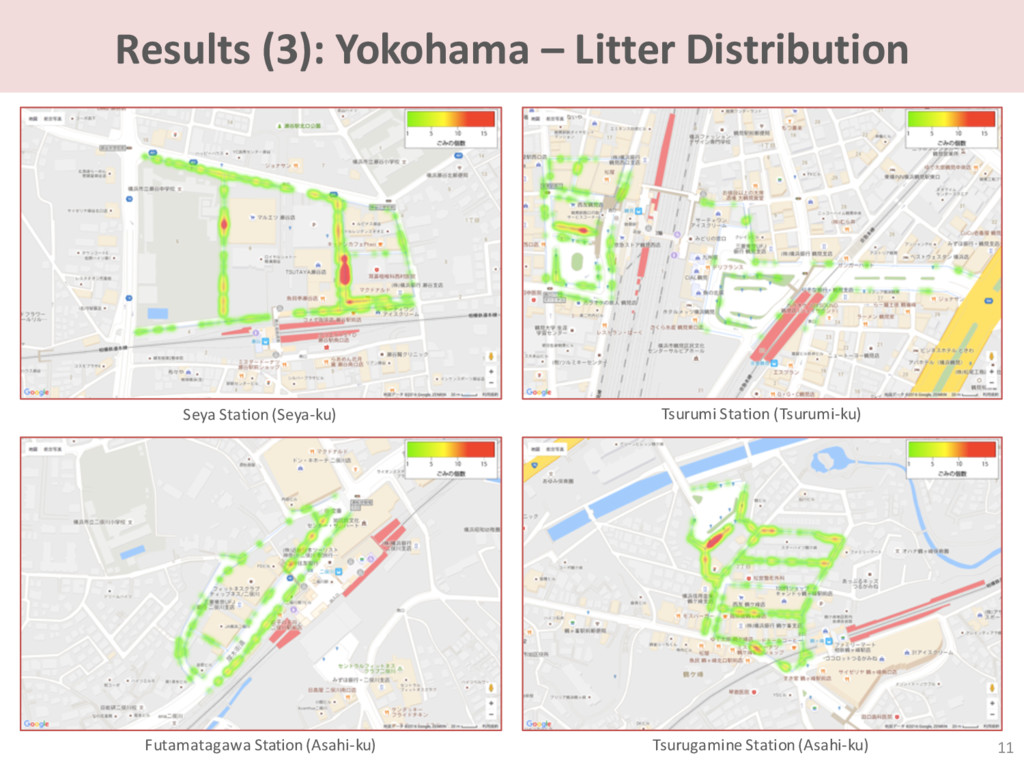
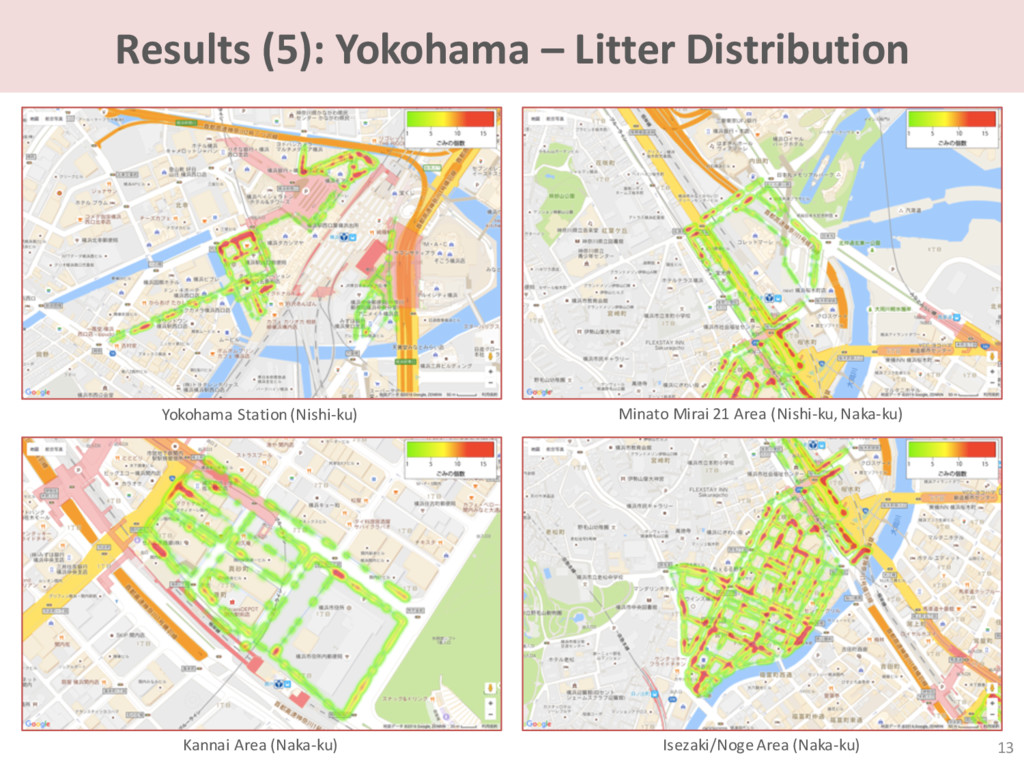
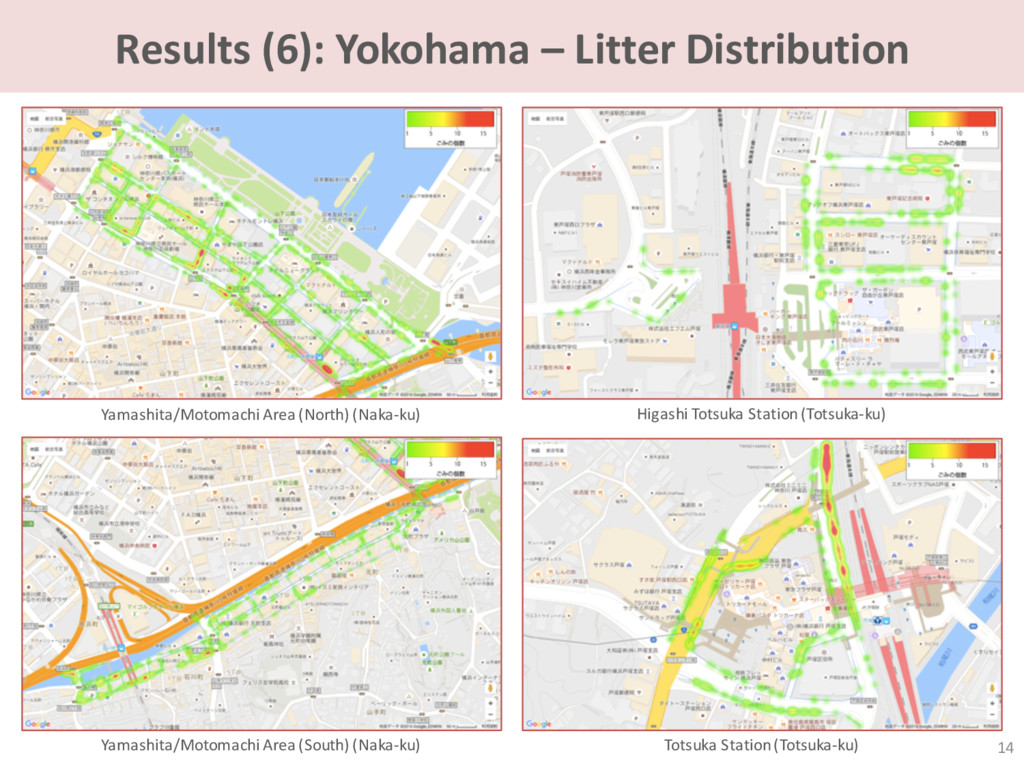
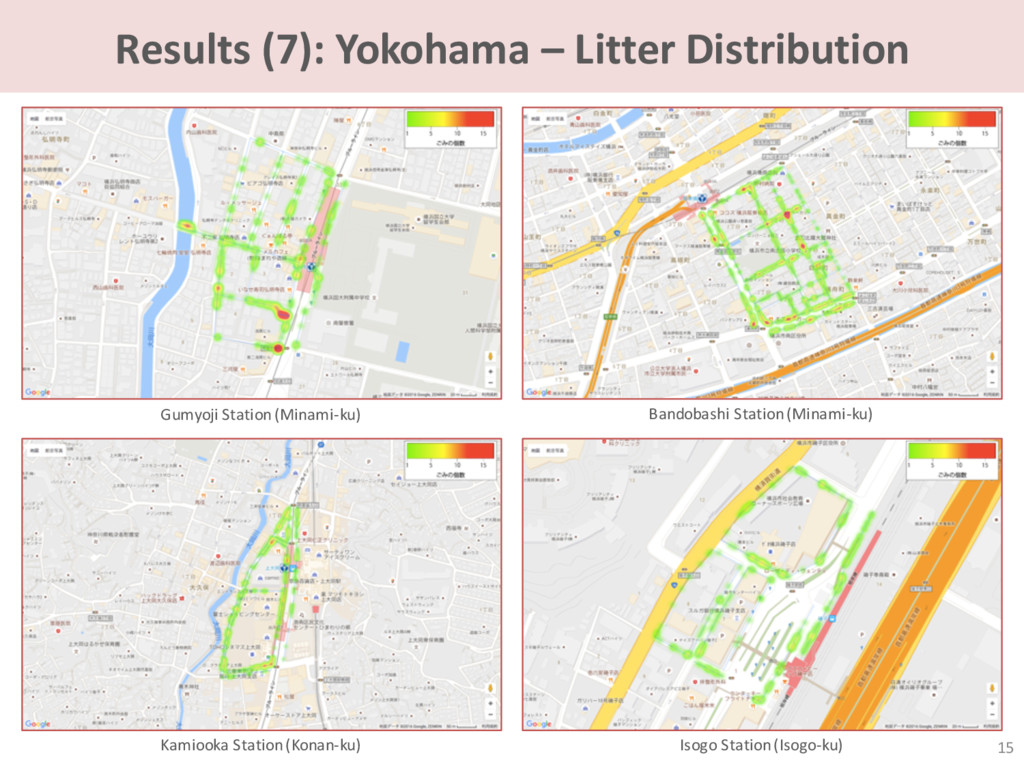
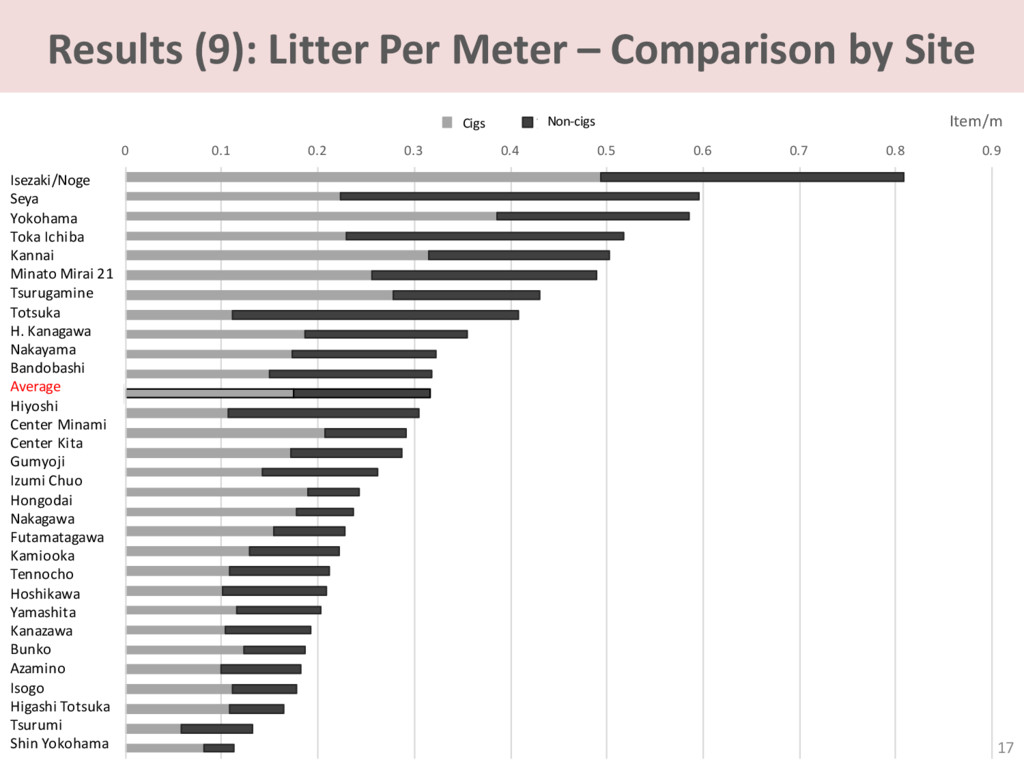
was 0.32 items per meter (of sidewalk) Areas with the Least Litter 1. Shin-Yokohama Station (0.11 items/m) 2. Tsurumi Station (0.13 items/m) 3. Higashi Totsuka Station (0.16 items/m) Areas with the Most Litter 1. Isezaki/Noge Area (0.81 items/m) 2. Seya Station (0.6 items/m) 3. Yokohama Station (0.59 items/m) • Vicinities of partition-type smoking areas had 20% less cigarette butt litter per meter than areas that are more than 100 m away from smoking areas • Areas near station ticket gates, vending machines (beverages) and trash cans (beverages) had more cigarette butt litter per meter than areas more than 100 m away from such establishments • Areas near convenience stores, vending machines (beverages) and trash cans (beverages) had more non-cigarette butt litter per meter than areas more than 100 m away from such establishments
of target research sites 2. Distribution of litter 3. Location factors that may impact litter 4. Regional factors that may be correlated with litter Results 1-8. Yokohama – litter distribution 9. Litter per meter – comparison by site 10. Litter bubble chart Analysis 1. Type of smoking area and impact on amount of cigarette butts 2. Certain factors and cigarette butt litter 3. Certain factors and litter 4-5. Region/area and amount of litter Proposal 1. Selection of focused areas for “patrols” 2. Recognition of beautified areas 3. Citizen participation workshops 4. Research on effects of partitioned smoking areas on inhibition of litter 5. Methods to reduce litter in vicinities of trash cans (beverages) 6. Removal/improvement of potted plants 7. Setting baselines/standards Possibilities for Future Research
of litter and collect related data in Yokohama City to consider effective methods to reduce litter. Overview • We investigated litter distribution in certain key areas of Yokohama City. We thereafter analyzed the potential correlation and cause/effect relationships between certain factors and the amount of litter.
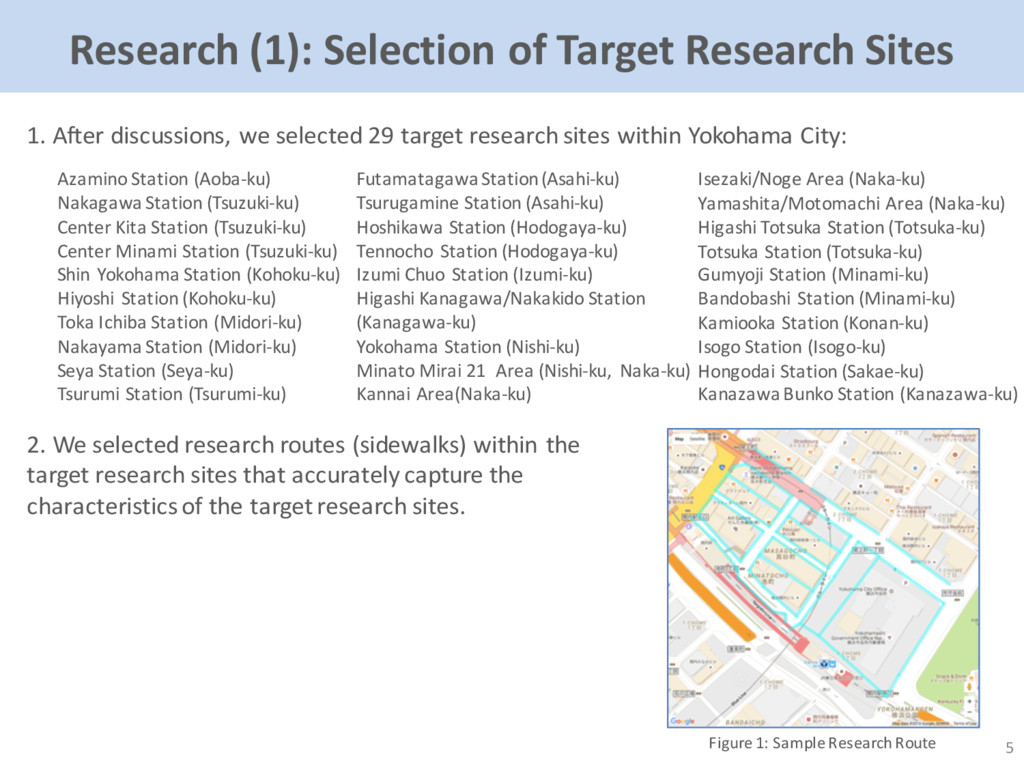
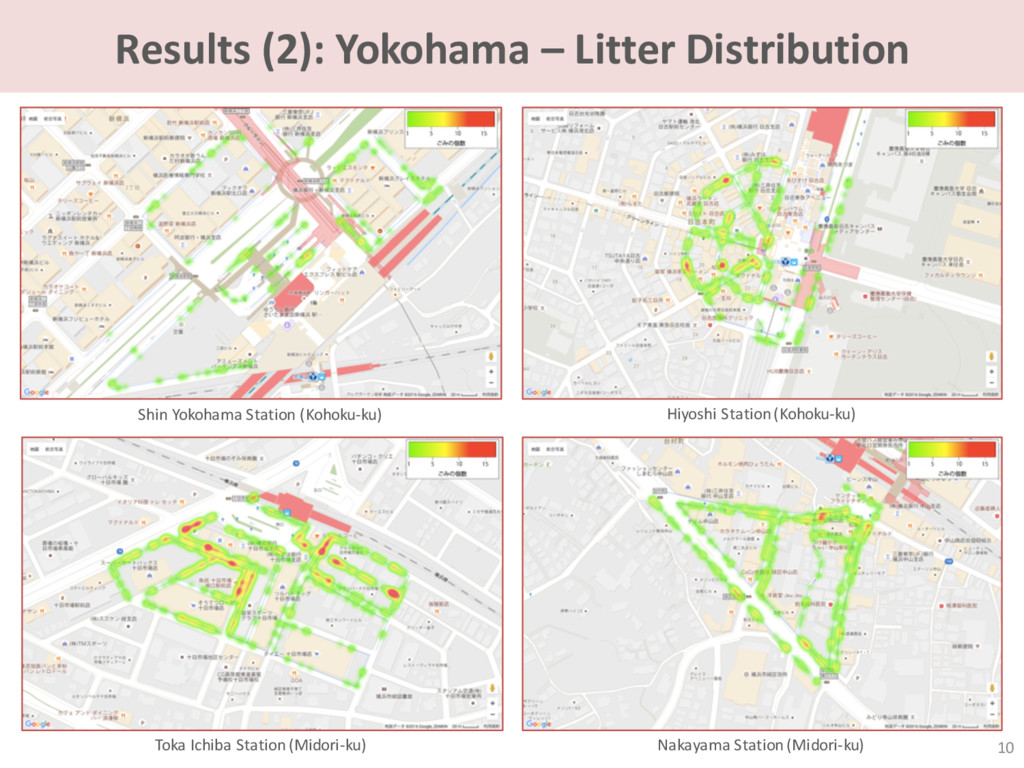
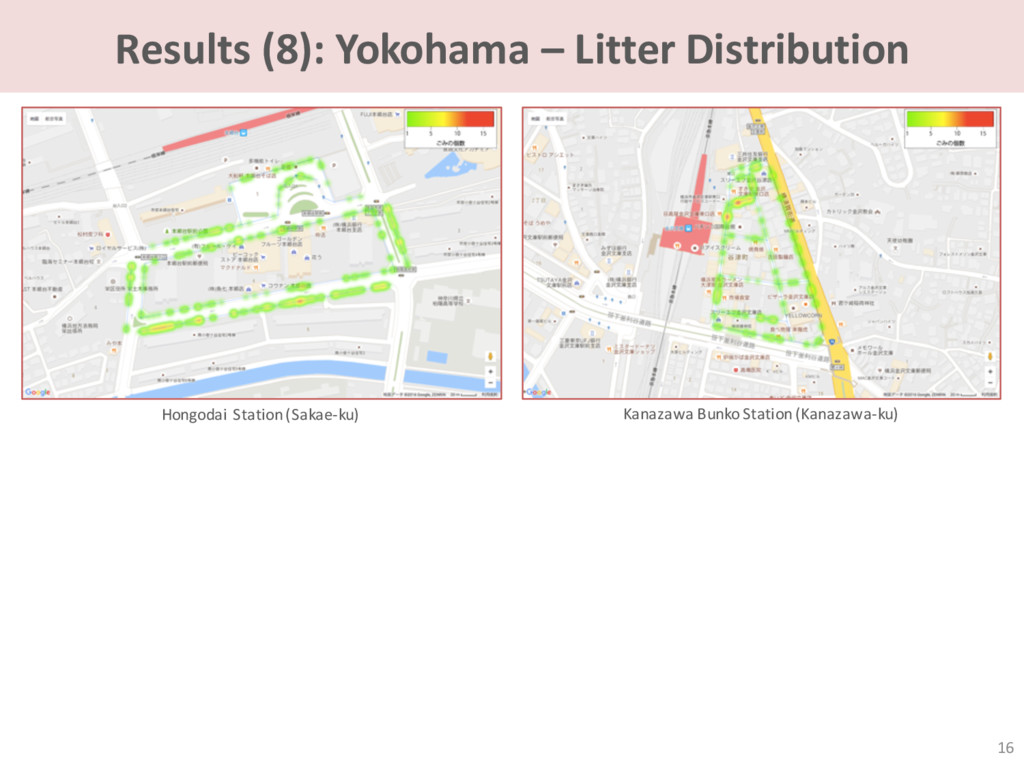
discussions, we selected 29 target research sites within Yokohama City: Azamino Station (Aoba-ku) Nakagawa Station (Tsuzuki-ku) Center Kita Station (Tsuzuki-ku) Center Minami Station (Tsuzuki-ku) Shin Yokohama Station (Kohoku-ku) Hiyoshi Station (Kohoku-ku) Toka Ichiba Station (Midori-ku) Nakayama Station (Midori-ku) Seya Station (Seya-ku) Tsurumi Station (Tsurumi-ku) Futamatagawa Station (Asahi-ku) Tsurugamine Station (Asahi-ku) Hoshikawa Station (Hodogaya-ku) Tennocho Station (Hodogaya-ku) Izumi Chuo Station (Izumi-ku) Higashi Kanagawa/Nakakido Station (Kanagawa-ku) Yokohama Station (Nishi-ku) Minato Mirai 21 Area (Nishi-ku, Naka-ku) Kannai Area(Naka-ku) Isezaki/Noge Area (Naka-ku) Yamashita/Motomachi Area (Naka-ku) Higashi Totsuka Station (Totsuka-ku) Totsuka Station (Totsuka-ku) Gumyoji Station (Minami-ku) Bandobashi Station (Minami-ku) Kamiooka Station (Konan-ku) Isogo Station (Isogo-ku) Hongodai Station (Sakae-ku) Kanazawa Bunko Station (Kanazawa-ku) 2. We selected research routes (sidewalks) within the target research sites that accurately capture the characteristics of the target research sites. Figure 1: Sample Research Route
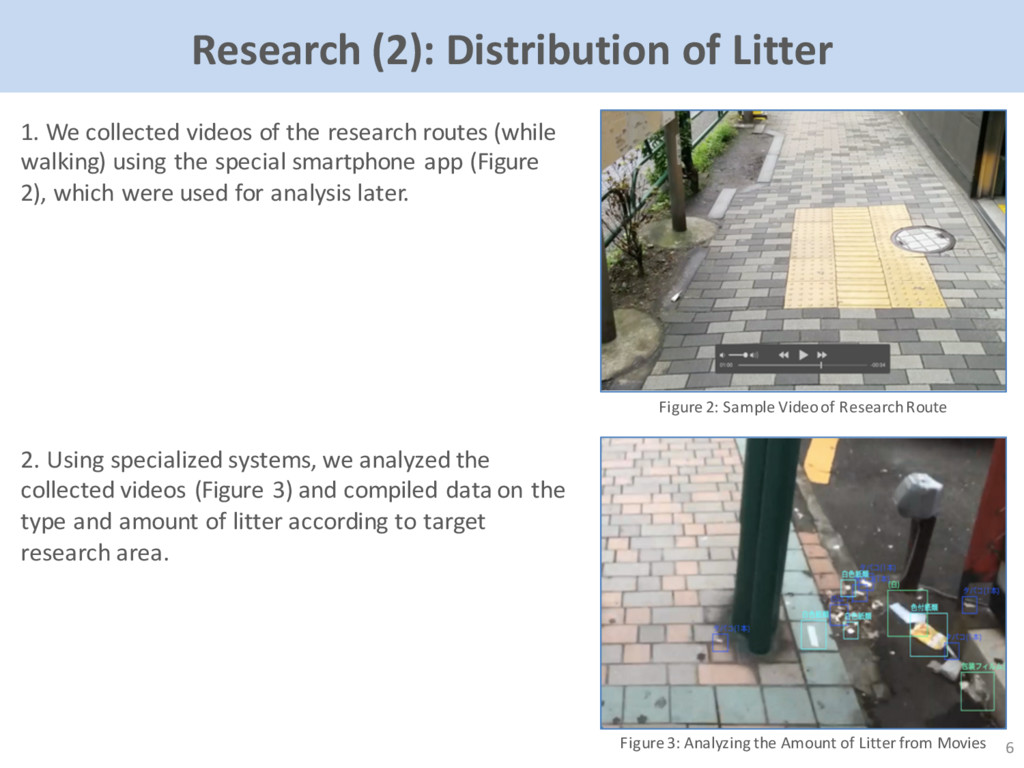
Research Route 6 1. We collected videos of the research routes (while walking) using the special smartphone app (Figure 2), which were used for analysis later. 2. Using specialized systems, we analyzed the collected videos (Figure 3) and compiled data on the type and amount of litter according to target research area. Figure 3: Analyzing the Amount of Litter from Movies
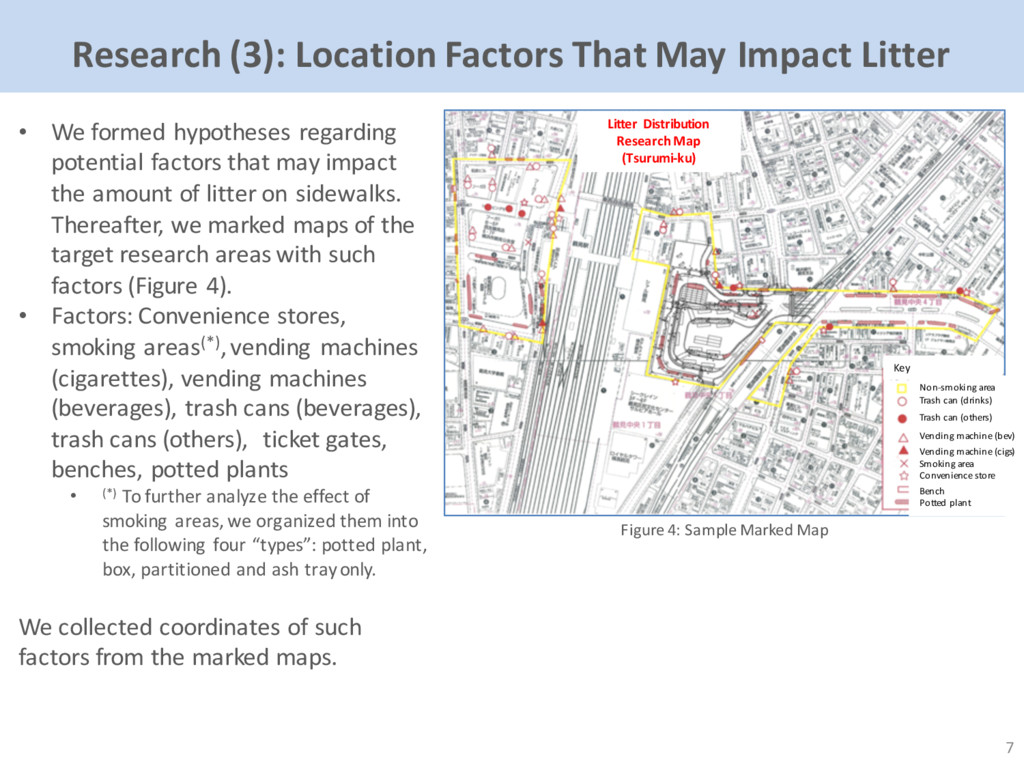
We formed hypotheses regarding potential factors that may impact the amount of litter on sidewalks. Thereafter, we marked maps of the target research areas with such factors (Figure 4). • Factors: Convenience stores, smoking areas(*), vending machines (cigarettes), vending machines (beverages), trash cans (beverages), trash cans (others), ticket gates, benches, potted plants • (*) To further analyze the effect of smoking areas, we organized them into the following four “types”: potted plant, box, partitioned and ash tray only. We collected coordinates of such factors from the marked maps. Figure 4: Sample Marked Map Litter Distribution Research Map (Tsurumi-ku) Key Non-smoking area Trash can (drinks) Trash can (others) Vending machine (bev) Vending machine (cigs) Smoking area Convenience store Bench Potted plant
8 We collected data on factors that may have cause/effect and other correlative relationships with the distribution of litter in key areas in Yokohama City. The collected data are as follows: p Estimates on various proportions by target research site: • Proportion of residential areas • Proportion of business districts • Proportion of restaurants • Proportion of stores • Proportion of school zones p Daily average station users (2014) p Results of 2015 research on status of pedestrian smokers, in relevant part: • Weekday – Number of pedestrians • Weekday – Number of pedestrian smokers • Weekday – Proportion of pedestrian smokers • Weekend – Number of pedestrians • Weekend – Number of pedestrian smokers • Weekend – Proportion of pedestrian smokers
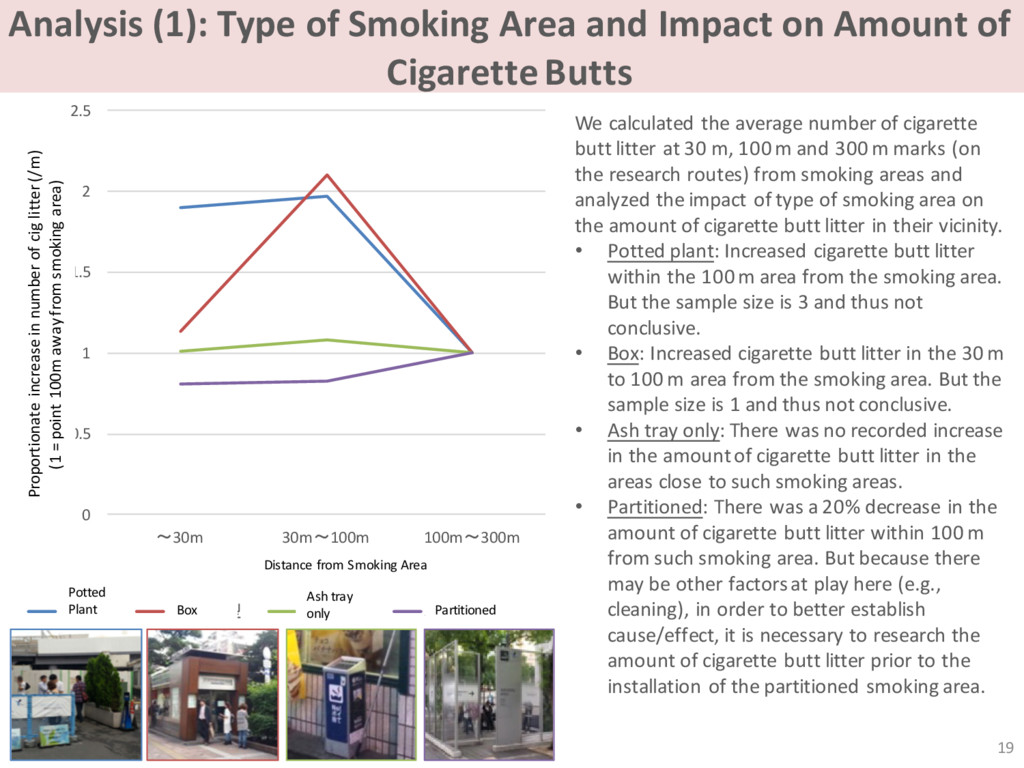
of Cigarette Butts 19 We calculated the average number of cigarette butt litter at 30 m, 100 m and 300 m marks (on the research routes) from smoking areas and analyzed the impact of type of smoking area on the amount of cigarette butt litter in their vicinity. • Potted plant: Increased cigarette butt litter within the 100 m area from the smoking area. But the sample size is 3 and thus not conclusive. • Box: Increased cigarette butt litter in the 30 m to 100 m area from the smoking area. But the sample size is 1 and thus not conclusive. • Ash tray only: There was no recorded increase in the amount of cigarette butt litter in the areas close to such smoking areas. • Partitioned: There was a 20% decrease in the amount of cigarette butt litter within 100 m from such smoking area. But because there may be other factors at play here (e.g., cleaning), in order to better establish cause/effect, it is necessary to research the amount of cigarette butt litter prior to the installation of the partitioned smoking area. 0 0.5 1 1.5 2 2.5 〜30m 30m〜100m 100m〜300m 歩道1mあたりのポイ捨てたばこ数の増減割合(割) (喫煙所から100m以上離れた場所を1として計算) 喫煙所からの距離 植栽型 ボックス型 灰皿のみ パーティション型 Distance from Smoking Area Proportionate increase in number of cig litter (/m) (1 = point 100m away from smoking area) Potted Plant Box Ash tray only Partitioned
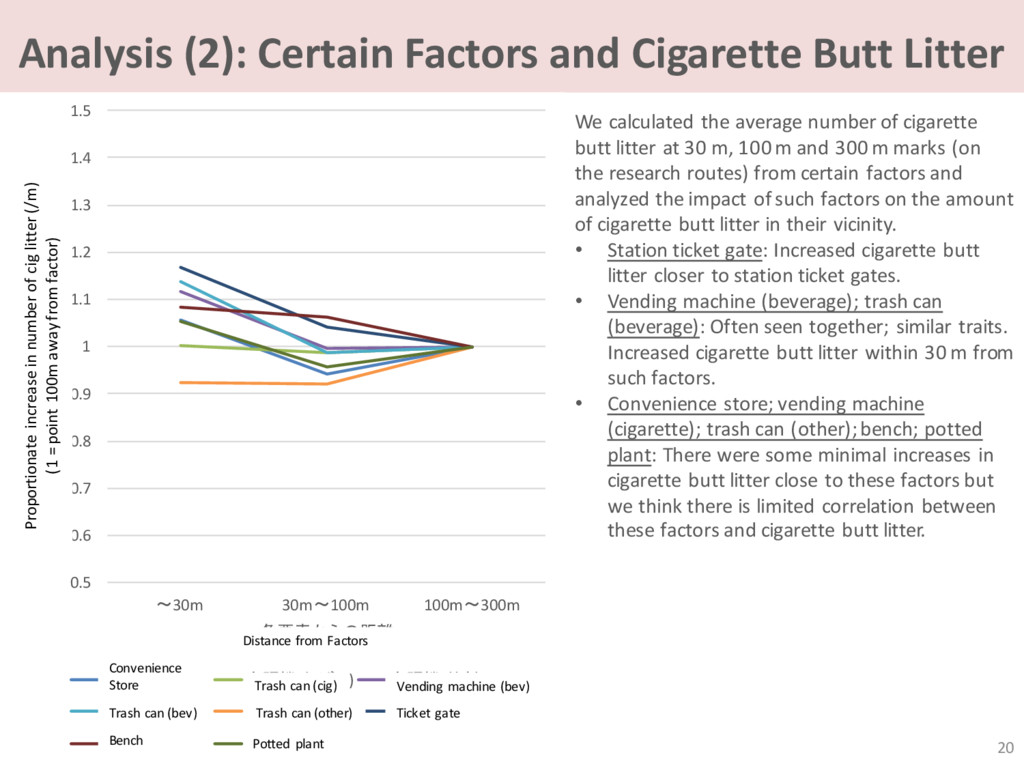
calculated the average number of cigarette butt litter at 30 m, 100 m and 300 m marks (on the research routes) from certain factors and analyzed the impact of such factors on the amount of cigarette butt litter in their vicinity. • Station ticket gate: Increased cigarette butt litter closer to station ticket gates. • Vending machine (beverage); trash can (beverage): Often seen together; similar traits. Increased cigarette butt litter within 30 m from such factors. • Convenience store; vending machine (cigarette); trash can (other); bench; potted plant: There were some minimal increases in cigarette butt litter close to these factors but we think there is limited correlation between these factors and cigarette butt litter. 0.5 0.6 0.7 0.8 0.9 1 1.1 1.2 1.3 1.4 1.5 〜30m 30m〜100m 100m〜300m 歩道1mあたりのポイ捨てたばこ数の増減割合(割) (各要素から100m以上離れた場所を1として計算) 各要素からの距離 コンビニ 自販機(たばこ) 自販機(飲料) ごみ箱(飲料) ごみ箱(その他) 駅改札 ベンチ 植栽 Convenience Store Trash can (bev) Bench Trash can (cig) Trash can (other) Potted plant Vending machine (bev) Ticket gate Distance from Factors Proportionate increase in number of cig litter (/m) (1 = point 100m away from factor)
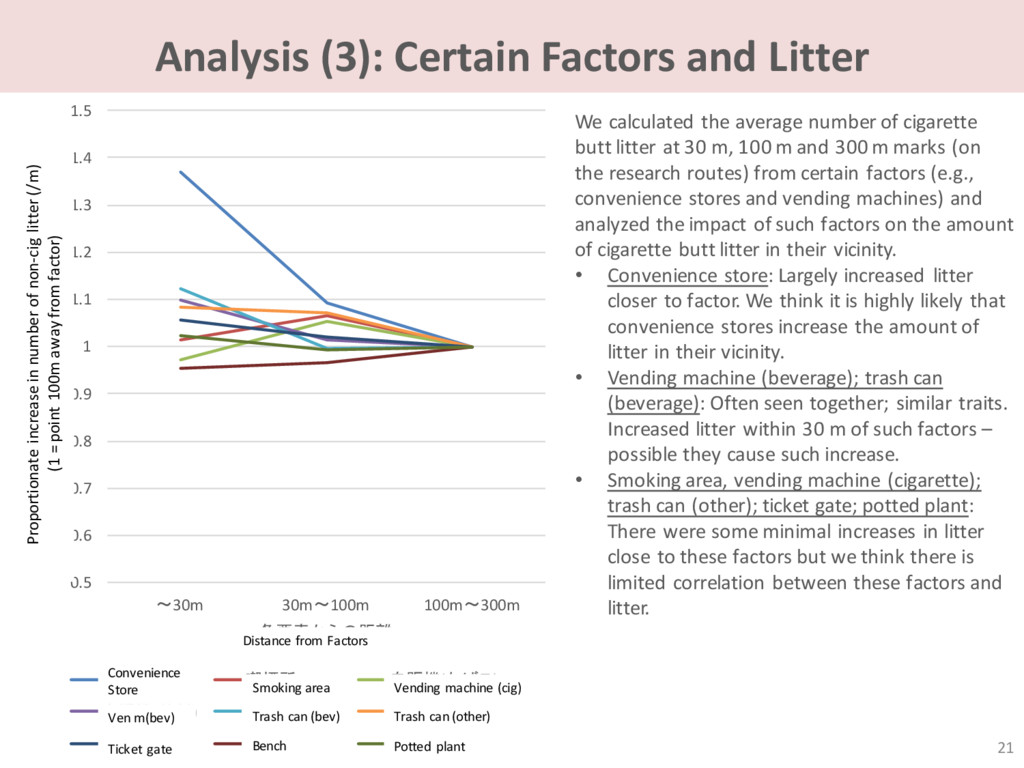
average number of cigarette butt litter at 30 m, 100 m and 300 m marks (on the research routes) from certain factors (e.g., convenience stores and vending machines) and analyzed the impact of such factors on the amount of cigarette butt litter in their vicinity. • Convenience store: Largely increased litter closer to factor. We think it is highly likely that convenience stores increase the amount of litter in their vicinity. • Vending machine (beverage); trash can (beverage): Often seen together; similar traits. Increased litter within 30 m of such factors – possible they cause such increase. • Smoking area, vending machine (cigarette); trash can (other); ticket gate; potted plant: There were some minimal increases in litter close to these factors but we think there is limited correlation between these factors and litter. 0.5 0.6 0.7 0.8 0.9 1 1.1 1.2 1.3 1.4 1.5 〜30m 30m〜100m 100m〜300m 歩道1mあたりのたばこ以外のポイ捨てごみ数の増減割合(割) (各要素から100m以上離れた場所を1として計算) 各要素からの距離 コンビニ 喫煙所 自販機(たばこ) 自販機(飲料) ごみ箱(飲料) ごみ箱(その他) 駅改札 ベンチ 植栽 Convenience Store Trash can (bev) Bench Smoking area Trash can (other) Potted plant Ven m(bev) Ticket gate Vending machine (cig) Distance from Factors Proportionate increase in number of non-cig litter (/m) (1 = point 100m away from factor)
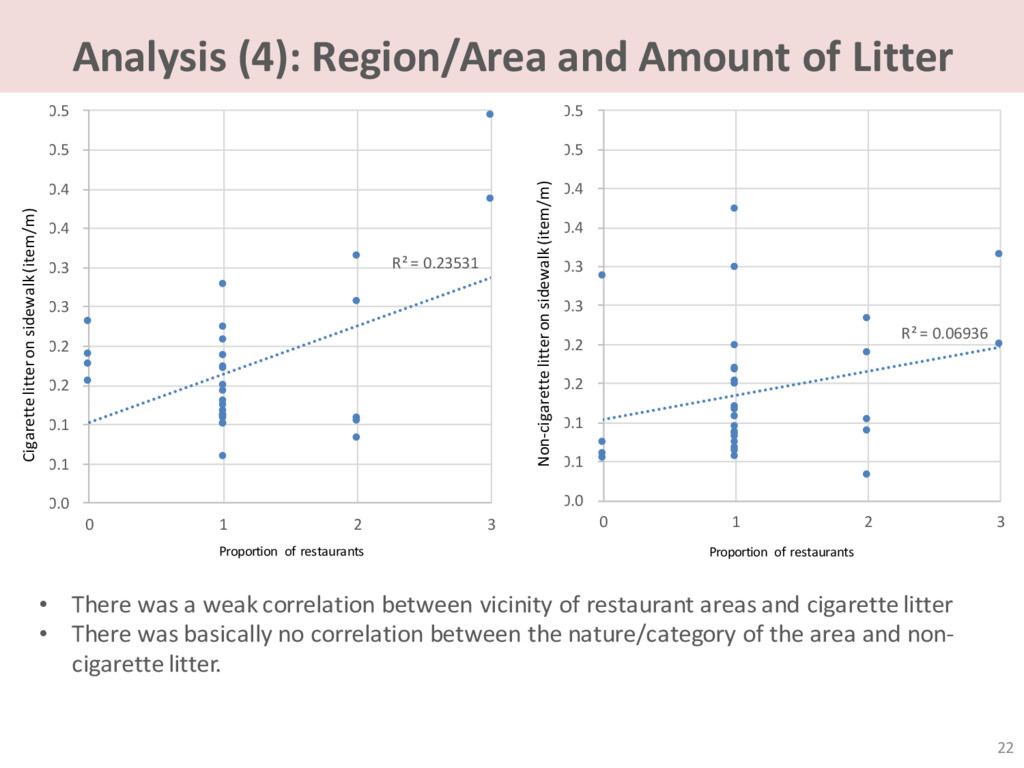
0.23531 0.0 0.1 0.1 0.2 0.2 0.3 0.3 0.4 0.4 0.5 0.5 0 1 2 3 歩道1mあたりのポイ捨てたばこ数 (個 / m) 飲食店の割合 (割) R² = 0.06936 0.0 0.1 0.1 0.2 0.2 0.3 0.3 0.4 0.4 0.5 0.5 0 1 2 3 歩道1mあたりのたばこ以外ポイ捨てごみ数 (個 / m) 飲食店の割合 (割) • There was a weak correlation between vicinity of restaurant areas and cigarette litter • There was basically no correlation between the nature/category of the area and non- cigarette litter. Non-cigarette litter on sidewalk (item/m) Cigarette litter on sidewalk (item/m) Proportion of restaurants Proportion of restaurants
was a weak correlation between the number of pedestrians and amount of non-cigarette litter. • There was no correlation between the number of pedestrian smokers and the amount of cigarette litter; other factors and litter. R² = 5.5E-08 0.0 0.1 0.1 0.2 0.2 0.3 0.3 0.4 0.4 0.5 0.5 0 0.1 0.2 0.3 0.4 0.5 歩道1mあたりのポイ捨てたばこ数 (個 / m) 歩行喫煙調査における平日の歩行喫煙者率 (%) R² = 0.17148 0.0 0.1 0.1 0.2 0.2 0.3 0.3 0.4 0.4 0.5 0.5 0 20000 40000 60000 80000 歩道1mあたりのたばこ以外ポイ捨てごみ数 (個 / m) 歩行喫煙調査における平日の歩行喫煙者数 (人) Non-cigarette litter on sidewalk (item/m) Cigarette litter on sidewalk (item/m) Weekday pedestrian smokers (people) Weekday pedestrian smokers (people)
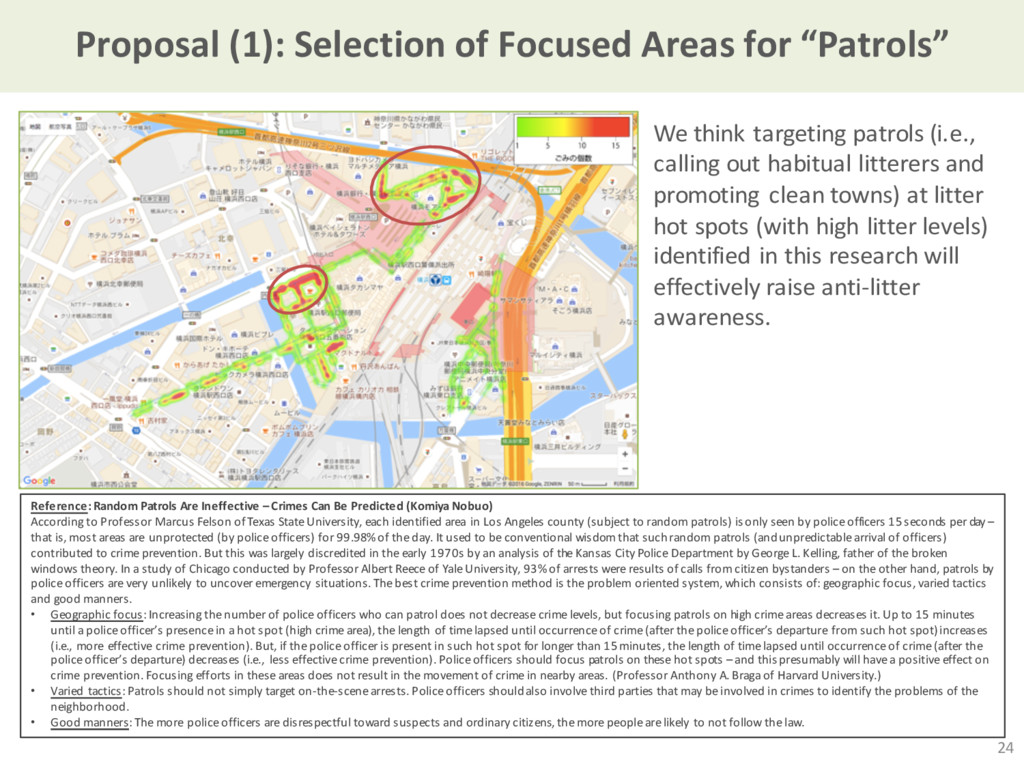
targeting patrols (i.e., calling out habitual litterers and promoting clean towns) at litter hot spots (with high litter levels) identified in this research will effectively raise anti-litter awareness. 24 Reference: Random Patrols Are Ineffective – Crimes Can Be Predicted (Komiya Nobuo) According to Professor Marcus Felson of Texas State University, each identified area in Los Angeles county (subject to random patrols) is only seen by police officers 15 seconds per day – that is, most areas are unprotected (by police officers) for 99.98% of the day. It used to be conventional wisdom that such random patrols (and unpredictable arrival of officers) contributed to crime prevention. But this was largely discredited in the early 1970s by an analysis of the Kansas City Police Department by George L. Kelling, father of the broken windows theory. In a study of Chicago conducted by Professor Albert Reece of Yale University, 93% of arrests were results of calls from citizen bystanders – on the other hand, patrols by police officers are very unlikely to uncover emergency situations. The best crime prevention method is the problem oriented system, which consists of: geographic focus, varied tactics and good manners. • Geographic focus: Increasing the number of police officers who can patrol does not decrease crime levels, but focusing patrols on high crime areas decreases it. Up to 15 minutes until a police officer’s presence in a hot spot (high crime area), the length of time lapsed until occurrence of crime (after the police officer’s departure from such hot spot) increases (i.e., more effective crime prevention). But, if the police officer is present in such hot spot for longer than 15 minutes, the length of time lapsed until occurrence of crime (after the police officer’s departure) decreases (i.e., less effective crime prevention). Police officers should focus patrols on these hot spots – and this presumably will have a positive effect on crime prevention. Focusing efforts in these areas does not result in the movement of crime in nearby areas. (Professor Anthony A. Braga of Harvard University.) • Varied tactics: Patrols should not simply target on-the-scene arrests. Police officers should also involve third parties that may be involved in crimes to identify the problems of the neighborhood. • Good manners: The more police officers are disrespectful toward suspects and ordinary citizens, the more people are likely to not follow the law.
community groups and building managers, in well- maintained areas with little litter, for being representatives of beautified areas can have the following positive effects: • Incentivize companies and other organizations to continuously engage in cleanup efforts. • Promote involvement of companies and other organizations that are not already participating in neighborhood cleanup efforts – such companies and organizations can be invited to the award ceremonies, which are to be held at the end of the cleanup projects – this encourages them to participate in the cleanup project itself. 25
and ideas can be shared and, citizens can participate can have the following positive effects: • Find novel ideas that are different from members of staff. • Increase awareness among citizens and encourage participation in cleanup projects. Case Study – Kawasaki City, Kanagawa Prefecture: The Kawasaki City environmental research center and International University GLOCOM (Minato-ku) co-hosted a workshop which discussed litter research results – the ideas proposed at such workshop are now being considered for implementation. Workshop participants also included the vice mayor, city hall representatives and other community leaders. Thus, many praised the workshop as a forum where ideas could be substantiated and implemented more effectively than others. 26
Inhibition of Litter 27 Of the four smoking area types (box, partitioned, potted plant, ash tray only), the partitioned smoking areas had the highest likelihood of reducing cigarette butt litter in their vicinities. With respect to the partitioned smoking area, it may be prudent to research: • Distribution of litter in vicinity of smoking area before/after installment of partitioned smoking area. • Actions of users in partitioned smoking areas vs. other smoking areas. Research of the foregoing may identify: • Quantified preventative effects of partitioned smoking areas on litter. • Factors that inhibit littering (e.g., size of smoking area, type of partition, frequency of cleaning) – specifically, it may be possible to identify the factors that impact the amount of litter in smoking area vicinities. We think research on the foregoing will yield knowledge that would be useful in the beautification of Yokohama City.
Cans (Beverage) This research revealed that both vending machines and trash cans, each for beverages, potentially increase the amount of cigarette butt litter and other litter in their vicinities. The following are possible reasons for this: 1. Trash may be placed around trash cans (for beverages) because such trash can is too full or because it is not specifically for other non-beverage trash. 2. Trash accumulates because the trash around these vending machines and trash cans signals to passerby that it is fine to leave trash in these areas. 3. The accumulated trash can be carried away by the wind. Additionally, even if these areas are cleaned up, because of the level of accumulation, it may not be possible to collect and cleanup all. We think the foregoing explain why there is an increase in litter around trash cans (for beverages) – the following could reduce these effects on litter: • Increase the capacity of trash cans (beverages) or urge administrators to collect the trash in such trash cans more frequently. • Urge administrators to install trash cans for other trash as well. We think there are typically high levels of litter around vending machines (for beverages) because of the lack of the solutions set forth above. 28
found that potted plants have low effects on the amount of litter in their vicinities. That said, many interiors of potted plants had more litter than sidewalks – and thus, it is highly likely that potted plants by sidewalks increase litter in neighborhoods. According to research of 69 checkpoints within the 23 wards of Tokyo conducted by Pirika, Inc. in 2014, potted plant interiors had 1.5 times the amount of litter found on sidewalks. The following are possible explanations for this: 1. Potted plants encourage littering because it is easy to hide litter. 2. Because it is difficult to clean the interiors of potted plants, litter tends to accumulate. Thus, we think the following will reduce the amount of litter: • Removal of potted plants; and • Improvement of potted plants (research of the design and placement of potted plants which makes difficult to hide trash and facilitates cleanup). 29
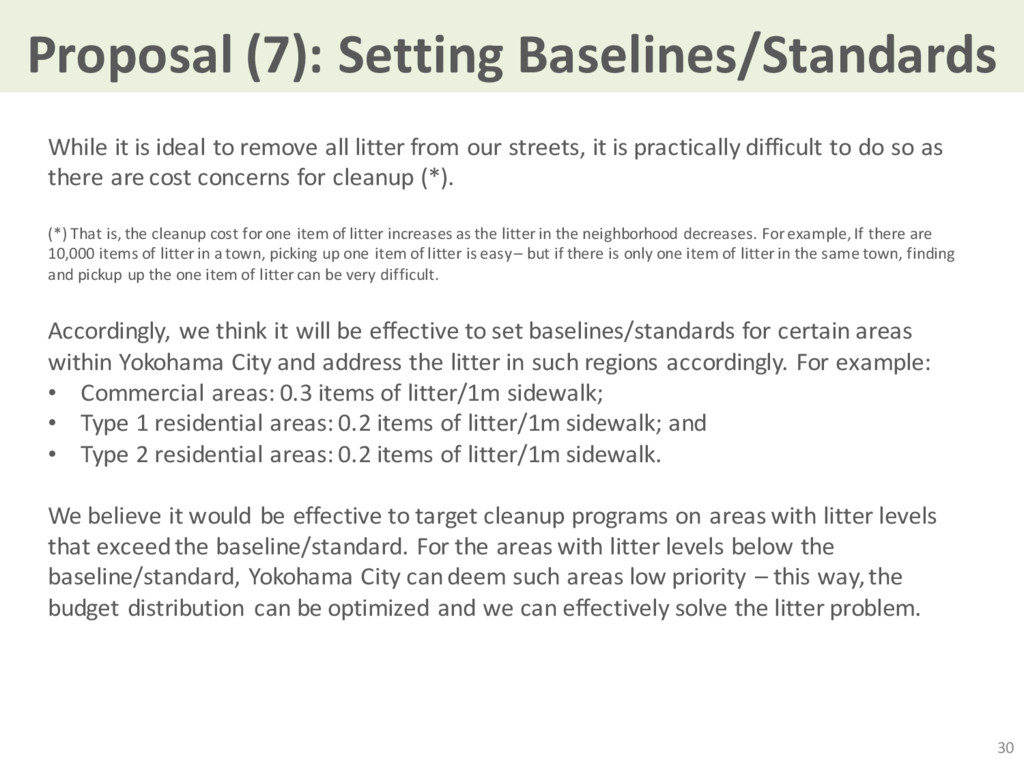
all litter from our streets, it is practically difficult to do so as there are cost concerns for cleanup (*). (*) That is, the cleanup cost for one item of litter increases as the litter in the neighborhood decreases. For example, If there are 10,000 items of litter in a town, picking up one item of litter is easy – but if there is only one item of litter in the same town, finding and pickup up the one item of litter can be very difficult. Accordingly, we think it will be effective to set baselines/standards for certain areas within Yokohama City and address the litter in such regions accordingly. For example: • Commercial areas: 0.3 items of litter/1m sidewalk; • Type 1 residential areas: 0.2 items of litter/1m sidewalk; and • Type 2 residential areas: 0.2 items of litter/1m sidewalk. We believe it would be effective to target cleanup programs on areas with litter levels that exceed the baseline/standard. For the areas with litter levels below the baseline/standard, Yokohama City can deem such areas low priority – this way, the budget distribution can be optimized and we can effectively solve the litter problem. 30
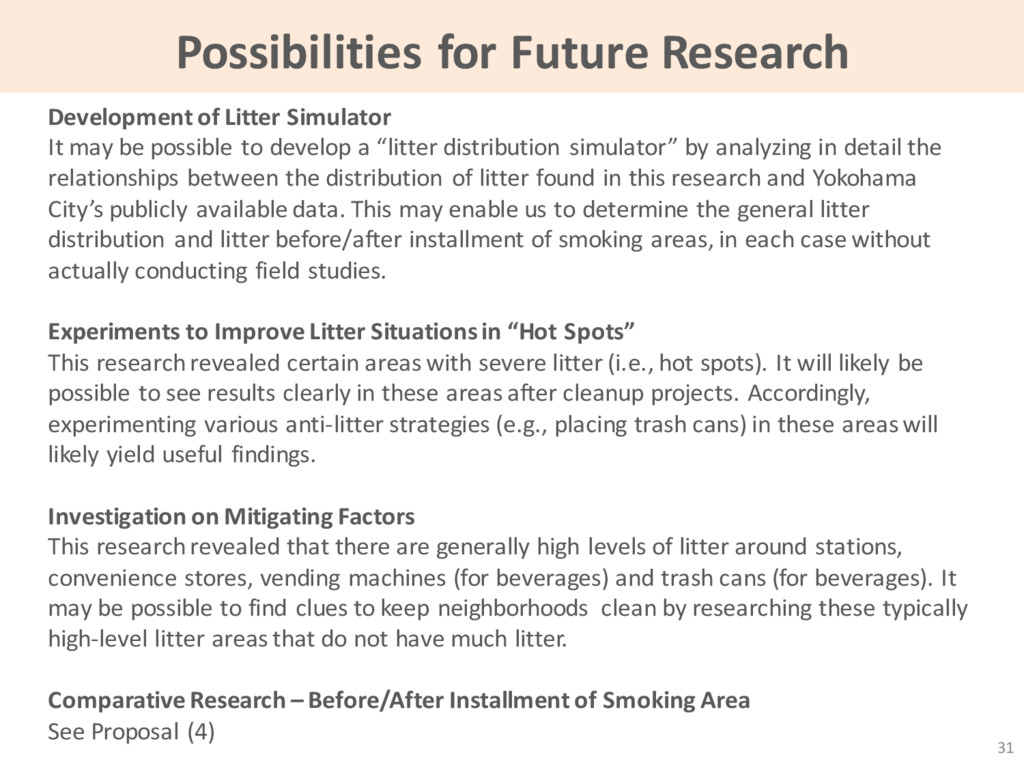
be possible to develop a “litter distribution simulator” by analyzing in detail the relationships between the distribution of litter found in this research and Yokohama City’s publicly available data. This may enable us to determine the general litter distribution and litter before/after installment of smoking areas, in each case without actually conducting field studies. Experiments to Improve Litter Situations in “Hot Spots” This research revealed certain areas with severe litter (i.e., hot spots). It will likely be possible to see results clearly in these areas after cleanup projects. Accordingly, experimenting various anti-litter strategies (e.g., placing trash cans) in these areas will likely yield useful findings. Investigation on Mitigating Factors This research revealed that there are generally high levels of litter around stations, convenience stores, vending machines (for beverages) and trash cans (for beverages). It may be possible to find clues to keep neighborhoods clean by researching these typically high-level litter areas that do not have much litter. Comparative Research – Before/After Installment of Smoking Area See Proposal (4) 31