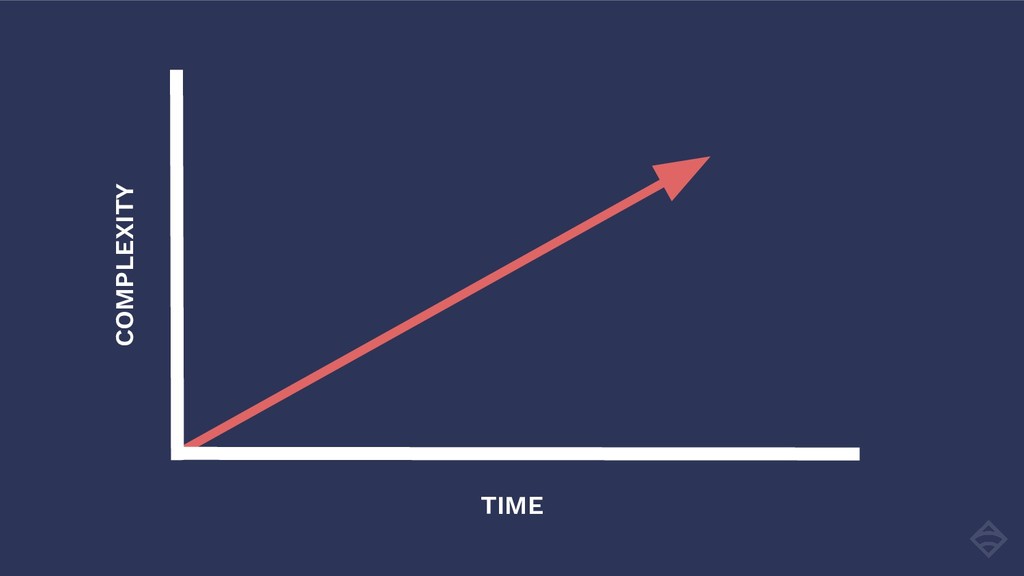
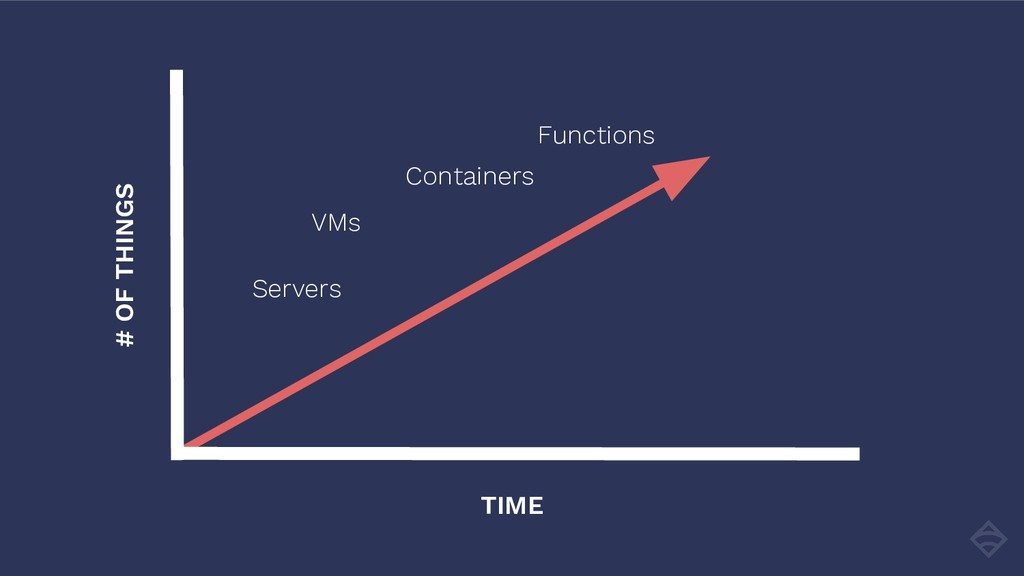
Applications are complex systems. Their many moving parts, component and dependency services, may span any number of infrastructure technologies and platforms, from bare metal to serverless. As the number of services increases, teams responsible for them will naturally develop their own preferences, such as how they instrument their code or how and when they receive alerts. Sean will demonstrate how Sensu Go is designed to monitor these ever changing heterogeneous environments. Sensu Go is the next release of the open source monitoring framework, rewritten in Go, with new capabilities and reduced operational overhead. Sean will go over various patterns of data collection, including scraping Prometheus metrics, and show how Sensu enables self-service monitoring and alerting for service owners.
![<name>:<value>|c[|@<sample rate>]](https://files.speakerdeck.com/presentations/9fd5ee3e35794ab6989b59aa00c62d27/slide_71.jpg)