Upgrade to Pro — share decks privately, control downloads, hide ads and more …

Monitoring Event Pipelines

portertech
November 06, 2019

Monitoring Event Pipelines

Why you need one, and why you should stop rolling your own.

portertech

November 06, 2019
Tweet

More Decks by portertech

Other Decks in Programming

Transcript

  1. 1 Why you need one, and why you should stop

    rolling your own. By Sean Porter (@PorterTech) Monitoring Event Pipelines
  2. Overview 3 • Our shared reality • My experience in

    building Sensu • What is a monitoring pipeline? • Attributes of an effective pipeline • Demo time • The future of pipelines
  3. Ephemeral compute! • Host-based -> role-based monitoring • Polling ->

    publish-subscribe & push APIs • Point-and-click -> Infrastructure as Code The paradigm shift 7
  4. “We gotta find a way to make [this] fit into

    the hole for (this), using nothing but {that}.” 8
  5. 10

  6. 13

  7. Sensu origin story 17 I joined Sonian in 2010 as

    an “Automation Engineer” • Early adopters • High rate of change ◦ Growing team ◦ Evolving software stack
  8. 18

  9. Sensu origin story 19 I started a project with some

    goals (July 2011) • Handle ephemeral compute • Leverage existing and familiar technologies • Easy to drive with config management • Easy to scale horizontally • APIs!!!
  10. Sensu origin story 20 • Agent based system with auto-discovery

    • Message bus for communication • Simple key-value data store for state • Central service check scheduler (pub-sub) • JSON configuration • REST APIs
  11. 21

  12. 22

  13. Sensu origin story 23 • Designed for the cloud ◦

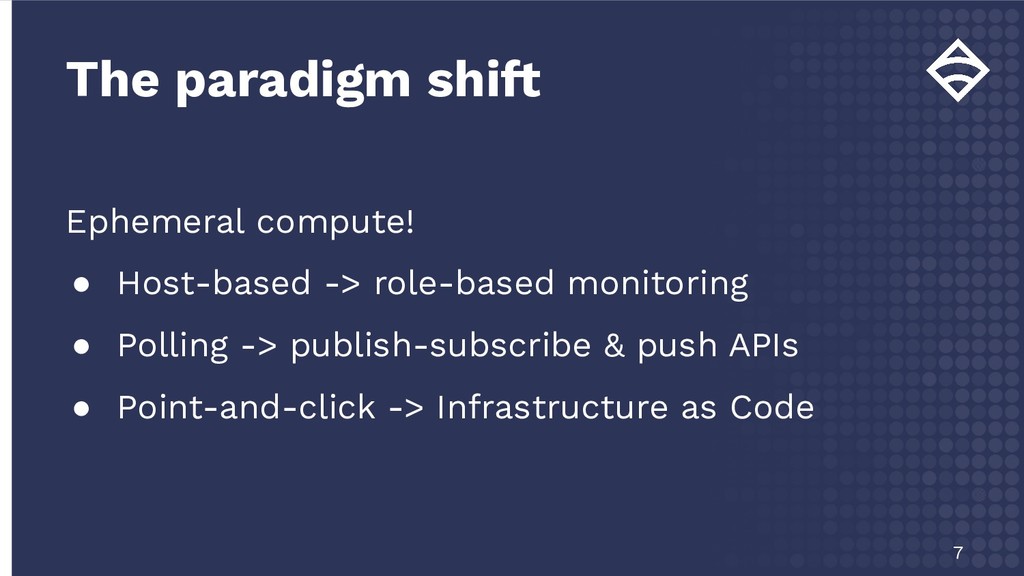
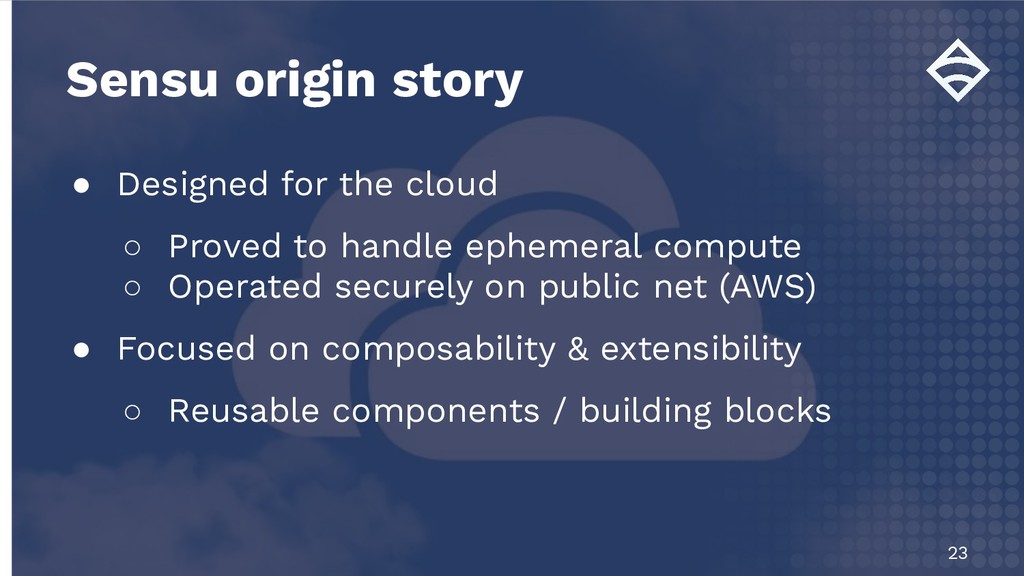
    Proved to handle ephemeral compute ◦ Operated securely on public net (AWS) • Focused on composability & extensibility ◦ Reusable components / building blocks
  14. Sensu origin story 25 • Named it Sensu • Sonian

    sponsored development! ◦ Deployed to production after 2 months ◦ Replaced a number of tools! • Open sourced (MIT) on November 1st, 2011
  15. 26

  16. Unified data collection and processing for all types of monitoring

    events: • Service checks • Metrics • Traces • Logs • Inventory What is a monitoring pipeline? 31
  17. There are two critical layers: • Data plane • Control

    plane What is a monitoring pipeline? 32
  18. • Data input • Data transportation & routing • Load

    balancing & failover • The layer developers interact with (APIs) The data plane 33
  19. • Central management unit ◦ Orchestrator ◦ Configuration ◦ Security

    (auth) • APIs, agents, data processors, etc. • The layer operators interact with The control plane 34
  20. 36

  21. • Fewer agents ◦ Less “edge” service to support ◦

    Resource utilization (i.e. fewer sidecars) • Cost savings* Wait… But why? 47
  22. • Unified data format(s) • Unique IDs • Capture context

    at collection time • Support additional metadata • Support efficient debugging Event payload(s) 49
  23. { metadata: { annotations: { … } }, entity: {

    name: “osmc.de” }, timestamp: now() } Event payload(s) 51
  24. { metadata: { annotations: { … } }, check: {

    output: “the system is down” }, timestamp: now() } Event payload(s) 52
  25. { metadata: { annotations: { … } }, metrics: {

    points: [ … ] }, timestamp: now() } Event payload(s) 53
  26. • Lightweight (think sidecars) • Multi-platform support • Initiates connections

    to backends • Bi-directional communication Collection Agent 54
  27. • Auto-registration with the backend • Auto-discovery (context) ◦ Platform

    info ◦ System details ◦ Roles / responsibilities Collection Agent 55
  28. • Keepalive / heartbeat mechanism • Service check execution support

    ◦ Commonly overlooked / underappreciated ◦ Leverage over a decade of investment • Durable outbound data queue Collection Agent 56
  29. • Several data inputs (APIs) ◦ Industry standards* ▪ Metrics

    (StatsD, OpenTelemetry, Graphite) ▪ Trace (OpenTracing) ▪ Structured log (JSON) Collection Agent 57
  30. • Standard cryptography (TLS v1.2) ◦ mTLS verification & authentication

    • Standard protocol (HTTP) • Agent initiated connections ◦ Traverse complex networks Data Transport 58
  31. • Scale horizontally • Little coordination with peers • Concurrency

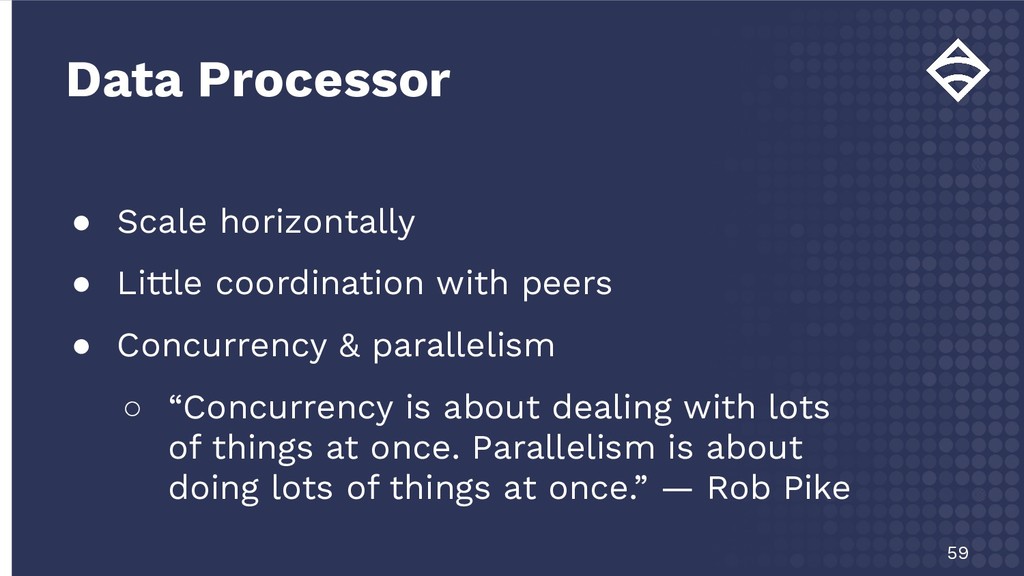
    & parallelism ◦ “Concurrency is about dealing with lots of things at once. Parallelism is about doing lots of things at once.” — Rob Pike Data Processor 59
  32. • Easy to extend and integrate! ◦ Simple APIs and

    clear specs • Multi-tenancy to enable self-service ◦ Namespaces ◦ RBAC Data Processor 60
  33. • The “secret sauce” • Granular routing ◦ Is it

    an incident? ◦ Is it a resolution? ◦ Metric data? ◦ Production? Office hours? Filtering 61
  34. Actions 63 • Alert notifications • Incident management • Metric

    & event storage • Inventory • Auto-remediation
  35. 64 Monitoring Pipeline Filter Only incidents Filter Only logs Filter

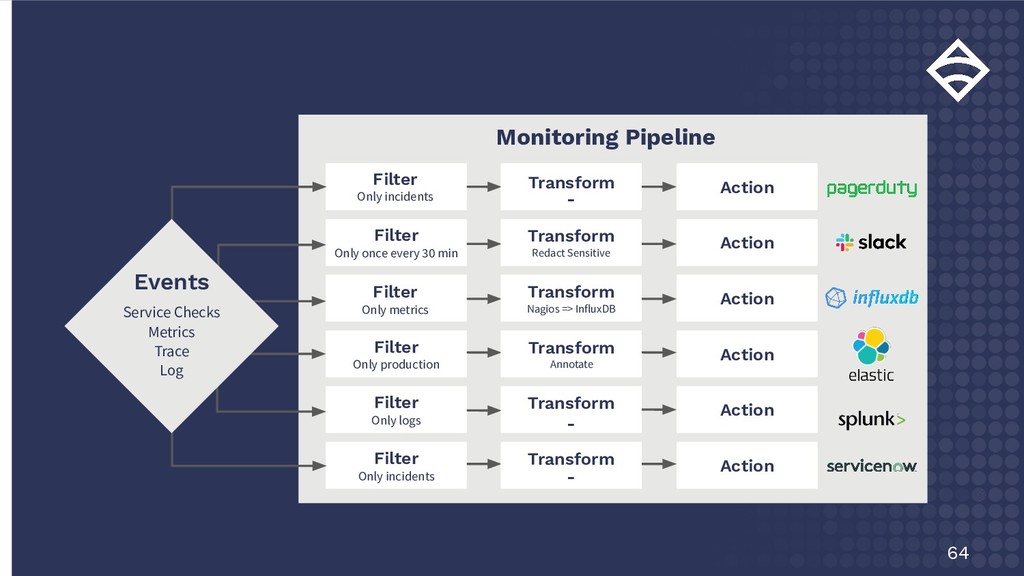
    Only production Transform Transform - - Action Action Action Action Action Action Events Service Checks Metrics Trace Log Transform Redact Sensitive Transform Nagios => InfluxDB Filter Only once every 30 min Filter Only metrics Filter Only incidents Transform Annotate Transform -