Chef makes it easier for organizations to go fast–enabling them to continuously deliver new services and features to their customers. With Chef, you can quickly provision infrastructure and deploy applications, but can your monitoring keep up? Or will it keep you up at night?
Sean will demonstrate how Sensu 2.0 is designed to monitor Chef driven infrastructure. Sensu 2.0 is the next release of the open source monitoring framework, rewritten in Go, with new capabilities and reduced operational overhead. Sean will show how the Sensu Chef cookbook can be used to deploy Sensu and manage service checks, metric collection, and alert notifications. He will go over monitoring best practices that lead to delightful monitoring with Chef and Sensu.
![sensu_ctl "default" do version "2.0.0.beta.1-1" repo "sensu/beta" username secrets["username"] password](https://files.speakerdeck.com/presentations/2478991c89bd41ffaf6774144173dc40/slide_38.jpg)
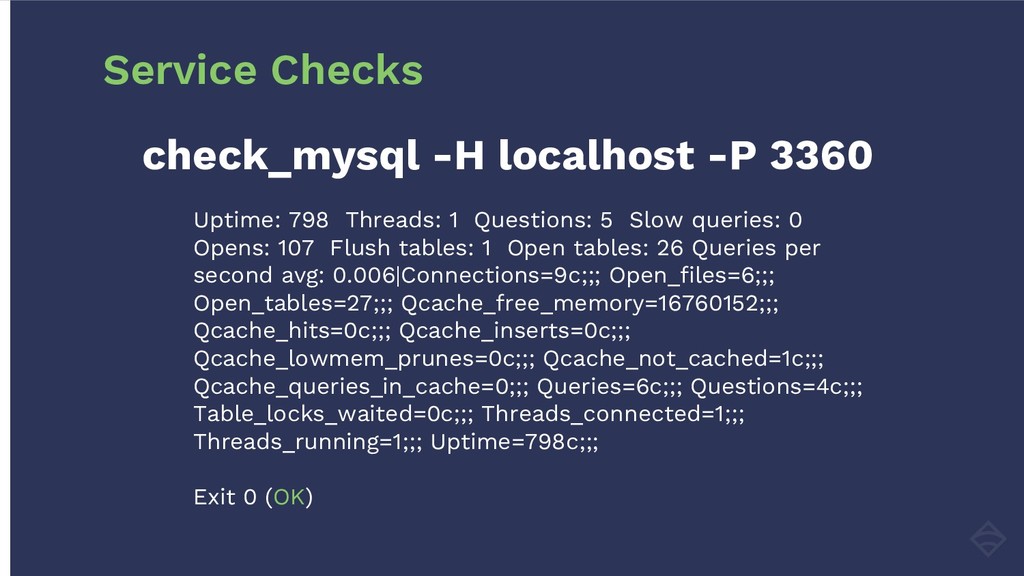
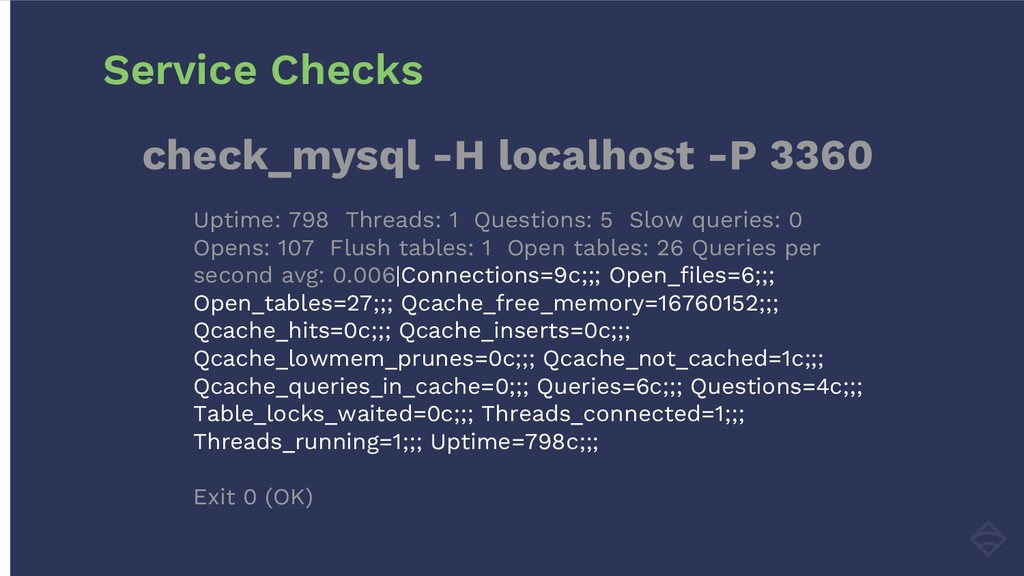
![sensu_check "mysql" do command "check_mysql -H ..." subscriptions ["mysql"] interval](https://files.speakerdeck.com/presentations/2478991c89bd41ffaf6774144173dc40/slide_47.jpg)
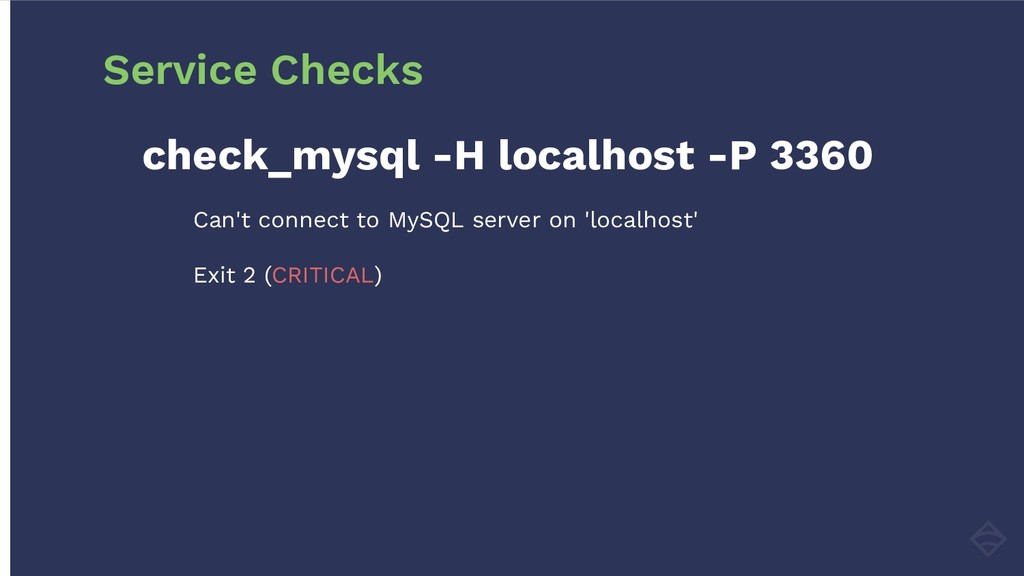
![sensu_check "mysql" do command "check_mysql -H ..." subscriptions ["mysql"] interval](https://files.speakerdeck.com/presentations/2478991c89bd41ffaf6774144173dc40/slide_49.jpg)
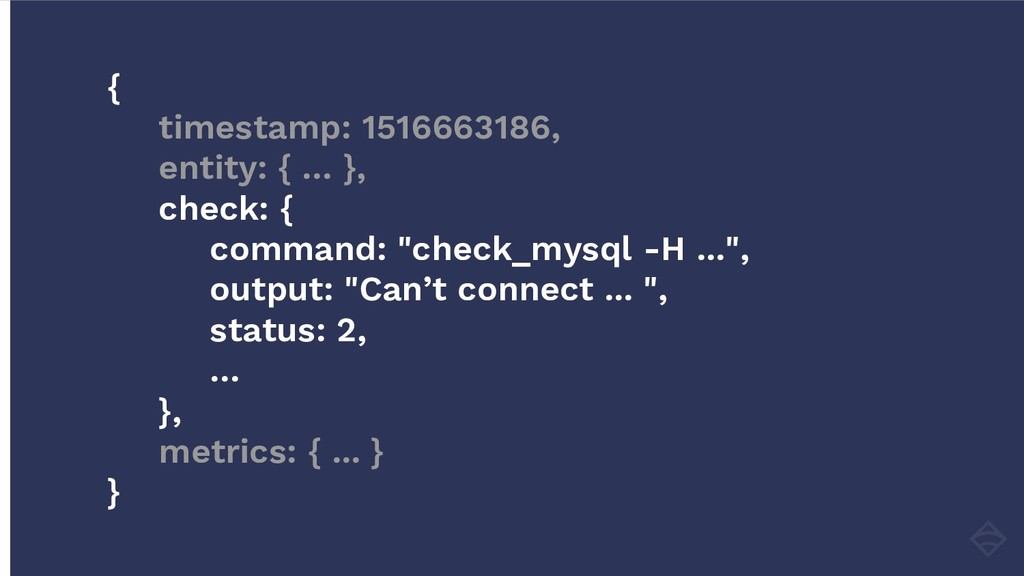
![sensu_check "mysql" do command "check_mysql -H ..." runtime_assets ["mysql-plugins"] subscriptions](https://files.speakerdeck.com/presentations/2478991c89bd41ffaf6774144173dc40/slide_54.jpg)
![<name>:<value>|c[|@<sample rate>] UDP localhost 8125](https://files.speakerdeck.com/presentations/2478991c89bd41ffaf6774144173dc40/slide_64.jpg)
![sensu_check "mysql" do command "check_mysql -H ..." runtime_assets ["mysql-plugins"] subscriptions](https://files.speakerdeck.com/presentations/2478991c89bd41ffaf6774144173dc40/slide_70.jpg)