$30 off During Our Annual Pro Sale. View Details »

Setting up Monitoring for Kubernetes

Setting up Monitoring for Kubernetes

Lightning talk given at Kubernetes + CNCF meetup in Bengaluru on 16th September

Meetup link - https://www.meetup.com/kubernetes-india-meetup/events/295710022/

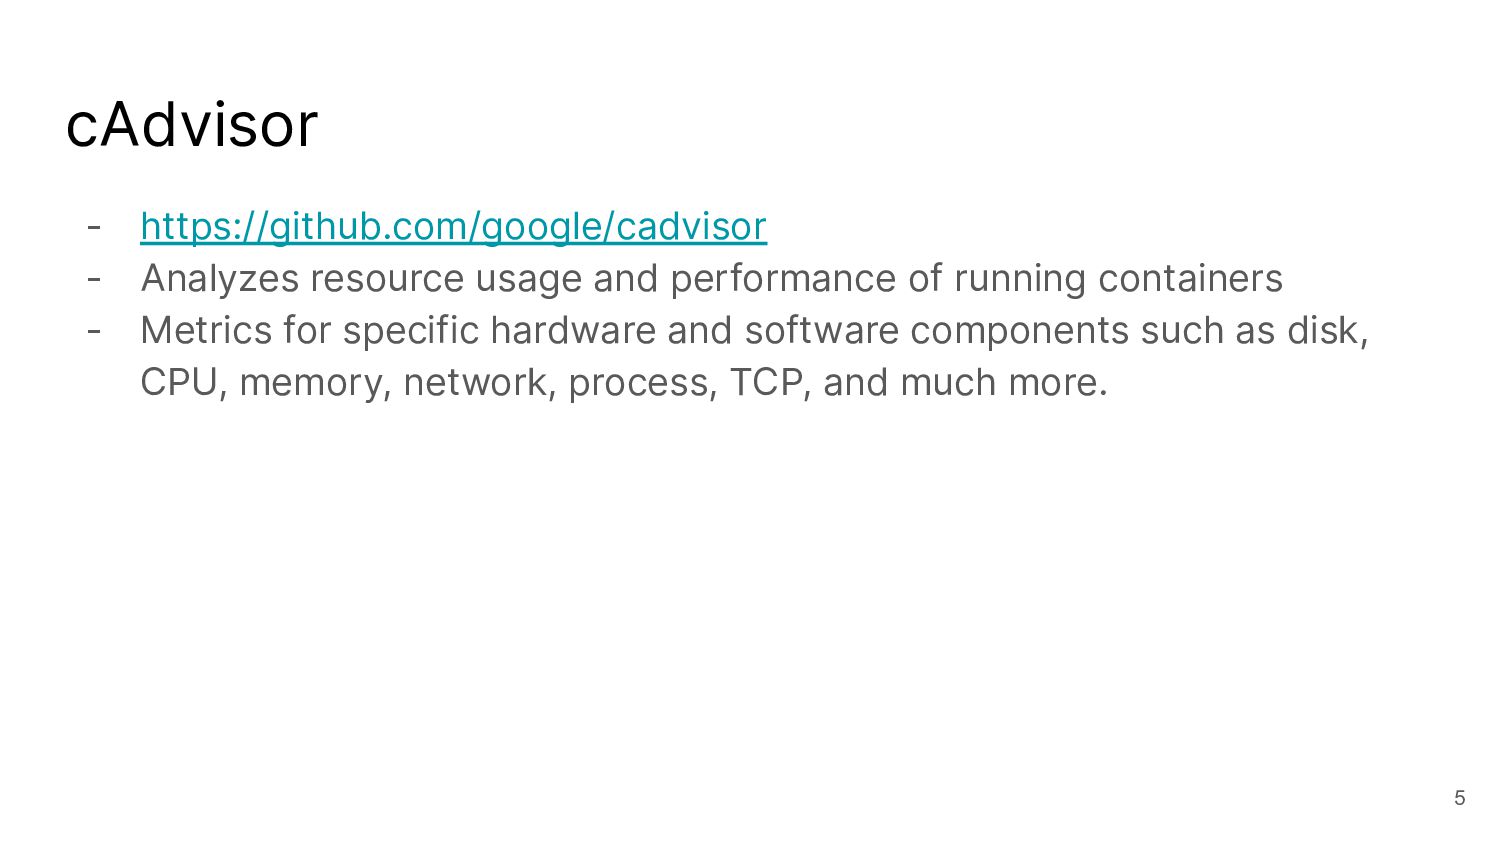
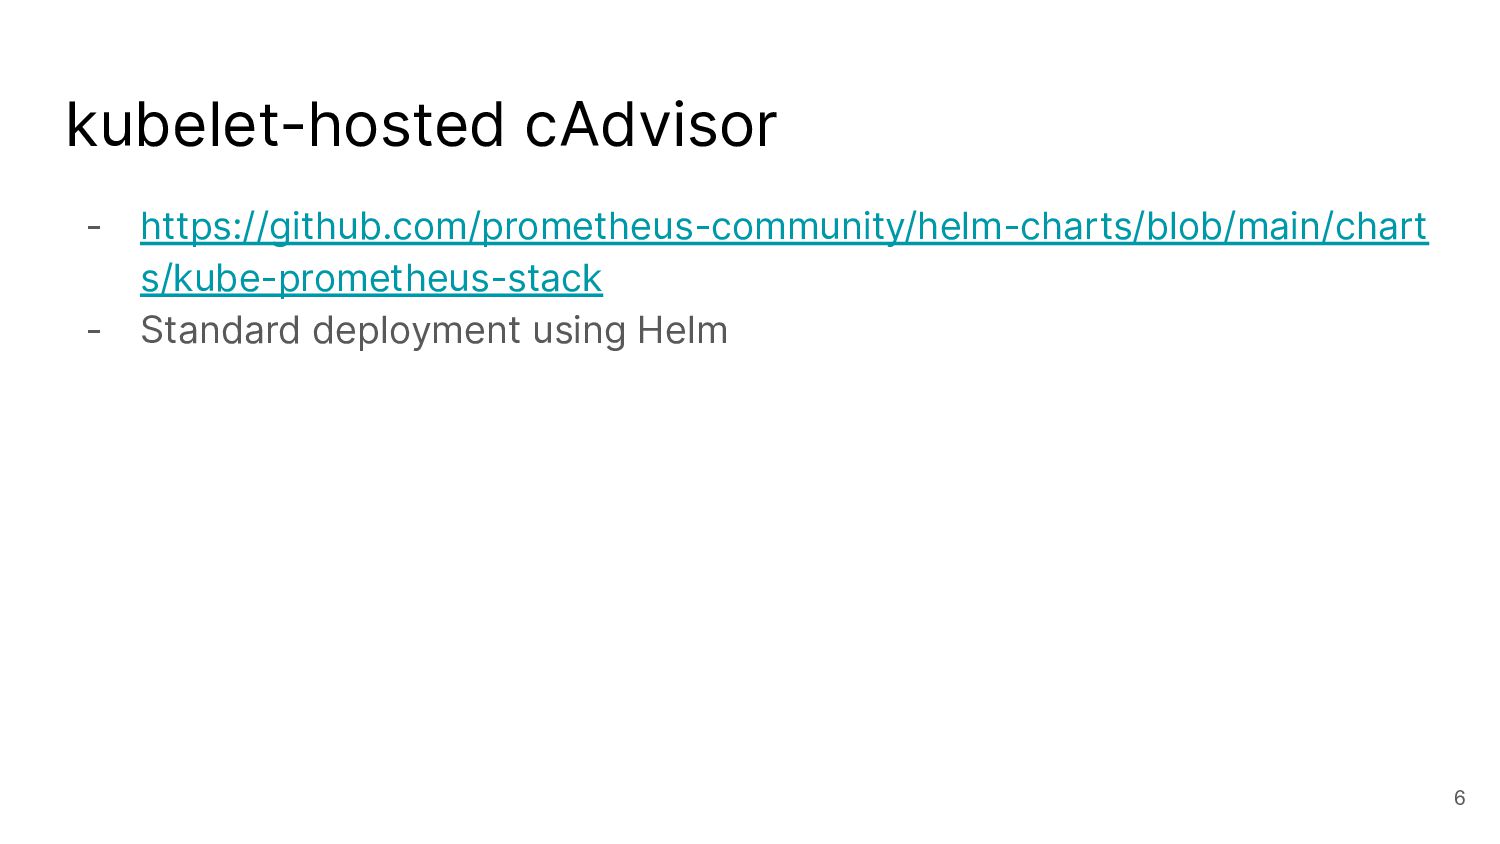
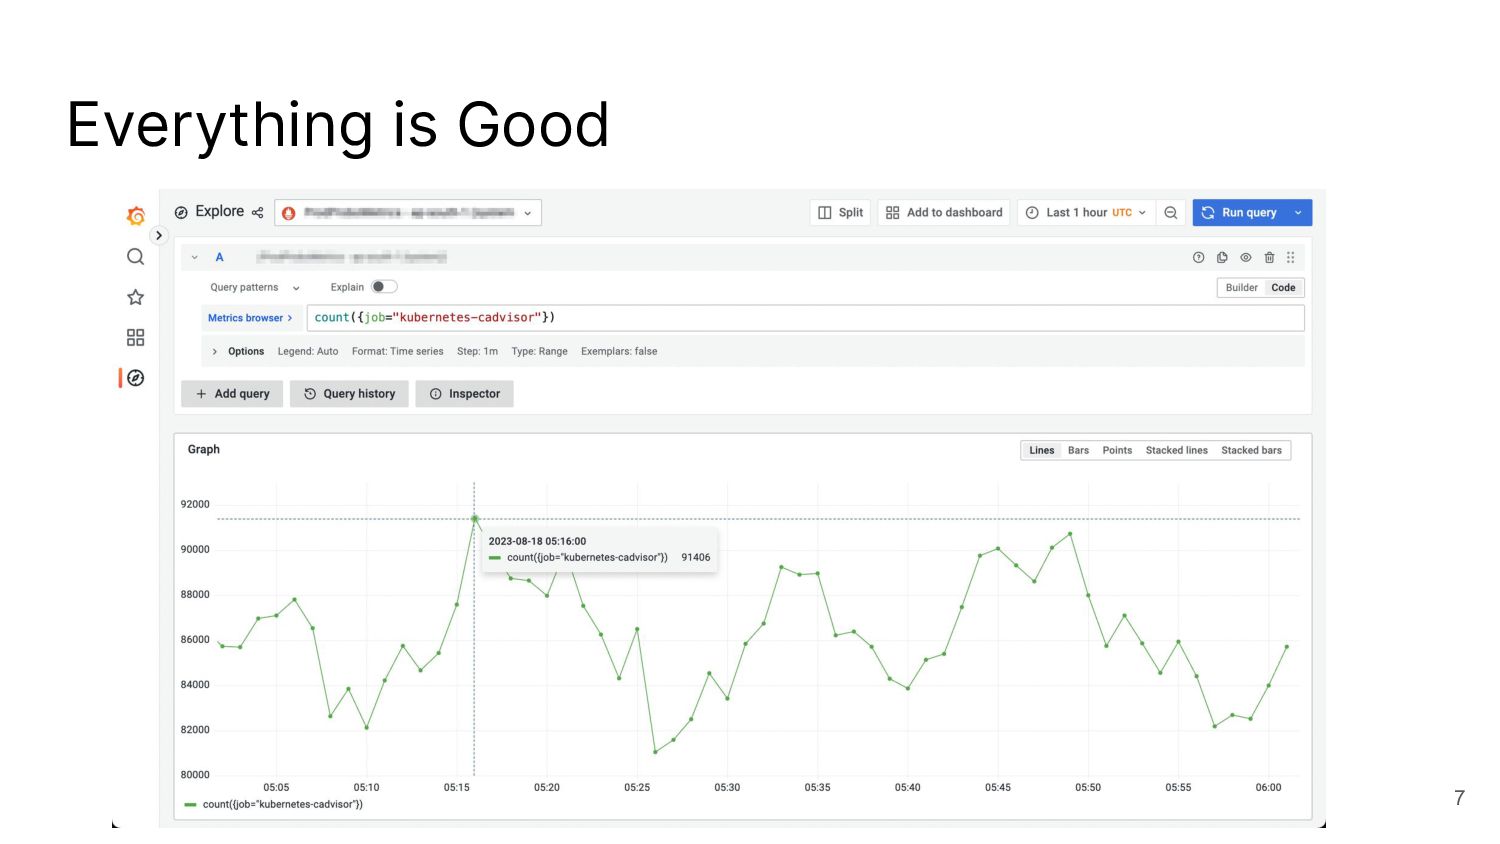
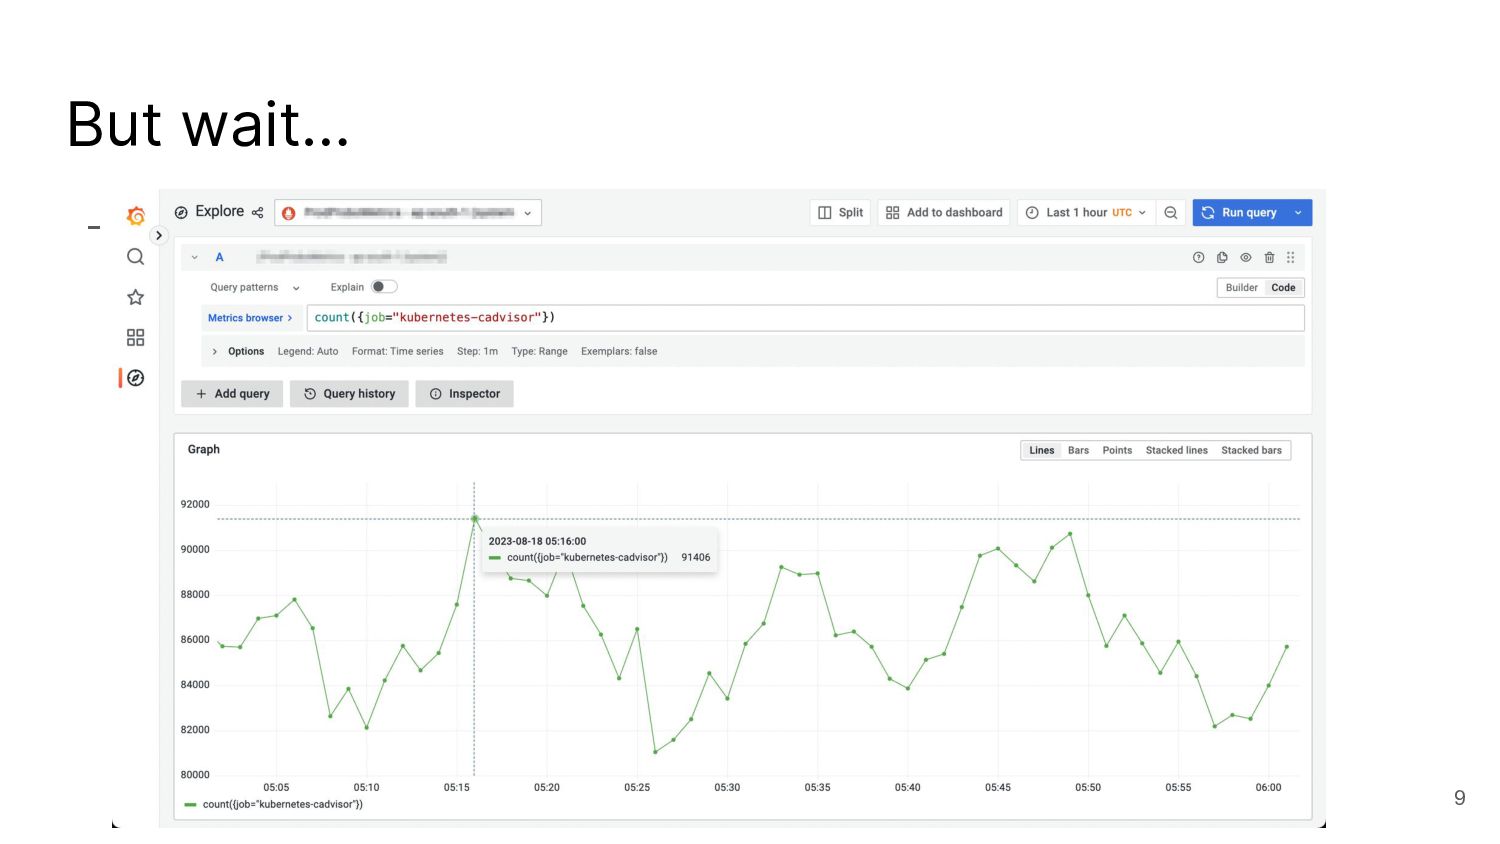
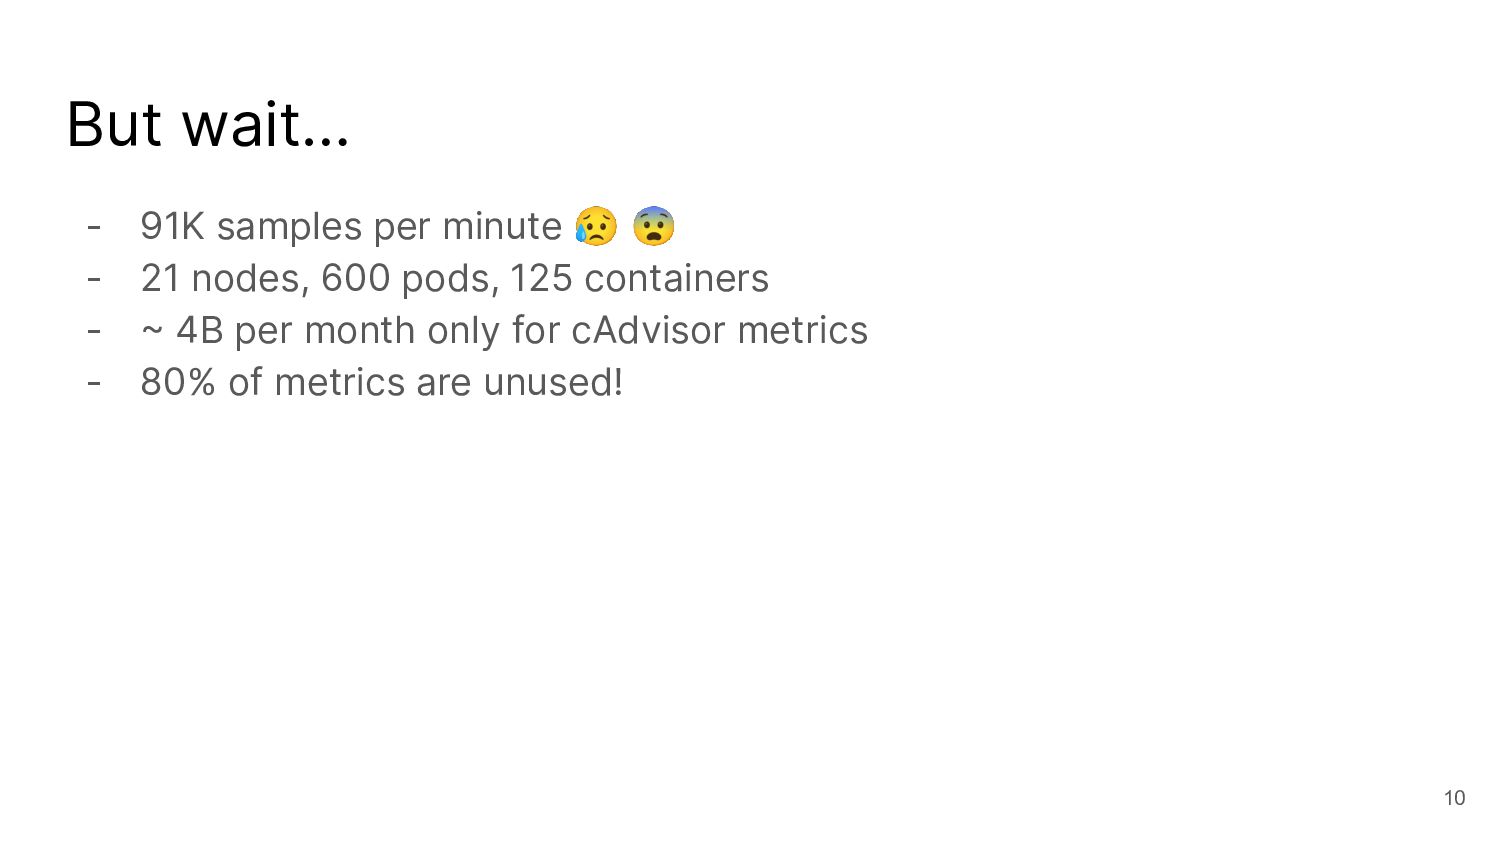
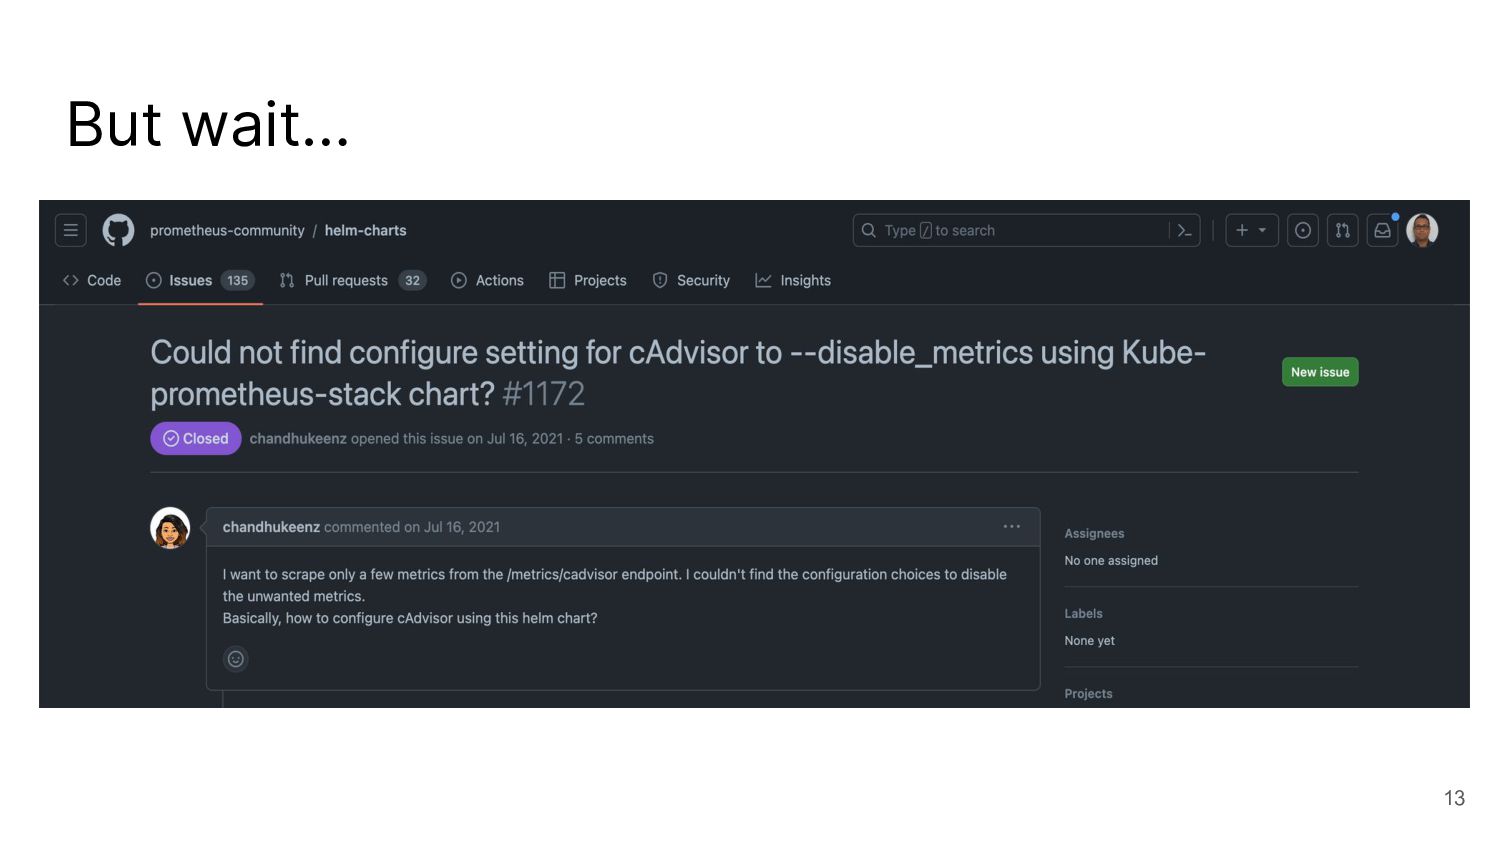
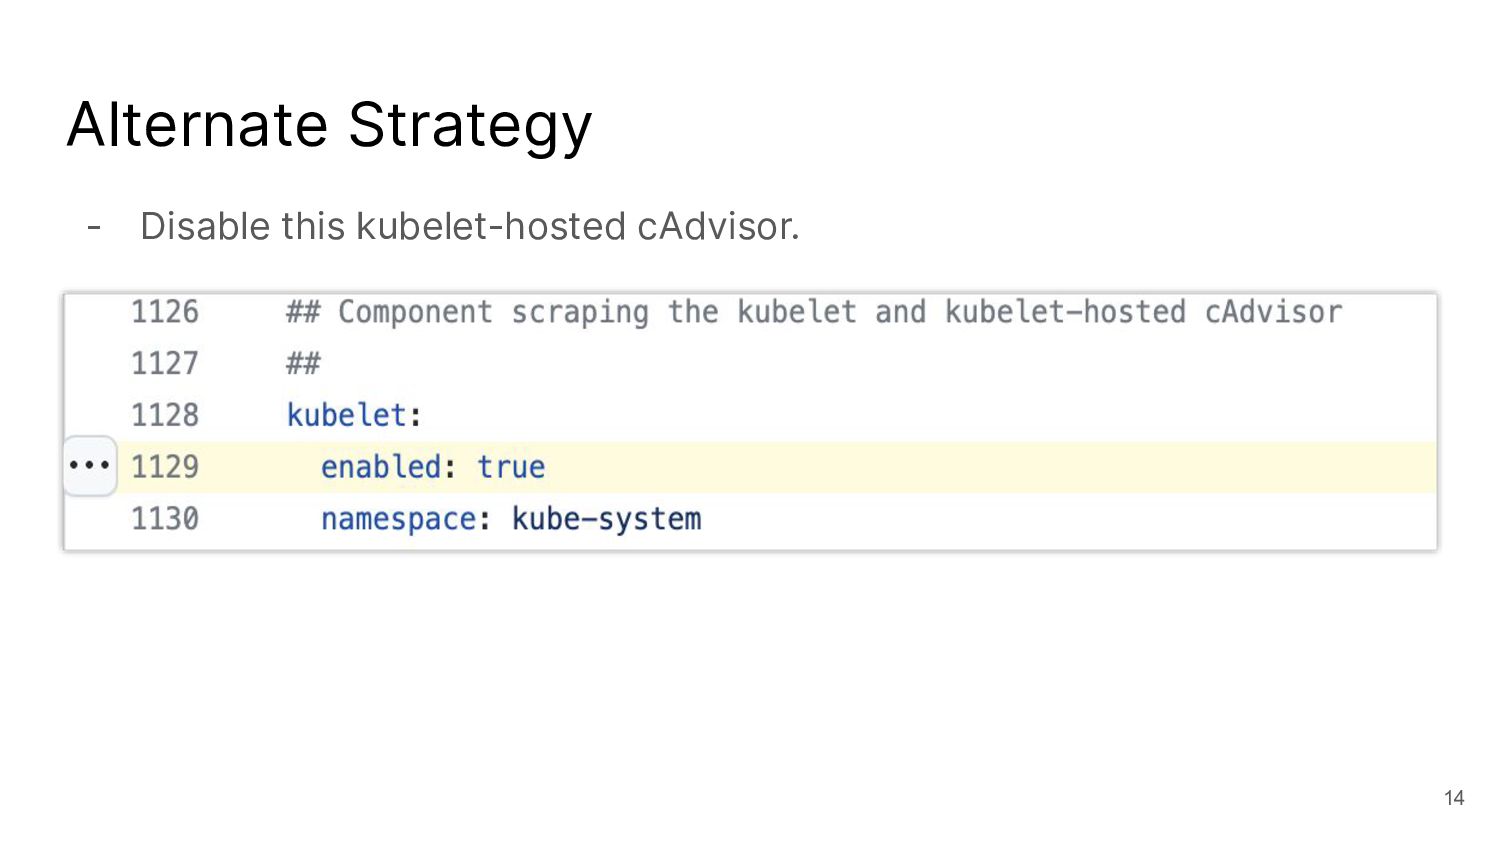
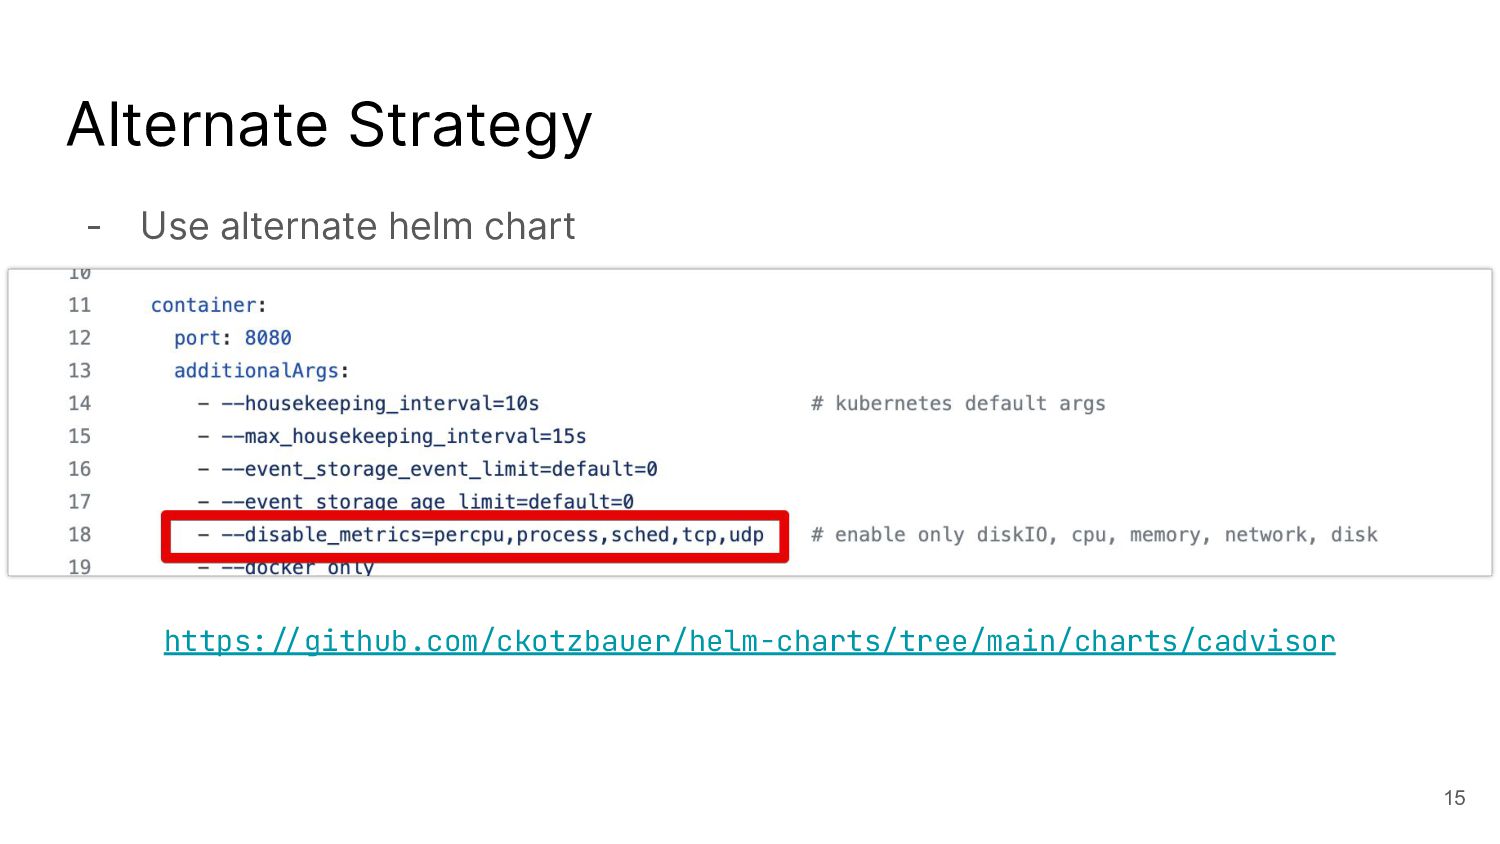
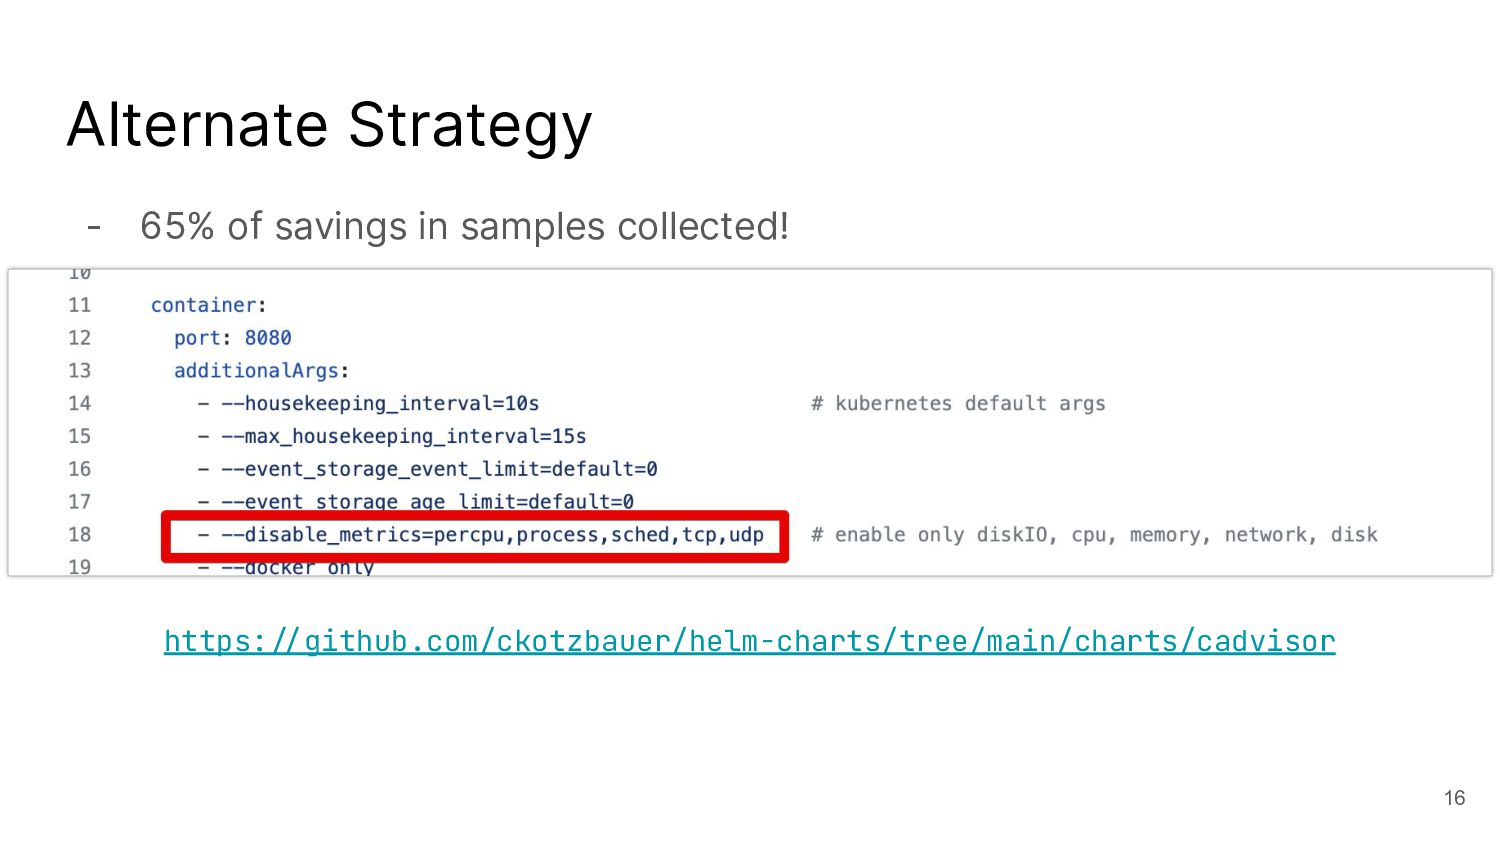
I talked about a story on reducing the number of metrics with cAdvisor, which is not possible with the out-of-the-box helm chart.

Related blog posts -

Prometheus Operator Guide

Kubernetes Monitoring with Prometheus and Grafana

How to restart Kubernetes Pods with kubectl

Read more of my writing at https://last9.io/blog/authors/prathamesh

Prathamesh Sonpatki

September 17, 2023
Tweet

More Decks by Prathamesh Sonpatki

Other Decks in Technology

Transcript

  1. Setting up Monitoring for
    Kubernetes
    Prathamesh Sonpatki
    Last9.io
    1

    View Slide

  2. 2

    View Slide

  3. Monitoring is crucial
    - Prometheus is King of Kubernetes Monitoring 🔥
    - Kube-Prometheus-Stack
    - Container level monitoring via cAdvisor
    - Cluster level monitoring via Kube State Metrics
    3

    View Slide

  4. Story of optimizing cAdvisor metrics
    4

    View Slide

  5. cAdvisor
    - https://github.com/google/cadvisor
    - Analyzes resource usage and performance of running containers
    - Metrics for specific hardware and software components such as disk,
    CPU, memory, network, process, TCP, and much more.
    5

    View Slide

  6. kubelet-hosted cAdvisor
    - https://github.com/prometheus-community/helm-charts/blob/main/chart
    s/kube-prometheus-stack
    - Standard deployment using Helm
    6

    View Slide

  7. Everything is Good
    7

    View Slide

  8. Everything is Good.. Right?
    8

    View Slide

  9. But wait…
    -
    9

    View Slide

  10. But wait…
    - 91K samples per minute 😥 😨
    - 21 nodes, 600 pods, 125 containers
    - ~ 4B per month only for cAdvisor metrics
    - 80% of metrics are unused!
    10

    View Slide

  11. The ratio of metric samples scanned/evaluated
    over those ingested is never 1:1.
    11

    View Slide

  12. Let’s take an action
    - We don’t need all of the
    - Accelerator
    - Disk
    - diskIO
    - Network
    - ..
    - TCP
    - …
    - Let’s disable these metrics with `/-disable_metrics`
    12

    View Slide

  13. But wait…
    - We don’t need all of the
    - Accelerator
    - Disk
    - diskIO
    - Network
    - ..
    - TCP
    - …
    - Let’s disable these metrics with `/-disable_metrics`
    13

    View Slide

  14. Alternate Strategy
    - Disable this kubelet-hosted cAdvisor.
    14

    View Slide

  15. Alternate Strategy
    - Use alternate helm chart
    -
    15
    https://github.com/ckotzbauer/helm-charts/tree/main/charts/cadvisor

    View Slide

  16. Alternate Strategy
    - 65% of savings in samples collected!
    16
    https://github.com/ckotzbauer/helm-charts/tree/main/charts/cadvisor

    View Slide

  17. Prathamesh Sonpatki
    Last9.io
    Srestories.dev
    o11y.wiki
    17

    View Slide