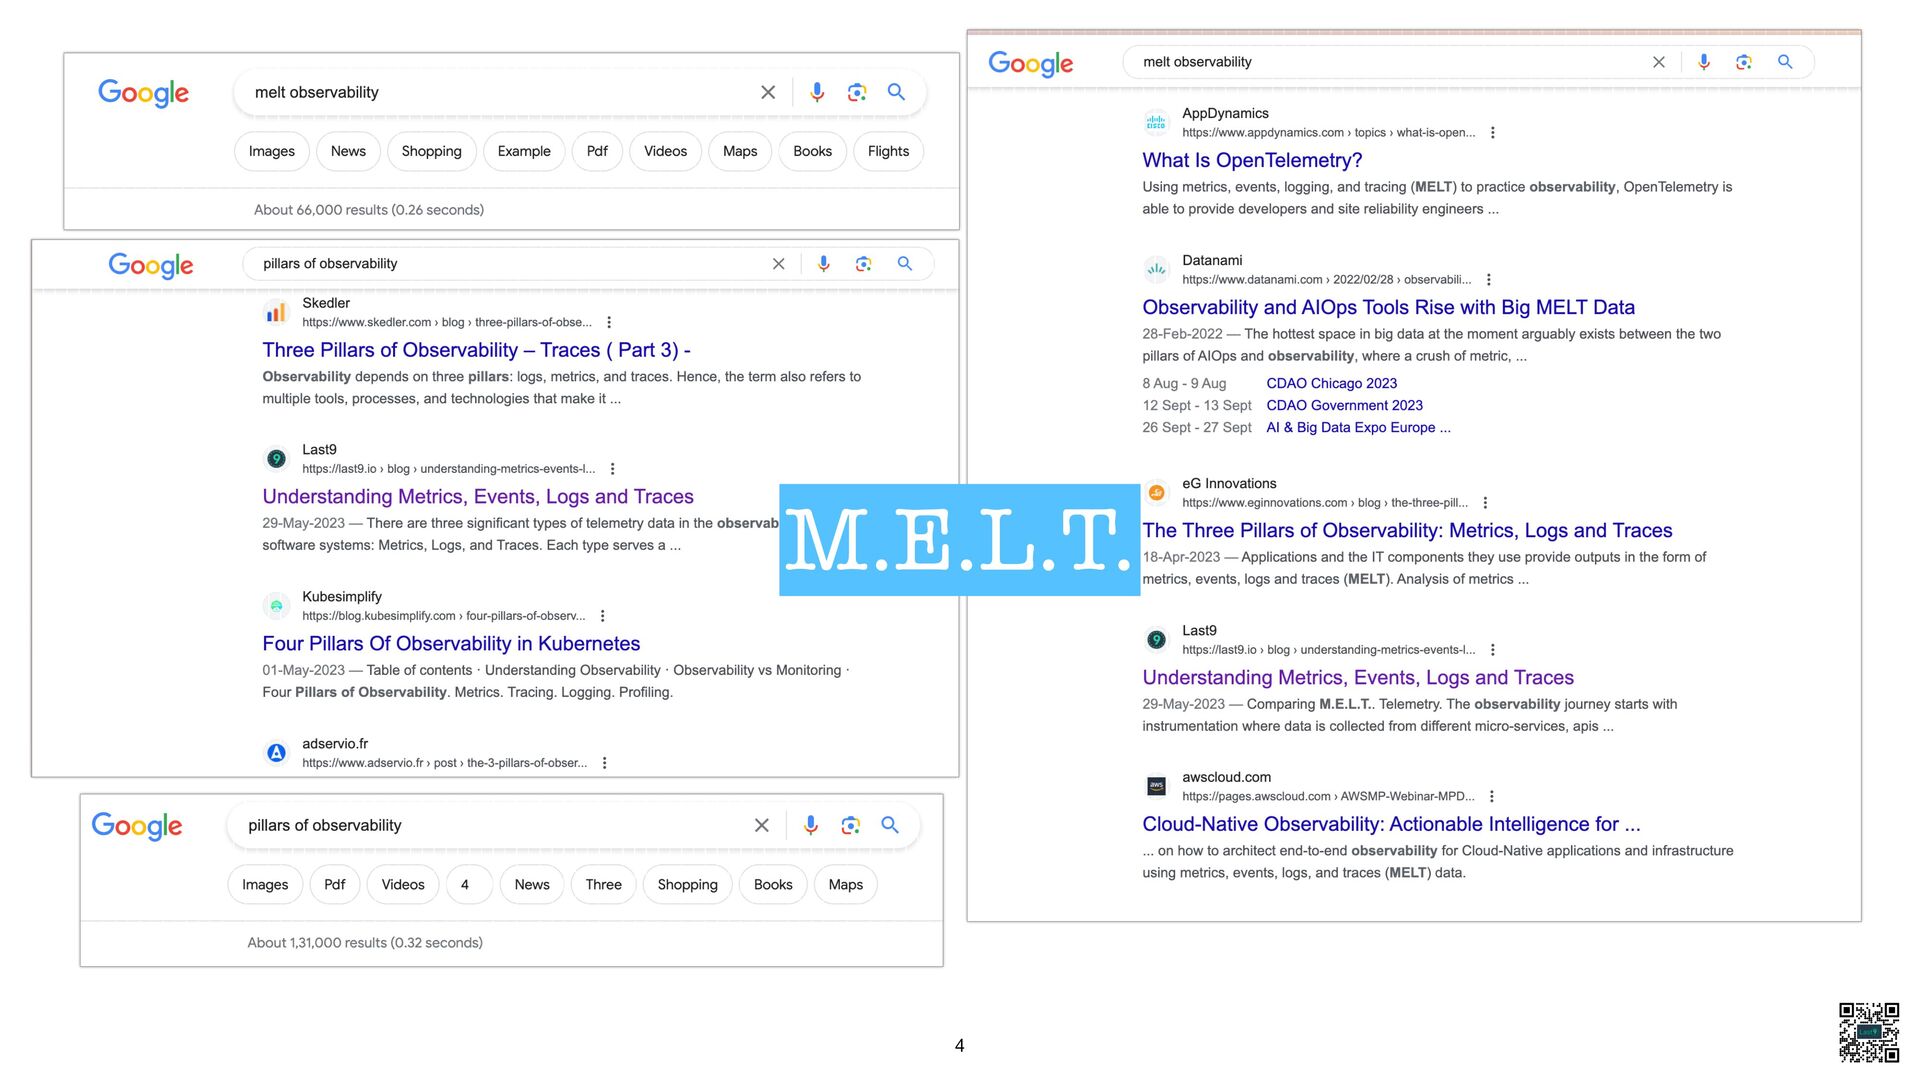
Upgrade to Pro — share decks privately, control downloads, hide ads and more …

Monitoring vs. Debugging - SRE BLR Meetup

Monitoring vs. Debugging - SRE BLR Meetup

Prathamesh Sonpatki

July 29, 2023
Tweet

More Decks by Prathamesh Sonpatki

Other Decks in Technology

Transcript

  1. SRE BLR Meetup 29th July You -> Me-> 🌮 🍱

    Prathamesh Sonpatki, last9.io 2
  2. 3

  3. 5

  4. 7

  5. Why this matters today? • Workloads have changed • Infra

    is cattle - ephemeral • Services are dynamic • Push to Cloud A 3 node cluster running 10 namespaces with 5 deployments with a replica set of ~3-5 with 10 config maps emits whooping 16566 time series per minute using the popular kube-state-metrics library 8
  6. Why this matters today? • Workloads have changed • Infra

    is cattle - ephemeral • Services are dynamic • Push to Cloud • Pod Metrics • Deployment Metrics • ReplicaSet Metrics • StatefulSet Metrics • DaemonSet Metrics • Job Metrics • Service Metrics • Namespace Metrics • Node Metrics 9
  7. Why this matters today? • Volume • Velocity • Variety

    • Complexity •C.O.S.T. - Cardinality - Operations - Scale - Toil 11
  8. 12

  9. Outcomes we want • To not have downtimes • To

    mitigate problems quickly • To debug a failure • To know how the system is behaving in real time • To co-relate an outage to a hardware failure • To fi nd anomalies and patterns • To trace a payment failure • To fi nd out unknown failures before they happen • To prevent hampering customer experience and business impact 13
  10. Questions we ask • What is wrong? • Did we

    change anything? • What do we do so this doesn’t repeat? 14
  11. Answers we want • Know • Communicate • Recover •

    Analyse • Debug • Root cause 15
  12. Answers we want • System Health • Quick Decisions •

    Time • Root Cause • Testing • Correctness 16
  13. Logs • Can be literally anything -> Unstructured logs •

    Standard programs -> Structured logs 19
  14. • Getting Started ✅ • Adoption ✅ • Debugging ✅

    • Relationships 🥲 Logs • Volume 🥲 • Standardisation 🥲 • Health 🥲 • System insights 🥲 20
  15. • Bene fi ts of aggregation • Less volume •

    Patterns, Trends, Insights Logs2Metrics 21
  16. • Getting Started 😐 • Adoption ✅ • Debugging 🥲

    • Relationships 🥲 Metrics • Volume ✅ • Standardisation ✅ • Health ✅ • System insights ✅ 24
  17. • Getting Started 😐 • Adoption 🥲 • Debugging ✅

    • Relationships ✅ Traces • Volume 😐 • Standardisation ✅ • Health 🥲 • System insights 🥲 27
  18. Events • Structured logs? • Schema based? • Domain Events

    • Easier to adopt? • Can unlock co-relation • Dimensionality 29
  19. • Getting Started 😐 • Adoption 🥲 • Debugging ✅

    • Relationships 🥲 Events • Volume ✅ • Standardisation 🥲 • Health ✅ • System insights ✅ 30
  20. Answers we want • Know • Communicate • Recover •

    Analyse • Debug • Root cause Real Time Post Factor 31
  21. Common Goals, Common Ground • Continue to leverage open source

    innovations • Multiple options • No Truck factor 33
  22. Common Goals, Common Ground • Continue to leverage open source

    innovations • Multiple options • No Truck factor 34
  23. OpenAPM • Metrics for APM • Based on open-source Prometheus,

    OpenMetrics and Grafana • Support for NodeJS and Golang • https://github.com/last9/nodejs-openapm/ 35
  24. 80% of Telemetry data is unused • Yet, we store

    it and pay for the data that is unused! • Slow dashboards, concurrent access woes • No real time alerting 38
  25. Control Levers • Treat workloads di ff erently • Tiers

    • Policies • Declarative Observability 40
  26. Control Levers • Treat workloads di ff erently • Tiers

    • Policies • Declarative Observability 41