Upgrade to Pro — share decks privately, control downloads, hide ads and more …

Track memory leaks in Python by Victor Stinner

PyCon 2014
April 12, 2014
1.3k

Track memory leaks in Python by Victor Stinner

PyCon 2014

April 12, 2014
Tweet

More Decks by PyCon 2014

Transcript

  1. Pycon 2014, Montréal
    Victor Stinner
    [email protected]
    Distributed under CC BY-SA license: http://creativecommons.org/licenses/by-sa/3.0/
    Track memory
    leaks in Python

    View Slide

  2. Python core developer since 2010
    github.com/haypo/
    bitbucket.org/haypo/
    Working for eNovance
    Victor Stinner

    View Slide

  3. a.b = b
    b.a = a
    # a → b → a
    a = None
    b = None
    # a and b are not deleted
    Reference cycle

    View Slide

  4. a.b = b
    b.a = weakref.ref(a)
    # b.a() is a
    a = None # delete a
    # b.a() is None
    Reference cycle

    View Slide

  5. >>> import gc
    >>> data = {'abc': 123}
    >>> gc.get_referents(data)
    ['abc', 123]
    View the references

    View Slide

  6. http://mg.pov.lt/objgraph/
    View the references
    objgraph project

    View Slide

  7. Representative for the system
    Coarse measurement
    Heap fragmentation
    Difficult to exploit
    RSS memory

    View Slide

  8. Heap fragmentation
    Used 2 MB / RSS 2 MB
    Used 10 MB / RSS 10 MB
    Used 1.5 MB / RSS 10 MB
    Allocate 8 MB
    Release 8.5 MB

    View Slide

  9. Mem usage Increment Line Contents
    =====================================
    @profile
    5.97 MB 0.00 MB def my_func():
    13.61 MB 7.64 MB a = [1] * (10 ** 6)
    166.20 MB 152.59 MB b = [2] * (10 ** 8)
    13.61 MB -152.59 MB del b
    13.61 MB 0.00 MB return a
    memory_profiler
    http://pypi.python.org/pypi/memory_profiler

    View Slide

  10. >>> data = {None: b'x' * 10000}
    >>> sys.getsizeof(data)
    296
    >>> sum(sys.getsizeof(ref)
    ... for ref in gc.get_referents(data))
    10049
    Manual computation

    View Slide

  11. List all Python objects:
    gc.get_objects()
    Compute the objects size
    Group objects by type
    Heapy, Pympler, Melia

    View Slide

  12. Total 17916 objects, 96 types,
    Total size = 1.5MiB
    Count Size Kind
    701 546,460 dict
    7,138 414,639 str
    208 94,016 type
    1,371 93,228 code
    ...
    Heapy, Pympler, Melia

    View Slide

  13. Don't trace all the memory
    (ex: zlib)
    Don't provide the origin of objects
    Difficult to exploit
    Heapy, Pympler, Melia

    View Slide

  14. PyMem_GetAllocator()
    PyMem_SetAllocator()
    Replace memory allocators
    Set up a hook on allocators
    Implemented in Python 3.4
    PEP 445: API malloc()

    View Slide

  15. traces = {}
    def trace_malloc(size):
    ptr = malloc(size)
    if ptr:
    tb = traceback.extract_stack()
    traces[ptr] = (size, tb)
    return ptr
    PEP 454: tracemalloc

    View Slide

  16. def trace_free(ptr):
    if ptr in traces:
    del traces[ptr]
    free(ptr)
    PEP 454: tracemalloc

    View Slide

  17. No overhead when disabled
    Get the traceback where an object was
    allocated
    Compute statistics per filename, line
    number or traceback
    Compute differences between two
    snapshots
    Tracemalloc features

    View Slide

  18. View Slide

  19. tracemallocqt

    View Slide

  20. tracemallocqt

    View Slide

  21. tracemallocqt

    View Slide

  22. tracemallocqt

    View Slide

  23. Available at PyPI
    Require to patch and recompile Python
    ... maybe also recompile Python
    extensions written in C
    Patches for Python 2.7 and 3.3
    Ubuntu packages
    tracemalloc backport

    View Slide

  24. Questions ?
    http://pytracemalloc.readthedocs.org/
    Distributed under CC BY-SA license: http://creativecommons.org/licenses/by-sa/3.0/
    Contact :
    [email protected]

    View Slide

  25. Display top 10 lines
    import tracemalloc
    tracemalloc.start()
    # or: python -
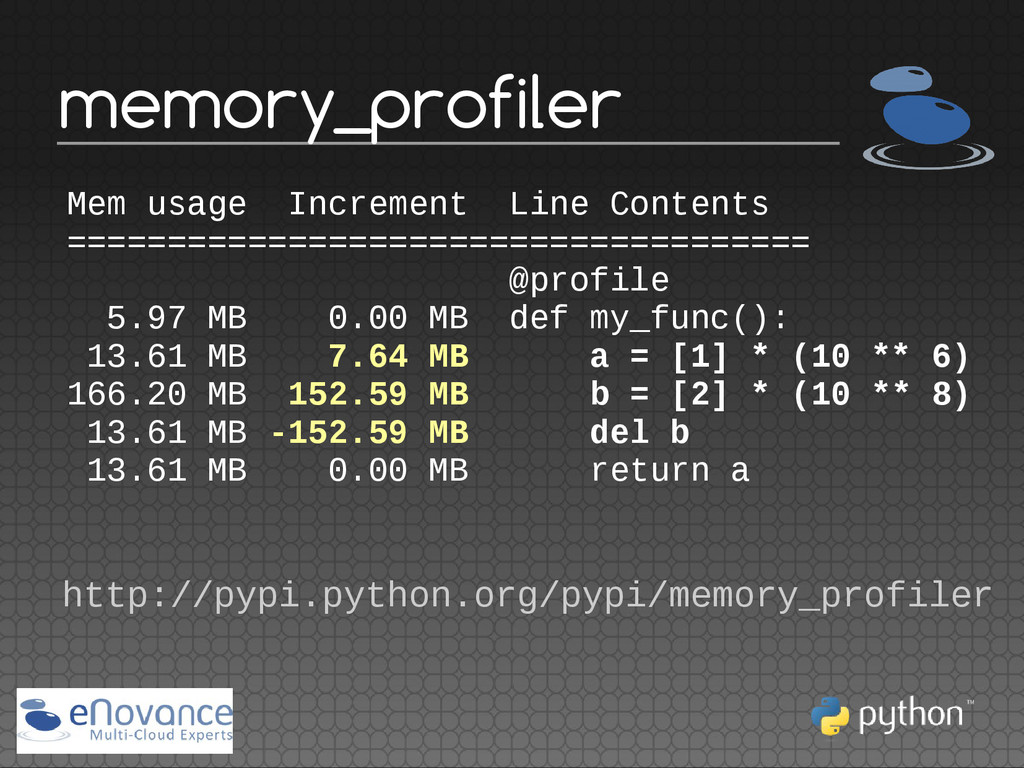
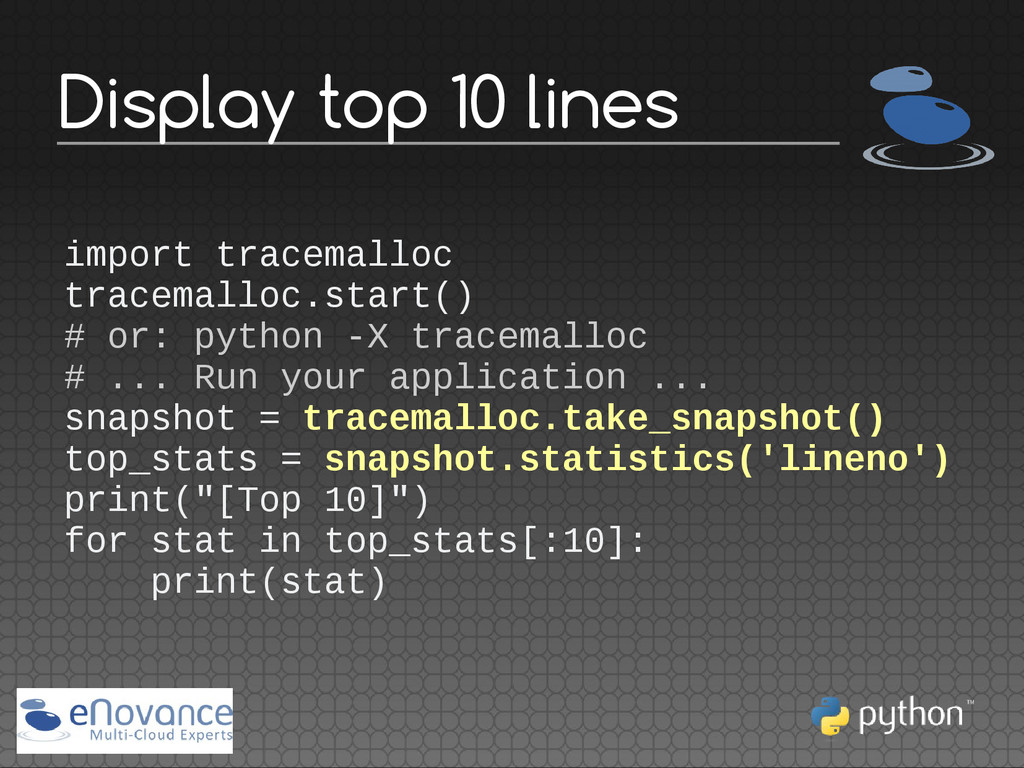
X tracemalloc
    # ... Run your application ...
    snapshot = tracemalloc.take_snapshot()
    top_stats = snapshot.statistics('lineno')
    print("[Top 10]")
    for stat in top_stats[:10]:
    print(stat)

    View Slide

  26. Get object traceback
    import tracemalloc
    tracemalloc.start(25)
    # or: python -X 
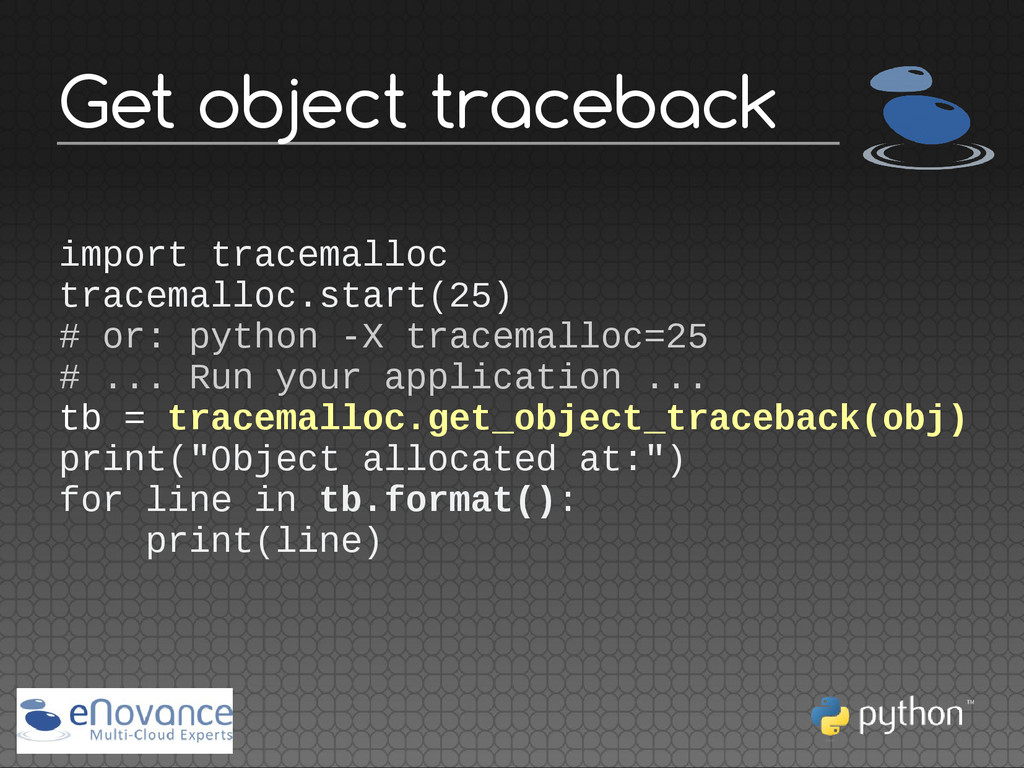
tracemalloc=25
    # ... Run your application ...
    tb = tracemalloc.get_object_traceback(obj)
    print("Object allocated at:")
    for line in tb.format():
    print(line)

    View Slide

  27. Ticket opened in 2008
    Patch proposed in march 2013
    Patch commited in june 2013
    Commit reverted => PEP 445
    Better API thanks to the PEP
    BDFL delegate: Antoine Pitrou
    PEP 445 (API malloc)

    View Slide

  28. Store the traceback, not just 1 frame
    Code rewritten from scratch
    Much better API
    Exchanges with Kristján Valur Jónsson
    BDFL delegate: Charles-François Natali
    PEP 454 (tracemalloc)

    View Slide

  29. "pymalloc": PyObject_Malloc()
    Allocate chunks of 256 KB
    Alignment on 8 bytes
    Used for size <= 512 bytes, or fallback to
    malloc()
    Python 3.4: use mmap() or VirtualAlloc()
    Python allocator

    View Slide

  30. Thanks David Malcom
    for the LibreOffice model
    http://dmalcolm.livejournal.com/

    View Slide