Upgrade to Pro — share decks privately, control downloads, hide ads and more …

Python, Pet of Architects by Navid Hatefnia

Pycon ZA
October 06, 2016

Python, Pet of Architects by Navid Hatefnia

Brand-new challenges have arisen in the field of three-dimensional space and form, such as; architecture, geometry, material, and even energy, which requires in thorough investigation and understanding of the outcomes to discover optimum design solutions. However, without this understanding, analysis and the overlay of interactive data seems impossible and fanciful. Although it was not possible to analyse and use data in traditional architecture, today it is getting real to do with the large volumes of information such as, annual climatic data, sun positions, environmental data, energy data etc.

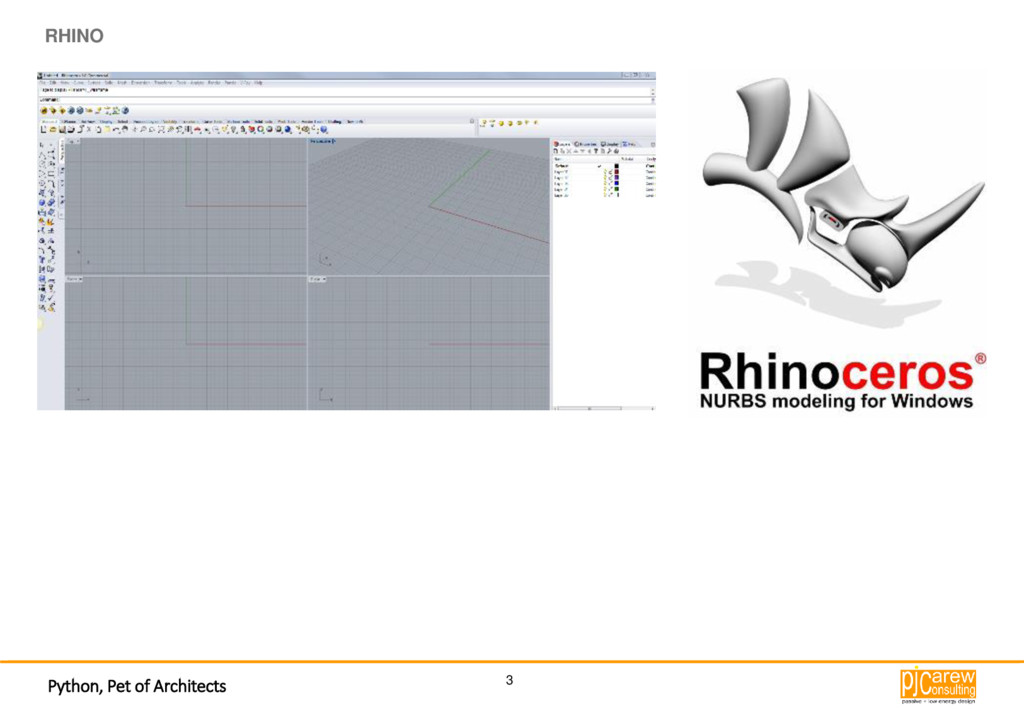
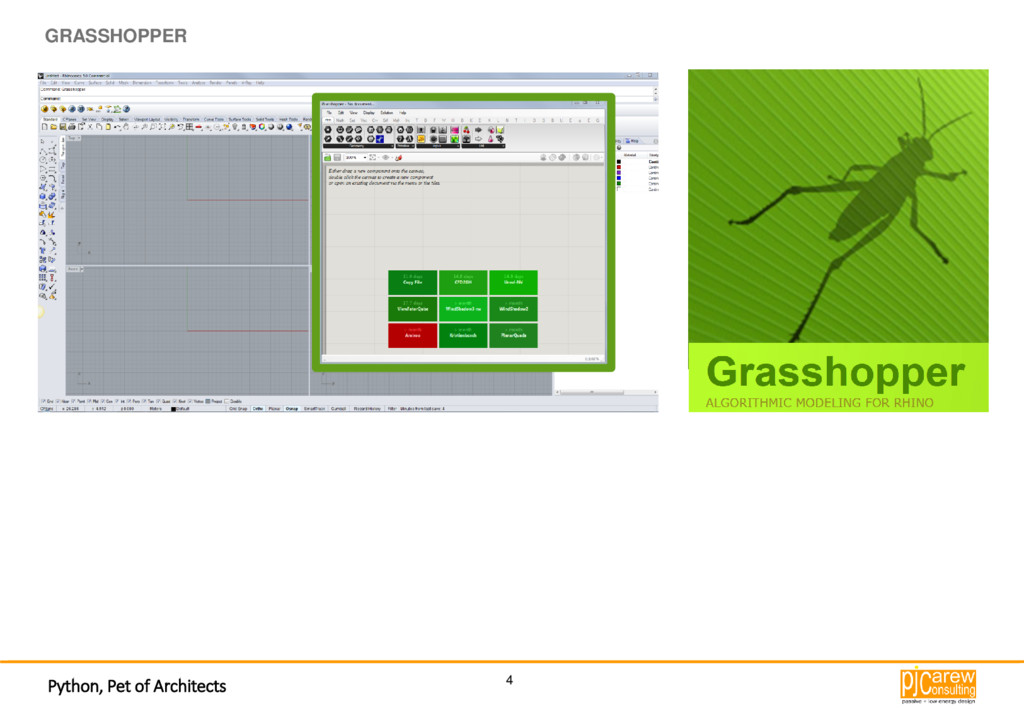
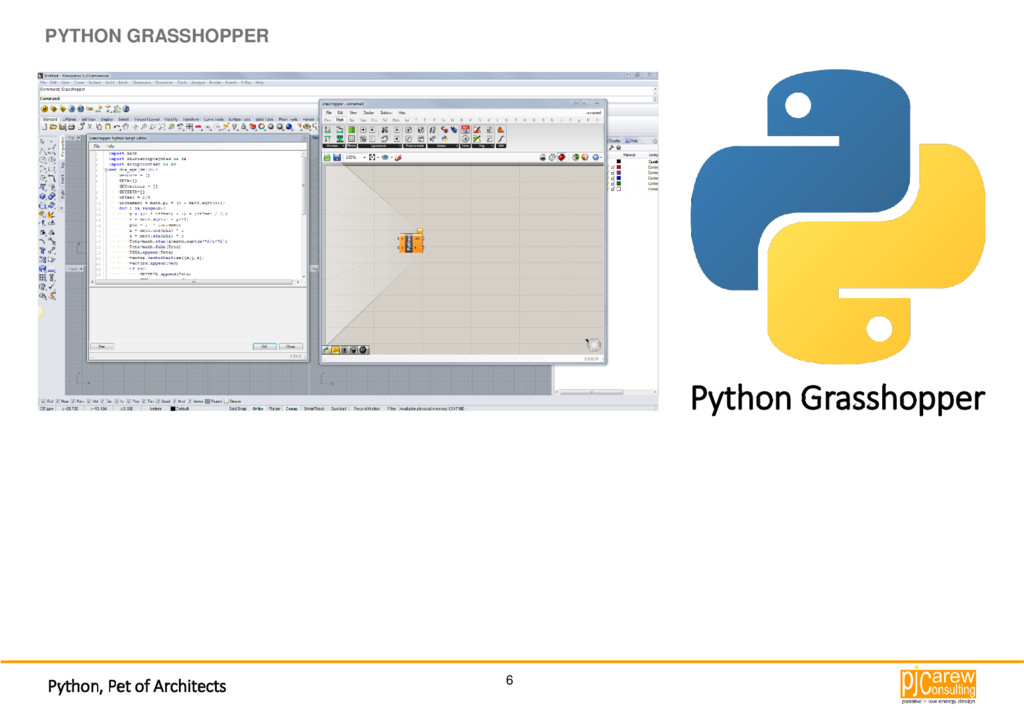
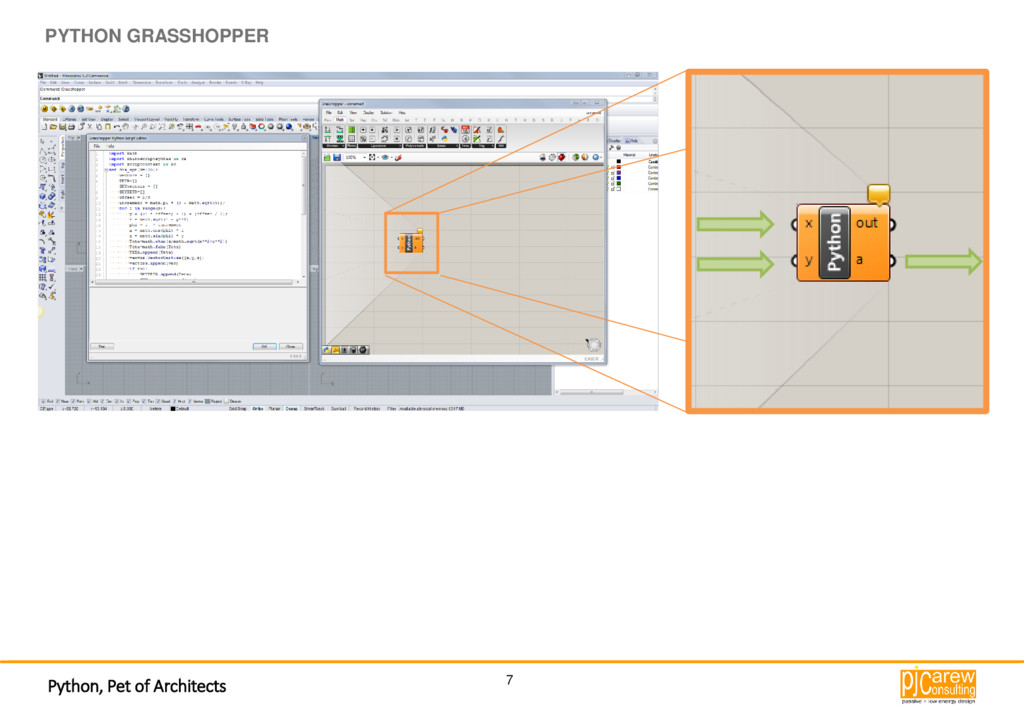
Python is the most adaptable and robust program which we use to analyse, overlay and optimise data in the field of architecture. We want to understand how it works in a three-dimensional program such as Rhino and how it can help us to develop our ideas and utilise the recent architectural design methodology, which is known as parametric architecture, or algorithmic architecture.

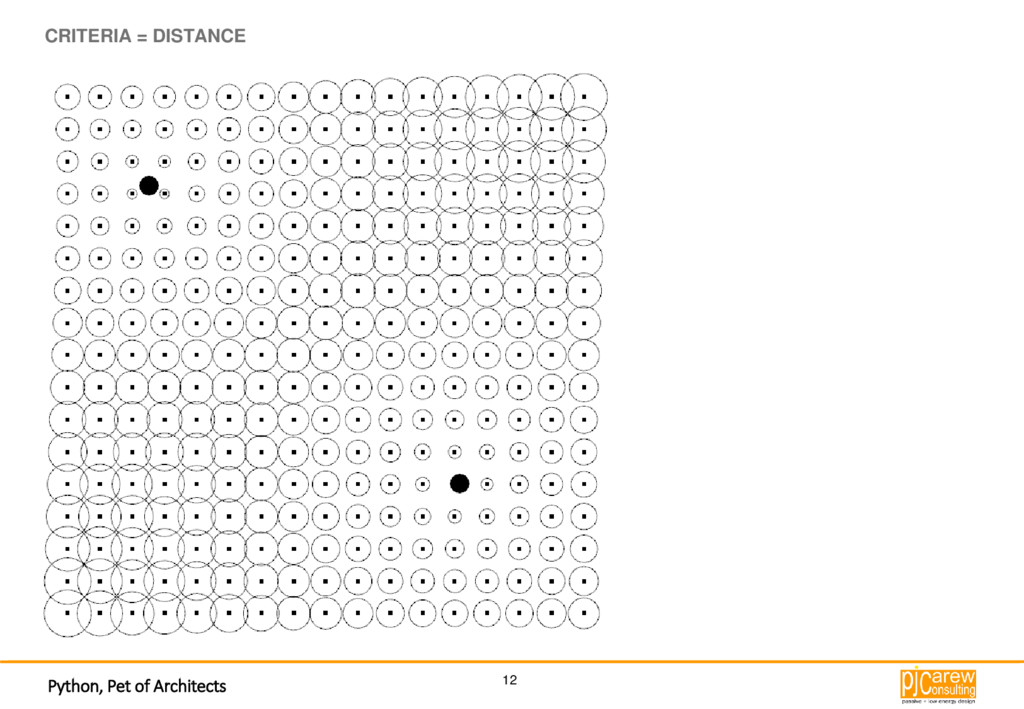
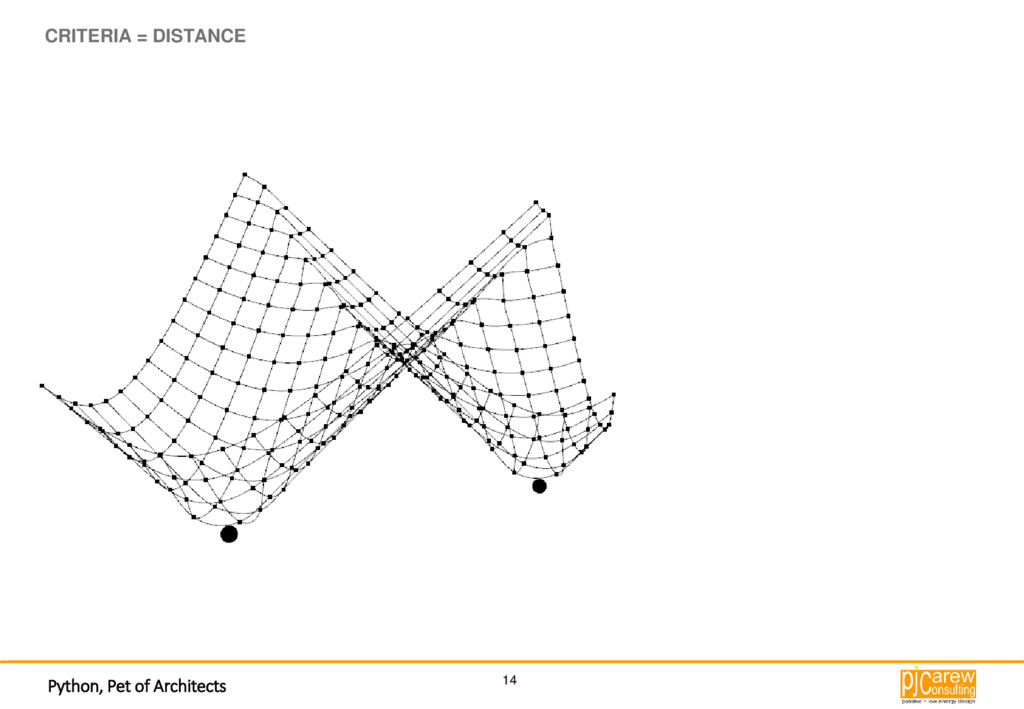
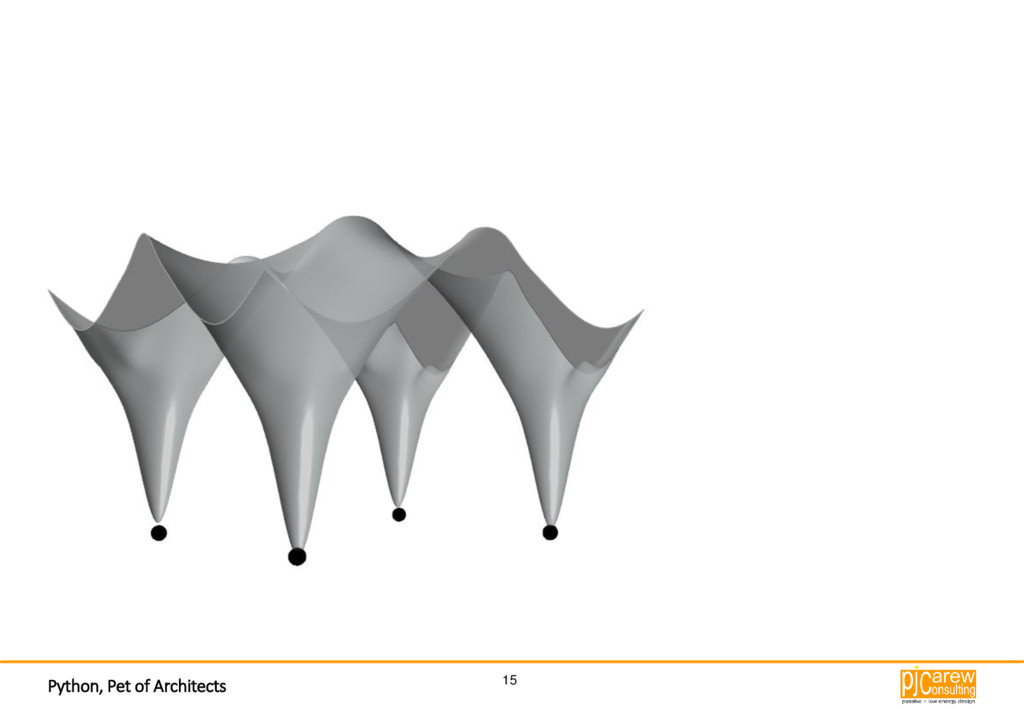
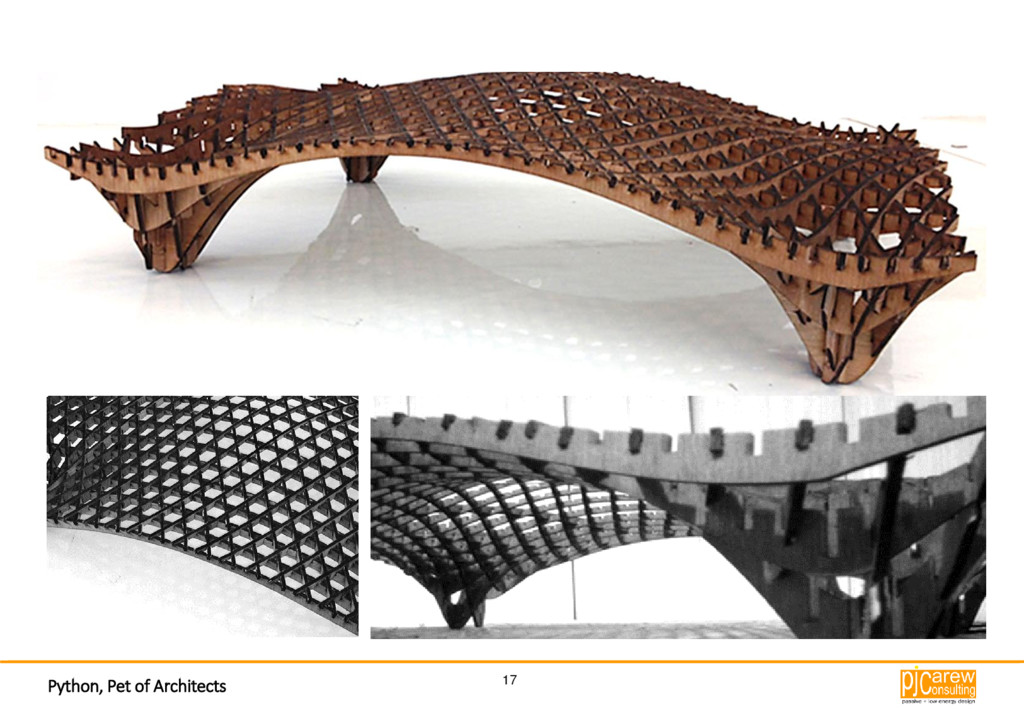
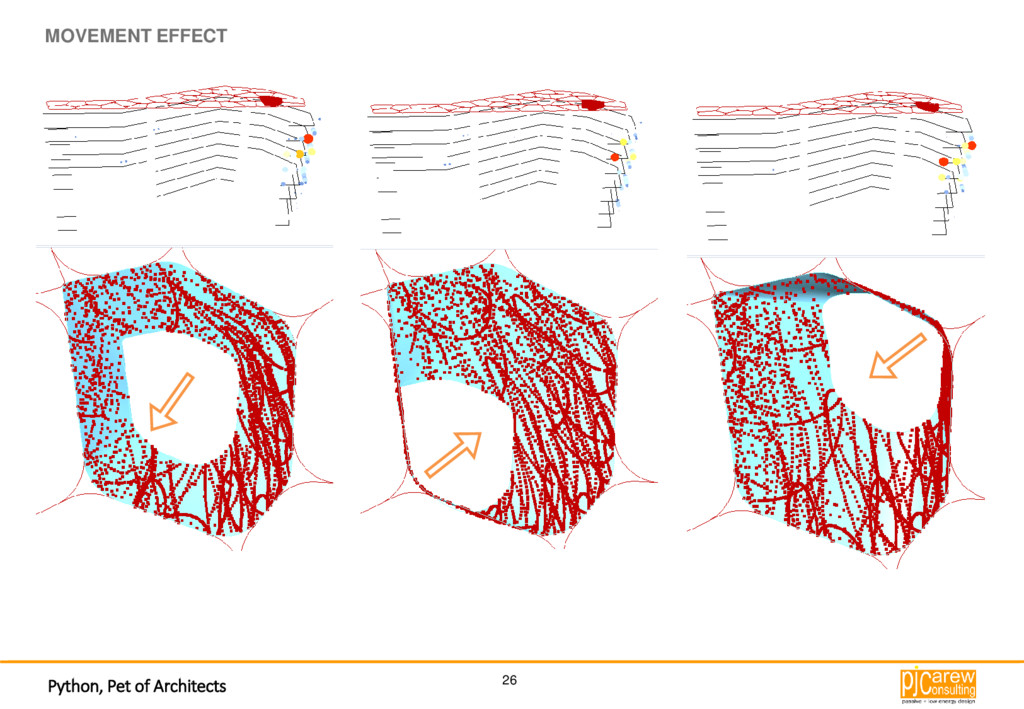
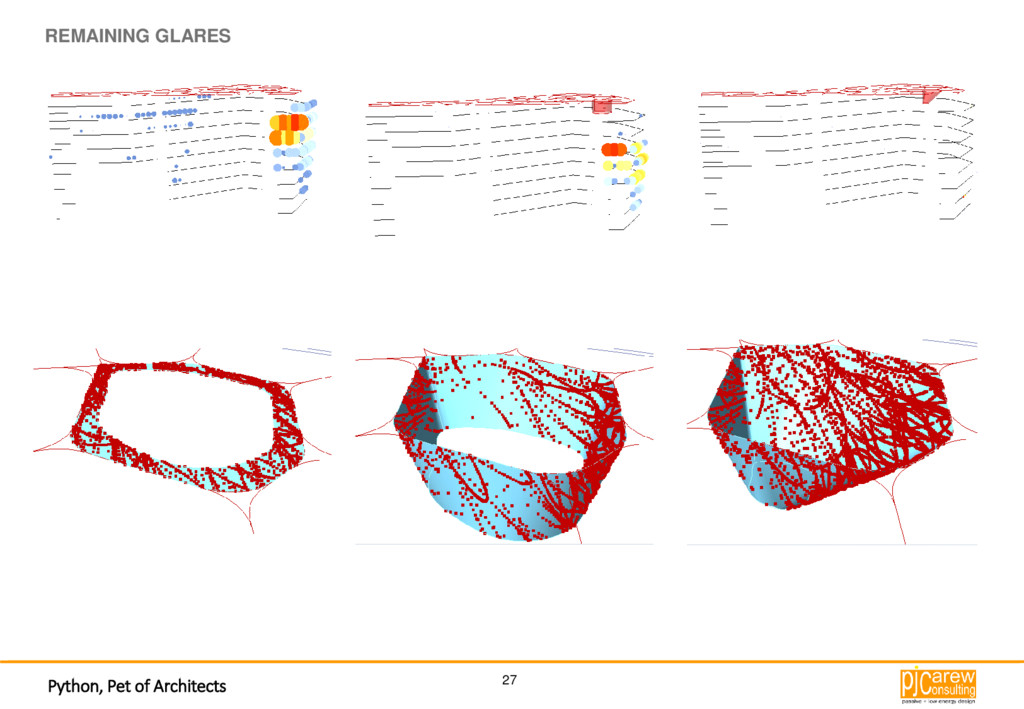
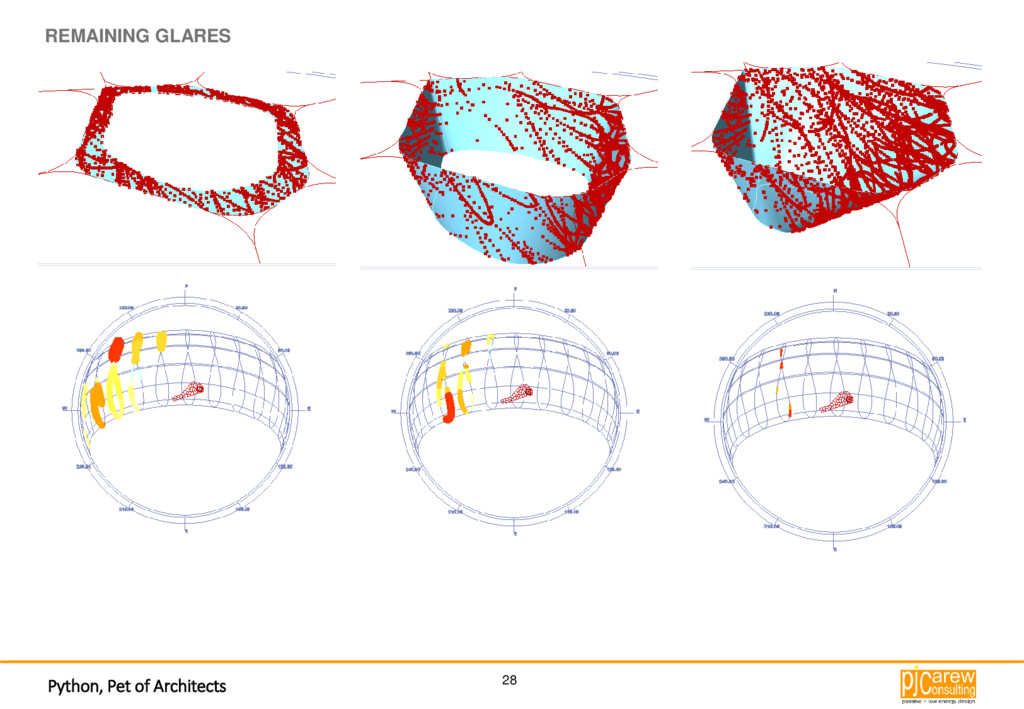
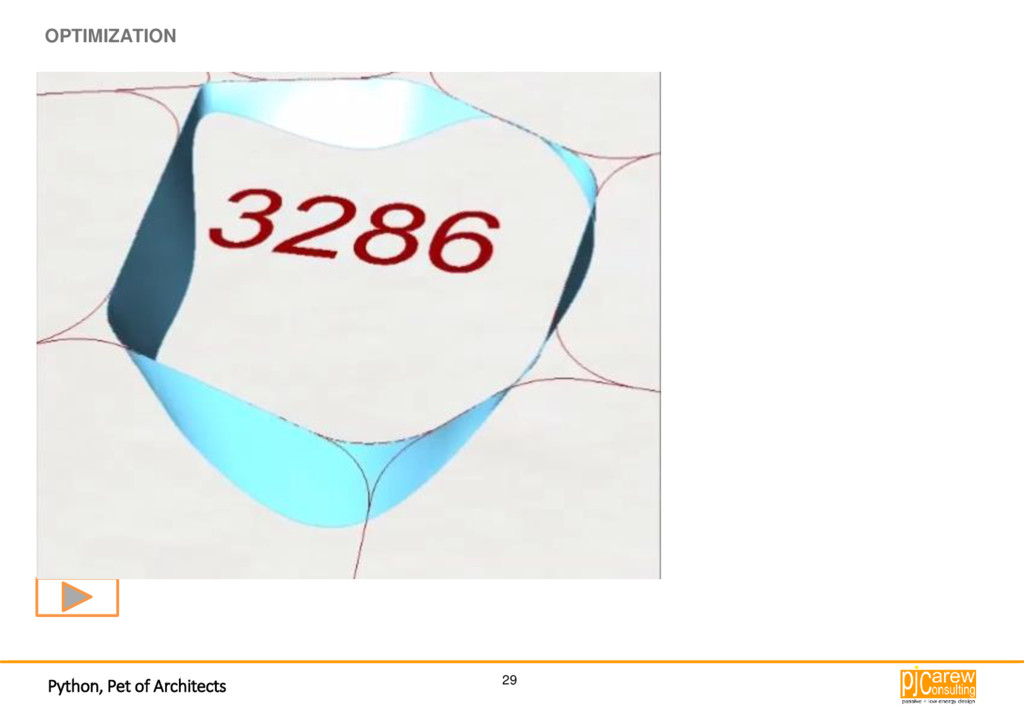
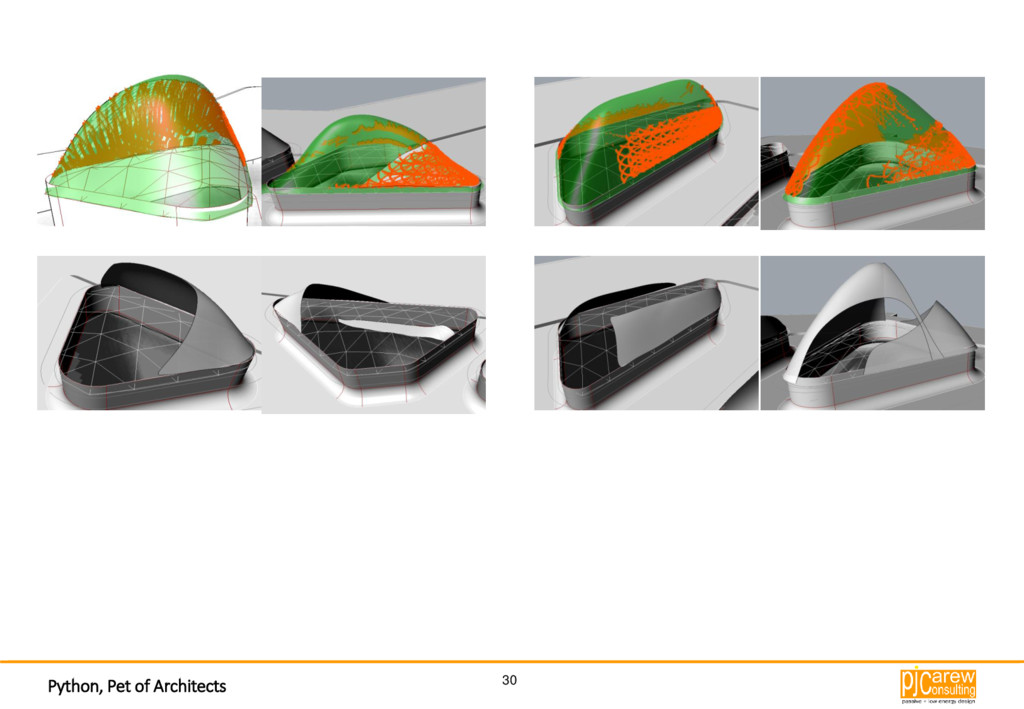
We will demonstrate 3 different experiences in the fields of; geometry, energy, and optimization, and what the approach of each is. Python aids the design of architectural elements through the relation of form to and data simulations. This would be of interest to those who want to see the future of algorithmic design for; architects, designers, and programmers. There is no experience needed, we just want to express the enjoyment these tools can add to three-dimensional design.

Pycon ZA

October 06, 2016
Tweet

More Decks by Pycon ZA

Other Decks in Programming

Transcript

  1. Python, Pet of Architects 16 import Rhino.Geometry as rg panels

    = [] for i in range(unum): for j in range(vnum): pt1 = surf.PointAt(i/unum, j/vnum) pt2 = surf.PointAt((i+0.9)/unum, (j+0.1)/vnum) pt3 = surf.PointAt((i+1.2)/unum, (j+1.0)/vnum) pt4 = surf.PointAt((i+0.3)/unum, (j+1)/vnum) pt5 = surf.PointAt((i+0.6)/unum, (j+0.3)/vnum) n1 = surf.NormalAt(i/unum, j/vnum) n2 = surf.NormalAt((i+0.9)/unum, (j+0.1)/vnum) n3 = surf.NormalAt((i+1.2)/unum, (j+1.0)/vnum) n4 = surf.NormalAt((i+0.3)/unum, (j+1)/vnum) n5 = surf.NormalAt((i+0.6)/unum, (j+0.3)/vnum) pt1 += n1*0.2 pt2 += n2*0.2 pt3 += n3*-0.1 pt4 += n4*1.3 pt5 += n5*1.5 panel = rg.NurbsSurface.CreateFromCorners(pt2, pt3, pt5) panels.append(panel) panel = rg.NurbsSurface.CreateFromCorners(pt3, pt4, pt5) panels.append(panel) panel = rg.NurbsSurface.CreateFromCorners(pt4, pt1, pt5) panels.append(panel)
  2. Python, Pet of Architects 34 Outdoor Analysis UTCI Ta Va

    Tmrt RH Isky Iurb Isol ap Esol Fsol→p εurb Eurb Furb→p Esky εsky Fsky→p SVF Tdw CC Tdb σ epw CFD NV NV NV Ts Tin K hc Finite Mesh CFD Solar Radiation RAPID ANALYSIS OF COMPLEX FACTORS The outdoor analysis is a result of massive comprehensive calculation and overlaying different environmental simulations. An advanced simulation method using a series of programs and algorithms has been developed to calculate human thermal stress based on Universal Thermal Climate Index (UTCI) standards. Accuracy and speed can be matched to the required level at the relevant design stage – rapid input in the beginning with increased accuracy as design ideas converge. Surface Temperature OUTDOOR COMFORT ANALYSIS
  3. Python, Pet of Architects 35 Furb→p = View factor between

    urban surfaces and a person (ratio, 0-1) = 1 . . → + . . → + . . → 1 4 MEAN RADIANT TEMPERATURE
  4. Python, Pet of Architects 36 = 1 . . →

    + . . → + . . → 1 4 MEAN RADIANT TEMPERATURE
  5. Python, Pet of Architects 37 = 1 . . →

    + . . → + . . → 1 4 MEAN RADIANT TEMPERATURE
  6. Python, Pet of Architects 38 = 1 . . →

    + . . → + . . → 1 4 MEAN RADIANT TEMPERATURE
  7. Python, Pet of Architects 39 = 1 . . →

    + . . → + . . → 1 4 MEAN RADIANT TEMPERATURE
  8. Python, Pet of Architects 40 = 1 . . →

    + . . → + . . → 1 4 MEAN RADIANT TEMPERATURE
  9. Python, Pet of Architects 41 = 1 . . →

    + . . → + . . → 1 4 MEAN RADIANT TEMPERATURE
  10. Python, Pet of Architects 42 = 1 . . →

    + . . → + . . → 1 4 MEAN RADIANT TEMPERATURE
  11. Python, Pet of Architects 43 = 1 . . →

    + . . → + . . → 1 4 MEAN RADIANT TEMPERATURE
  12. Python, Pet of Architects 44 = 1 . . →

    + . . → + . . → 1 4 ! A=d.d= 42 2 , r=1 -> A = 2 A’=d.d’ , d’=d.Sin() A’=d. d.Sin() = . Sin() = 2 . Sin() Aψs = ′ 2 = 2 . Sin() = 2. Sin() ψs = =0 2. Sin( i ) Instead of n/2  ψs = =0 4. Sin( i ) ψs = Sky View Factor n= NV vectors. Number of vectors which show sky = Vector altitude A= The area that the corresponding ray doesn’t hit any obstacle MEAN RADIANT TEMPERATURE
  13. Python, Pet of Architects 45 = 1 . . →

    + . . → + . . → 1 4 ψs = =0 4. Sin( i ) ψs = Sky View Factor n= NV vectors. Number of vectors which show sky = Vector altitude A= The area that the corresponding ray doesn’t hit any obstacle MEAN RADIANT TEMPERATURE
  14. Python, Pet of Architects 46 Ray Intersect with Geometry Hit

    Not Hit Which Surface Bounce +1 Reflected Ray Sky Radiation Surface Radiation + Bounce=0 Count for Sky Radiation Atmospheric radiation MEAN RADIANT TEMPERATURE
  15. Python, Pet of Architects 48 PARALLEL MULTI DIMENSIONAL DIAGRAM Shows

    Pt-19 in hot and too hot heat stress. Directly because of high Tmrt. But is it just because of Direct Radiation?!!
  16. Python, Pet of Architects 49 Shows even in low direct

    radiation in a high cloud cover and Humidity and low wind speed in a specific time in the morning 8-9-10am cause over heat stress PARALLEL MULTI DIMENSIONAL DIAGRAM