Upgrade to Pro — share decks privately, control downloads, hide ads and more …

"Dolosse: Distributed Physics Data Acquisition System" by Bertram Losper & Sehlabaka Qhobosheane

Pycon ZA
October 09, 2020

"Dolosse: Distributed Physics Data Acquisition System" by Bertram Losper & Sehlabaka Qhobosheane

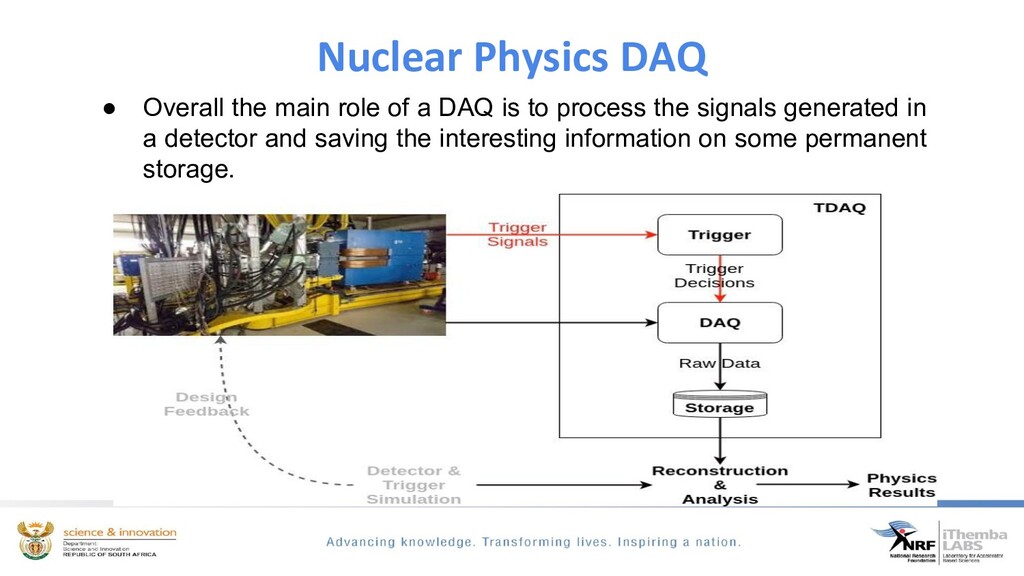
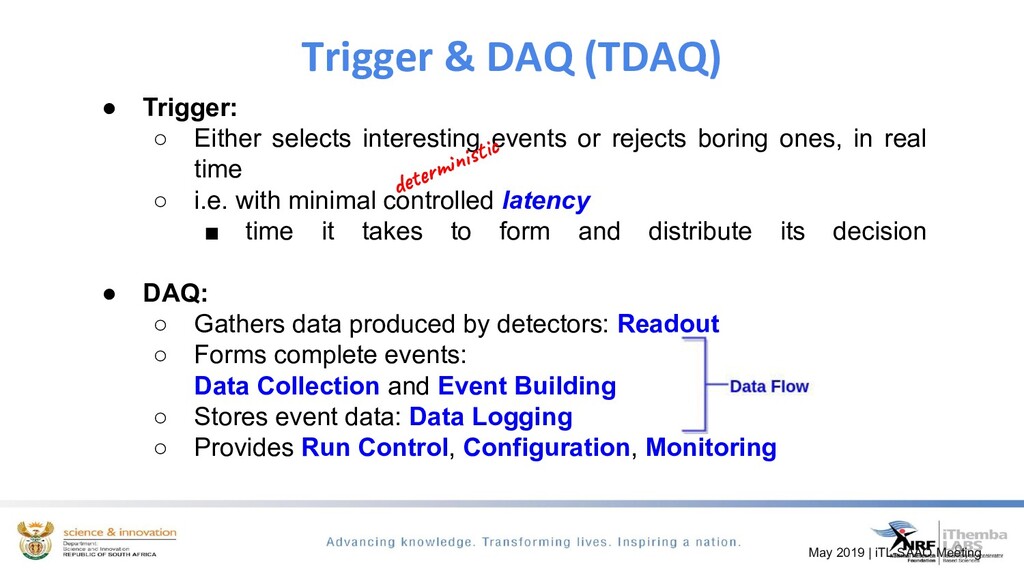
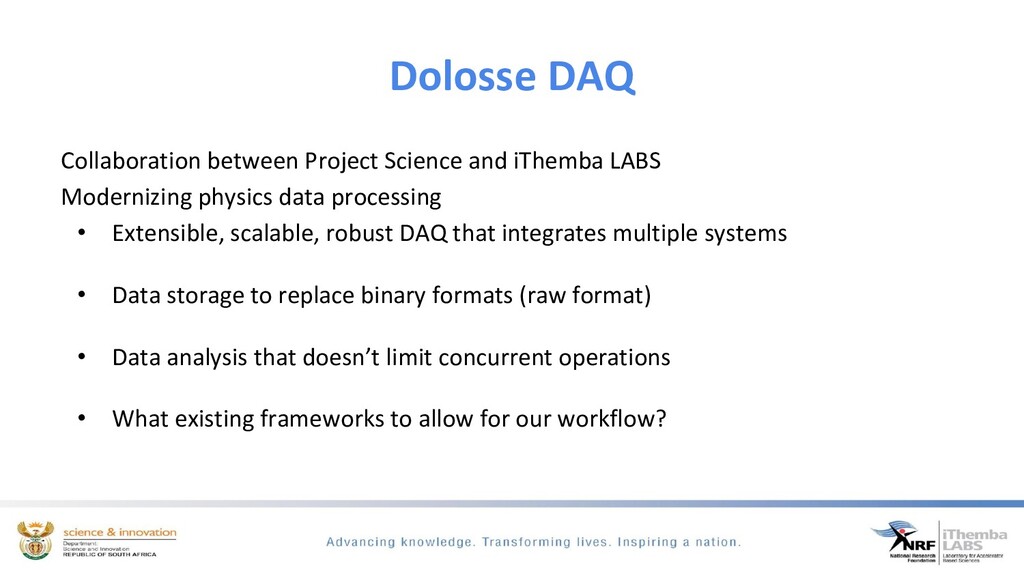
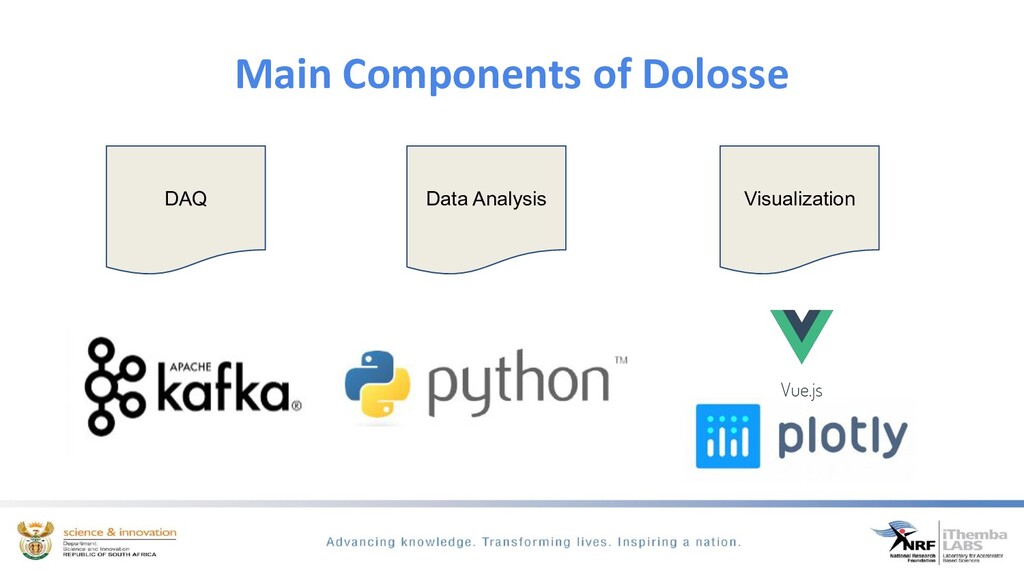
In this talk we will introduce key concepts and techniques of triggering and nuclear physics data acquisition. We will then discuss the development of a new distributed data acquisition software system developed for the subatomic and materials research experimental facilities at iThemba LABS, using python and open source streaming tools.

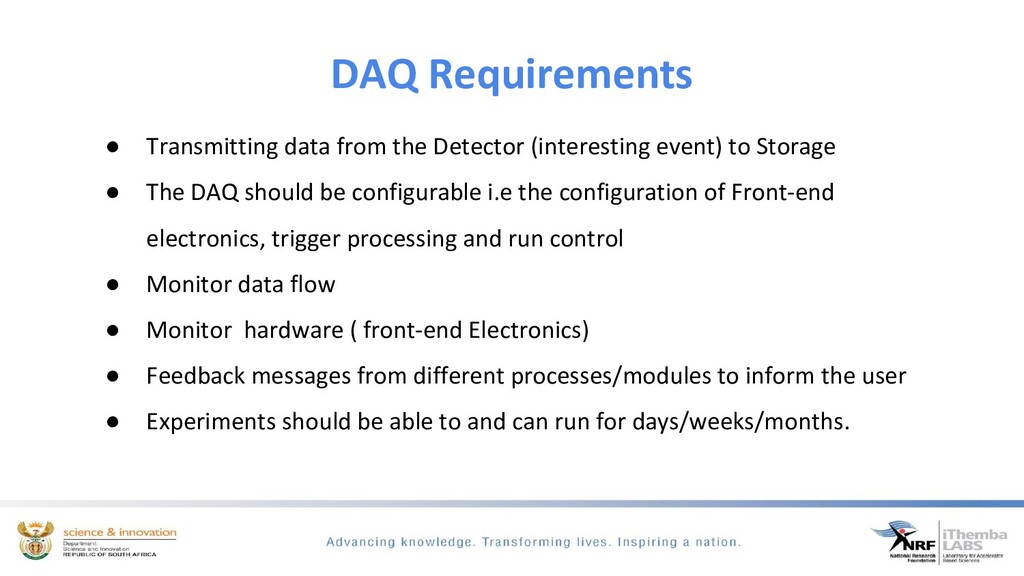
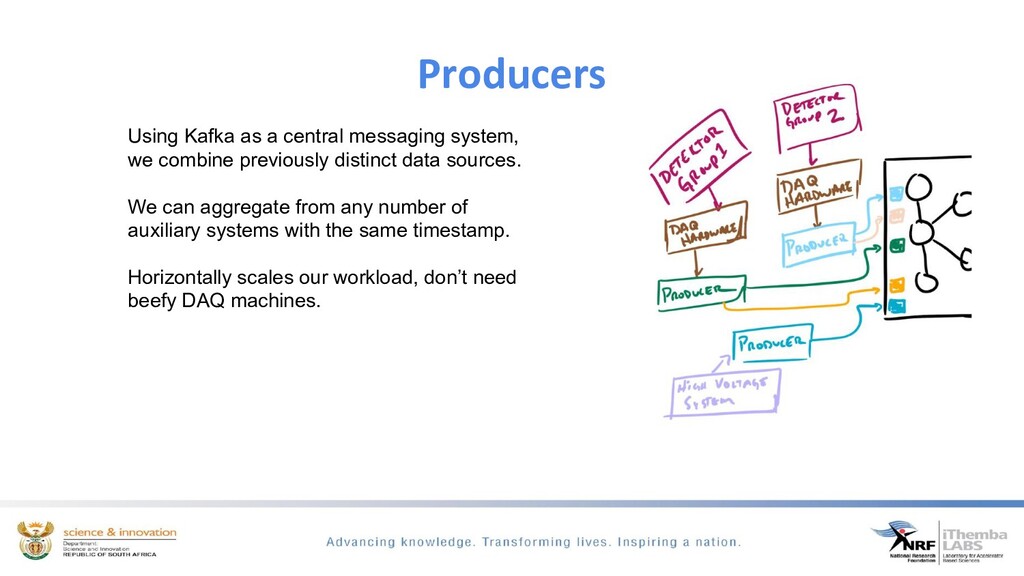
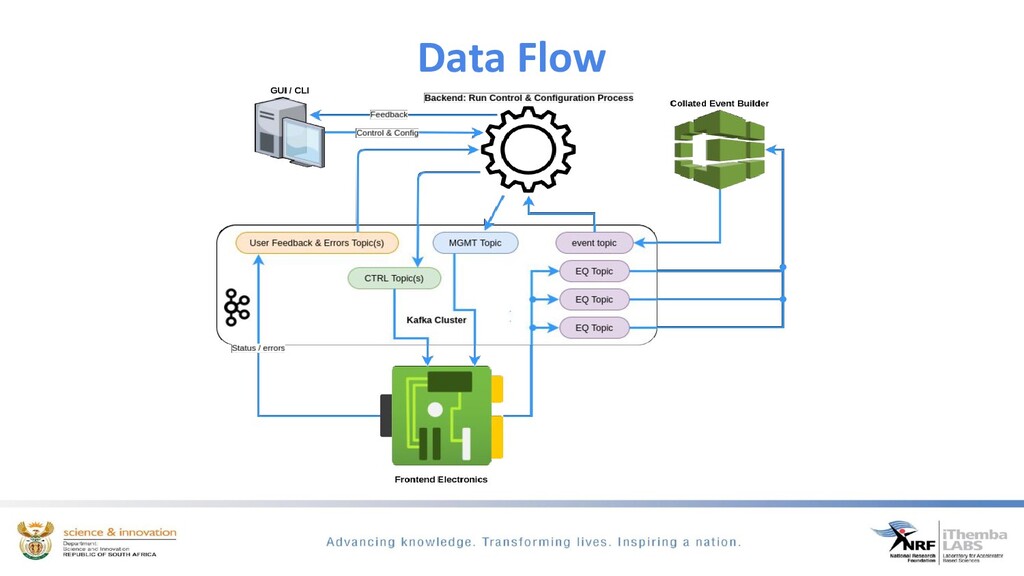
The discussion will show how we use Apache kafka to modernise our DAQ systems. Apache Kafka is a distributed messaging system which we use to build a DAQ system that has a multi-producer, multi-consumer model. This discussion will focus on how we use kafka to configure experimental runs, monitor and control the run and the data acquisition of real-time physics events.

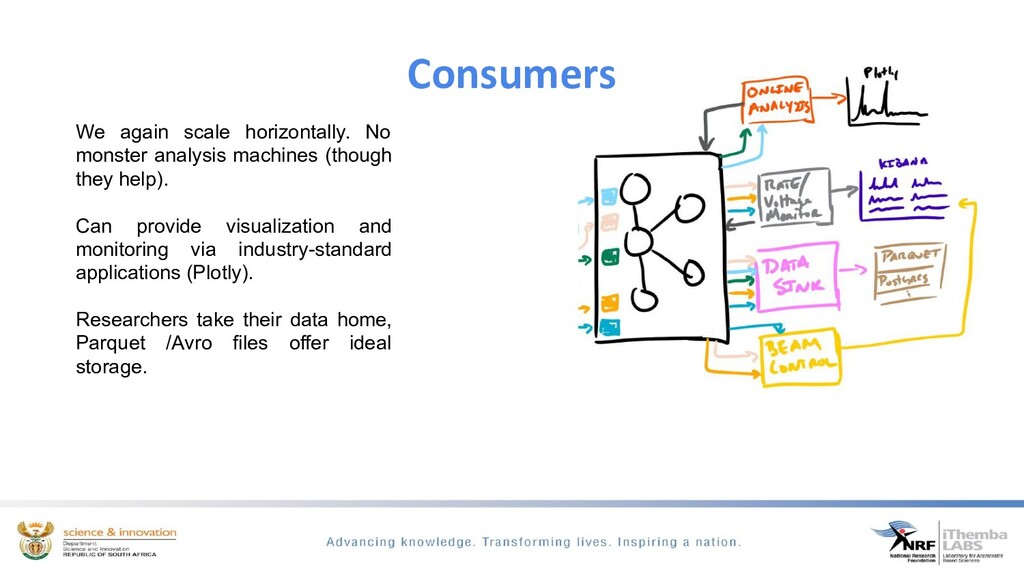
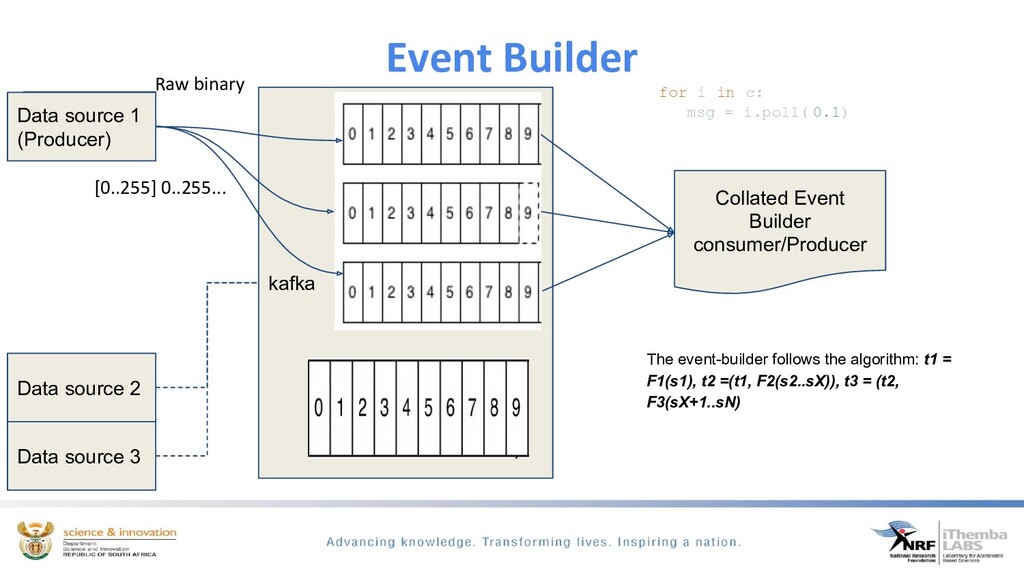
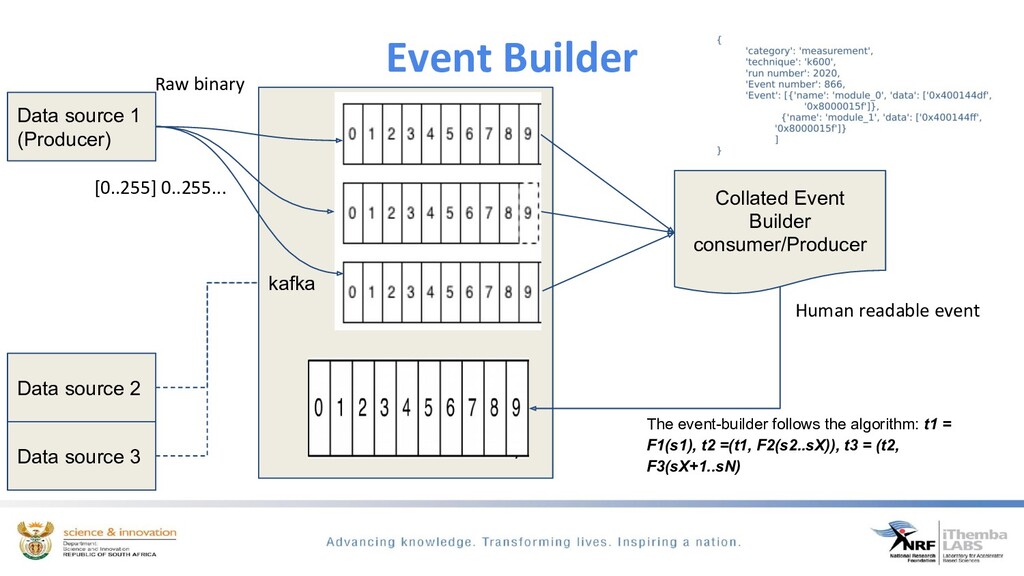
We ingest time-series scientific data from dedicated spectroscopy hardware modules, filtering to determine if we have event coincidence between these different modules, build an interesting physics event from this data and exposing it for easy analysis and visualisation through the python ecosystem. By using kafka the need for heavy processing servers/PC’s are eliminated.

iThemba Laboratory for Accelerator-Based Sciences (LABS) is a national infrastructure platform of the National Research Foundation (NRF) specialising in particle accelerator-based sciences and engineering, with offices in Cape Town and Johannesburg. It has a number of particle accelerators used for basic research in material sciences, subatomic physics as well as production of radio-pharmaceuticals for local and international markets

Pycon ZA

October 09, 2020
Tweet

More Decks by Pycon ZA

Other Decks in Programming

Transcript

  1. Dolosse: A Distributed Physics Data Acquisition System
    Bertram Losper & Sehlabaka Qhobosheane
    PyConZA2020

    View Slide

  2. Outline
    ● NRF/iThemba LABS
    ○ who we are
    ○ what we do
    ● Trigger & Data Acquisition (TDAQ) overview
    ○ Trigger management
    ○ Data readout
    ○ Event building and data storage
    ○ System control and monitoring
    ● Dolosse DAQ
    ○ Requirements
    ○ Design
    ○ Implementation

    View Slide

  3. NRF/iThemba LABS; Who we are
    CPT
    JHB

    View Slide

  4. NRF/iThemba LABS; What we do
    ● Multidisciplinary Research Facility of the NRF
    ○ Nuclear Physics
    ○ Materials Research
    ○ Production of Radiopharmaceuticals (local & international markets)
    ○ Training & Development of students
    ● > 4 Accelerators

    View Slide

  5. K8 Injector Cyclotron 1
    K8 Injector Cyclotron 2 K200 Separated Sector Cyclotron
    (SSC)
    3MV EN Tandetron K11 Cyclotron - FDG PET Isotopes
    6MV EN Tandem AMS

    View Slide

  6. K600 FEE
    K600 Beamline

    View Slide

  7. Outline
    ● NRF/iThemba LABS
    ○ who we are
    ○ what we do
    ● Trigger & Data Acquisition (TDAQ) overview
    ○ Trigger management
    ○ Data readout
    ○ Event building and data storage
    ○ System control and monitoring
    ● Dolosse DAQ
    ○ Requirements
    ○ Design
    ○ Implementation

    View Slide

  8. ● Overall the main role of a DAQ is to process the signals generated in
    a detector and saving the interesting information on some permanent
    storage.
    Nuclear Physics DAQ

    View Slide

  9. 9
    May 2019 | iTL-SAAO Meeting
    ● Trigger:
    ○ Either selects interesting events or rejects boring ones, in real
    time
    ○ i.e. with minimal controlled latency
    ■ time it takes to form and distribute its decision
    ● DAQ:
    ○ Gathers data produced by detectors: Readout
    ○ Forms complete events:
    Data Collection and Event Building
    ○ Stores event data: Data Logging
    ○ Provides Run Control, Configuration, Monitoring
    deterministic
    Trigger & DAQ (TDAQ)

    View Slide

  10. Trigger, DAQ & Controls
    Dracarys!
    Monitoring, Run Control & Configuration
    Detector Channels
    Trigger
    Front End Electronics
    Readout Network / Event Building
    Storage
    Processing/
    Filtering
    DAQ

    View Slide

  11. Trigger management
    ● Determining when data is available..
    ○ Interrupt
    ■ An interrupt is sent by a hardware device
    ■ The interrupt is
    ● Transformed into a software signal
    ● Caught by a data acquisition program
    ○ Undetermined latency is a potential problem!
    ○ Data readout starts
    ○ Polling
    ■ Some register in a module is continuously read out
    ■ Data readout happens when register “signals” new data

    View Slide

  12. Data readout
    Physical
    system/quantity
    Signal
    conditioning
    Analog/Digital
    Converter
    Computer
    transducer Field wiring
    ● Data digitization (analog-to-digital conversion) by Frontend Electronics
    e.g. VME modules (ADC,TDC, QDC etc)
    ● Trigger signal received by a trigger module
    ○ I/O register or interrupt generator
    ● Data read-out by a Single Board Computer (SBC)
    ○ Either events are buffered or de-randomized in the FEE
    ■ Performance is usually improved by DMA readout
    ● Readout topology: bus or network

    View Slide

  13. Event building and data storage
    ● Evt framing, buffering and data transmission:
    ○ Why buffering?
    ■ Triggers are uncorrelated
    ■ Create internal de-randomizers (to make system more
    deterministic)
    ○ Minimize deadtime thus improve efficiency
    ○ Optimize the usage of output channels
    ■ Disk
    ■ Network

    View Slide

  14. Event building and data storage
    ● Necessary to define an event format
    ○ Identify every chunk of data, w/ a source id
    ■ Both during data taking and offline
    ○ To correctly read back data from files
    ■ i.e. the application should be able to identify each full event
    structure and navigate among all its fragments
    ○ Must be easily extendable
    ■ e.g.: adding sub-detectors
    ○ Keep track of the event format version number
    ○ NB: event format is the core of your experiment
    ■ Used both online and offline

    View Slide

  15. System control and monitoring
    ● Two main aspects to system monitoring:
    ○ System operational monitoring
    ■ Sharing variables through the system
    ○ Data monitoring
    ■ Sampling data for monitoring processes
    ■ Sharing histogram through the system
    ■ Histogram browsing

    View Slide

  16. System control and monitoring
    ● System control
    ○ Each DAQ component must have
    ■ A set of well defined states
    ■ A set of rules to pass from one state to another
    => Finite State Machine
    ○ A central process controls the system
    ■ Run control
    ● Implements the state machine
    ● Triggers state changes and takes track of
    components’ states
    ○ A GUI interfaces the user to the Run control
    ■ …and various system services…

    View Slide

  17. Outline
    ● NRF/iThemba LABS
    ○ who we are
    ○ what we do
    ● Trigger & Data Acquisition (TDAQ) overview
    ○ Trigger management
    ○ Data readout
    ○ Event building and data storage
    ○ System control and monitoring
    ● Dolosse DAQ
    ○ Requirements
    ○ Design
    ○ Implementation

    View Slide

  18. DAQ Requirements
    ● Transmitting data from the Detector (interesting event) to Storage
    ● The DAQ should be configurable i.e the configuration of Front-end
    electronics, trigger processing and run control
    ● Monitor data flow
    ● Monitor hardware ( front-end Electronics)
    ● Feedback messages from different processes/modules to inform the user
    ● Experiments should be able to and can run for days/weeks/months.

    View Slide

  19. Dolosse DAQ
    Collaboration between Project Science and iThemba LABS
    Modernizing physics data processing
    • Extensible, scalable, robust DAQ that integrates multiple systems
    • Data storage to replace binary formats (raw format)
    • Data analysis that doesn’t limit concurrent operations
    • What existing frameworks to allow for our workflow?

    View Slide

  20. Main Components of Dolosse
    DAQ Visualization
    Data Analysis

    View Slide

  21. Apache Kafka
    Kafka is a messaging framework that allows us to
    manage communication between all of our different data
    sources. It allows for a multi-producer, multi-consumer
    model. We can collect and analyze in real-time.
    ● Fault-tolerant, replicated data streams
    ● Input : 1 M msg / sec | Output: 2 M msg / sec
    ● Huge amount of community support
    ● Could be used as data storage

    View Slide

  22. Producers
    Using Kafka as a central messaging system,
    we combine previously distinct data sources.
    We can aggregate from any number of
    auxiliary systems with the same timestamp.
    Horizontally scales our workload, don’t need
    beefy DAQ machines.

    View Slide

  23. Consumers
    We again scale horizontally. No
    monster analysis machines (though
    they help).
    Can provide visualization and
    monitoring via industry-standard
    applications (Plotly).
    Researchers take their data home,
    Parquet /Avro files offer ideal
    storage.

    View Slide

  24. Putting it all together

    View Slide

  25. Data Flow

    View Slide

  26. Event Builder
    Data source 1
    (Producer)
    Data source 2
    Data source 3
    kafka
    Raw binary
    [0..255] 0..255...

    View Slide

  27. Event Builder
    Data source 2
    Data source 3
    kafka
    Collated Event
    Builder
    consumer/Producer
    Raw binary
    [0..255] 0..255...
    The event-builder follows the algorithm: t1 =
    F1(s1), t2 =(t1, F2(s2..sX)), t3 = (t2,
    F3(sX+1..sN)
    for i in c:
    msg = i.poll( 0.1)
    Data source 1
    (Producer)
    Data source 1
    (Producer)

    View Slide

  28. Event Builder
    Data source 1
    (Producer)
    Data source
    2
    Data source
    3
    kafka
    Collated Event
    Builder
    consumer/Producer
    Raw binary
    [0..255] 0..255...
    data=list(unpack('I' * (len(raw_dat) // 4), raw_dat))
    event_data = [
    hex(x) for x in data]
    evt_data[evt_name].append(
    {'name':msg.topic(),'data': event_data})
    Data source 2
    Data source 3
    Data source 1
    (Producer)

    View Slide

  29. Event Builder
    Data source 1
    (Producer)
    Data source 2
    Data source 3
    kafka
    Collated Event
    Builder
    consumer/Producer
    Raw binary
    Human readable event
    [0..255] 0..255...
    The event-builder follows the algorithm: t1 =
    F1(s1), t2 =(t1, F2(s2..sX)), t3 = (t2,
    F3(sX+1..sN)

    View Slide

  30. Visualization
    Visualization
    Plotly | VueJs
    The framework we use for visualization is Plotly.js
    within Vue.js or ROOT. Most visualization
    frameworks are really going to be application
    dependent.
    Plotly:
    ● It is a powerful graphing library
    ● Plotly creates interactive plots for example:
    Histograms, Heatmap, etc.
    Plotly can be used in Jupyter

    View Slide

  31. Examples

    View Slide

  32. Potential Pitfalls
    Event builder would have event “misalignment”(readout misalignment), if the datasource started producing data before event
    builder was started (discovered during testing).
    {
    'category': 'measurement',
    'technique': 'k600',
    'run number': 0, 'Event number': 1456,
    'Event': [{'name': 'adc_0', 'data': ['0xfa002000', '0xf8004002', ','0xfc0003b1']}, {'name': 'adc_0', 'data': ['0xfa002000', '0xf8004002', '0xfc0003b1']}, {{'name': 'adc_0', 'data':
    ['0xfa002000', '0xf8004002', '0xfc0003b1']}]
    }
    This was due to the nature of how partitions are fetched in kafka. The issue was resolved by creating a consumer object for each
    topic (Event Fragment) to be read out and reading out each fragment sequentially.
    {
    'category': 'measurement',
    'technique': 'k600',
    'run number': 0, 'Event number': 1456, 'Event': [{'name': 'adc_0', 'data': ['0xfa002000', '0xf8004002', '0xf8104073', '0xf8014076', '0xf811404b', '0xf8024045', '0xf812405f',
    '0xf803404f','0xfc0003b1']}, {'name': 'tdc_0', 'data': ['0x4000763f', ' '0x4000763f'}, {'name': 'qdc_0', 'data': ['0xfa001000', '0xf800425f', '0xf810406f', '0xf80242b5',
    '0xf8124084', '0xf8044275', '0xf814406f', '0xf8064259', '0xf8164077', '0xf8084063', '0xf818406e', '0xf80a4067', '0xf81a408a', '0xf80c407a', '0xf81c4083', '0xf80e406e',
    '0xf81e408f', '0xfc0003b2']}]
    }

    View Slide

  33. Development Environment(s)
    ● Internal Fork
    ○ GitLab
    ■ CI/CD
    ● Public Repo
    ○ GitHub
    ■ Travis
    ○ ZenHub

    View Slide

  34. Concluding Remarks
    ● Next milestone is to release the k600 Subsystem module - 2 weeks
    ● Release other subsystem (9 total) modules - every 1-2 months
    ● Biggest Challenges/Risks:
    ○ Limited developer time due to juggling between other projects &
    supporting experiments
    ● Links:
    ○ https://tlabs.ac.za
    ○ https://gitlab.tlabs.ac.za/init/dolosse
    ○ https://github.com/dolosse/dolosse

    View Slide

  35. Baie Dankie.
    Rea leboha.
    Enkosi.
    Thank you.
    [email protected] [email protected]

    View Slide