Upgrade to Pro — share decks privately, control downloads, hide ads and more …

Oracle-DB: Firefighting or fixing root causes?

Sponsored · Ship Features Fearlessly Turn features on and off without deploys. Used by thousands of Ruby developers.

Oracle-DB: Firefighting or fixing root causes?

Database performance: Often we only react to acute problems instead of acting preventively. And even then, only the processes that happen to stand out get addressed.
How about instead taking a preventive approach — analyzing latent bottlenecks and untapped potential of the database system-wide to improve application performance?
Once their relevance has been identified and assessed, easily implementable quick wins could be fixed promptly, without problems having to escalate first.
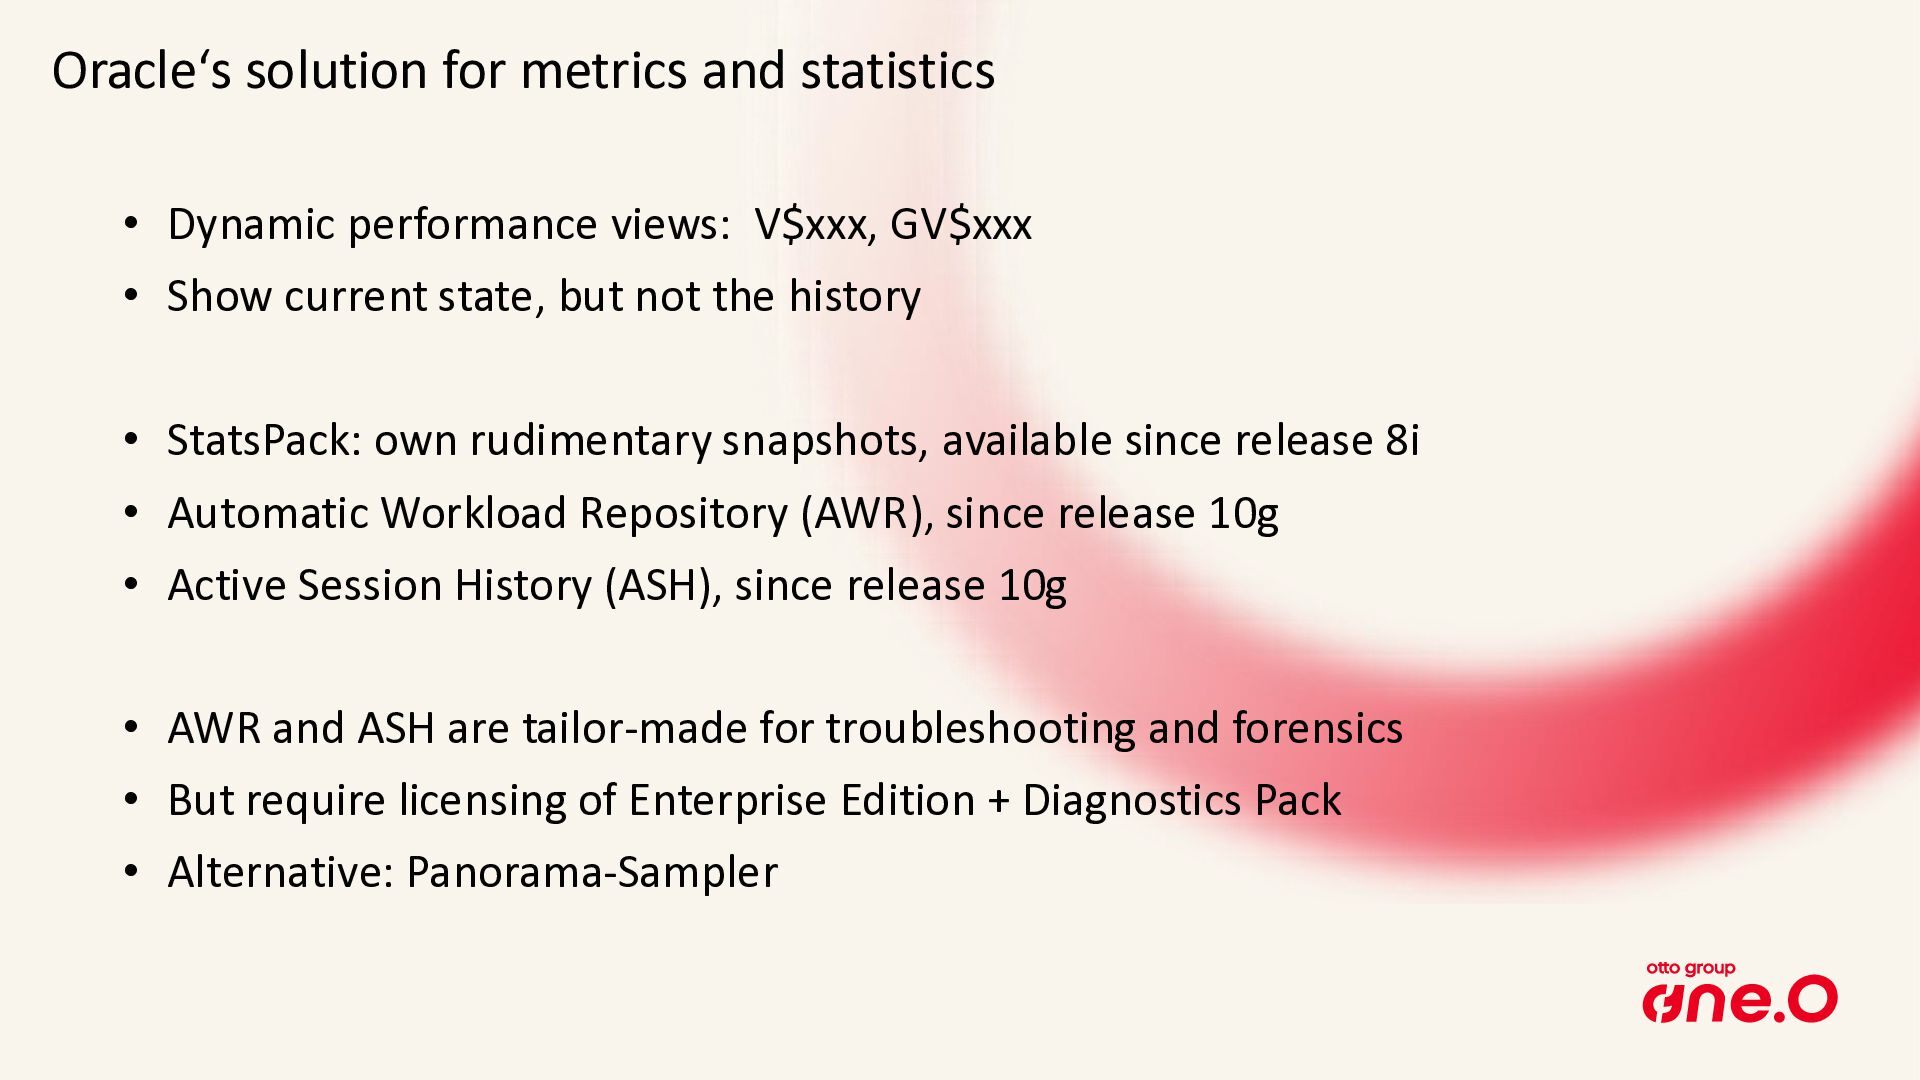
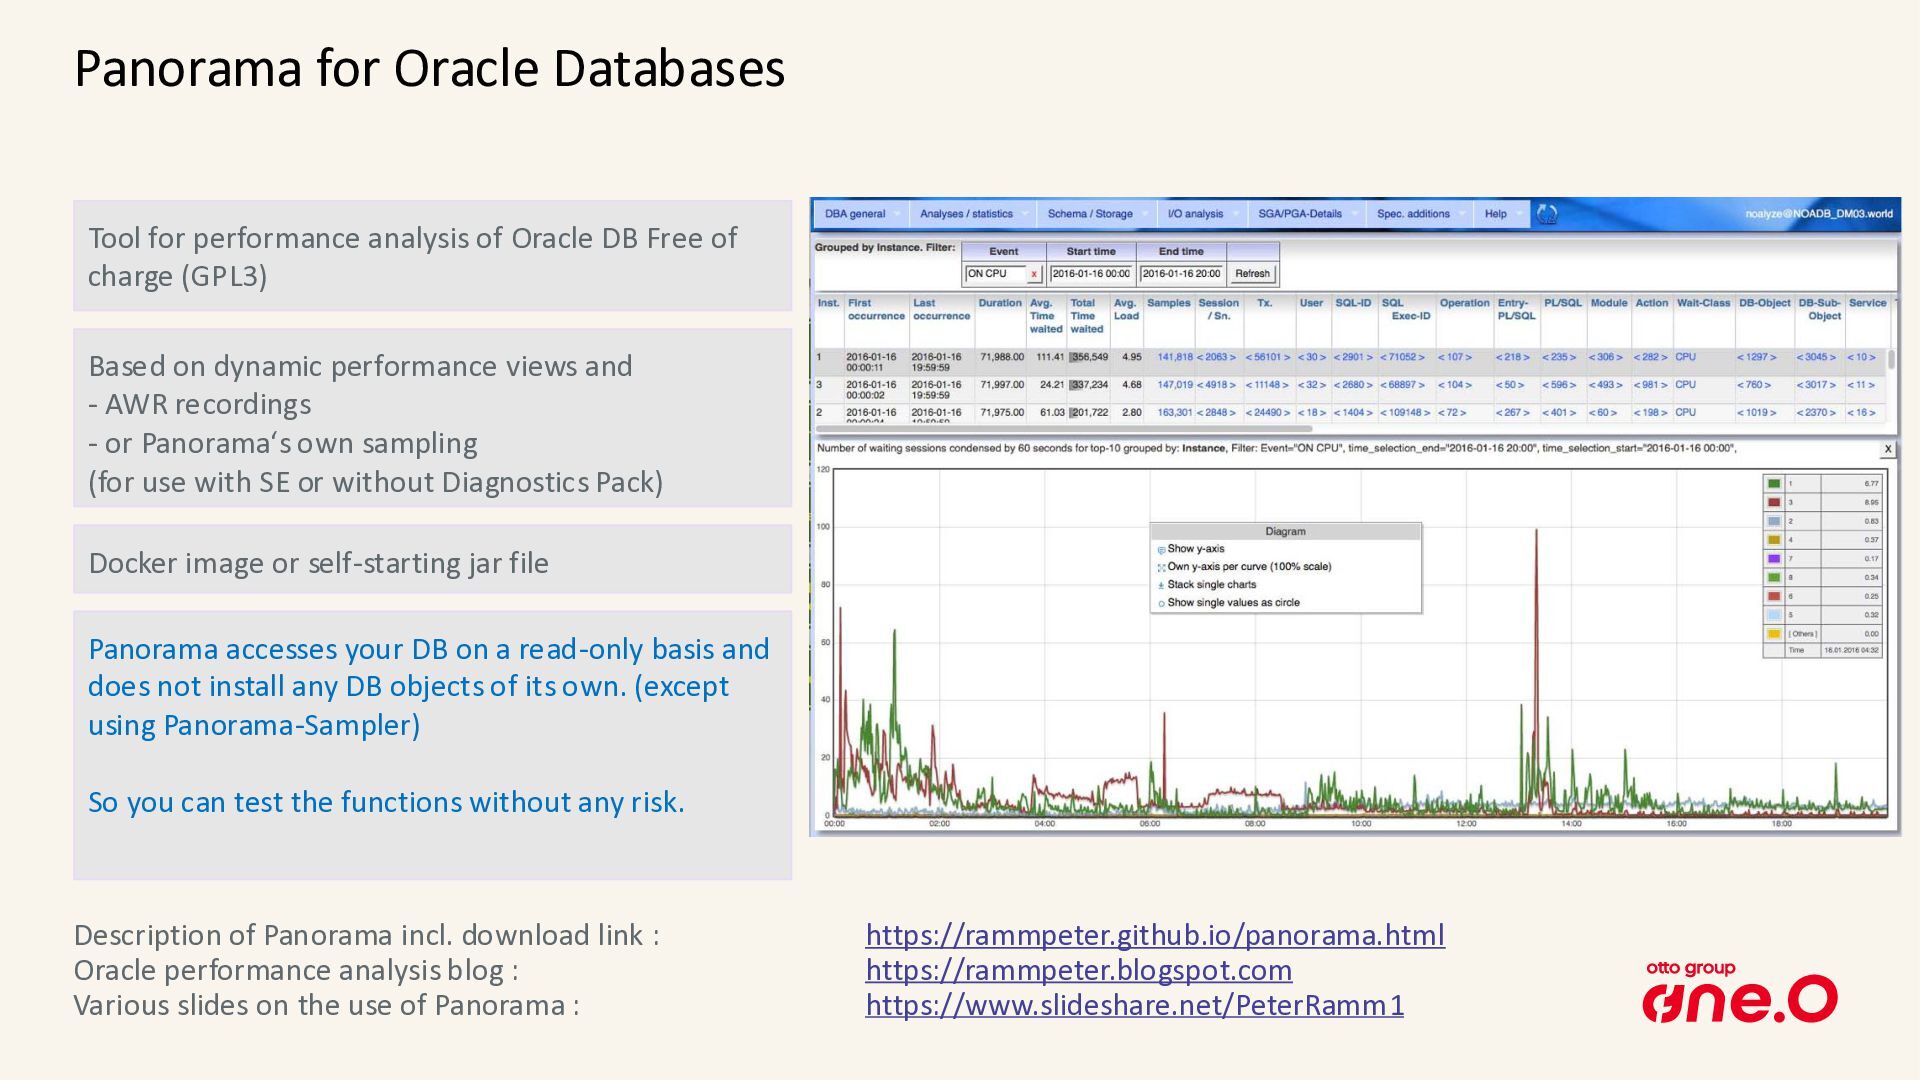
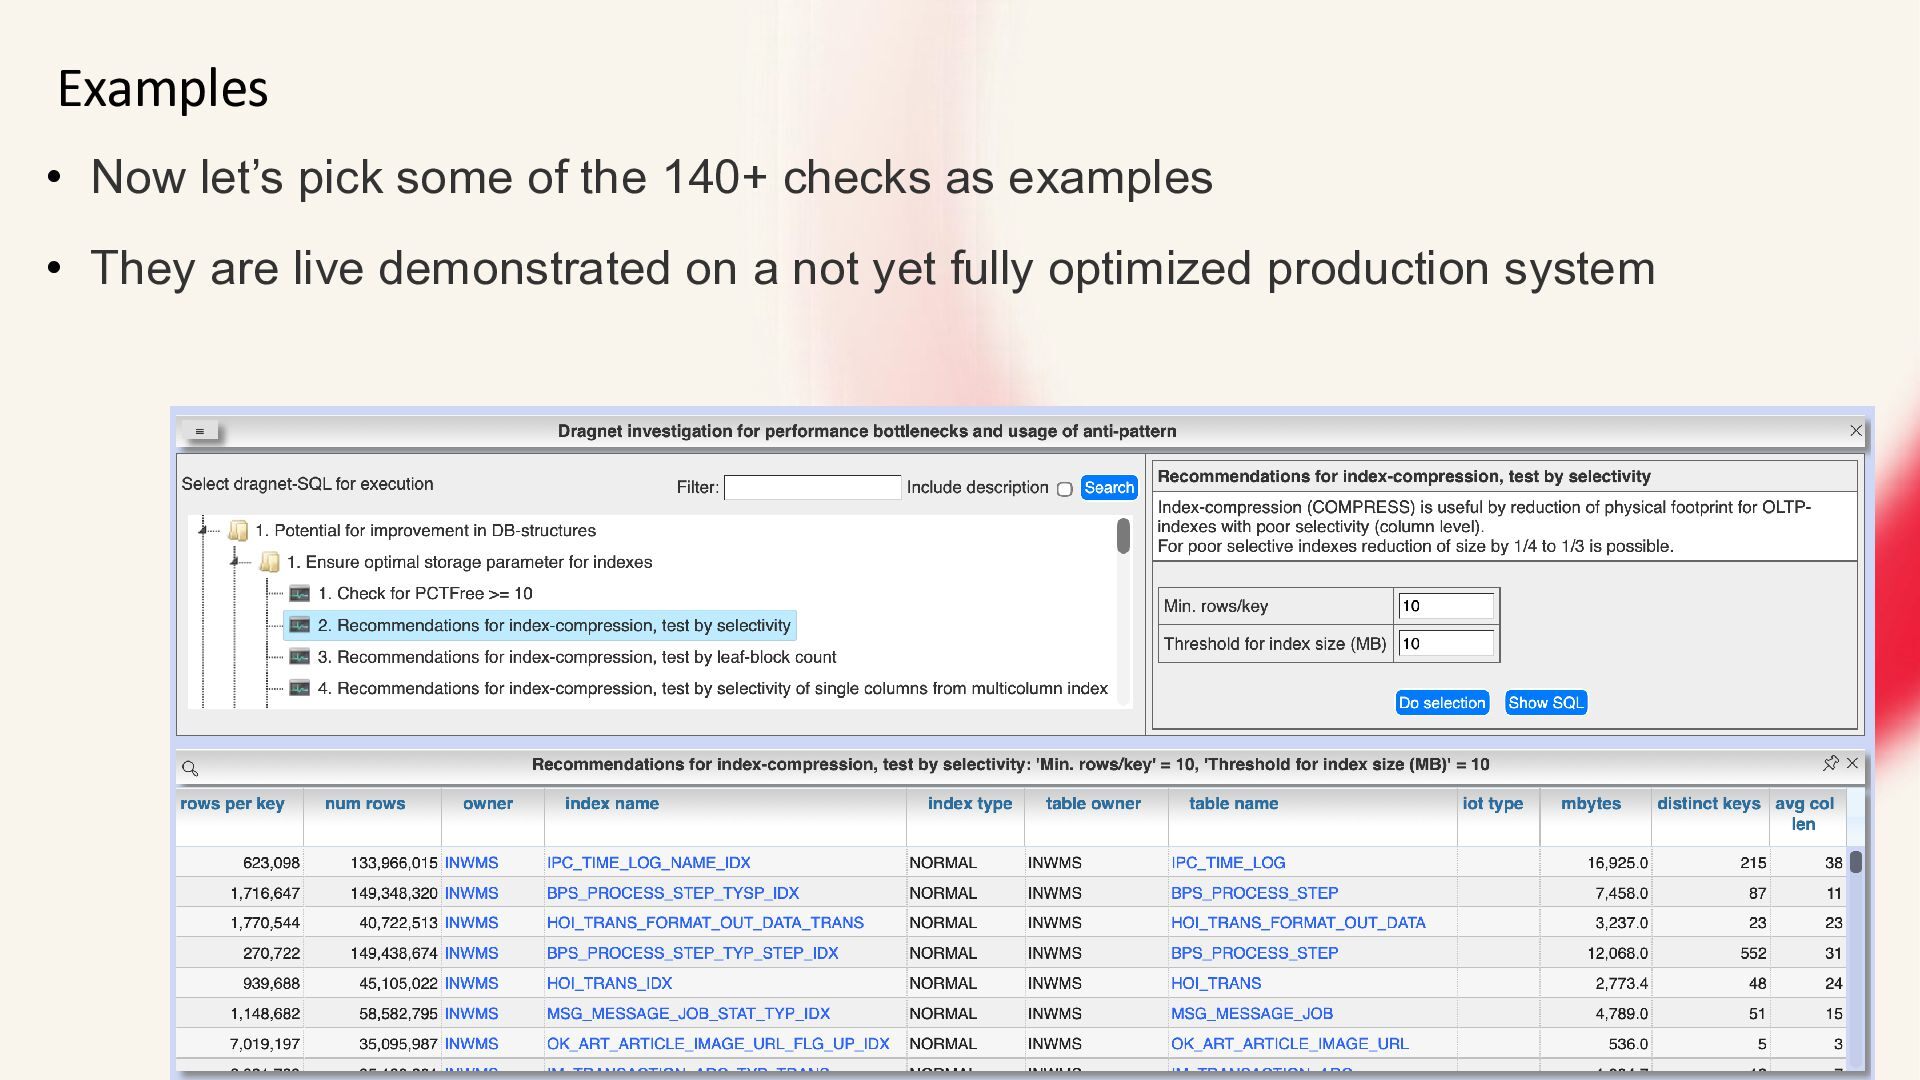
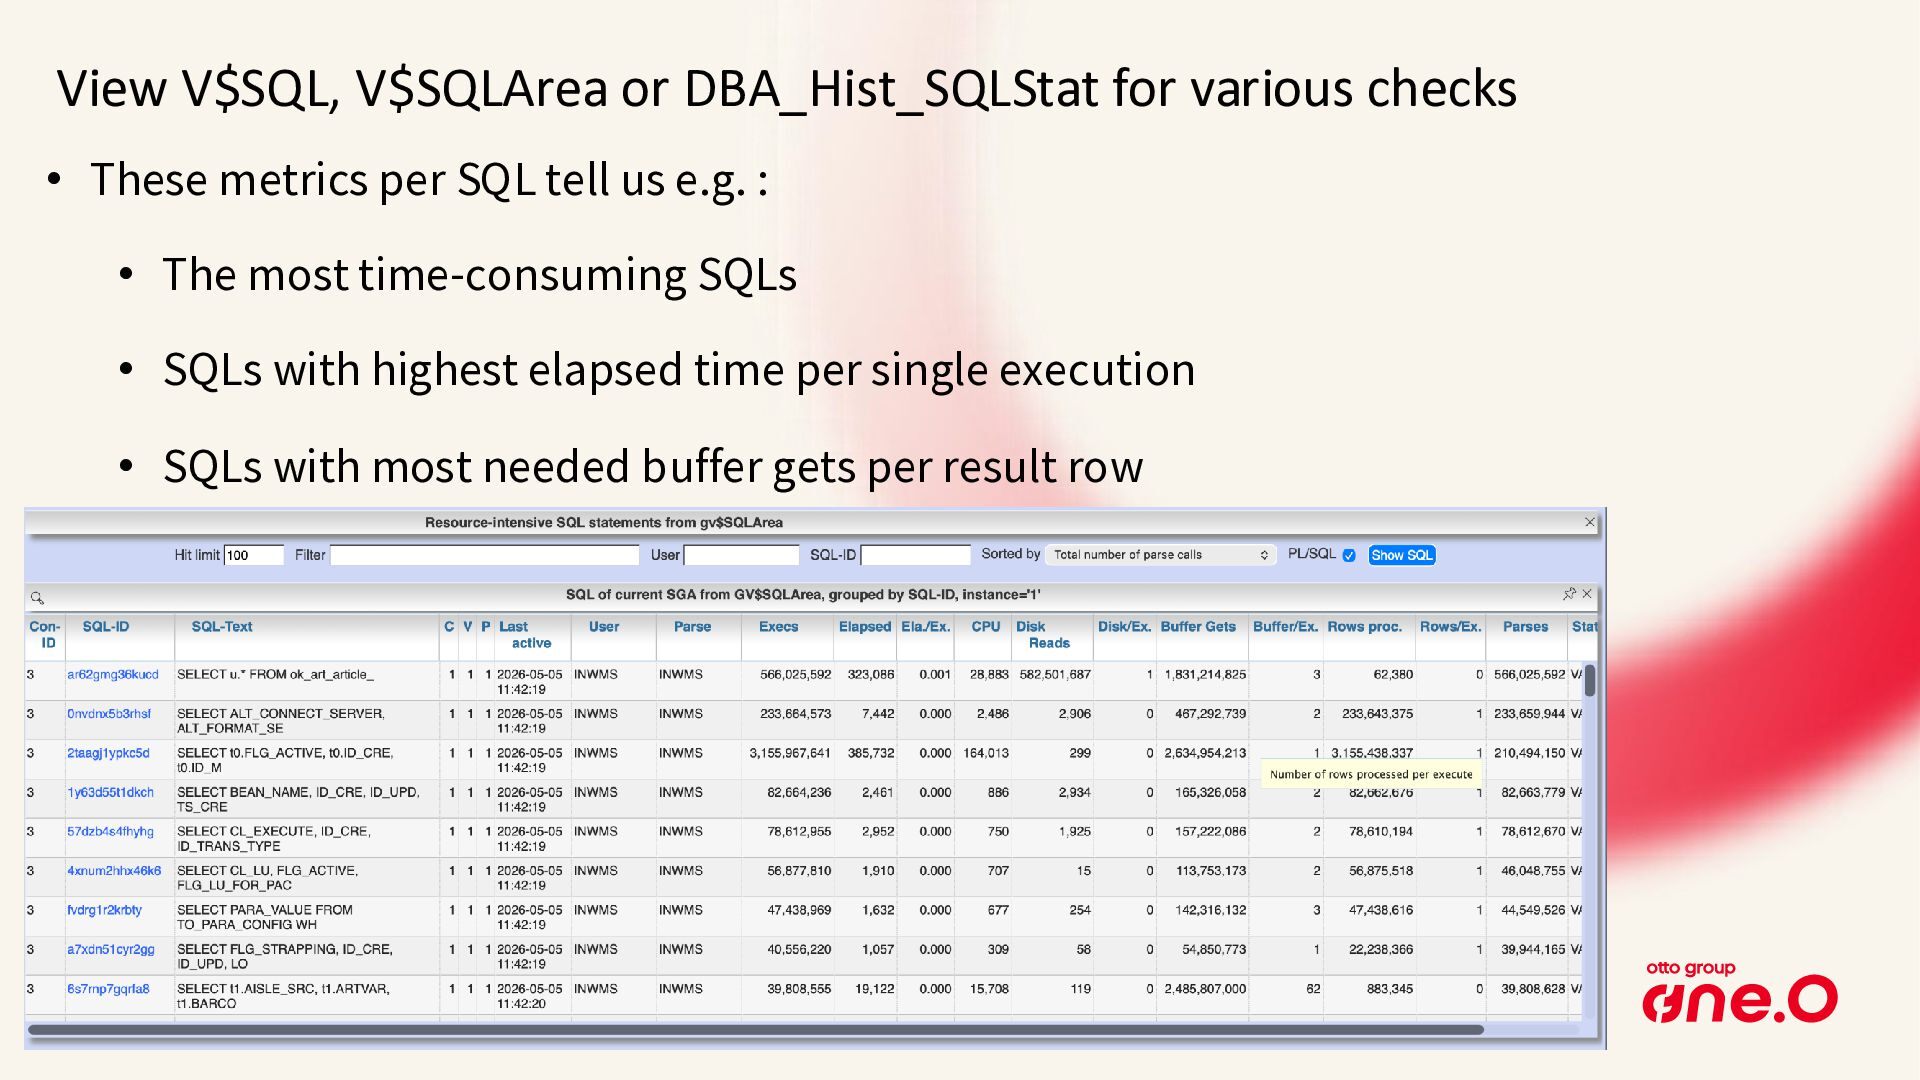
The free analysis tool "Panorama" contains well over 100 dragnet-investigation checks for specific — and sometimes hidden — problems in the database that can often be solved surprisingly easily. These span database configuration, data structures, and SQL statements, all the way to conclusions regarding application design.
Using the "Panorama" tool, this presentation demonstrates the proactive finding, assessment, and creation of solution proposals for some of these issues, with a focus on a real production system.

Avatar for Peter Ramm

Peter Ramm

May 28, 2026

More Decks by Peter Ramm

Other Decks in Technology

Transcript

  1. Otto Group one.O 2 About Otto Group one.O Fusion to

    one.O 2025 Parent company Otto Group Locations Dresden, Hamburg, Altenkunstadt, Madrid, Málaga, Valencia, Taipei, Hyderabad Number of employees around 1,000 Management Board Katrin Behrens, Dr. Stefan Borsutzky
  2. Peter Ramm Software architect / Team lead at One.O in

    Dresden More than 35 years of experience in IT-projects Main focus: • Development of OLTP systems based on Oracle databases • From architecture consulting up to trouble shooting • Performance analysis and optimization of working systems Oracle Ace Associate since 2024 About me Mail: [email protected]
  3. Factors influencing performance in DB use Compute-Node: • CPU/Core number,

    CPU performance • capacity, latency and bandwidth of memory DB instance: • Configuration • Redo, Undo, Temp I/O-System: • Throughput (MB/sec.) • Latency (ms/request) • Storage capacity Network: • Bandwidth • Latency DB segments: • Tables • Indexes • Clusters • Partitions DB sessions: • Link between appl. and DB • Transactional behavior • Optimizer settings SQL statements: • Executed operations • Execution plans Application: • Process design • Data model • DB access • Transactions
  4. • Dynamic performance views: V$xxx, GV$xxx • Show current state,

    but not the history • StatsPack: own rudimentary snapshots, available since release 8i • Automatic Workload Repository (AWR), since release 10g • Active Session History (ASH), since release 10g • AWR and ASH are tailor-made for troubleshooting and forensics • But require licensing of Enterprise Edition + Diagnostics Pack • Alternative: Panorama-Sampler Oracle‘s solution for metrics and statistics
  5. Panorama for Oracle Databases Tool for performance analysis of Oracle

    DB Free of charge (GPL3) Based on dynamic performance views and - AWR recordings - or Panorama‘s own sampling (for use with SE or without Diagnostics Pack) Description of Panorama incl. download link : https://rammpeter.github.io/panorama.html Oracle performance analysis blog : https://rammpeter.blogspot.com Various slides on the use of Panorama : https://www.slideshare.net/PeterRamm1 Docker image or self-starting jar file Panorama accesses your DB on a read-only basis and does not install any DB objects of its own. (except using Panorama-Sampler) So you can test the functions without any risk.
  6. Reactive (Firefighting) • Such tools like Panorama also support in

    incident-related investigation • e.g. after breaking SLA thresholds or receiving business complaints • Reaction occurs mostly only after performance problems become visible • Only the currently visible ocurrences of a problem pattern are fixed Approaches for performance improvement Proactive (Fixing before escalation) • A lot of performance-related scenarios can be detected by evaluating the traces in the database • A list of occurrences for a certain scenario ordered by severity gives us a chance to: • Rate the relevance of a suboptimal behavior in terms of performance • Check which lightweight solution could possibly exist to fix the issue • Estimate the potential benefit of a fix • Considering the same type of problem row by row often allows to apply the same solution approach multiple times
  7. Examples • Now let’s pick some of the 140+ checks

    as examples • They are live demonstrated on a not yet fully optimized production system
  8. View V$SQL, V$SQLArea or DBA_Hist_SQLStat for various checks • These

    metrics per SQL tell us e.g. : • The most time-consuming SQLs • SQLs with highest elapsed time per single execution • SQLs with most needed buffer gets per result row
  9. Dragnet investigation for performance antipattern • Besides the main analysis

    features (SQL, object statistics, ASH etc.), Panorama also has a dedicated block that checks for individual antipatterns in DB use. • 140+ predefined checks for occurrences of a certain problem scenario
  10. Dragnet investigation: Standalone SQLs without Panorama • The SQLs used

    for dragnet investigation are also available outside Panorama https://rammpeter.github.io/oracle_performance_tuning.html
  11. 1.1.2 .. 1.1.4 Recommendations for index compression • The index

    key compression is available in all editions for decades now • Nevertheless, it is often not used, but may save up to 30% or more of storage • If not using the Advanced Compression Option, you need to specify the prefix length
  12. 1.2.3 Detection of indexes with multiple indexed columns • Looks

    for indexes where one index indexes a subset of the columns of the other index, both starting with the same columns. • The purpose of the index with the smaller column set can regularly be covered by the second index with the larger column set (including protection of foreign key constraints). So the first index often can be dropped without loss of function. • The effect of less indexes to maintain and less objects in database cache with better cache hit rate for the remaining objects in cache is mostly higher rated than the possible overhead of using range scan on index with larger column set. • A PK/ unique constraint on the smaller column set can be covered by the second index with the larger column set
  13. 1.2.4 Detection of indexes by MONITORING USAGE • There are

    four reasons why an existing index should survive: • 1. It is used by SQL statements: then the index is not included in the list. • 2. Use for securing uniqueness by Unique Index, Unique or Primary Key Constraints • 3. Use for protection of a foreign key constraint • 4. Possible use for partition exchange if index structures are identical • ALTER INDEX MONITORING USAGE; allows to exactly state used or not used • The whole story about identifying unused indexes for DROP: https://rammpeter.blogspot.com/2019/12/oracle-db-identification-of-non.html
  14. 1.7.1 Coverage of foreign-key relations by indexes (detection of potentially

    missing indexes) • Protection of columns with foreign key references by index can be necessary for: • Ensure delete performance of referenced table (suppress FullTable-Scan) • Suppress lock propagation (shared lock on index instead of table)
  15. 1.2.6 Coverage of foreign-key relations by indexes (detection of potentially

    unnecessary indexes) • Protection of existing foreign key constraint by index on referencing column may be unnecessary if: • there are no physical deletes on referenced table • full table scan on referencing table is acceptable during delete on referenced table • possible shared lock issues on referencing table due to not existing index are no problem • Especially for references from large tables to small master data tables often there's no use for the effort of indexing the referencing column. • Due to the poor selectivity such indexes are mostly not useful for access optimization.
  16. 1.2.10 Tables with PCT_FREE > 0 but without update-DML •

    For tables without updates you may consider setting PCTFREE=0 and freeing this space by reorganizing this table. • Free space in DB-blocks declared by PCT_FREE may be used for: • Reduce the risk of chained rows due to expansion of rowsize by update statements • Reduce the risk of ITL-waits by allowing the expansion of the ITL-list above INI_TRANS entries • This selection shows candidates without any update statements since last analyze. • If you don‘t need concurrent transactions in ITL-list above INI_TRANS then the recommendation is to set PCT_FREE=0
  17. 1.15 Possibly expensive TABLE ACCESS BY INDEX ROWID with additional

    filter predicates on table • If in a SQL a table has additional filter conditions that are not covered by the used index you may consider extending the index by these filter conditions. • This would ensure that you do the more expensive TABLE ACCESS BY ROWID only if that table row matches all your access conditions checked by the index.
  18. 2.1.3 Full table scans with small cardinality: missing indexes? •

    Access by full table scan is often suboptimal if only a small part of a table is selected. • They are out of place for OLTP-like access (small access time, many executions). • Placing an index may reduce runtime significantly. • Sorted by high runtime of full scan and small expected number of records.
  19. 2.4.2 Frequent access on small objects • For frequently executed

    SELECT-statements on small objects it may be worth caching this content in the application instead of repeated access by SQL. • This reduces CPU-contention and the risk of “Cache Buffers Chains” latch-waits. • A remote application will benefit from suppressed network roundtrips too. • Stored functions with function result caching or selects/subselects with result caching may also be used for this purpose
  20. 2.4.3 Unnecessary high fetch count • For larger results per

    execution, it is worth accessing multiple records per fetch with bulk operation instead of single fetches. • This results in only a slight reduction in CPU usage and SQL runtime. • For remote clients it reduces the number of network roundtrips which may last longer than the fetch operation at DB itself. • Specify the fetch size e.g. for: • SQL*Plus: > SET ARRAYSIZE xy • Java per statement: > Statement.setFetchSize(xy); • Java global: Properties props = new Properties(); props.setProperty("user", "scott"); props.setProperty("password", "tiger"); props.setProperty("defaultRowPrefetch", "100"); // Oracle-specific Connection conn = DriverManager.getConnection("jdbc:oracle:thin:…", props);
  21. 4.1.1 .. 4.1.5 Missing use of bind variables • Using

    bind variables for volatile filter criteria in SQL seems to be standard, but it isn’t • So, identifying the missing use of binds and pushing developers to fix this helps to: • Avoid SQL injection threat • Reduce hard parses needed for each execution with new values • Reduce memory requirements and pressure in SGA • cursor_sharing=EXACT can reduce the problem, but with other side effects • Detection of problematic missing use of bind variables can be done by evaluating: • the force_matching_signature which is equal for similar SQLs after literal replacement • the plan_hash_value to consider SQLs with same execution plan • similar substrings of SQL syntax (e.g. for PL/SQL without execution plan)
  22. 4.2.2 JDBC client statement cache probably not used • High

    soft parse rate on JDBC Thin connections suggests JDBC client-side statement caching is disabled or undersized. • Enabling it keeps frequently used cursors permanently open on the connection. • The JDBC statement cache is disabled per default in Oracle's JDBC driver. There are two ways to activate JDBC client-side statement caching and set cache size: 1. Enable on JDBC connection: ((OracleConnection)conn).setImplicitCachingEnabled(true)); ((OracleConnection)conn).setStatementCacheSize(100)); 2. Enable via JDBC URL (starting with DB release 19c): jdbc:oracle:thin:@host:1521/srv?oracle.jdbc.implicitStatementCacheSize=100
  23. Thank you for your interest Peter Ramm Team Lead Architecture

    Consulting Contact me via Teams Mail: [email protected] BlueSky: https://bsky.app/profile/rammpeter.bsky.social LinkedIn: https://www.linkedin.com/in/peter-ramm-ab842362/
  24. Panorama for Oracle: presentation formats Visualization in graphs via context

    menu (right mouse button) Time-related values can generally also be displayed as graphs by showing/hiding columns of the tables Results usually as tables Workflow in browser page continuously downwards Config setting PANORAMA_LOG_LEVEL=debug shows executed SQLs on console