Upgrade to Pro — share decks privately, control downloads, hide ads and more …

Oracle Database Performance Analysis with Panorama

Peter Ramm
January 04, 2024

Oracle Database Performance Analysis with Panorama

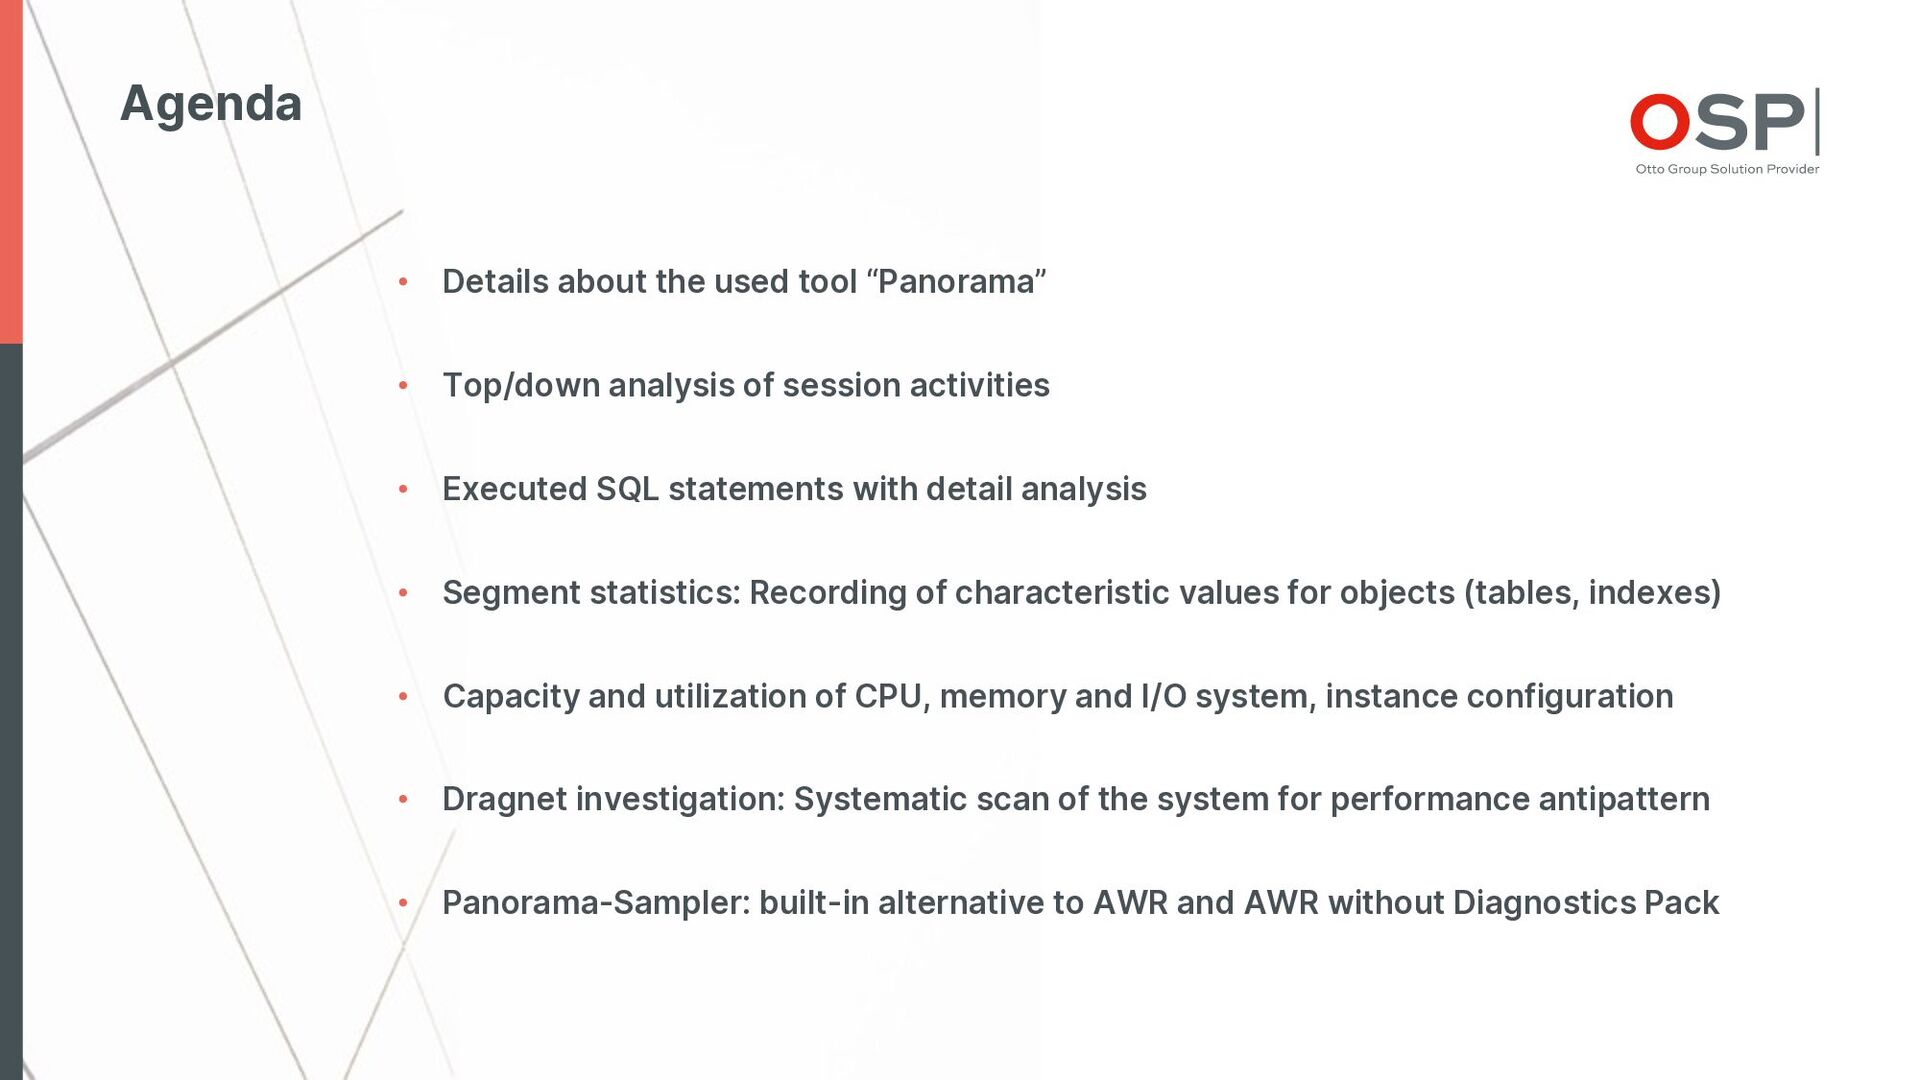
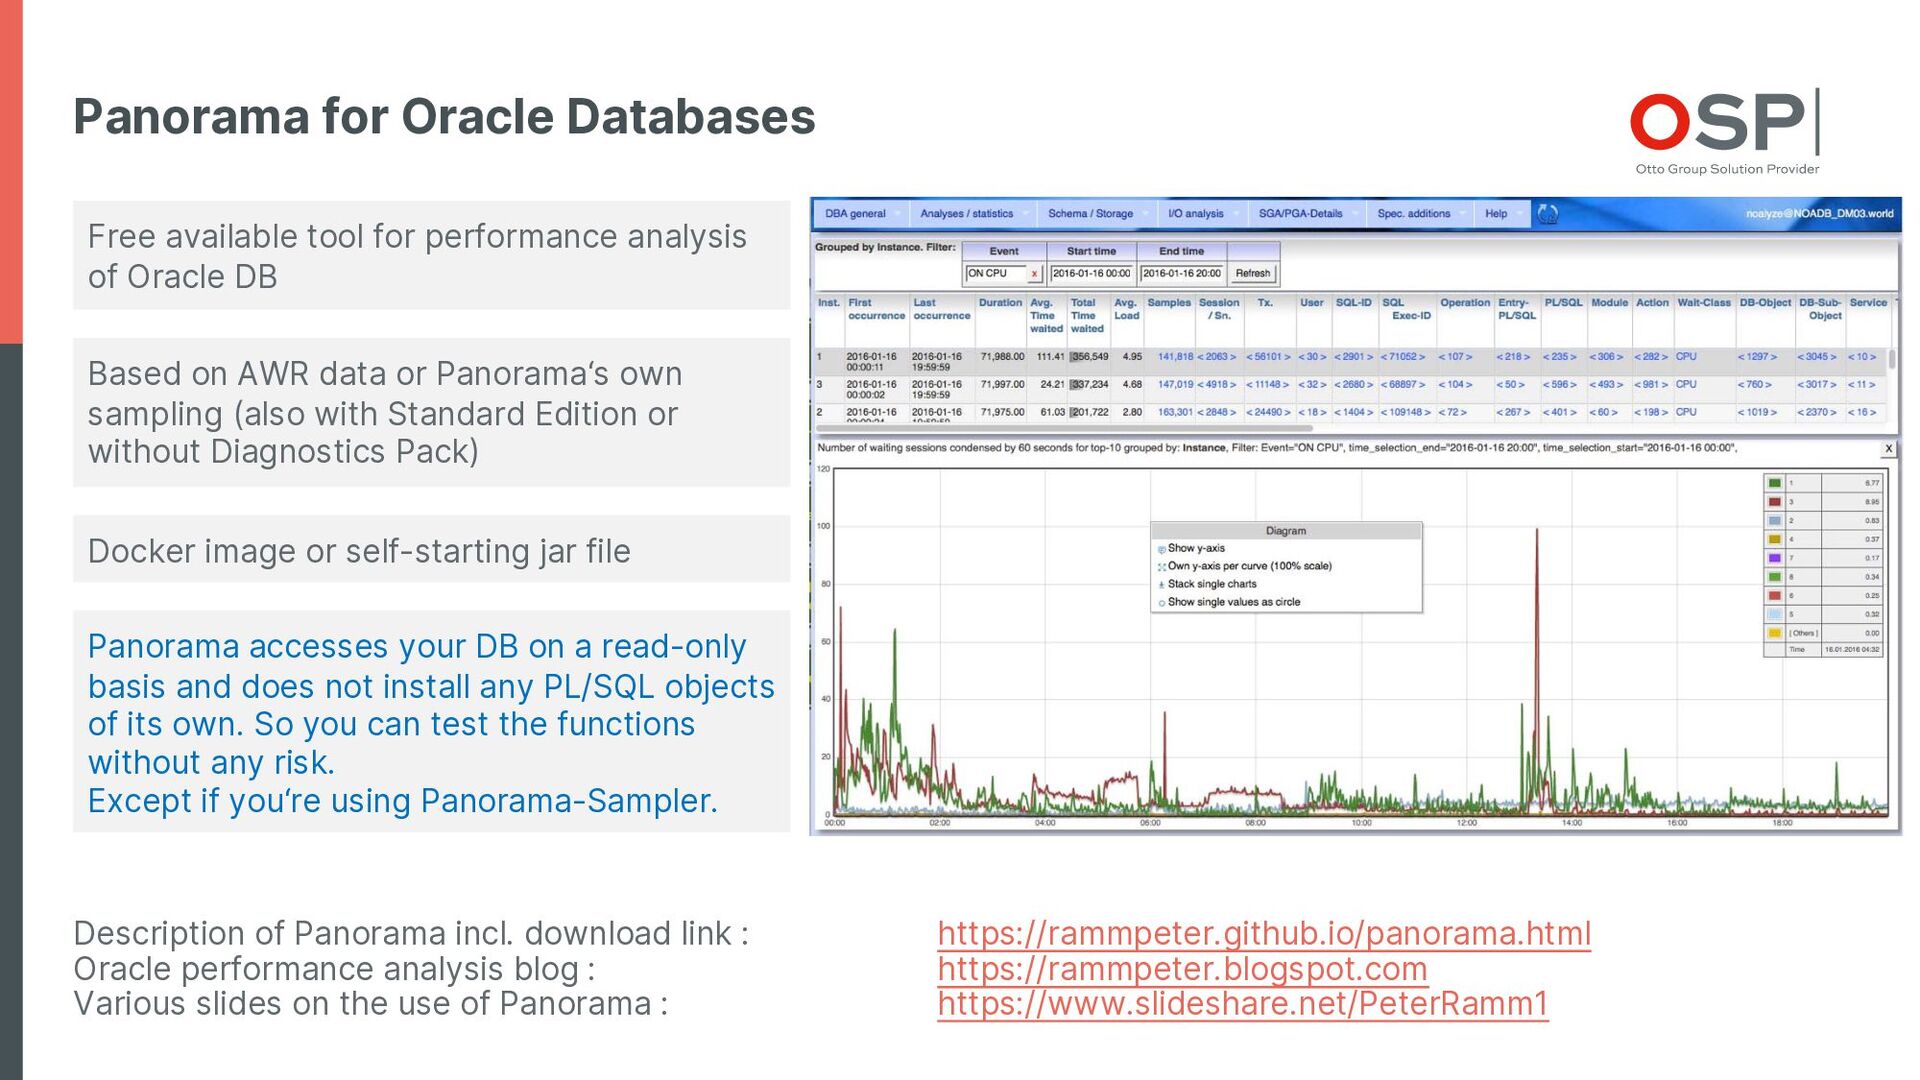
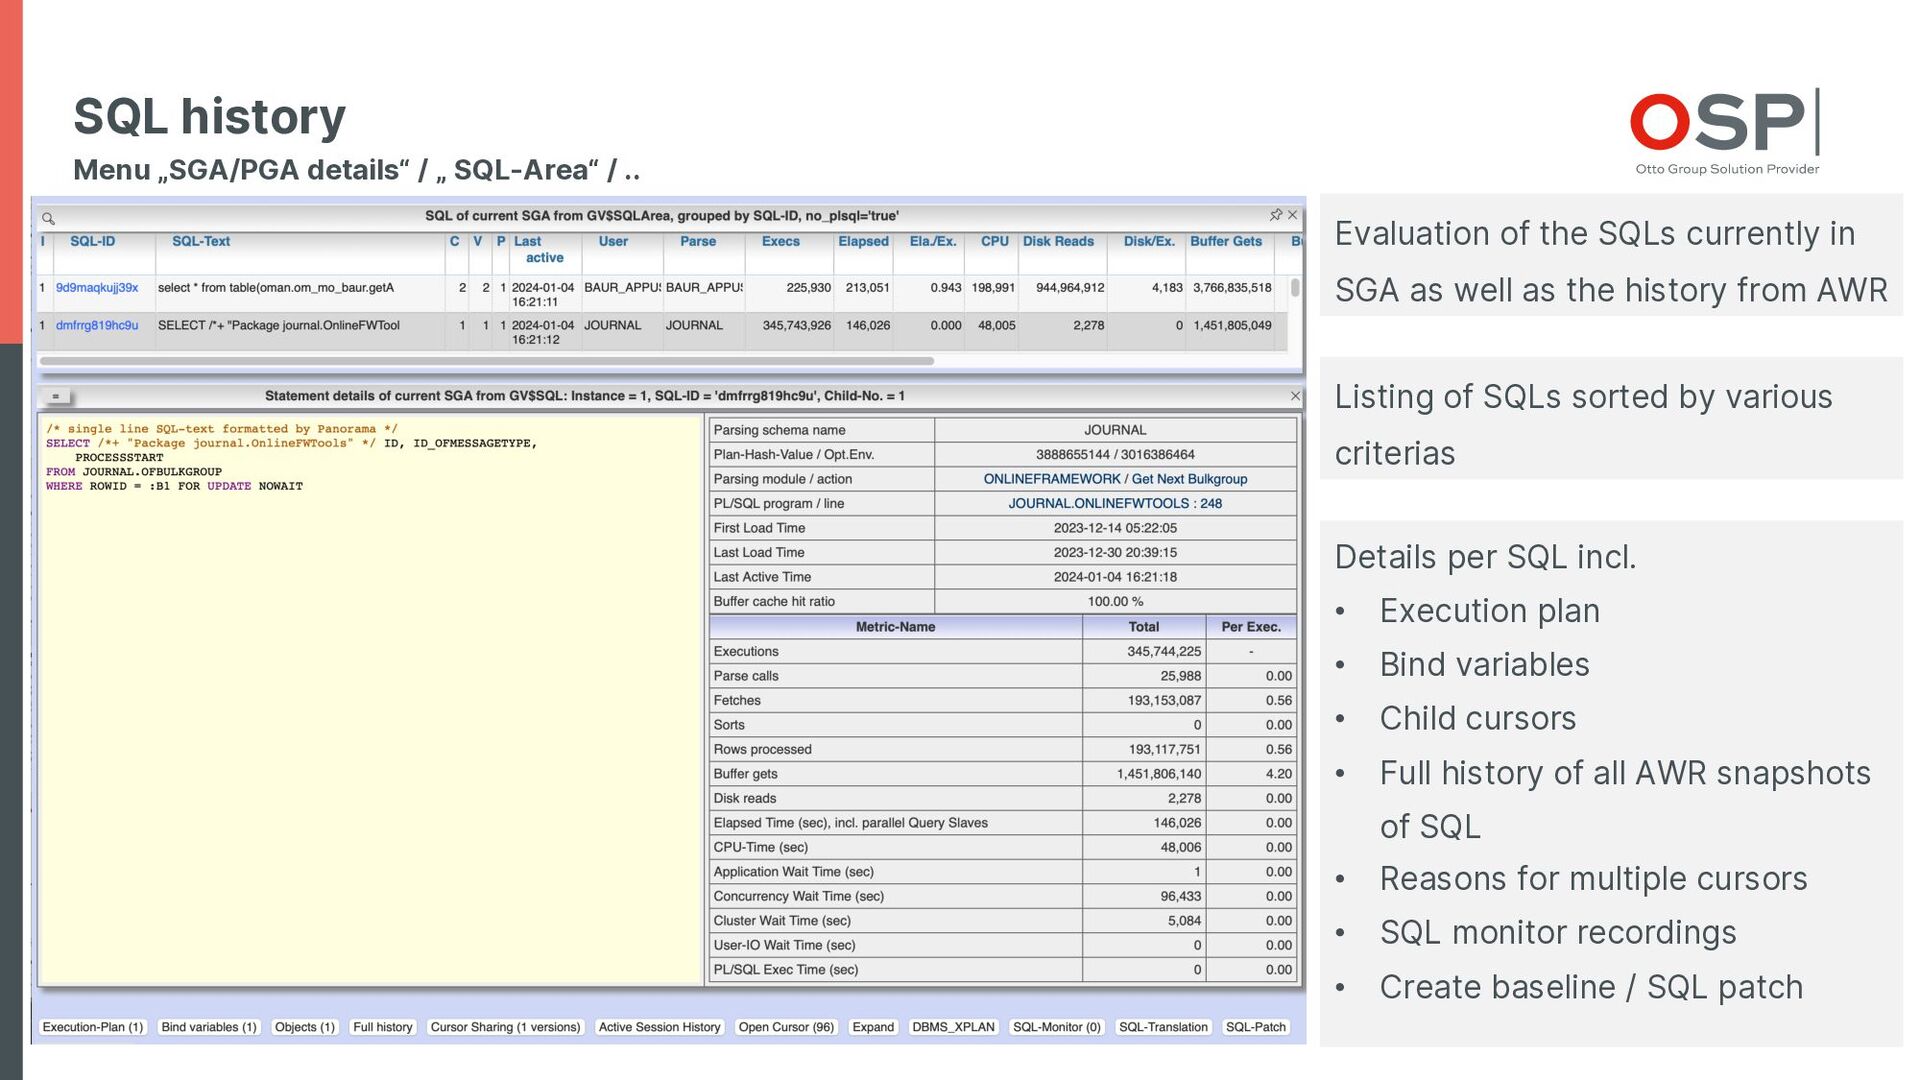
Panorama is a tool for performance analysis and troubleshooting on Oracle databases.
Completed over many years it contains solutions for analysis workflows based on practical experience with large OLTP-systems.
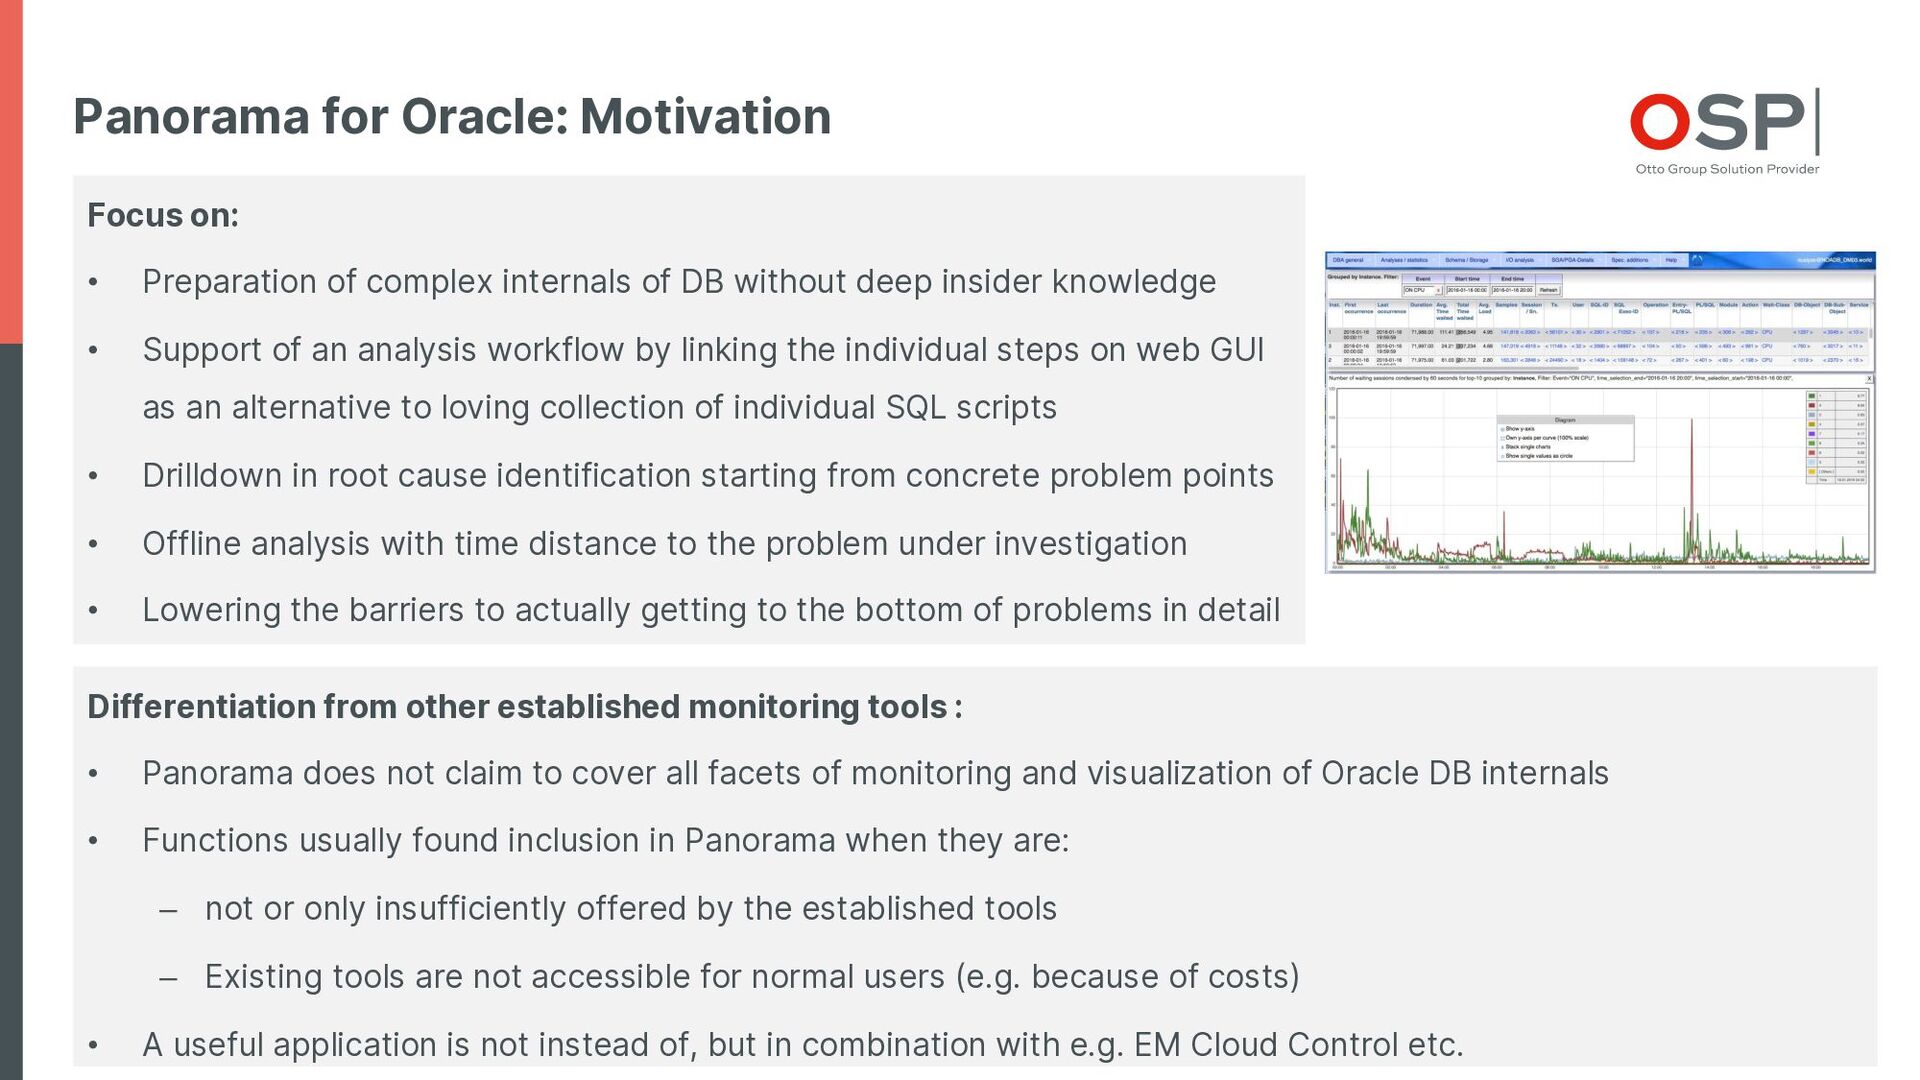
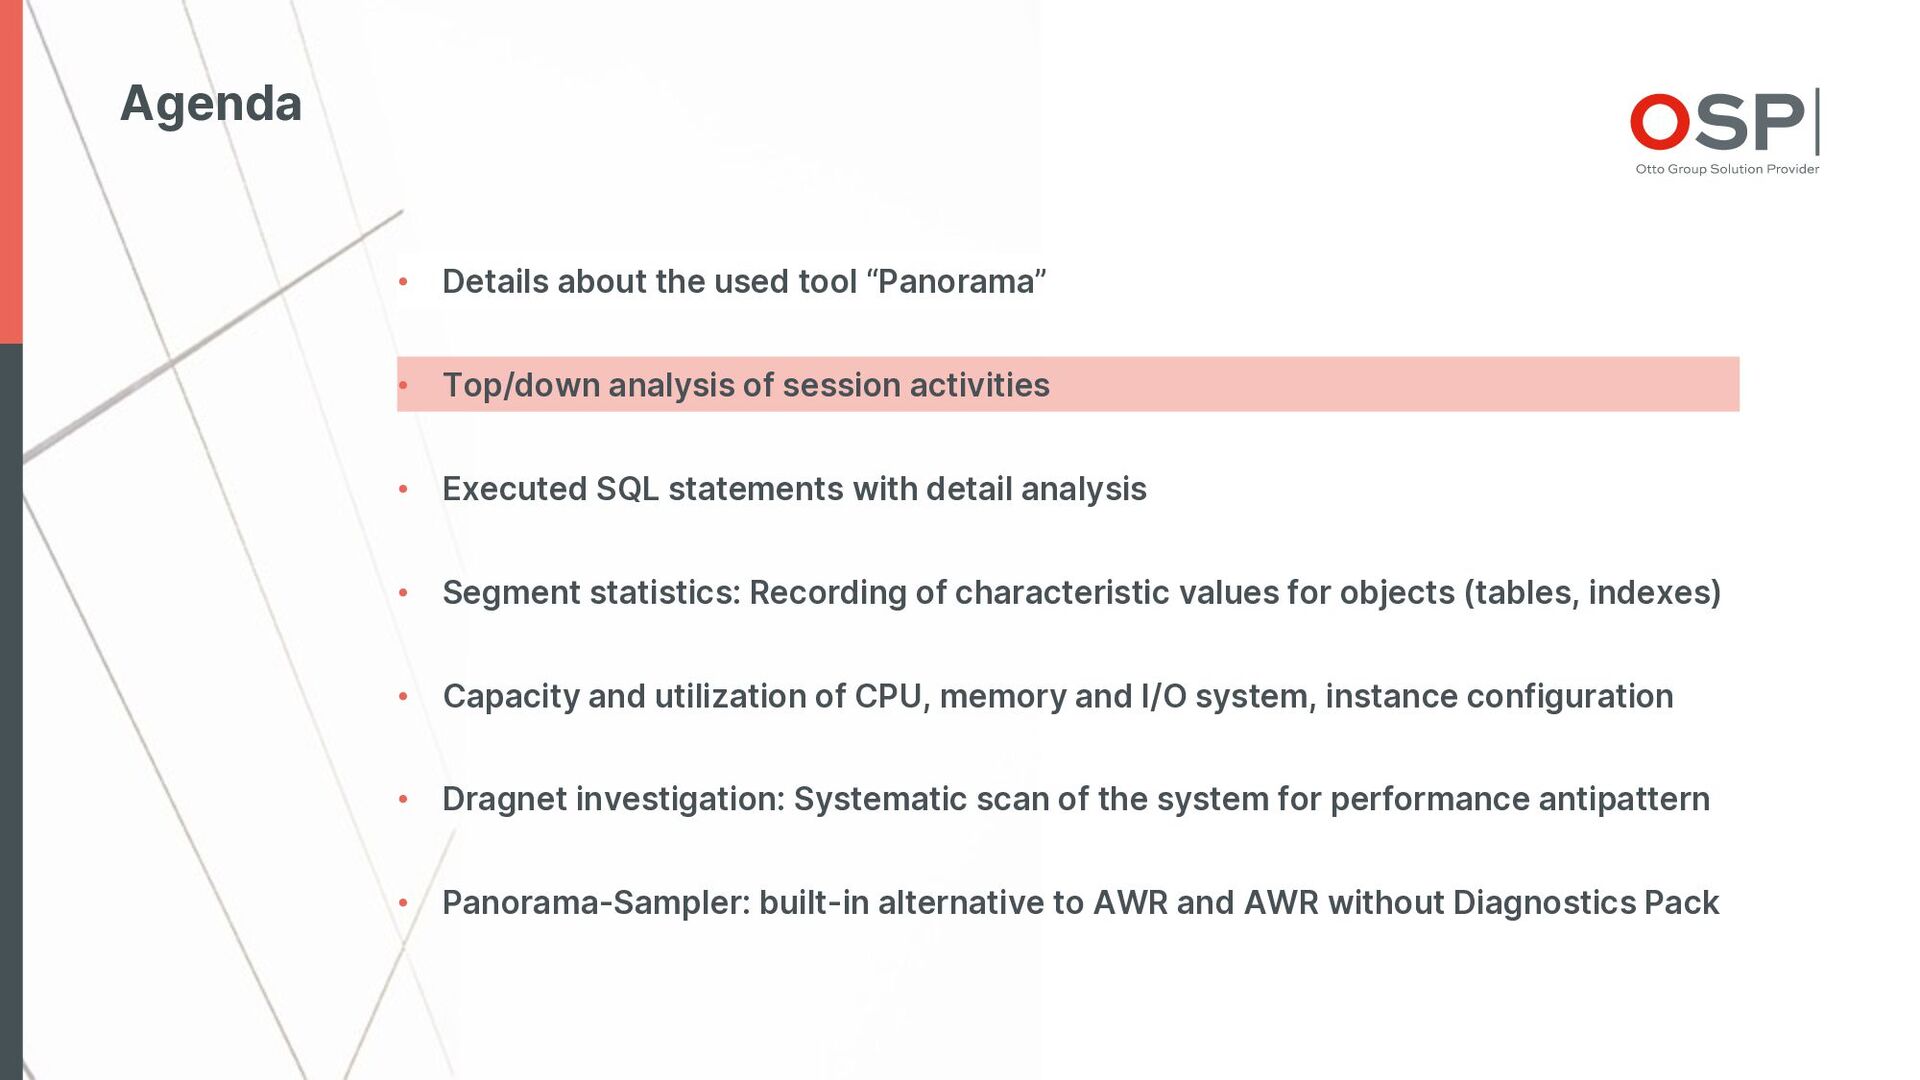
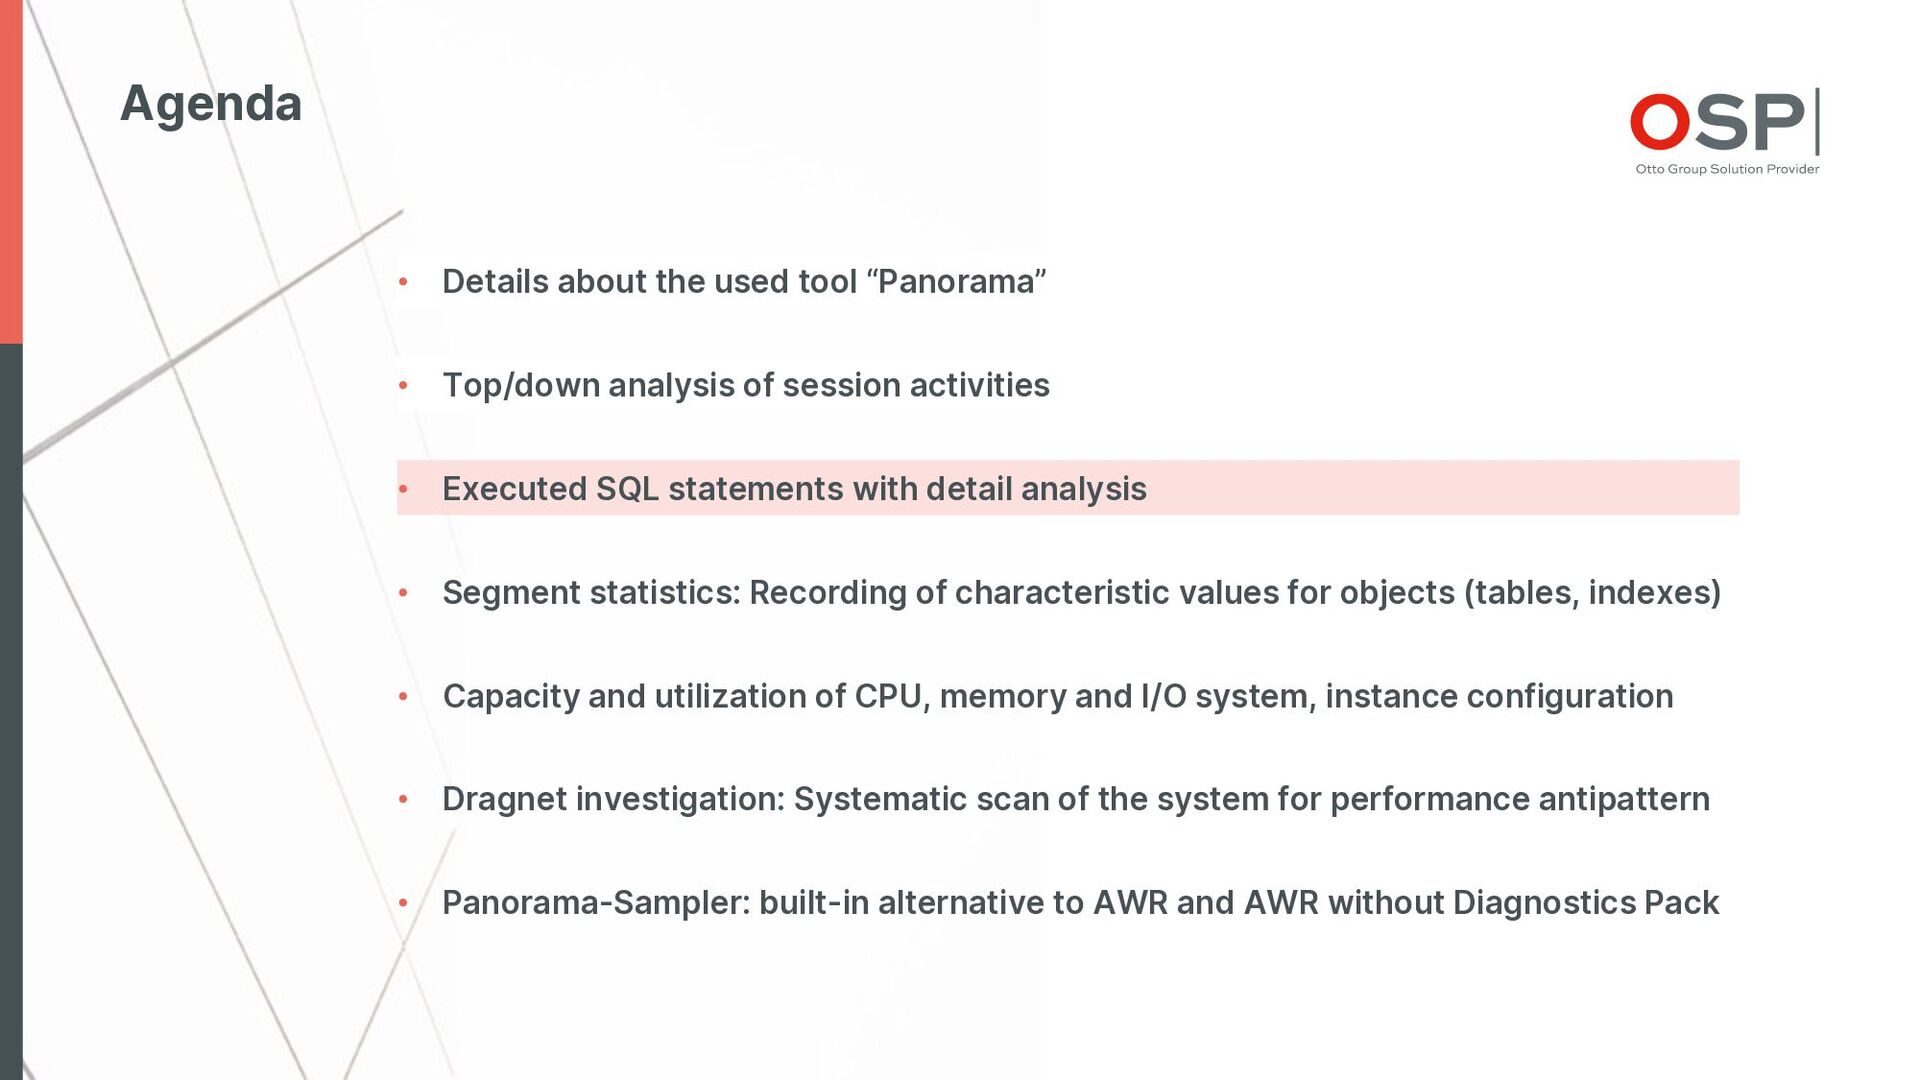
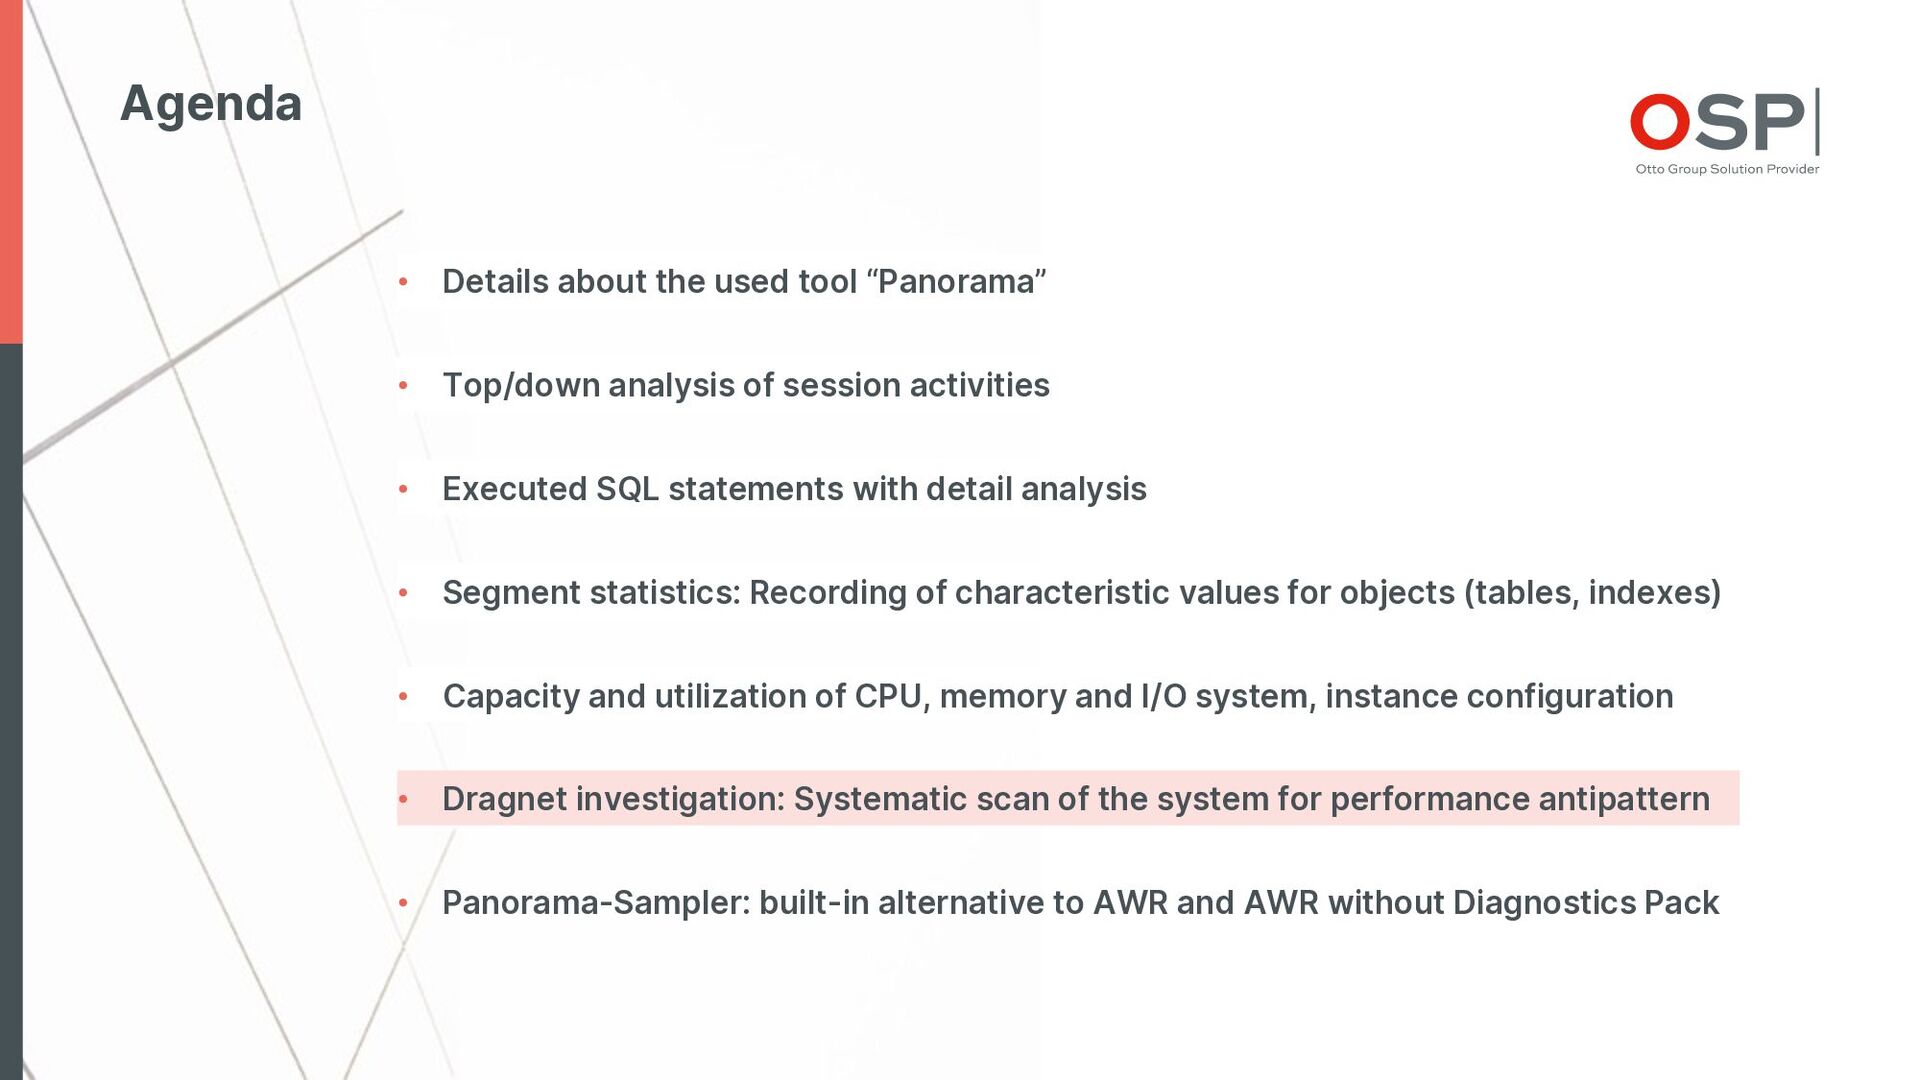
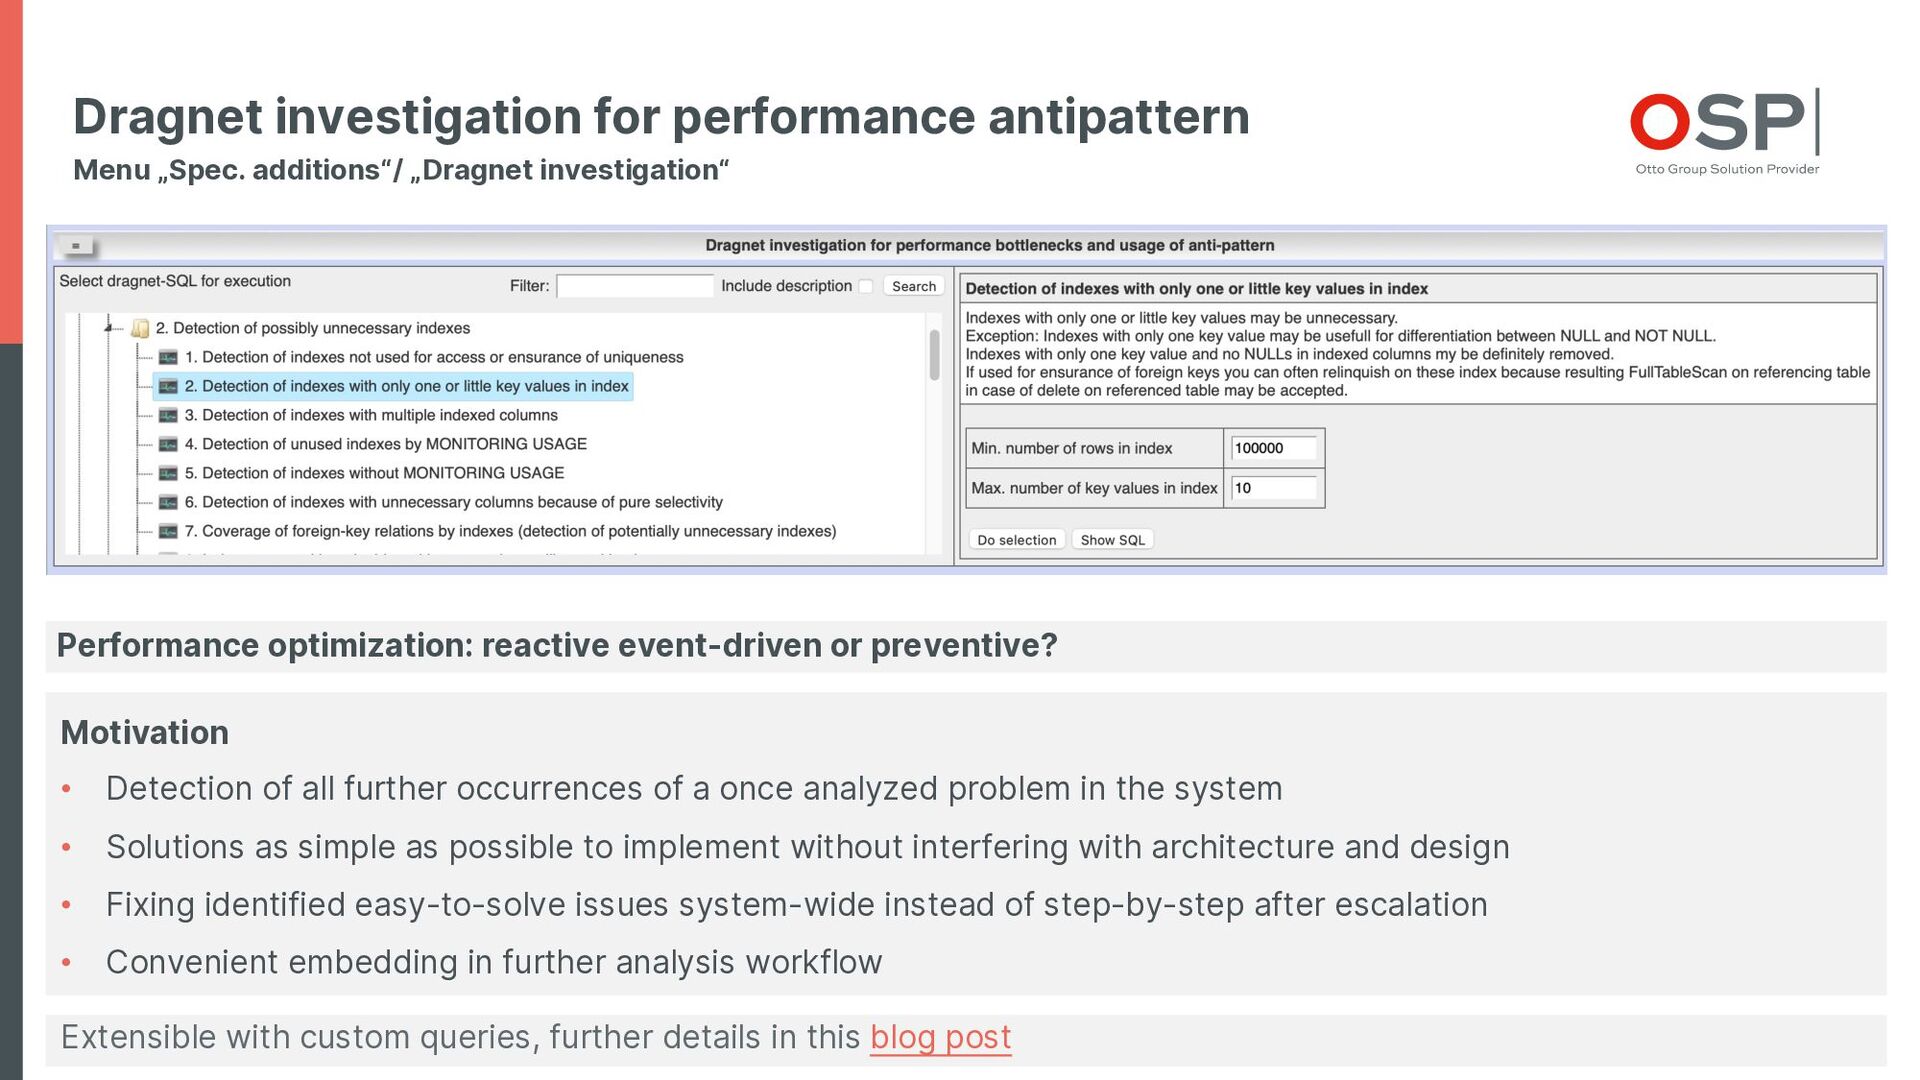
This way it allows quick response on production issues with predefined workflows as well as system health check and systematic scan over the whole DB system for performance antipattern.

Main focus is:
- Allows software developer or DBA the elaboration of complex contexts inside the DB operation without deep insider knowledge.
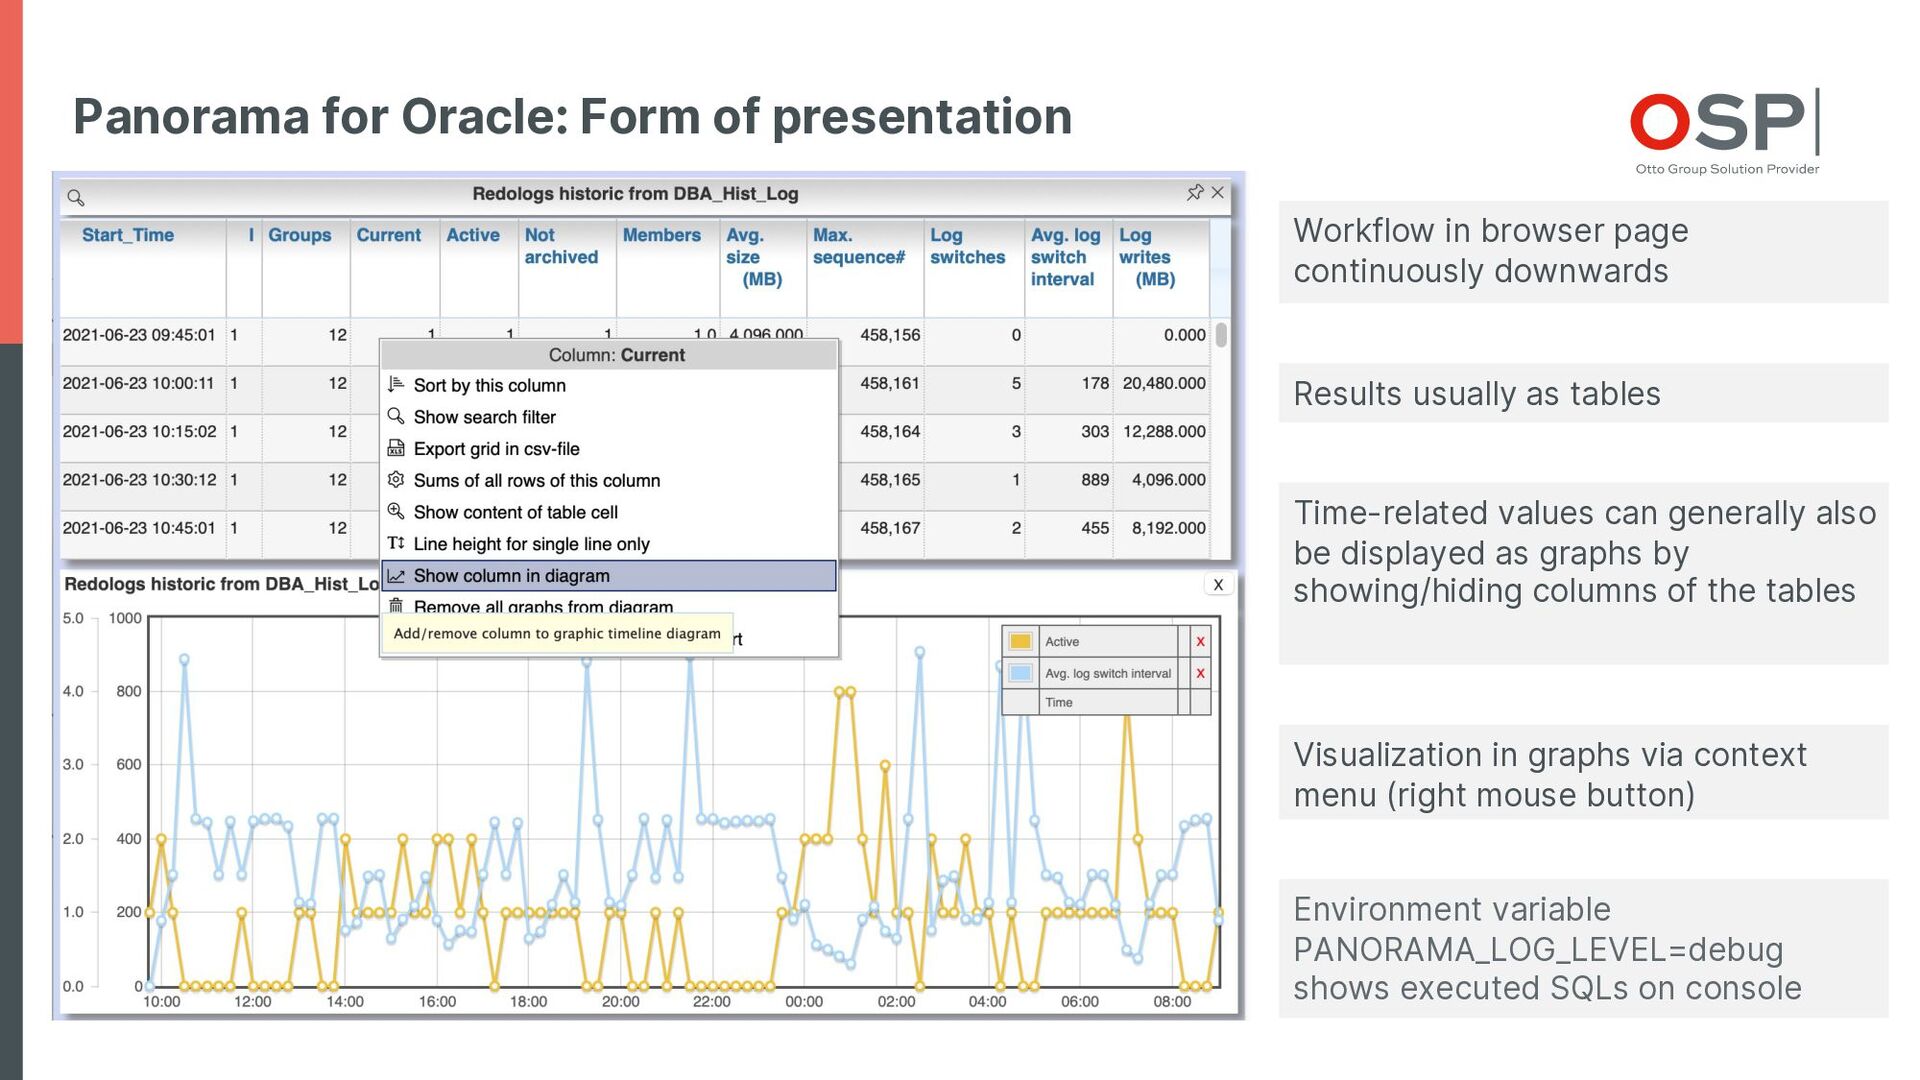
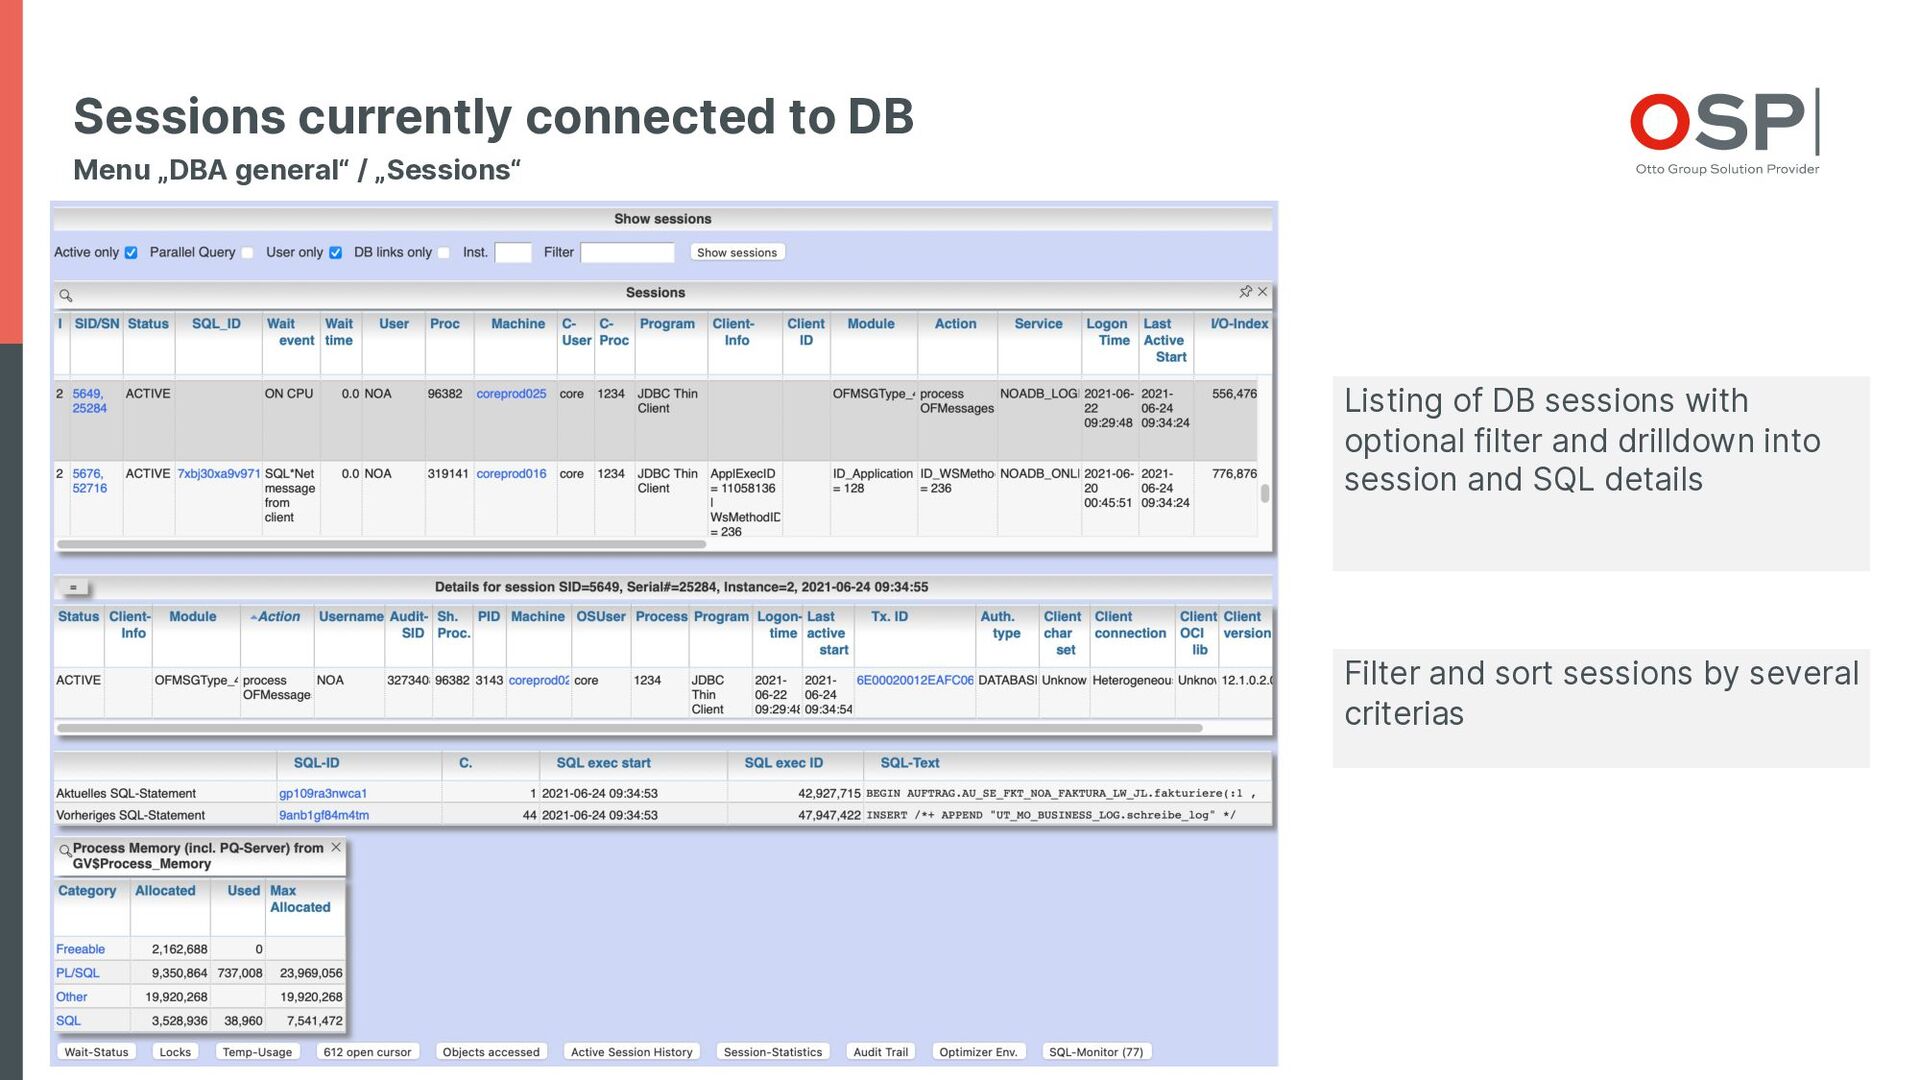
- Support of an analysis workflow by linking the particular steps on web GUI as an alternative to manually using a collection of individual SQL scripts.
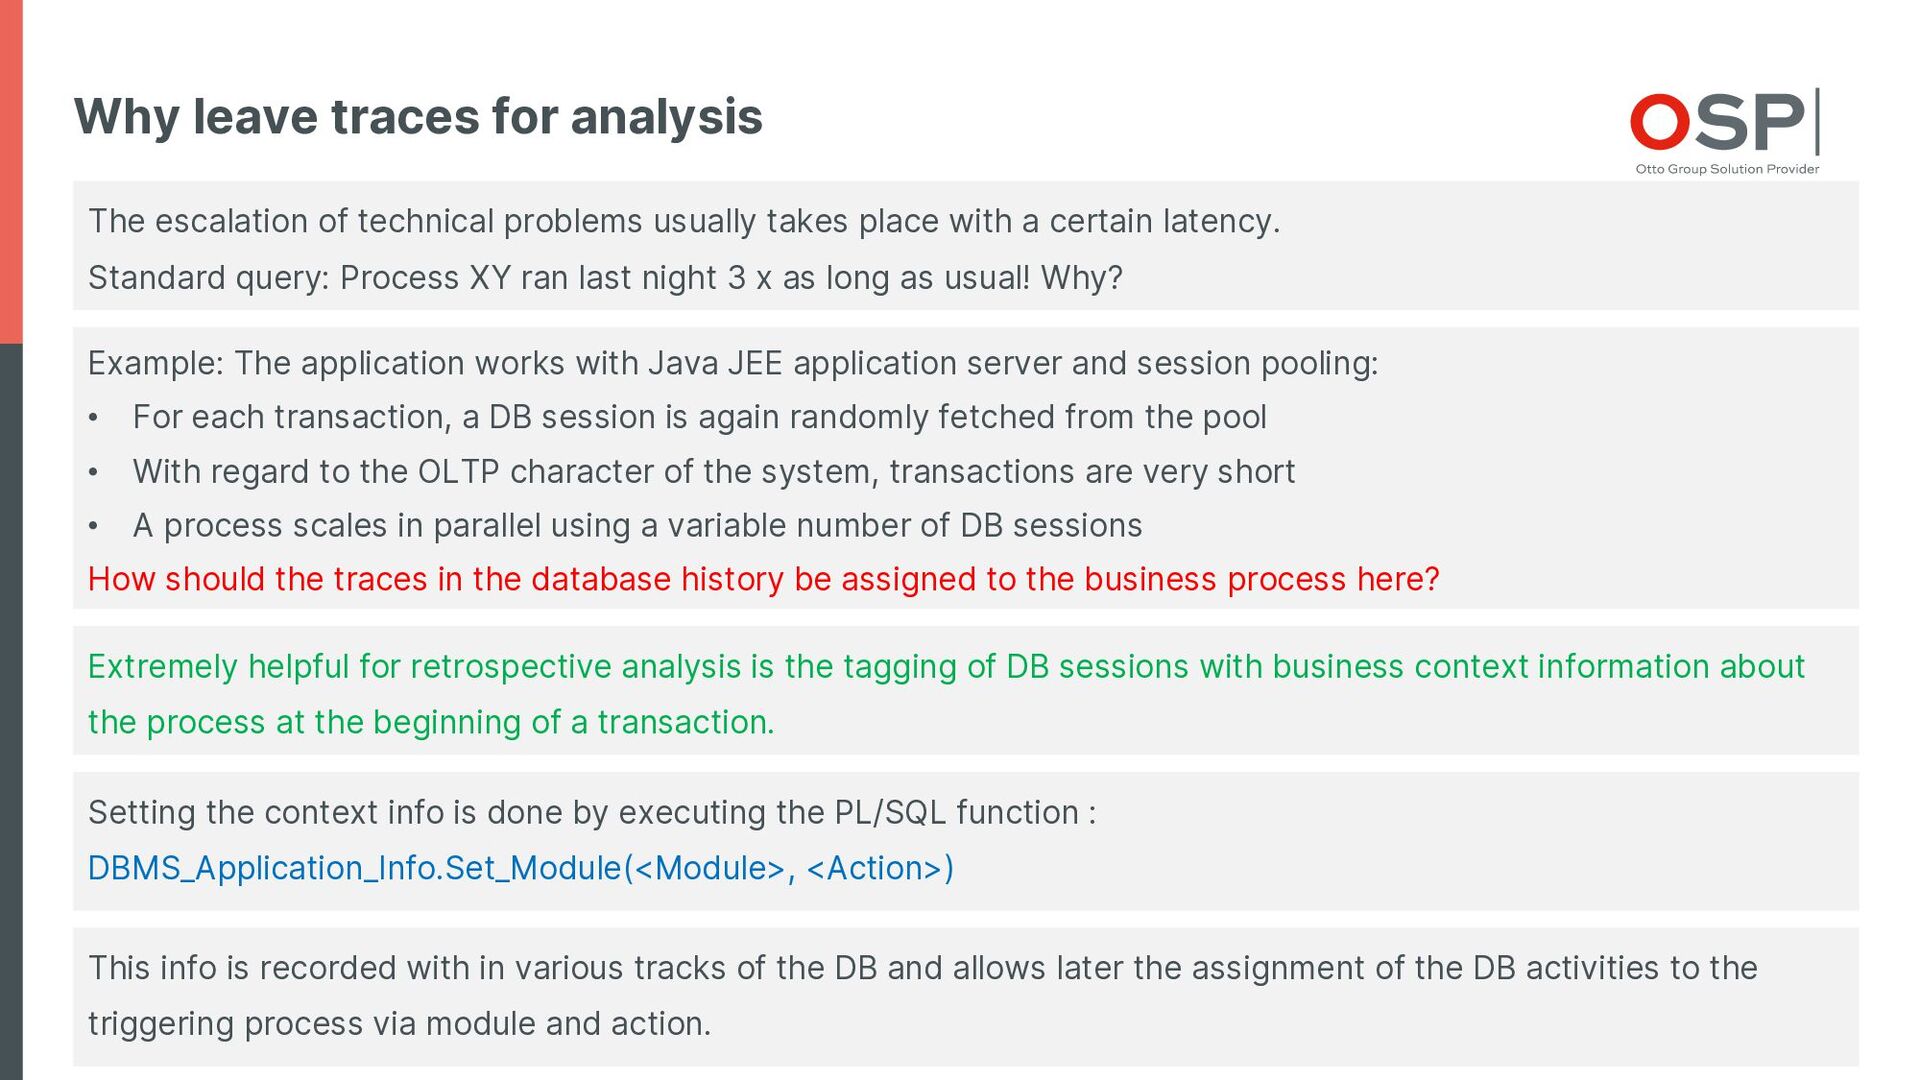
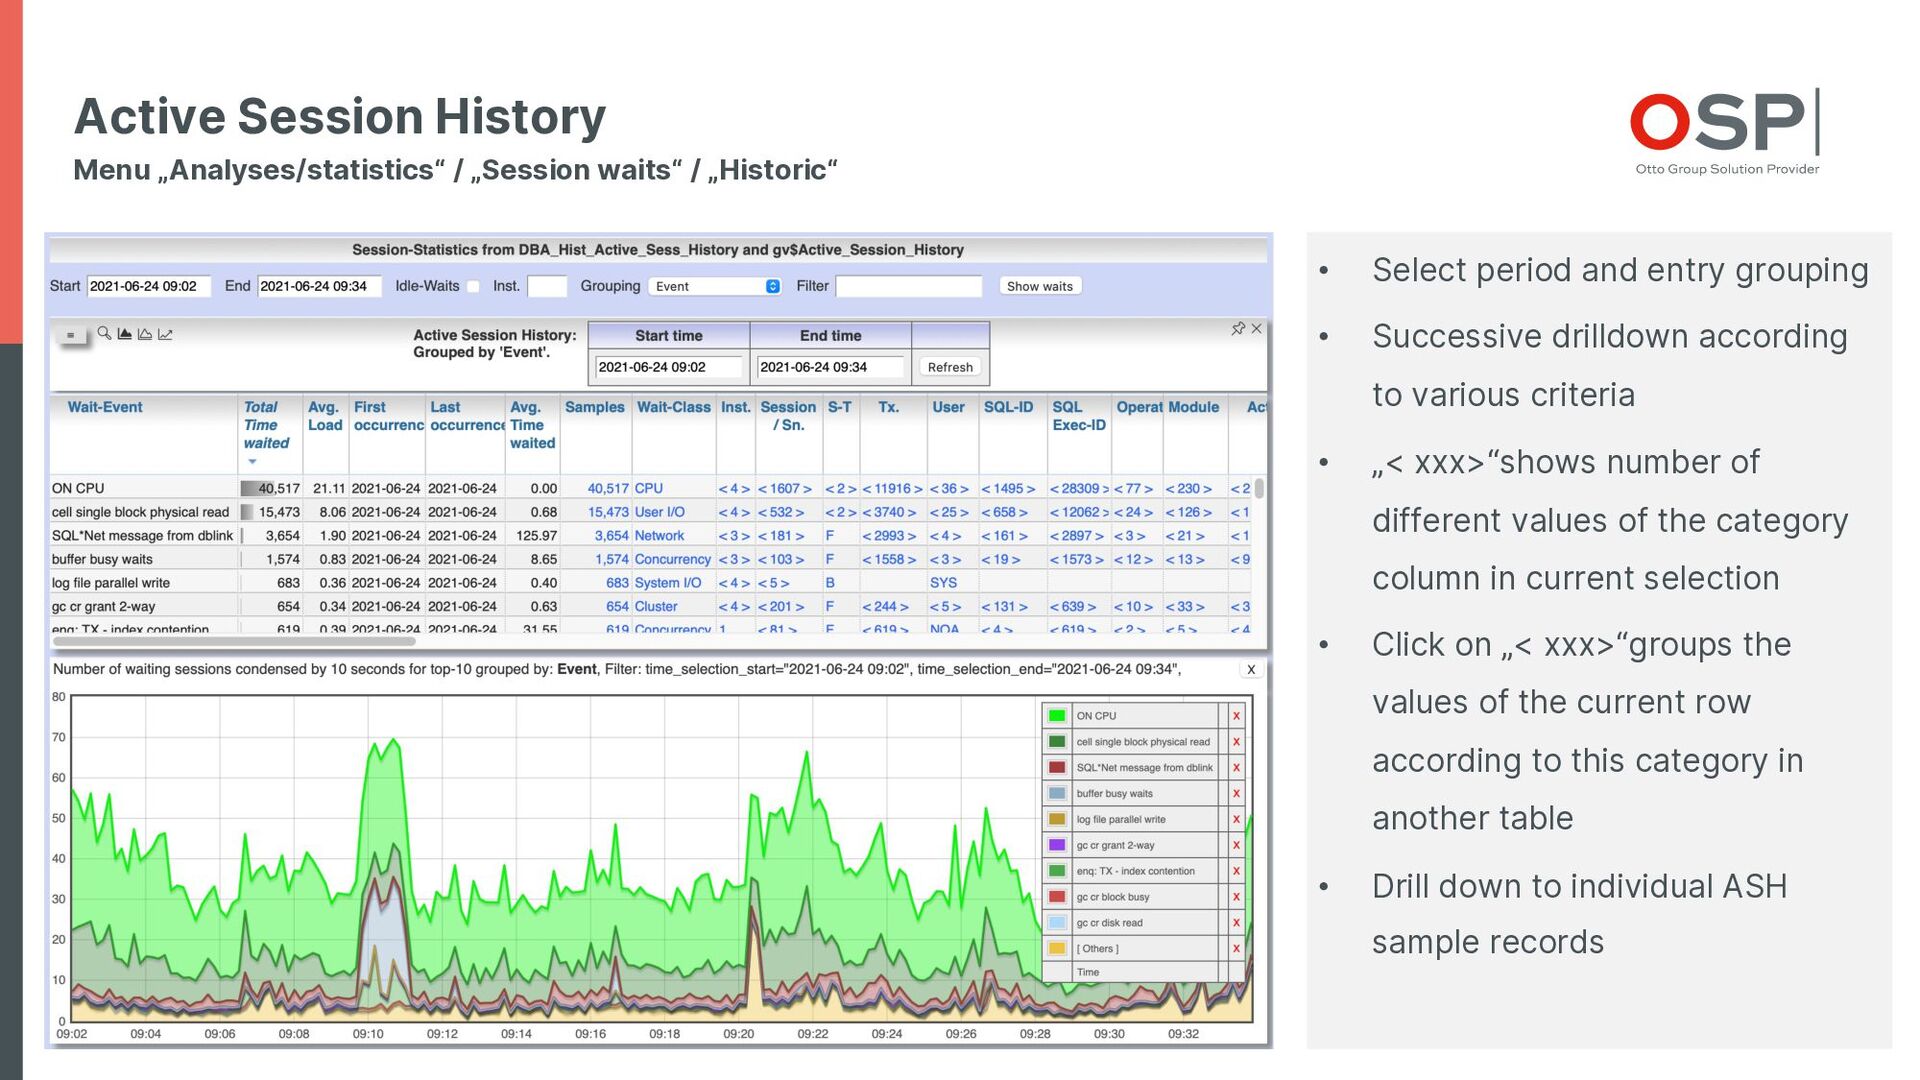
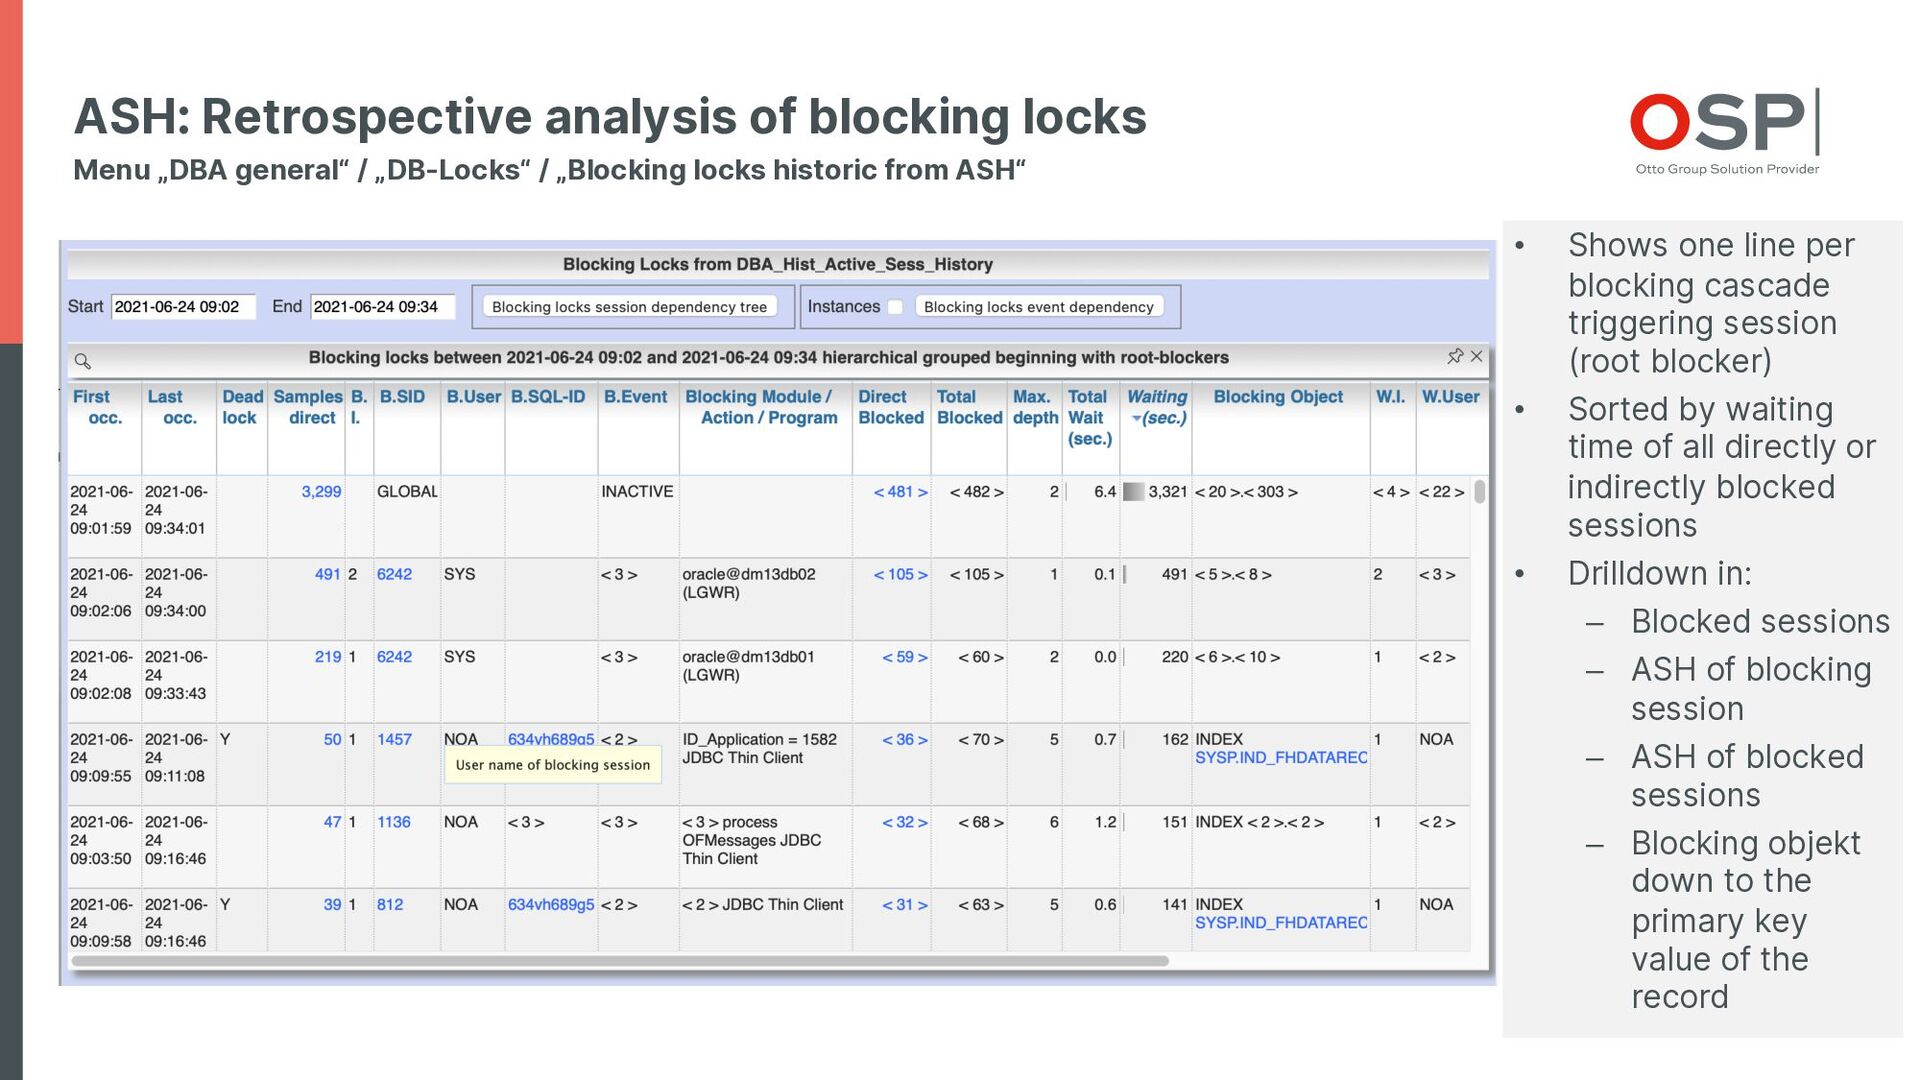
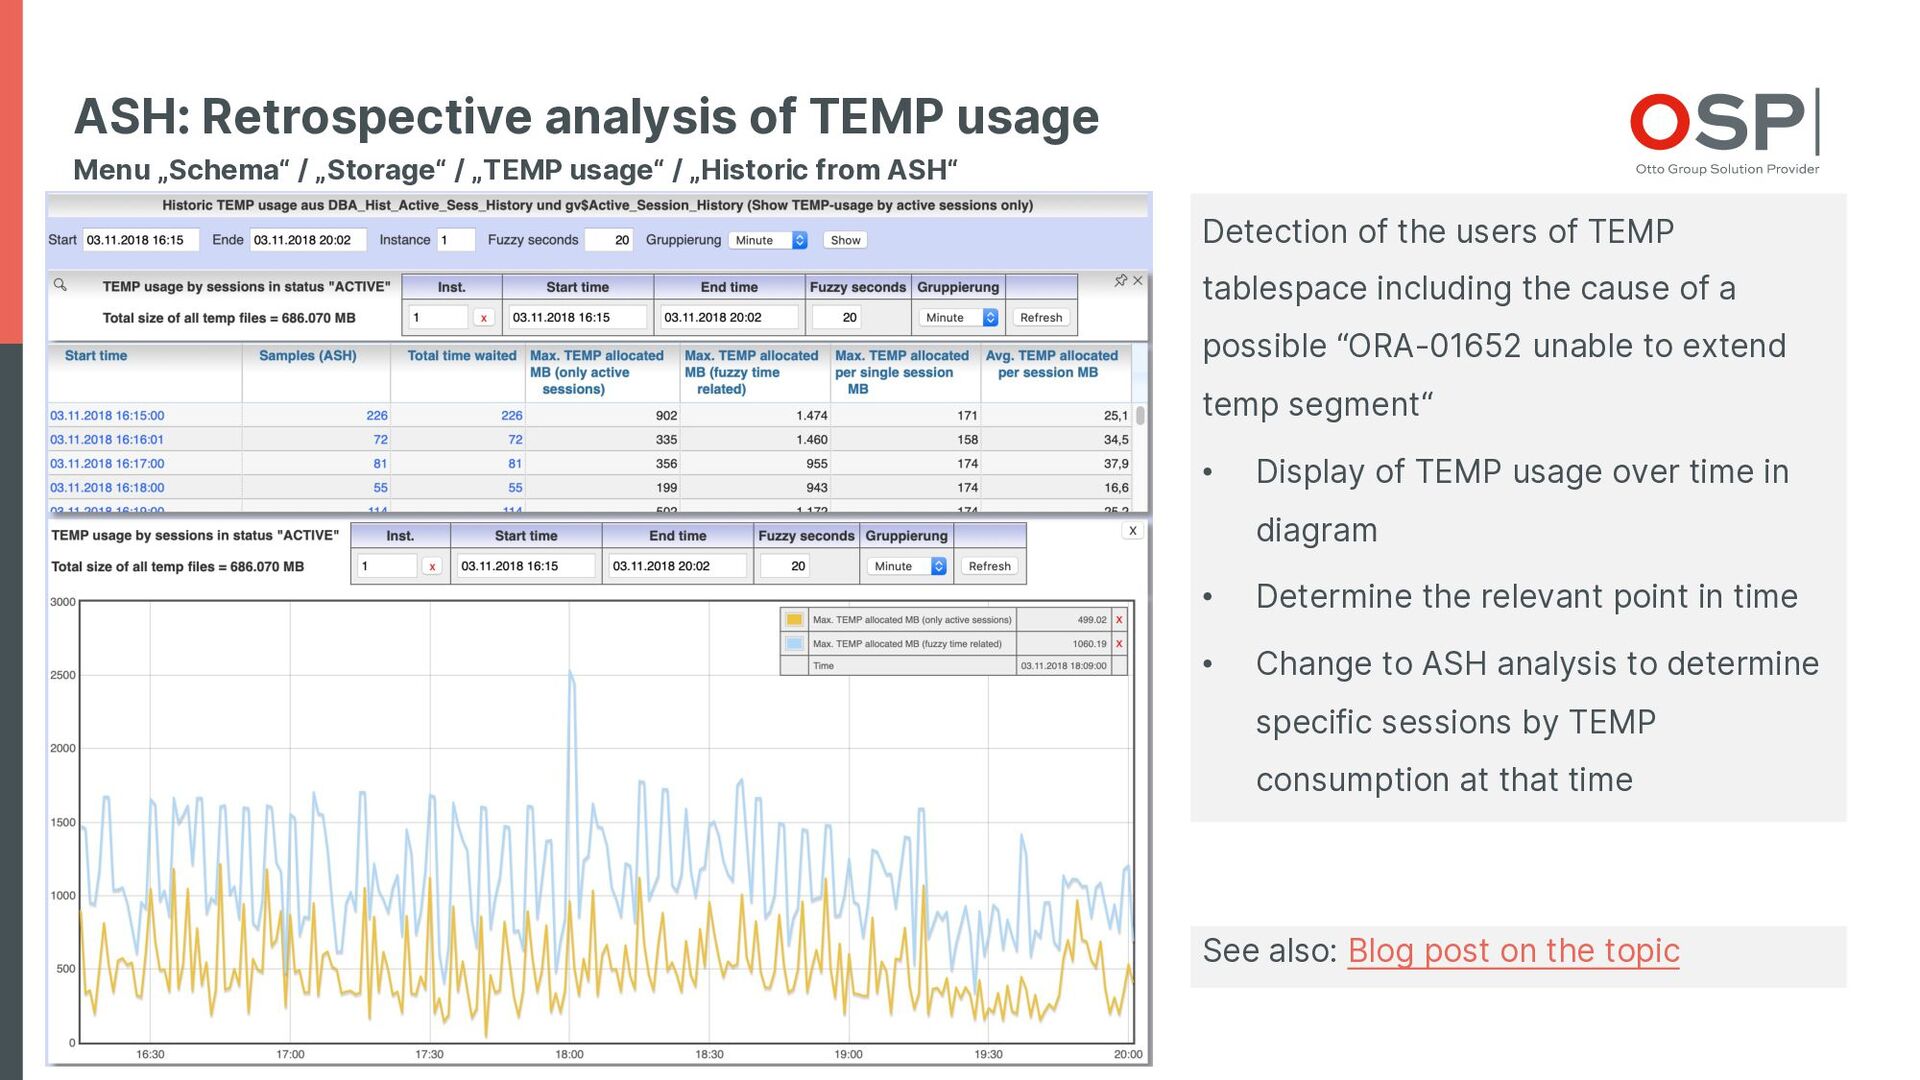
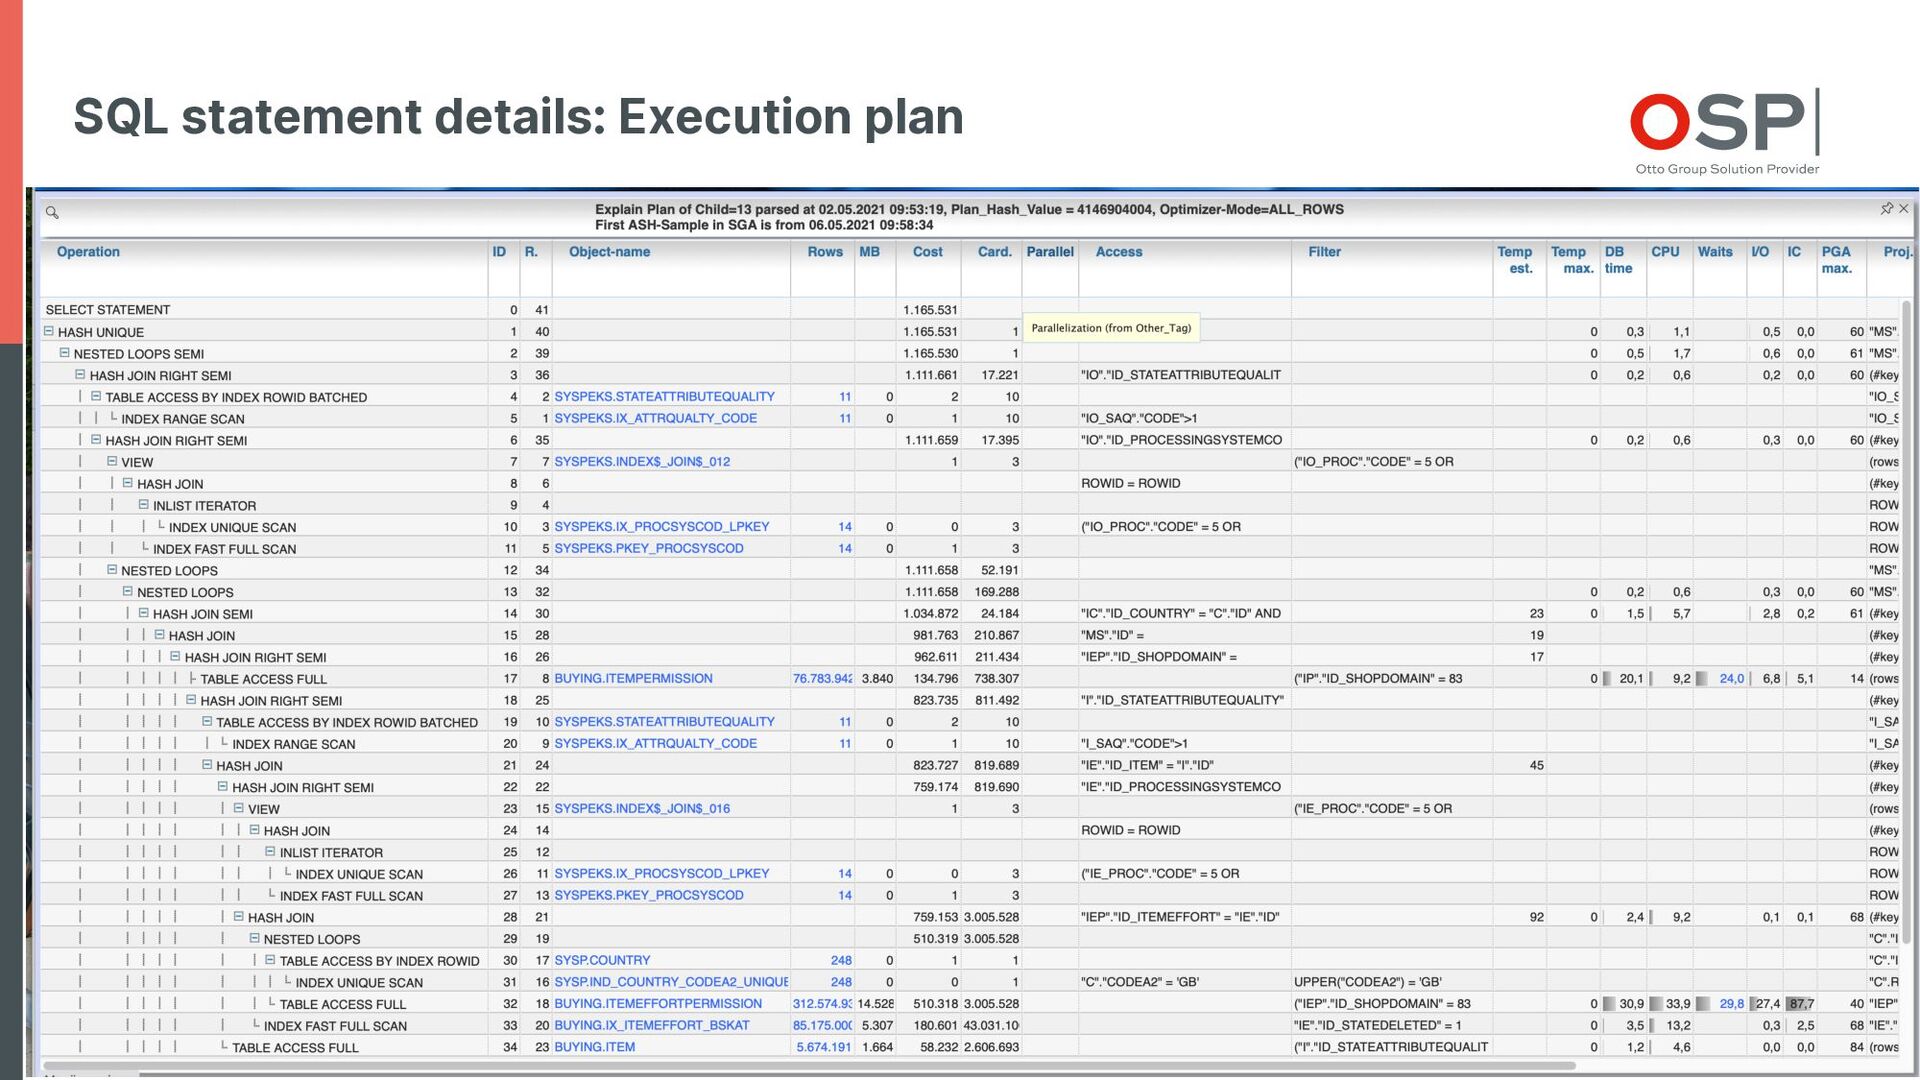
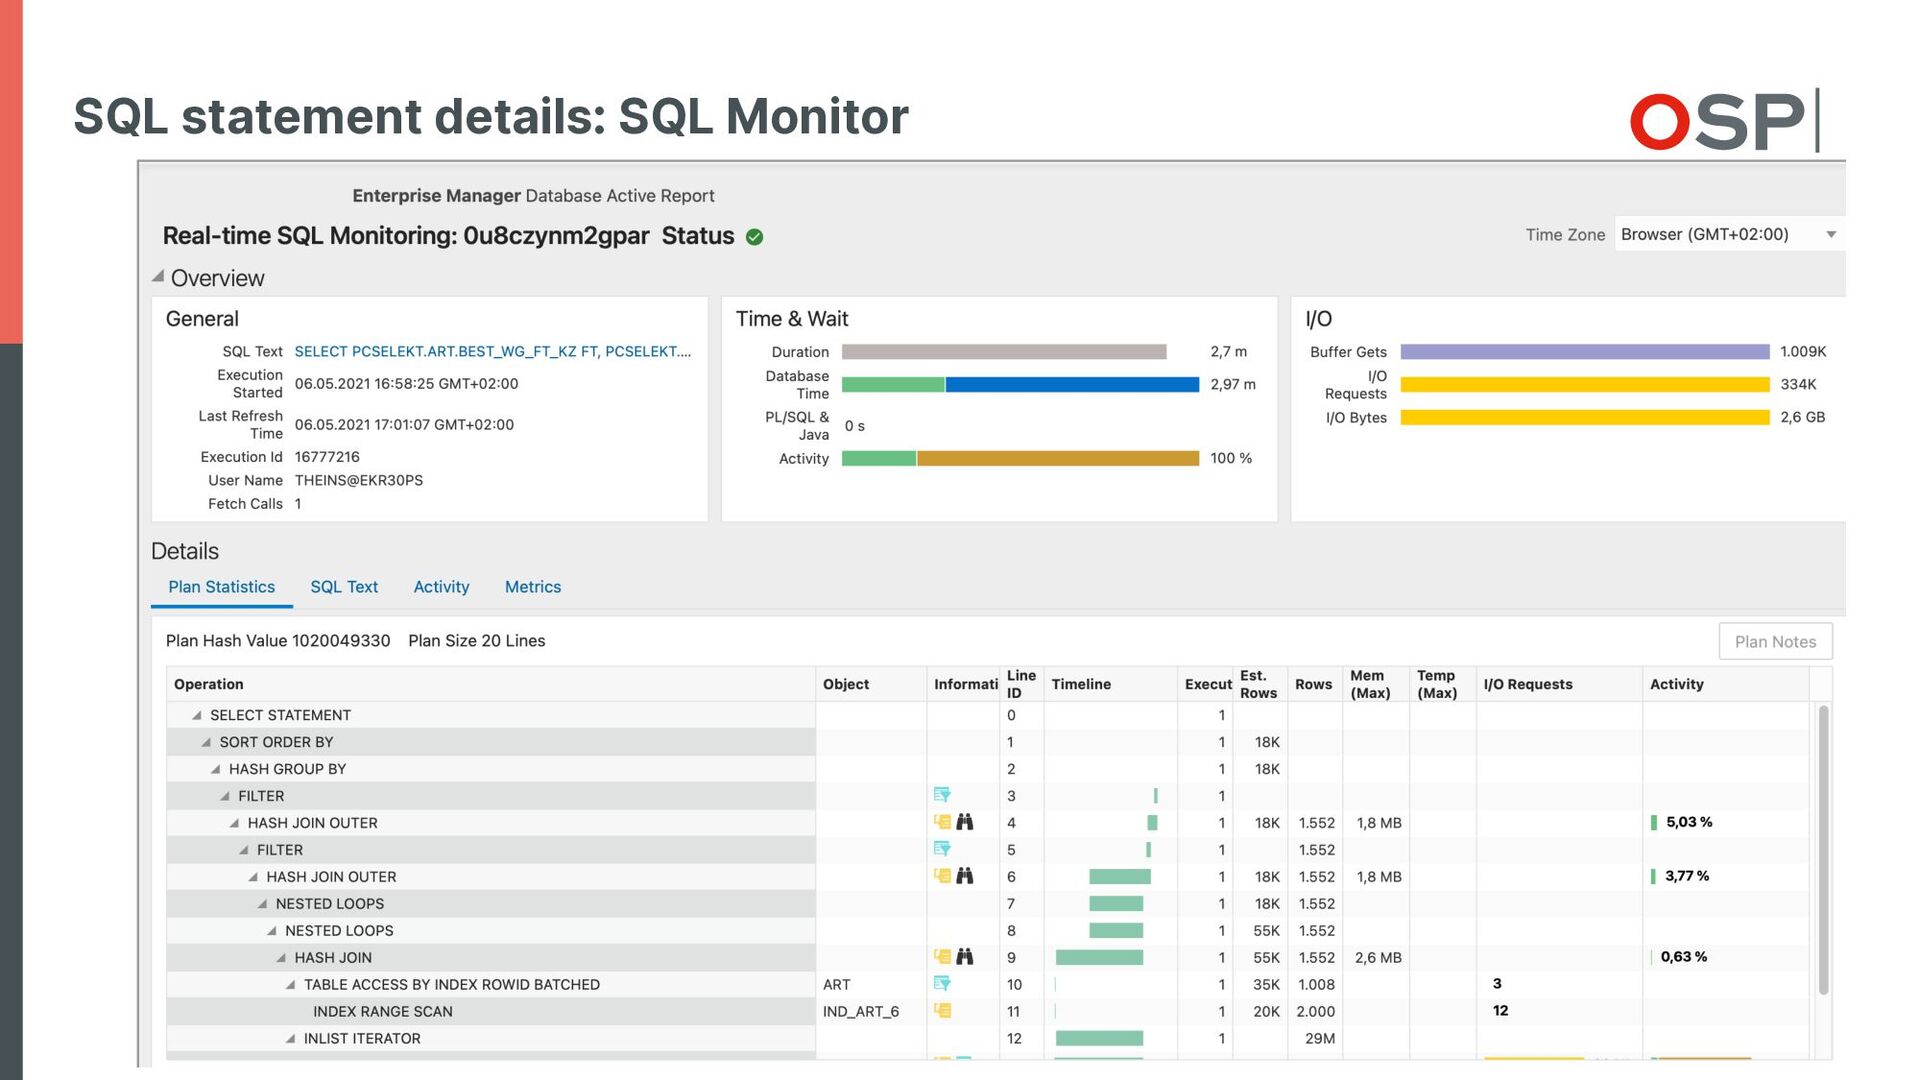
- Drilldown in root cause identification starting from specific problem points.
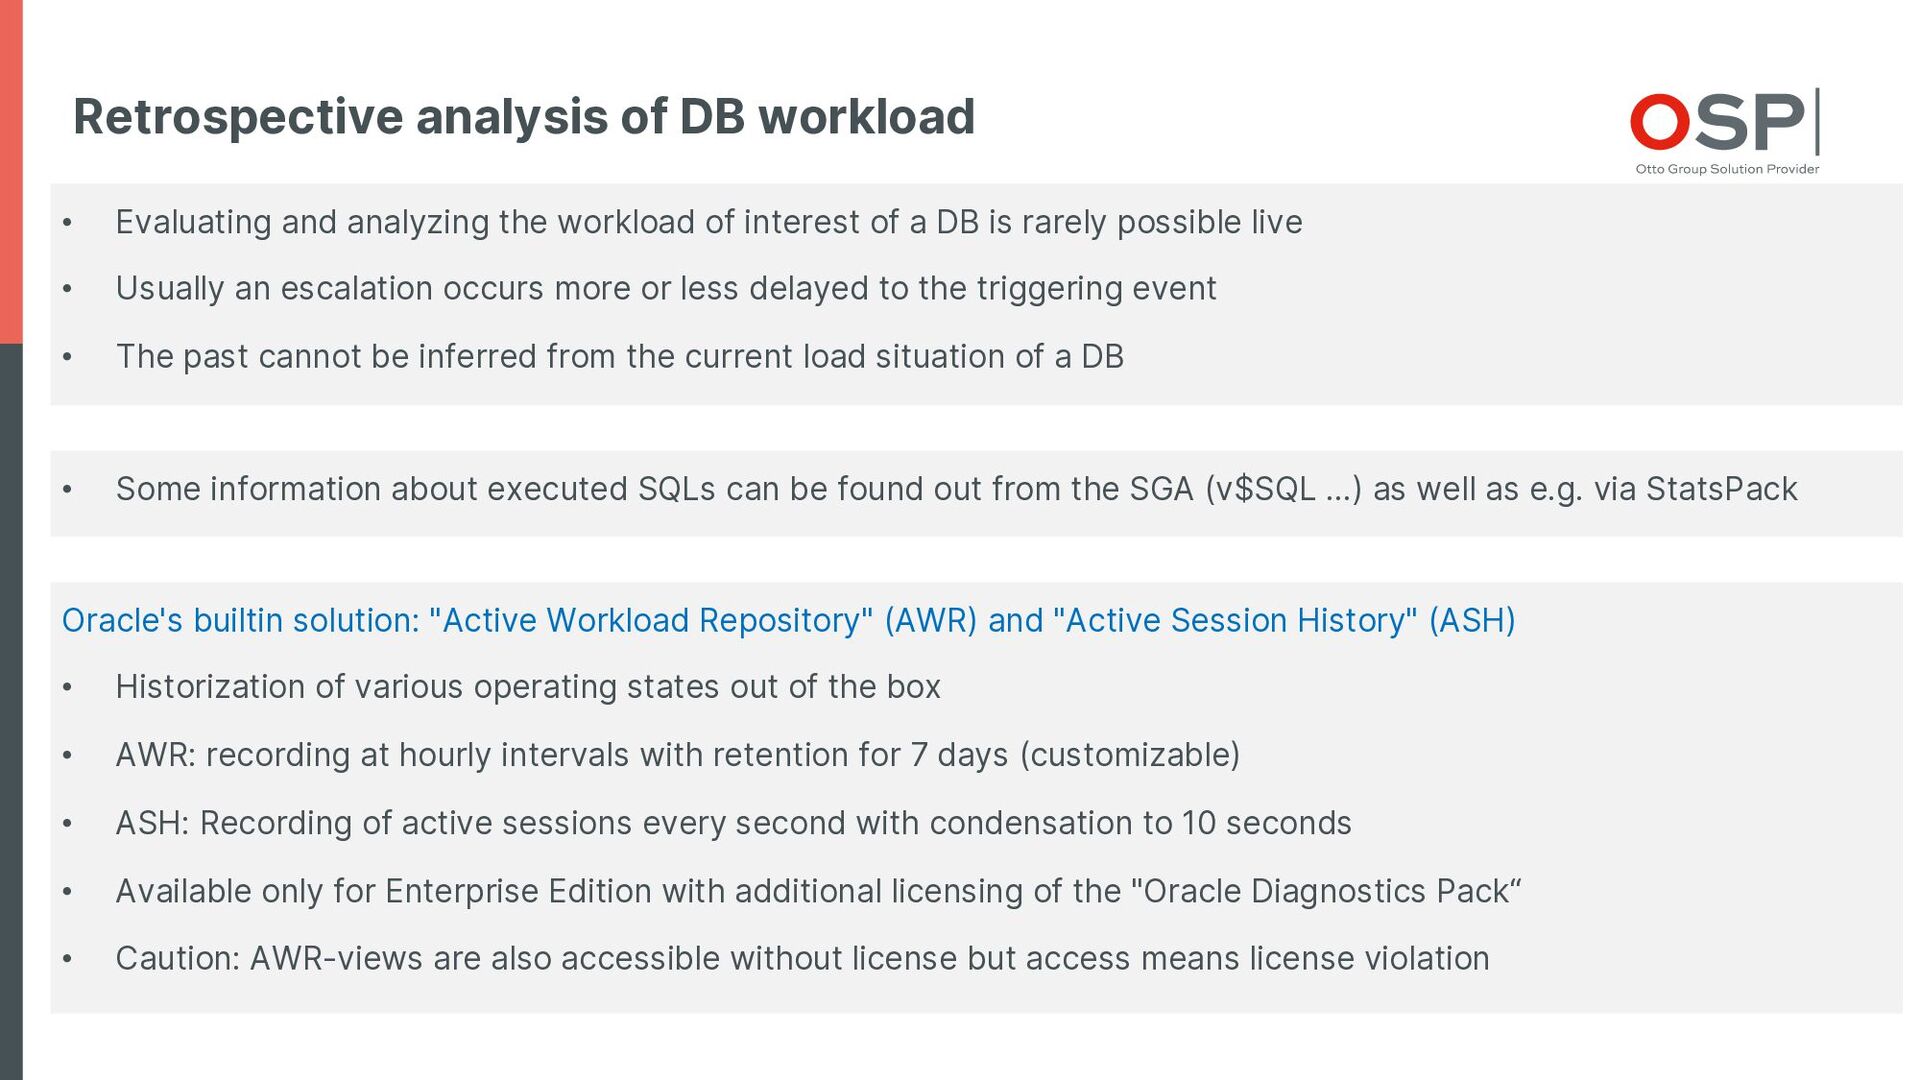
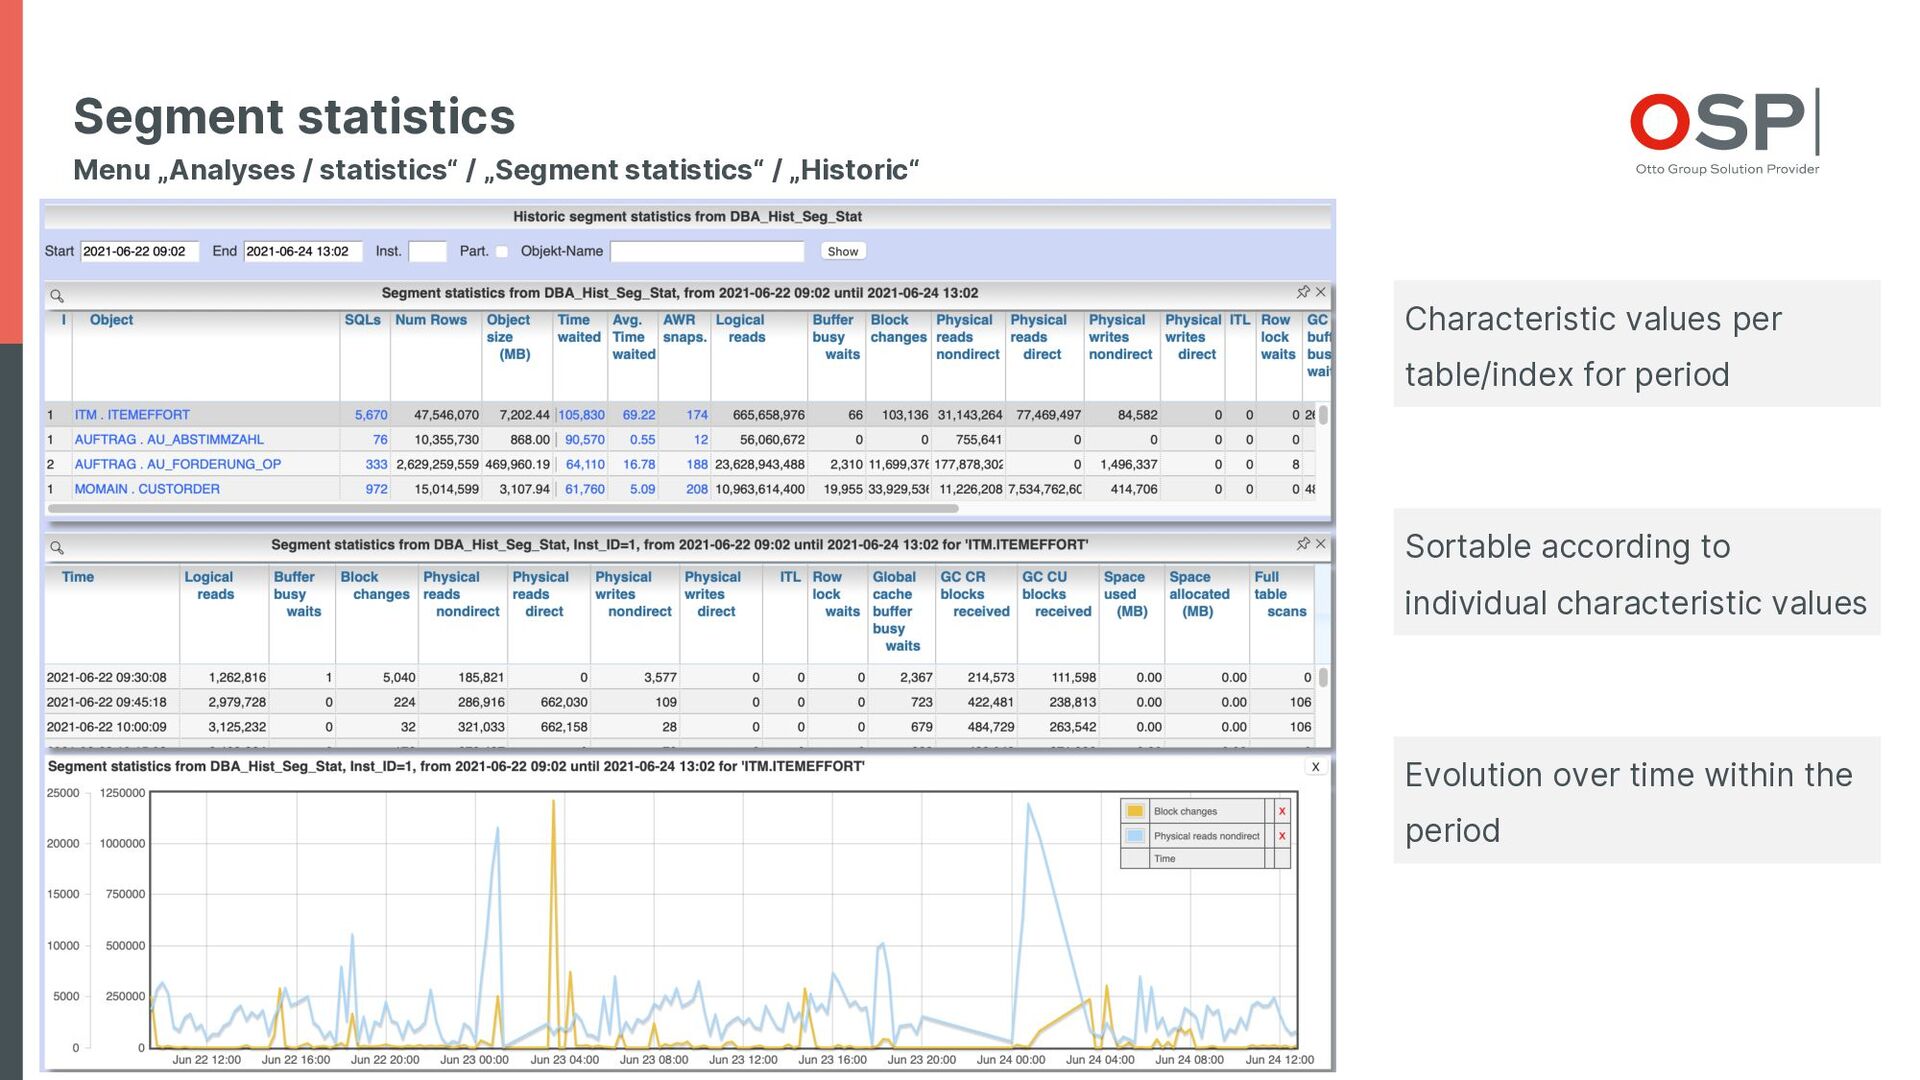
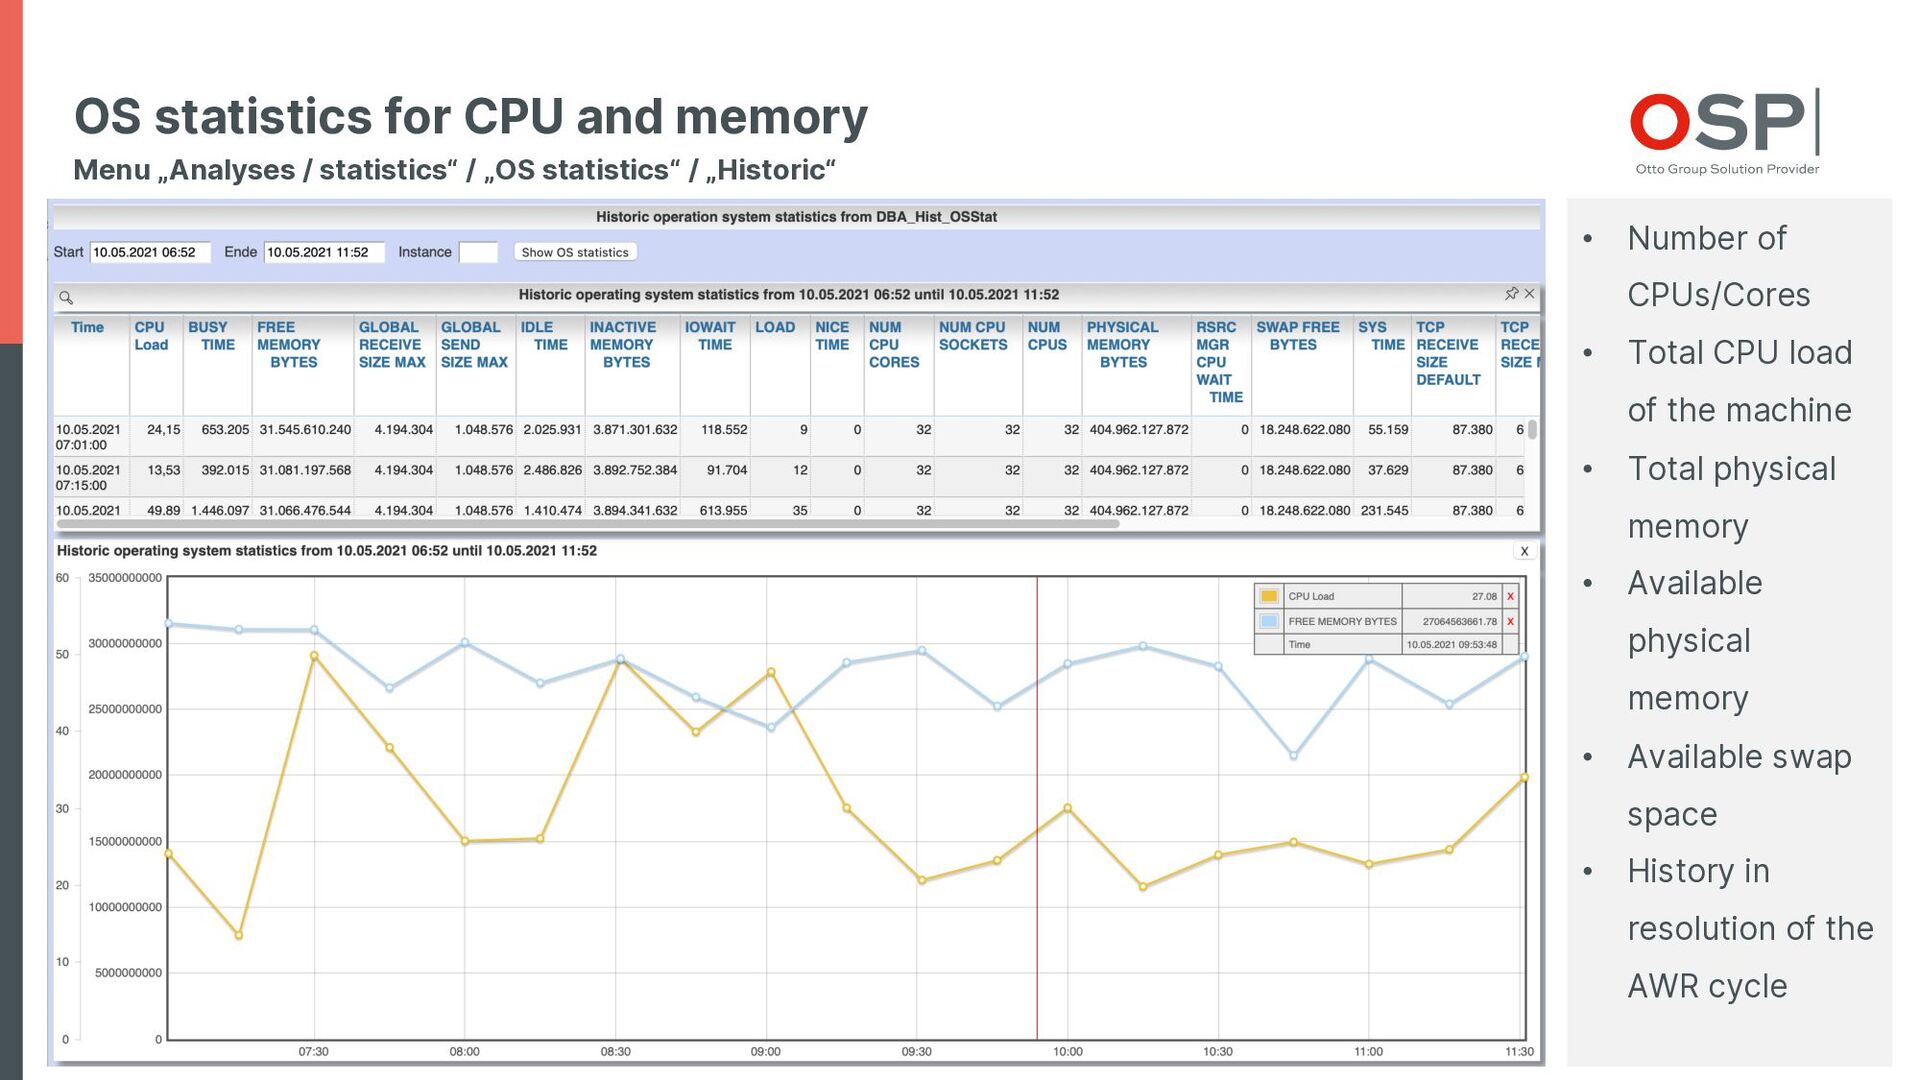
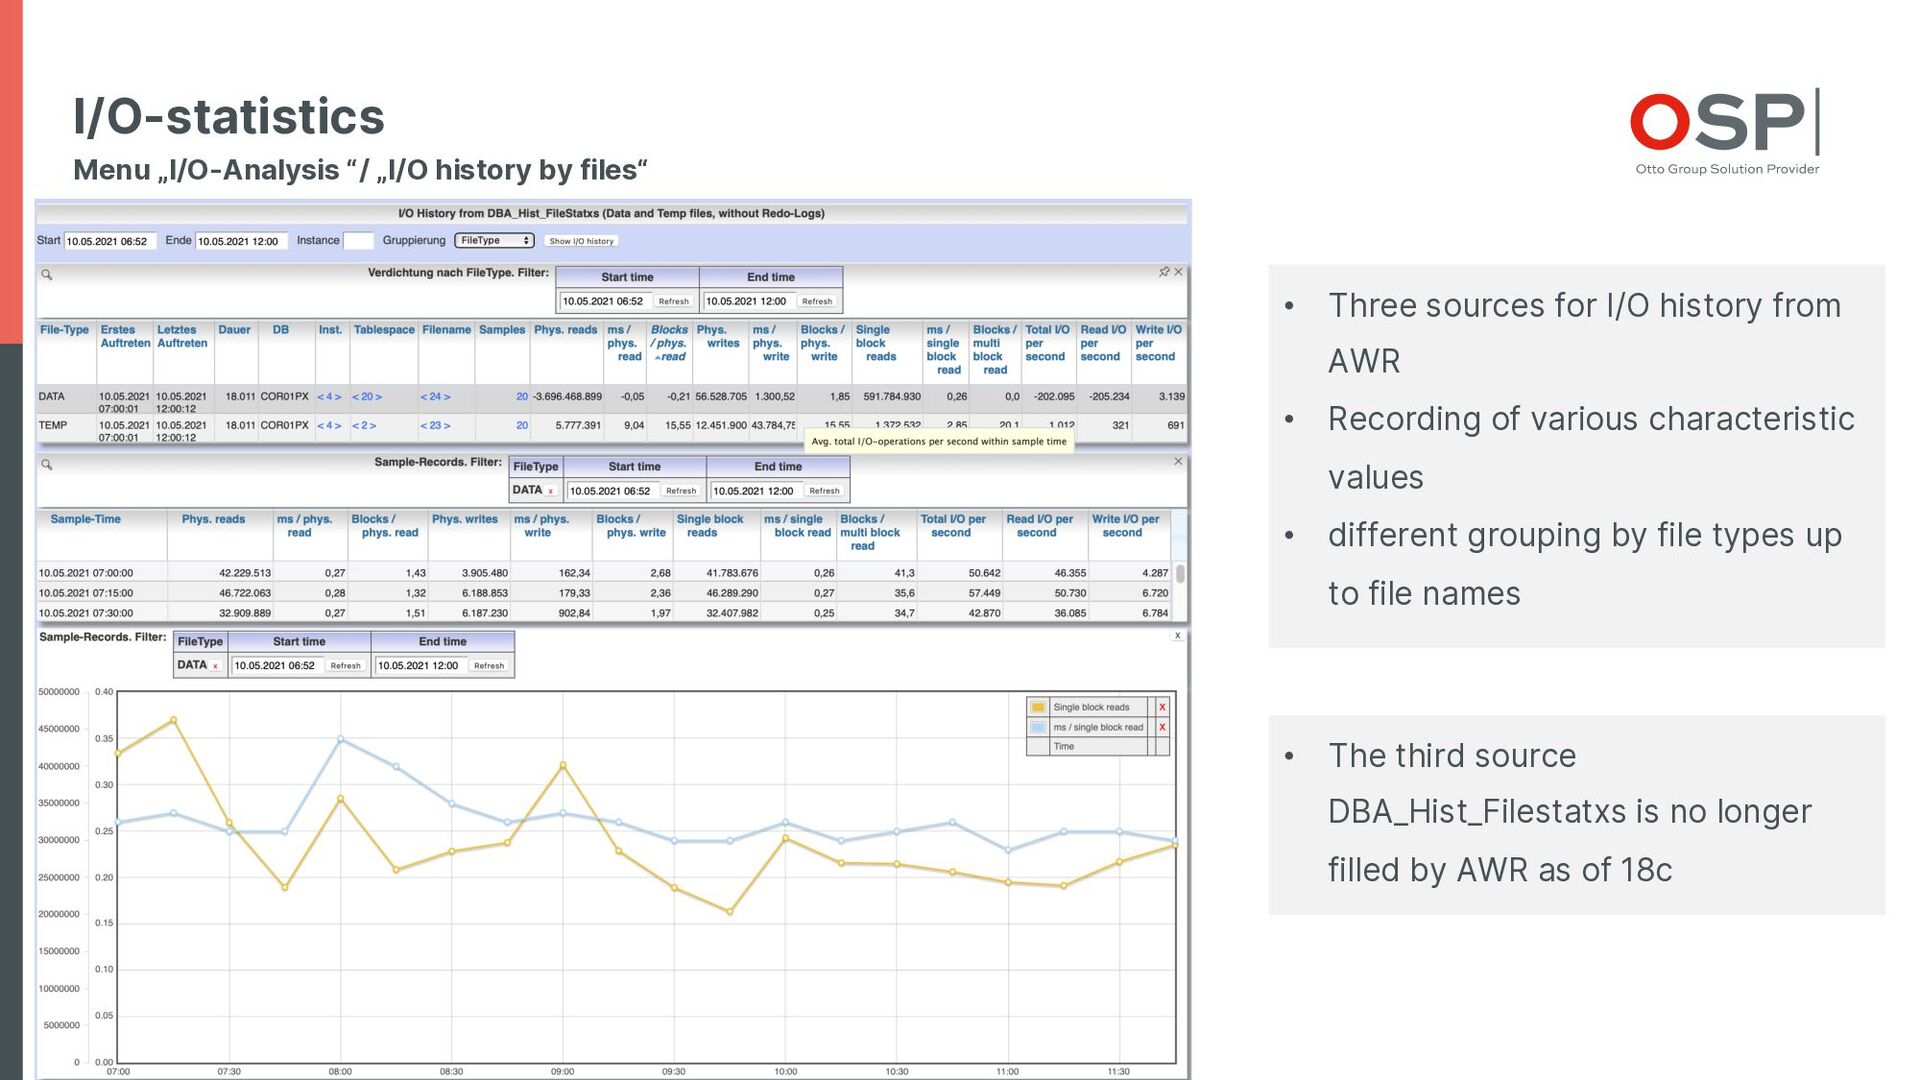
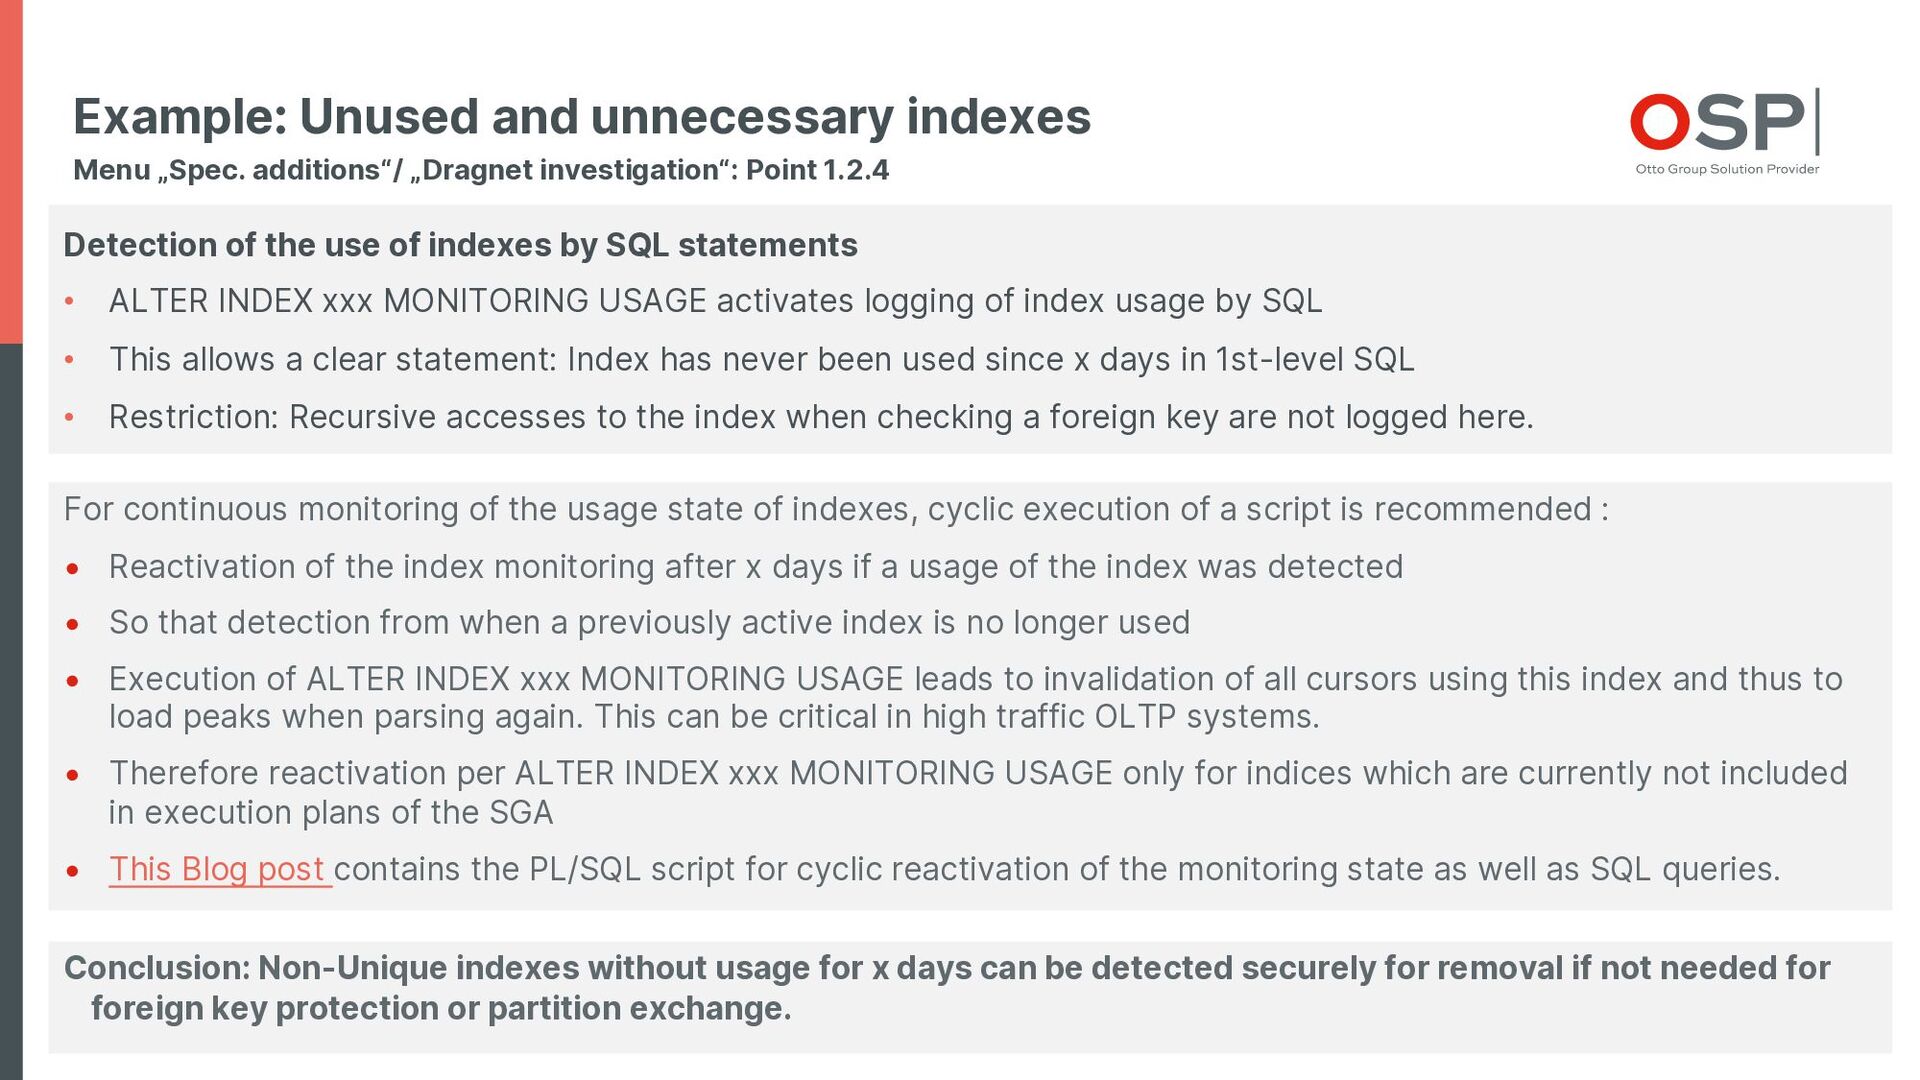
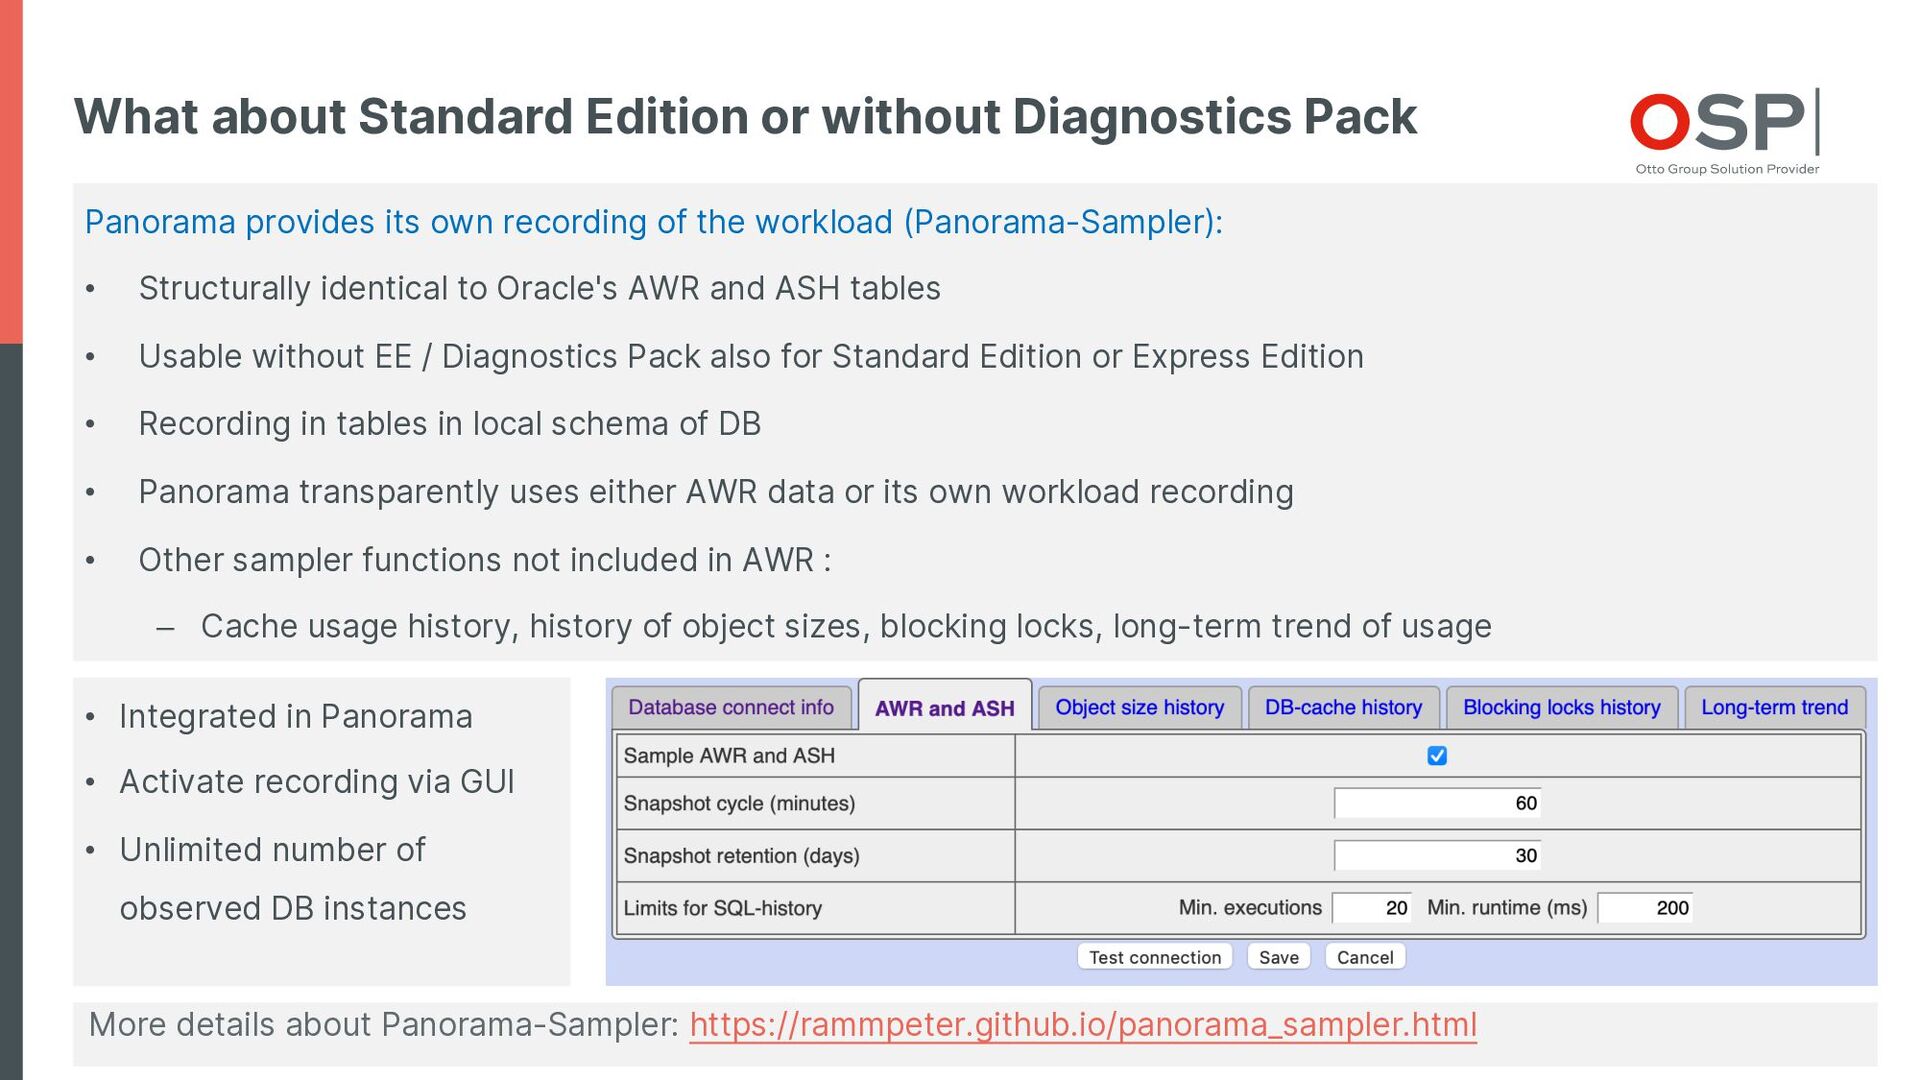
- Offline analysis with time distance to the problem under investigation, even if no historical data is recorded by the DB itself.
- Lowering the psychological barrier to actually get to the real root cause of problems in detail, based on direct measurements instead of weak assumptions.

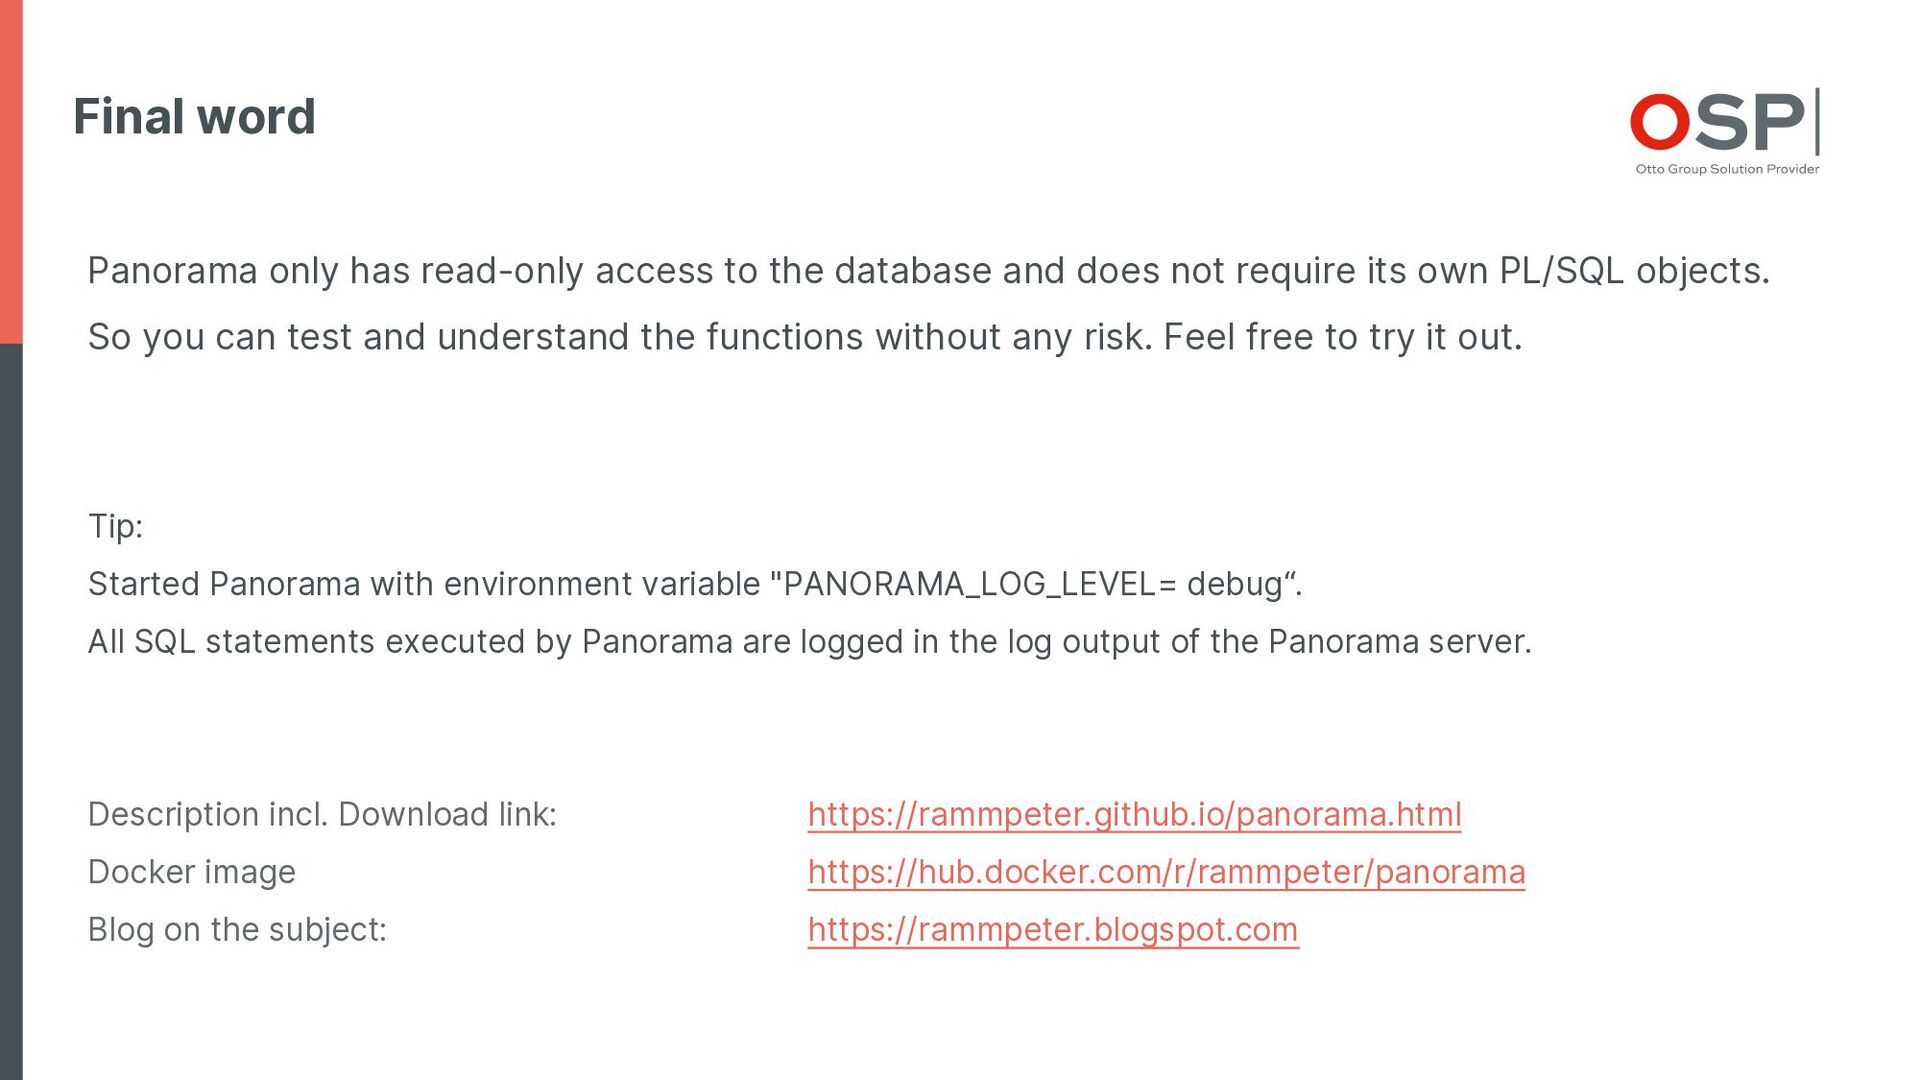
Find more about Panorama and it’s function range incl. download link at:
https://rammpeter.github.io/panorama.html

Peter Ramm

January 04, 2024
Tweet

More Decks by Peter Ramm

Other Decks in Technology

Transcript

  1. Otto Group Solution Provider GmbH (OSP) Founded: March 1991 Holding

    company: Otto Group Locations: Dresden, Hamburg, Altenkunstadt, Madrid, Valencia, Malaga, Taipei Number of employees: > 500 Managing director: Dr. Stefan Borsutzky, Norbert Gödicke
  2. About me Mail: [email protected] Peter Ramm Software architect / team

    lead at OSP in Dresden > 30 years of history in IT projects Main focus: • Development of OLTP systems based on Oracle databases • From architecture consulting up to trouble shooting • Performance optimization of existing systems
  3. Factors influencing performance in DB use Compute-Node: • CPU/Core number,

    CPU performance • capacity, latency and bandwith of memory DB instance: • Configuration • Redo, Undo, Temp I/O-System: • Throughput (MB/sec.) • Latency (ms/request) • Storage capacity Network: • Bandwith • Latency DB segments: • Tables • Indexes • Clusters • Partitions DB sessions: • Link between appl. and DB • Transactional behavior • Optimizer settings SQL statements: • Executed operations • Execution plans Application: • Process design • Data model • DB access • Transactions
  4. • Details about the used tool “Panorama” • Panorama-Sampler: built-in

    alternative to AWR and AWR without Diagnostics Pack • Top/down analysis of session activities • Segment statistics: Recording of characteristic values for objects (tables, indexes) • Capacity and utilization of CPU, memory and I/O system, instance configuration • Dragnet investigation: Systematic scan of the system for performance antipattern • Executed SQL statements with detail analysis Agenda
  5. • Details about the used tool “Panorama” • Panorama-Sampler: built-in

    alternative to AWR and AWR without Diagnostics Pack • Top/down analysis of session activities • Segment statistics: Recording of characteristic values for objects (tables, indexes) • Capacity and utilization of CPU, memory and I/O system, instance configuration • Dragnet investigation: Systematic scan of the system for performance antipattern • Executed SQL statements with detail analysis Agenda
  6. Panorama for Oracle Databases Free available tool for performance analysis

    of Oracle DB Based on AWR data or Panorama‘s own sampling (also with Standard Edition or without Diagnostics Pack) Description of Panorama incl. download link : https://rammpeter.github.io/panorama.html Oracle performance analysis blog : https://rammpeter.blogspot.com Various slides on the use of Panorama : https://www.slideshare.net/PeterRamm1 Docker image or self-starting jar file Panorama accesses your DB on a read-only basis and does not install any PL/SQL objects of its own. So you can test the functions without any risk. Except if you‘re using Panorama-Sampler.
  7. Panorama for Oracle: Motivation Focus on: • Preparation of complex

    internals of DB without deep insider knowledge • Support of an analysis workflow by linking the individual steps on web GUI as an alternative to loving collection of individual SQL scripts • Drilldown in root cause identification starting from concrete problem points • Offline analysis with time distance to the problem under investigation • Lowering the barriers to actually getting to the bottom of problems in detail Differentiation from other established monitoring tools : • Panorama does not claim to cover all facets of monitoring and visualization of Oracle DB internals • Functions usually found inclusion in Panorama when they are: – not or only insufficiently offered by the established tools – Existing tools are not accessible for normal users (e.g. because of costs) • A useful application is not instead of, but in combination with e.g. EM Cloud Control etc.
  8. Panorama for Oracle: Form of presentation Visualization in graphs via

    context menu (right mouse button) Time-related values can generally also be displayed as graphs by showing/hiding columns of the tables Results usually as tables Workflow in browser page continuously downwards Environment variable PANORAMA_LOG_LEVEL=debug shows executed SQLs on console
  9. • Details about the used tool “Panorama” • Panorama-Sampler: built-in

    alternative to AWR and AWR without Diagnostics Pack • Top/down analysis of session activities • Segment statistics: Recording of characteristic values for objects (tables, indexes) • Capacity and utilization of CPU, memory and I/O system, instance configuration • Dragnet investigation: Systematic scan of the system for performance antipattern • Executed SQL statements with detail analysis Agenda
  10. Sessions currently connected to DB Menu „DBA general“ / „Sessions“

    Listing of DB sessions with optional filter and drilldown into session and SQL details Filter and sort sessions by several criterias
  11. Retrospective analysis of DB workload • Evaluating and analyzing the

    workload of interest of a DB is rarely possible live • Usually an escalation occurs more or less delayed to the triggering event • The past cannot be inferred from the current load situation of a DB Oracle's builtin solution: "Active Workload Repository" (AWR) and "Active Session History" (ASH) • Historization of various operating states out of the box • AWR: recording at hourly intervals with retention for 7 days (customizable) • ASH: Recording of active sessions every second with condensation to 10 seconds • Available only for Enterprise Edition with additional licensing of the "Oracle Diagnostics Pack“ • Caution: AWR-views are also accessible without license but access means license violation • Some information about executed SQLs can be found out from the SGA (v$SQL ...) as well as e.g. via StatsPack
  12. Why leave traces for analysis Extremely helpful for retrospective analysis

    is the tagging of DB sessions with business context information about the process at the beginning of a transaction. Setting the context info is done by executing the PL/SQL function : DBMS_Application_Info.Set_Module(<Module>, <Action>) The escalation of technical problems usually takes place with a certain latency. Standard query: Process XY ran last night 3 x as long as usual! Why? Example: The application works with Java JEE application server and session pooling: • For each transaction, a DB session is again randomly fetched from the pool • With regard to the OLTP character of the system, transactions are very short • A process scales in parallel using a variable number of DB sessions How should the traces in the database history be assigned to the business process here? This info is recorded with in various tracks of the DB and allows later the assignment of the DB activities to the triggering process via module and action.
  13. Active Session History Menu „Analyses/statistics“ / „Session waits“ / „Historic“

    • Introduced with Oracle 10g, strongly extended in 11g, still somewhat in 12c, 19c ++ • Historization of the data of all active sessions of the DB from V$Session ++ • Storage per second in SGA memory, query via view V$Active_Session_History • Persistence of every 10th second in the cycle of AWR snapshots in AWR table, query via view DBA_Hist_Active_Sess_History • Stored in AWR table analogous to other AWR data, default 7 days • This database can be used to reconstruct the operating conditions of the DB very precisely, even after a long period of time. Usage requires Enterprise Edition plus licensing of 'Diagnostics Pack' option • For me the biggest step in the analysis functions of the Oracle DB
  14. Active Session History Menu „Analyses/statistics“ / „Session waits“ / „Historic“

    • Select period and entry grouping • Successive drilldown according to various criteria • „< xxx>“shows number of different values of the category column in current selection • Click on „< xxx>“groups the values of the current row according to this category in another table • Drill down to individual ASH sample records
  15. Menu „DBA general“ / „ Dashboard“ • Real-time monitoring of

    active sessions grouped by several criterias (like „wait class“ in picture) • Automatic refresh in desired cycle • Top SQLs and Top sessions for choosen period • Drilldown by wait class (click in legend), session or SQL ASH: Real-time dashboard
  16. ASH: Retrospective analysis of blocking locks Menu „DBA general“ /

    „DB-Locks“ / „Blocking locks historic from ASH“ • Shows one line per blocking cascade triggering session (root blocker) • Sorted by waiting time of all directly or indirectly blocked sessions • Drilldown in: – Blocked sessions – ASH of blocking session – ASH of blocked sessions – Blocking objekt down to the primary key value of the record
  17. ASH: Retrospective analysis of TEMP usage Menu „Schema“ / „Storage“

    / „TEMP usage“ / „Historic from ASH“ Detection of the users of TEMP tablespace including the cause of a possible “ORA-01652 unable to extend temp segment“ • Display of TEMP usage over time in diagram • Determine the relevant point in time • Change to ASH analysis to determine specific sessions by TEMP consumption at that time See also: Blog post on the topic
  18. • Details about the used tool “Panorama” • Panorama-Sampler: built-in

    alternative to AWR and AWR without Diagnostics Pack • Top/down analysis of session activities • Segment statistics: Recording of characteristic values for objects (tables, indexes) • Capacity and utilization of CPU, memory and I/O system, instance configuration • Dragnet investigation: Systematic scan of the system for performance antipattern • Executed SQL statements with detail analysis Agenda
  19. SQL history Menu „SGA/PGA details“ / „ SQL-Area“ / ..

    Evaluation of the SQLs currently in SGA as well as the history from AWR Listing of SQLs sorted by various criterias Details per SQL incl. • Execution plan • Bind variables • Child cursors • Full history of all AWR snapshots of SQL • Reasons for multiple cursors • SQL monitor recordings • Create baseline / SQL patch
  20. SQL statement details: Plan stability Menu „SGA/PGA Details“ / „SQL

    plan management“ Existence per SQL shown and as global overview : • SQL-Profiles • SQL Plan Baselines • Stored Outlines • SQL-Translations • SQL-Patches For executed SQLs Panorama can generate PL/SQL snippets for creation of directives : • SQL plan baselines: Pinning based on already existing plans via plan hash value • SQL patches: Injecting optimizer hints into unmodified SQL statements • SQL translations: Complete replacement of SQL text for statements unchanged in application
  21. • Details about the used tool “Panorama” • Panorama-Sampler: built-in

    alternative to AWR and AWR without Diagnostics Pack • Top/down analysis of session activities • Segment statistics: Recording of characteristic values for objects (tables, indexes) • Capacity and utilization of CPU, memory and I/O system, instance configuration • Dragnet investigation: Systematic scan of the system for performance antipattern • Executed SQL statements with detail analysis Agenda
  22. Structure info for tables, indexes, packages etc. Menu „Schema/Storage“ /

    „ Describe object“ Detailed info on DB objects with drilldown into structures, accesses, dependencies, etc.
  23. Storage usage overview Menu „Schema/Storage“ / „ Disc storage summary“

    • Storage usage by types, schemas, tablespaces • Drill down to objects and partitions • Calculation of the space to be released by reorganization • Representation of the real available storage under consideration of fragmentation
  24. Segment statistics Menu „Analyses / statistics“ / „Segment statistics“ /

    „Historic“ Characteristic values per table/index for period Evolution over time within the period Sortable according to individual characteristic values
  25. • Details about the used tool “Panorama” • Panorama-Sampler: built-in

    alternative to AWR and AWR without Diagnostics Pack • Top/down analysis of session activities • Segment statistics: Recording of characteristic values for objects (tables, indexes) • Capacity and utilization of CPU, memory and I/O system, instance configuration • Dragnet investigation: Systematic scan of the system for performance antipattern • Executed SQL statements with detail analysis Agenda
  26. OS statistics for CPU and memory Menu „Analyses / statistics“

    / „OS statistics“ / „Historic“ • Number of CPUs/Cores • Total CPU load of the machine • Total physical memory • Available physical memory • Available swap space • History in resolution of the AWR cycle
  27. I/O-statistics Menu „I/O-Analysis “/ „I/O history by files“ • Three

    sources for I/O history from AWR • Recording of various characteristic values • different grouping by file types up to file names • The third source DBA_Hist_Filestatxs is no longer filled by AWR as of 18c
  28. Memory configuration Menu „SGA/PGA details“/ „ SGA memory“ / „SGA

    components“ This view shows : • Dynamic allocation of physical memory to components • Control of the distribution through manual specifications of minimum sizes Optimization target is usually use of SGA memory for DB cache or inMemory store
  29. Usage of DB cache by objects Menu „SGA/PGA details“/ „DB-Ccache“

    / „DB-Cache usage current“ Use of DB cache by tables and indexes. • Ensure that the DB cache is really used for business- relevant objects • Detect suboptimal SQLs that bring objects with low business relevance to the top of the LRU list
  30. History of DB cache by objects Menu „SGA/PGA details“/ „DB-Ccache“

    / „DB-Cache usage hstoric“ Use of DB cache by tables and indexes in a period of the past. • Data source is the Panorama-Sampler, not AWR • Time curve of DB cache usage per object
  31. Forcast when changing the DB cache size Menu „SGA/PGA details“/

    „DB-Ccache“ / „DB-Cache advice“ Predicting the change in the number of I/O read requests when increasing/decreasing the DB cache at specific times. • 1 = values for current Cache-Size • 0.1 = Prediction for reducing cache to 10% • 1.8 = Prediction for increasing cache by 80%
  32. Redo log configuration: Actural state Menu „DBA general“/ „Redologs“ /

    „Current“ Problem points : • With only 3 redo log groups, there is a latent danger of "cannot switch redo log file" after the current log file has been written to full by the logwriter process. Until a free redo log file is available again, all commit operations are stopped. (Worst case for OLTP systems) • 200 MB default size can be much too small (Optimization target > 10 seconds between log switches) This picture shows the default configuration after installing an Oracle DB. Unfortunately, this is also often the case in production systems..
  33. Redo log utilization in history Menu „DBA general“/ „Redologs“ /

    „Historic“ Evaluation of the utilization of the redo logs in the AWR cycle. • Current + Active should normally never reach the number of available redo log groups • Cross check also via alert.log with search for "cannot allocate new log" to detect possible problems within the AWR cycles • This blog post describes the problem in detail
  34. • Details about the used tool “Panorama” • Panorama-Sampler: built-in

    alternative to AWR and AWR without Diagnostics Pack • Top/down analysis of session activities • Segment statistics: Recording of characteristic values for objects (tables, indexes) • Capacity and utilization of CPU, memory and I/O system, instance configuration • Dragnet investigation: Systematic scan of the system for performance antipattern • Executed SQL statements with detail analysis Agenda
  35. Dragnet investigation for performance antipattern Menu „Spec. additions“/ „Dragnet investigation“

    Performance optimization: reactive event-driven or preventive? Motivation • Detection of all further occurrences of a once analyzed problem in the system • Solutions as simple as possible to implement without interfering with architecture and design • Fixing identified easy-to-solve issues system-wide instead of step-by-step after escalation • Convenient embedding in further analysis workflow Extensible with custom queries, further details in this blog post
  36. Example: Unused and unnecessary indexes Menu „Spec. additions“/ „Dragnet investigation“:

    Point 1.2.4 Detection of the use of indexes by SQL statements • ALTER INDEX xxx MONITORING USAGE activates logging of index usage by SQL • This allows a clear statement: Index has never been used since x days in 1st-level SQL • Restriction: Recursive accesses to the index when checking a foreign key are not logged here. For continuous monitoring of the usage state of indexes, cyclic execution of a script is recommended : • Reactivation of the index monitoring after x days if a usage of the index was detected • So that detection from when a previously active index is no longer used • Execution of ALTER INDEX xxx MONITORING USAGE leads to invalidation of all cursors using this index and thus to load peaks when parsing again. This can be critical in high traffic OLTP systems. • Therefore reactivation per ALTER INDEX xxx MONITORING USAGE only for indices which are currently not included in execution plans of the SGA • This Blog post contains the PL/SQL script for cyclic reactivation of the monitoring state as well as SQL queries. Conclusion: Non-Unique indexes without usage for x days can be detected securely for removal if not needed for foreign key protection or partition exchange.
  37. • Details about the used tool “Panorama” • Panorama-Sampler: built-in

    alternative to AWR and AWR without Diagnostics Pack • Top/down analysis of session activities • Segment statistics: Recording of characteristic values for objects (tables, indexes) • Capacity and utilization of CPU, memory and I/O system, instance configuration • Dragnet investigation: Systematic scan of the system for performance antipattern • Executed SQL statements with detail analysis Agenda
  38. What about Standard Edition or without Diagnostics Pack Panorama provides

    its own recording of the workload (Panorama-Sampler): • Structurally identical to Oracle's AWR and ASH tables • Usable without EE / Diagnostics Pack also for Standard Edition or Express Edition • Recording in tables in local schema of DB • Panorama transparently uses either AWR data or its own workload recording • Other sampler functions not included in AWR : – Cache usage history, history of object sizes, blocking locks, long-term trend of usage • Integrated in Panorama • Activate recording via GUI • Unlimited number of observed DB instances More details about Panorama-Sampler: https://rammpeter.github.io/panorama_sampler.html
  39. Functions covered by Panorama-Sampler gv$Active_Session_History DBA_Hist_Active_Sess_History DBA_Hist_Cache_Advice DBA_Hist_Datafile DBA_Hist_Enqueue_Stat DBA_Hist_FileStatXS

    DBA_Hist_IOStat_Detail DBA_Hist_IOStat_Filetype DBA_Hist_Log DBA_Hist_Memory_Resize_Ops DBA_Hist_OSStat For the following AWR views with history recording there is an equivalent in the Panorama-Sampler : DBA_Hist_OSStat_Name DBA_Hist_Parameter DBA_Hist_PGAStat DBA_Hist_Process_Mem_Summary DBA_Hist_Resource_Limit DBA_Hist_Seg_Stat DBA_Hist_Service_Name DBA_Hist_Snapshot DBA_Hist_SQL_Bind DBA_Hist_SQL_Plan DBA_Hist_SQLStat DBA_Hist_SQLText DBA_Hist_StatName DBA_Hist_Sysmetric_History DBA_Hist_Sysmetric_Summary DBA_Hist_System_Event DBA_Hist_SysStat DBA_Hist_Tablespace DBA_Hist_Tempfile DBA_Hist_TempStatXS DBA_Hist_TopLevelCall_Name DBA_Hist_UndoStat DBA_Hist_WR_Control
  40. Final word Panorama only has read-only access to the database

    and does not require its own PL/SQL objects. So you can test and understand the functions without any risk. Feel free to try it out. Tip: Started Panorama with environment variable "PANORAMA_LOG_LEVEL= debug“. All SQL statements executed by Panorama are logged in the log output of the Panorama server. Description incl. Download link: https://rammpeter.github.io/panorama.html Docker image https://hub.docker.com/r/rammpeter/panorama Blog on the subject: https://rammpeter.blogspot.com
  41. Thank you for your interest Otto Group Solution Provider (OSP)

    Dresden GmbH Freiberger Str. 35 | 01067 Dresden T +49 (0)351 49723 0 | F +49 (0)351 49723 119 osp.de