Upgrade to Pro — share decks privately, control downloads, hide ads and more …

Predicting and Preventing Injury in Major Leagu...

Sponsored · Your Podcast. Everywhere. Effortlessly. Share. Educate. Inspire. Entertain. You do you. We'll handle the rest. →

Predicting and Preventing Injury in Major League Baseball

An analytical study of baseball analysis trends

Avatar for Renuka Kelapure

Renuka Kelapure

January 14, 2018

More Decks by Renuka Kelapure

Other Decks in Technology

Transcript

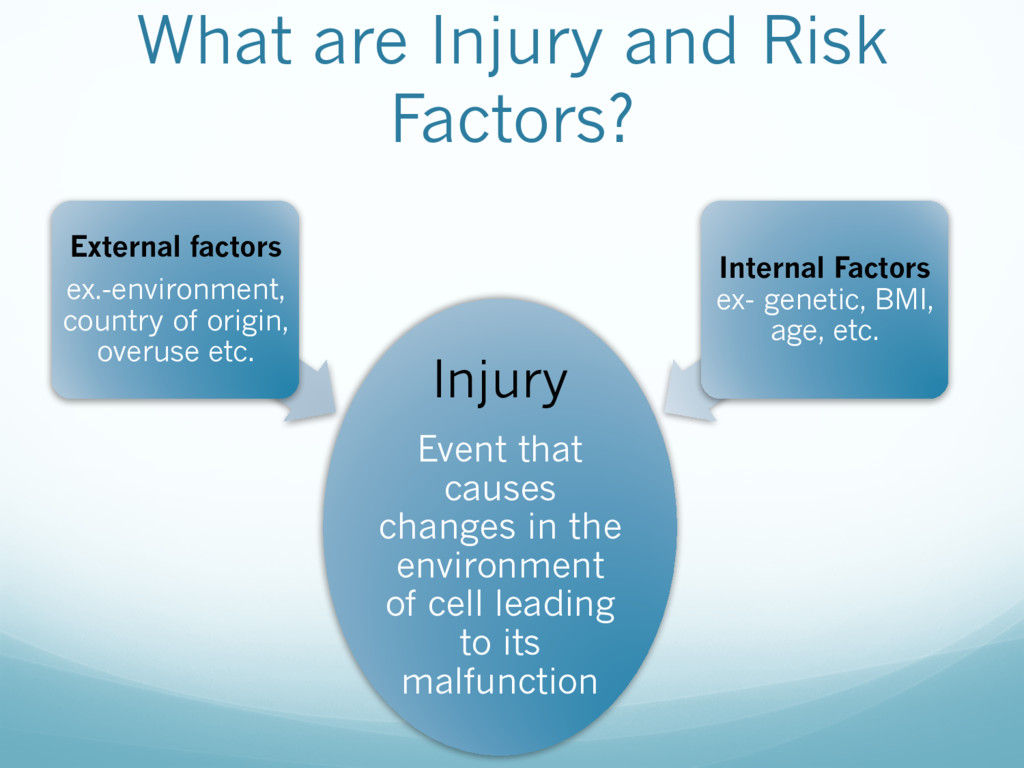
  1. What are Injury and Risk Factors? Injury Event that causes

    changes in the environment of cell leading to its malfunction External factors ex.-environment, country of origin, overuse etc. Internal Factors ex- genetic, BMI, age, etc.
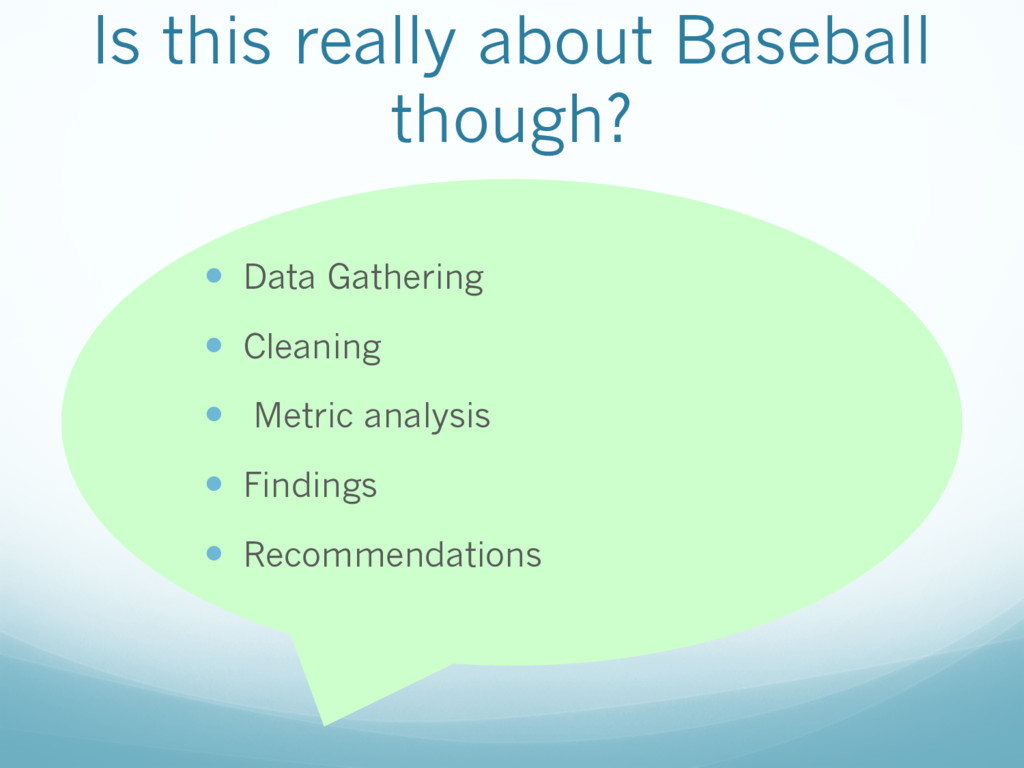
  2. Is this really about Baseball though? — Data Gathering —

    Cleaning — Metric analysis — Findings — Recommendations
  3. Data Cleaning and Formatting Literally needed these many tools and

    4-5 iterations to clean this data!!! No more Mess Plz!
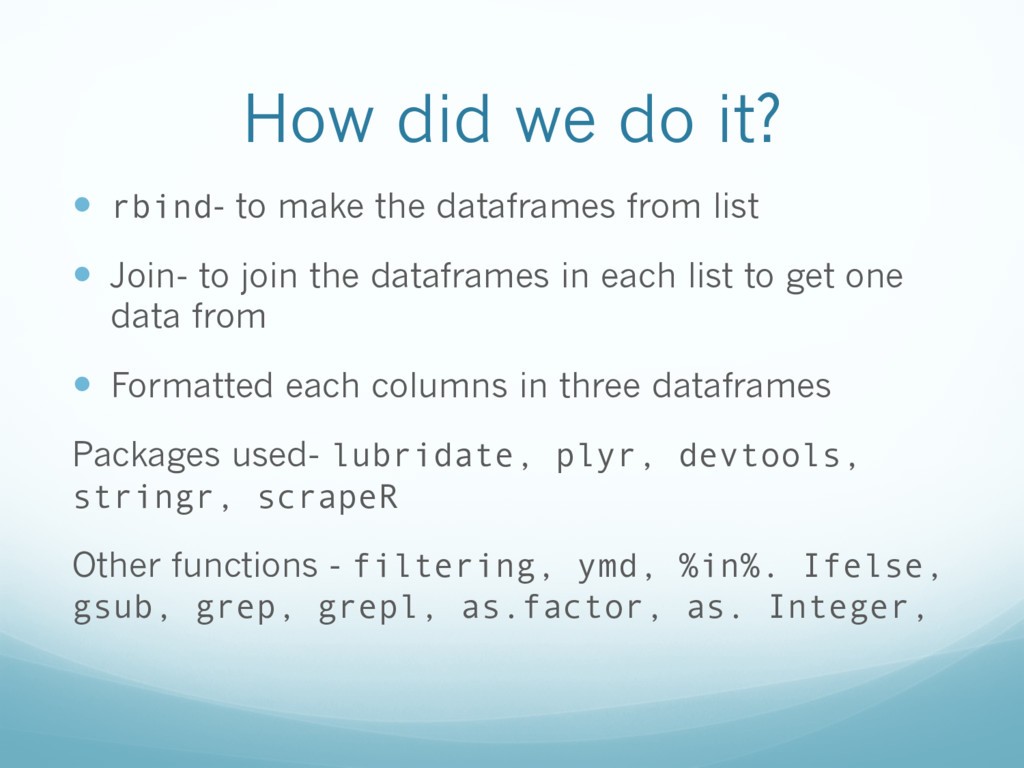
  4. How did we do it? — rbind- to make the

    dataframes from list — Join- to join the dataframes in each list to get one data from — Formatted each columns in three dataframes Packages used- lubridate, plyr, devtools, stringr, scrapeR Other functions - filtering, ymd, %in%. Ifelse, gsub, grep, grepl, as.factor, as. Integer,
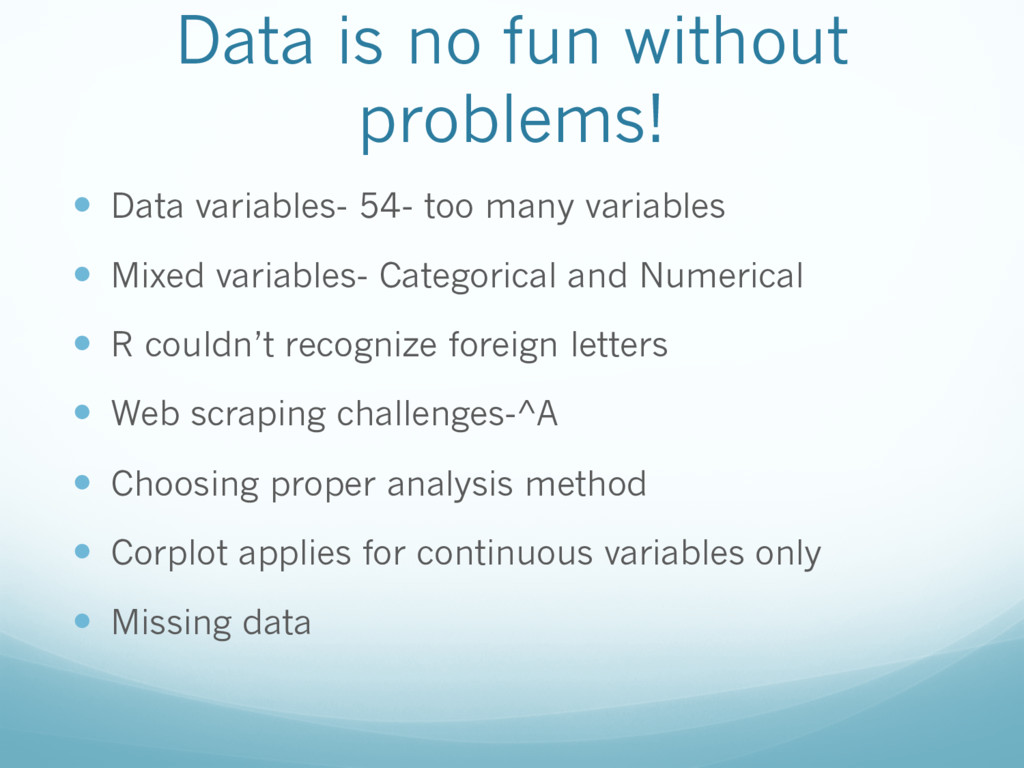
  5. Data is no fun without problems! — Data variables- 54-

    too many variables — Mixed variables- Categorical and Numerical — R couldn’t recognize foreign letters — Web scraping challenges-^A — Choosing proper analysis method — Corplot applies for continuous variables only — Missing data
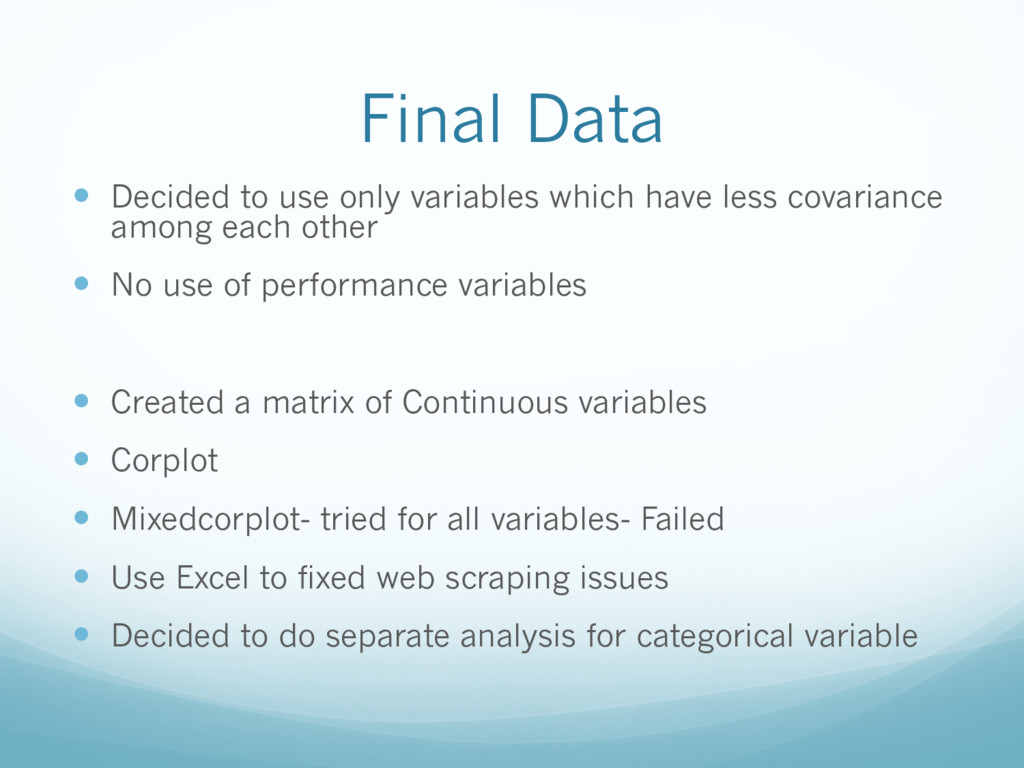
  6. Final Data — Decided to use only variables which have

    less covariance among each other — No use of performance variables — Created a matrix of Continuous variables — Corplot — Mixedcorplot- tried for all variables- Failed — Use Excel to fixed web scraping issues — Decided to do separate analysis for categorical variable
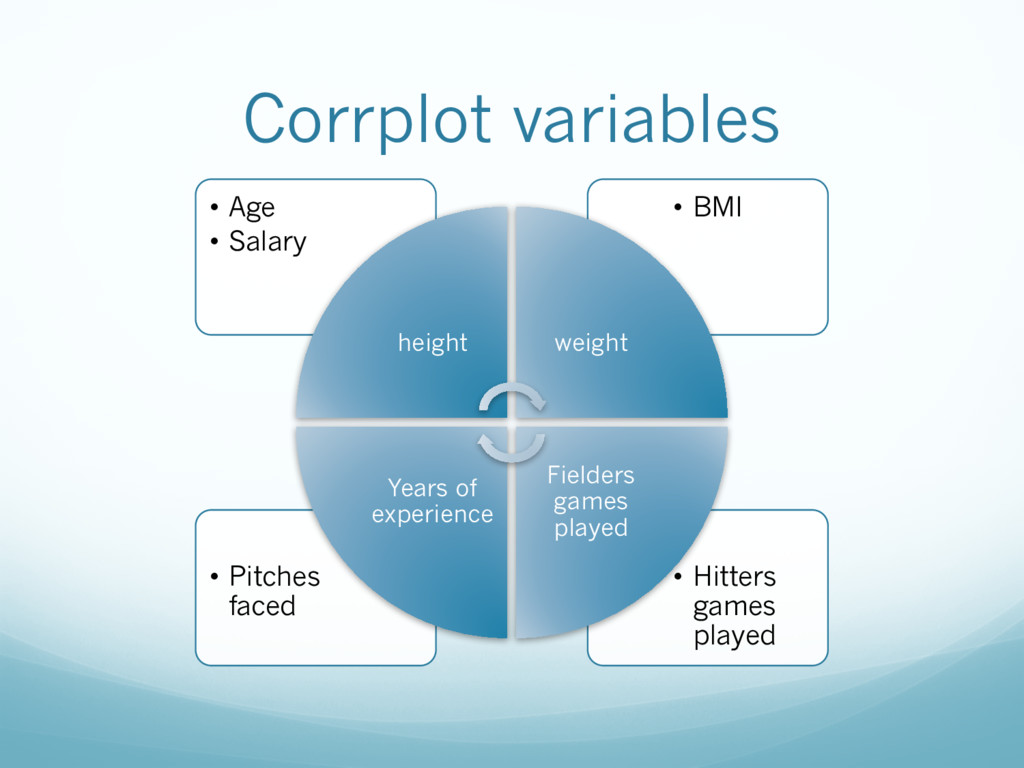
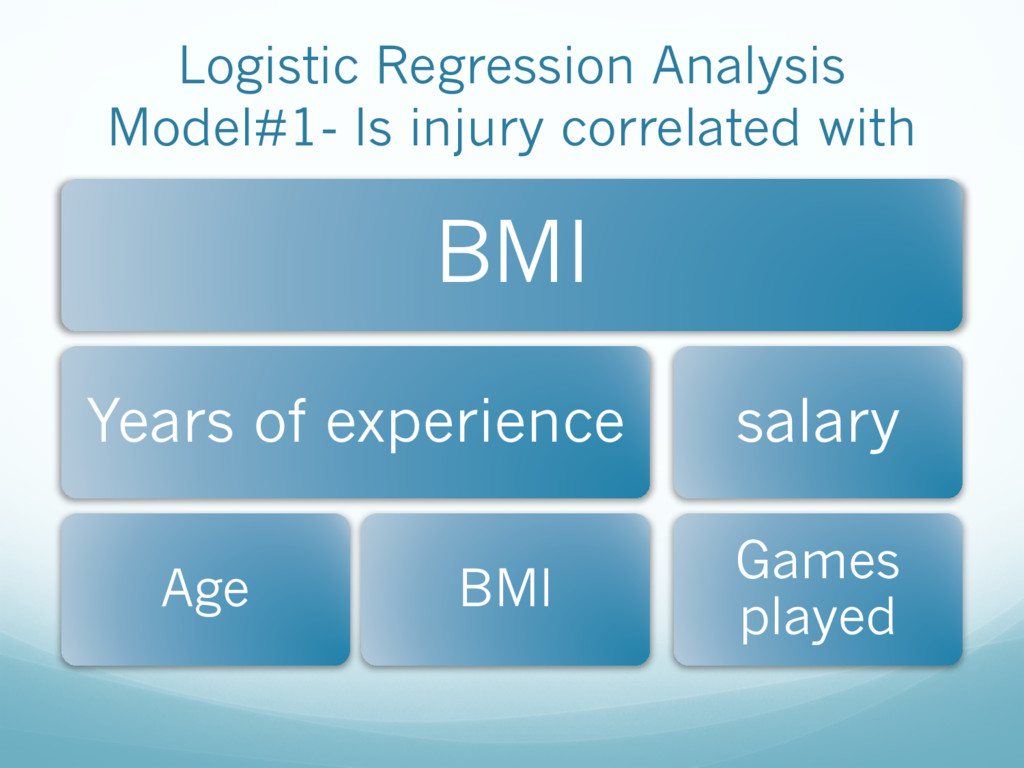
  7. Corrplot variables • Hitters games played • Pitches faced •

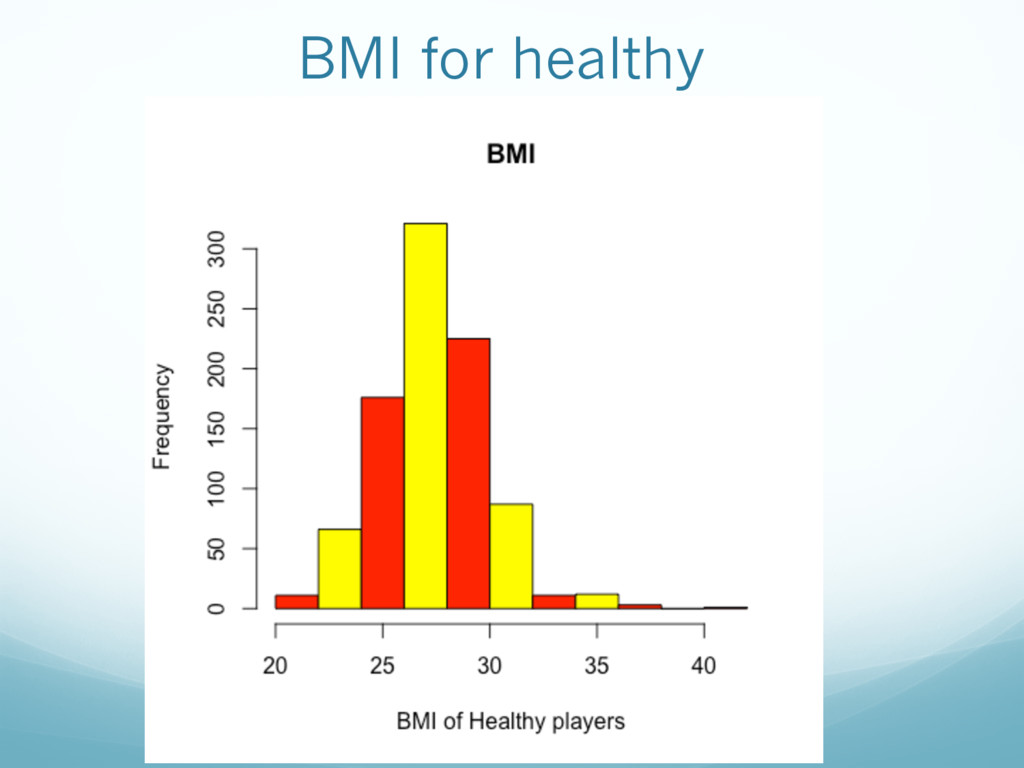
    BMI • Age • Salary height weight Fielders games played Years of experience
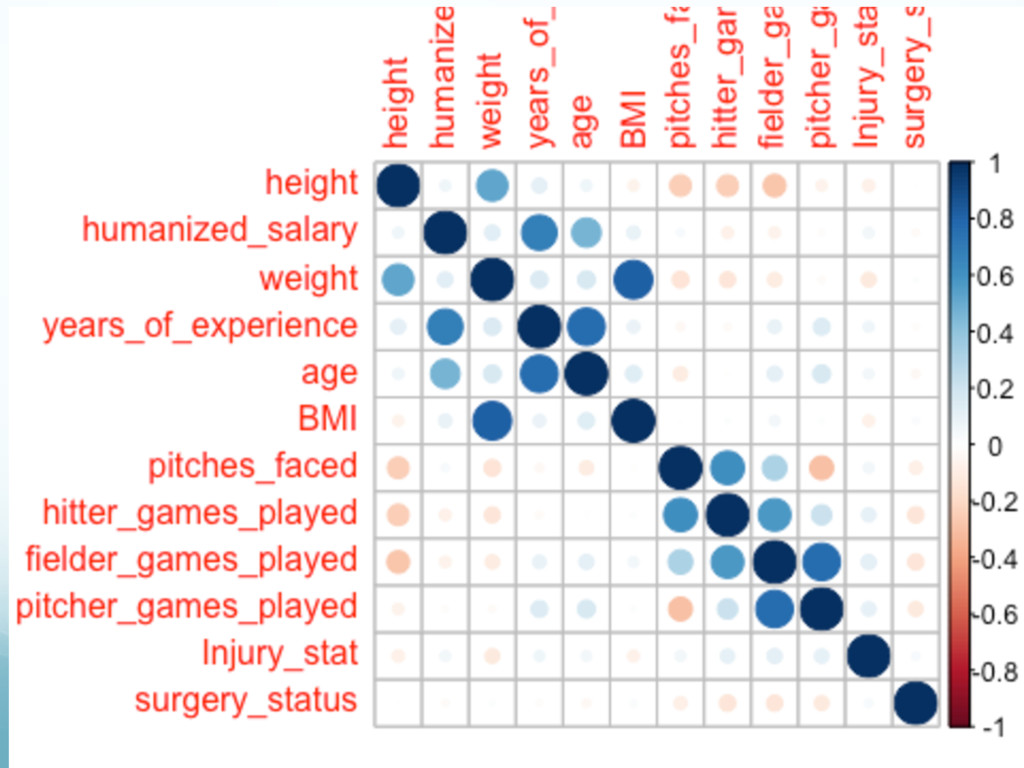
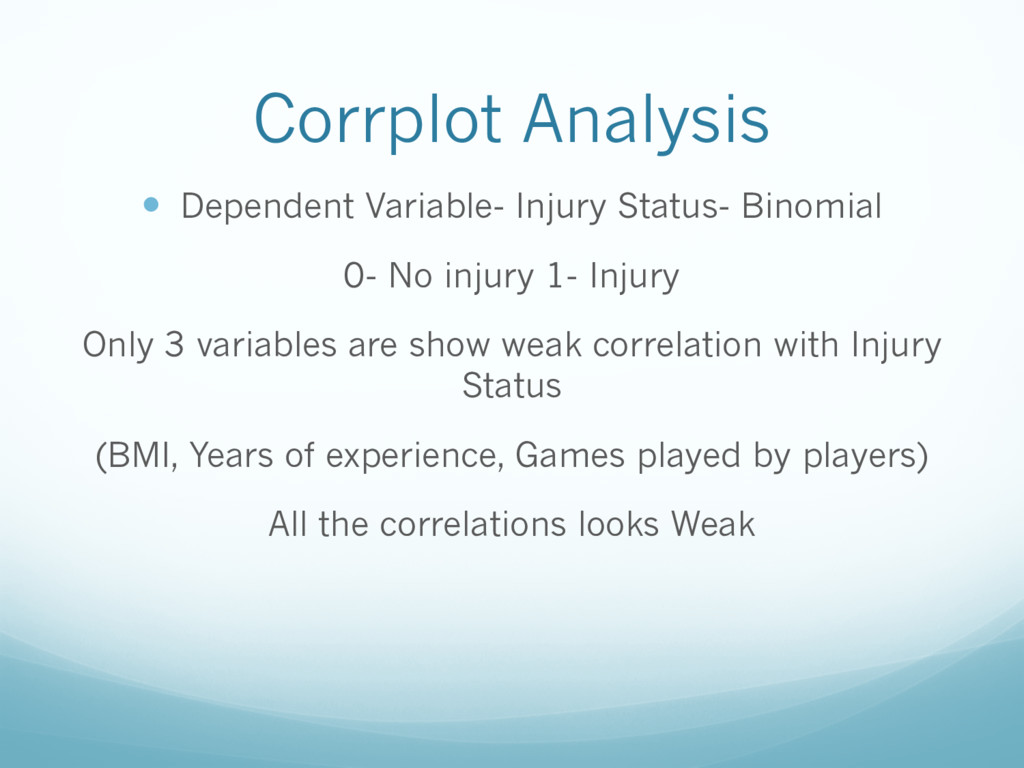
  8. Corrplot Analysis — Dependent Variable- Injury Status- Binomial 0- No

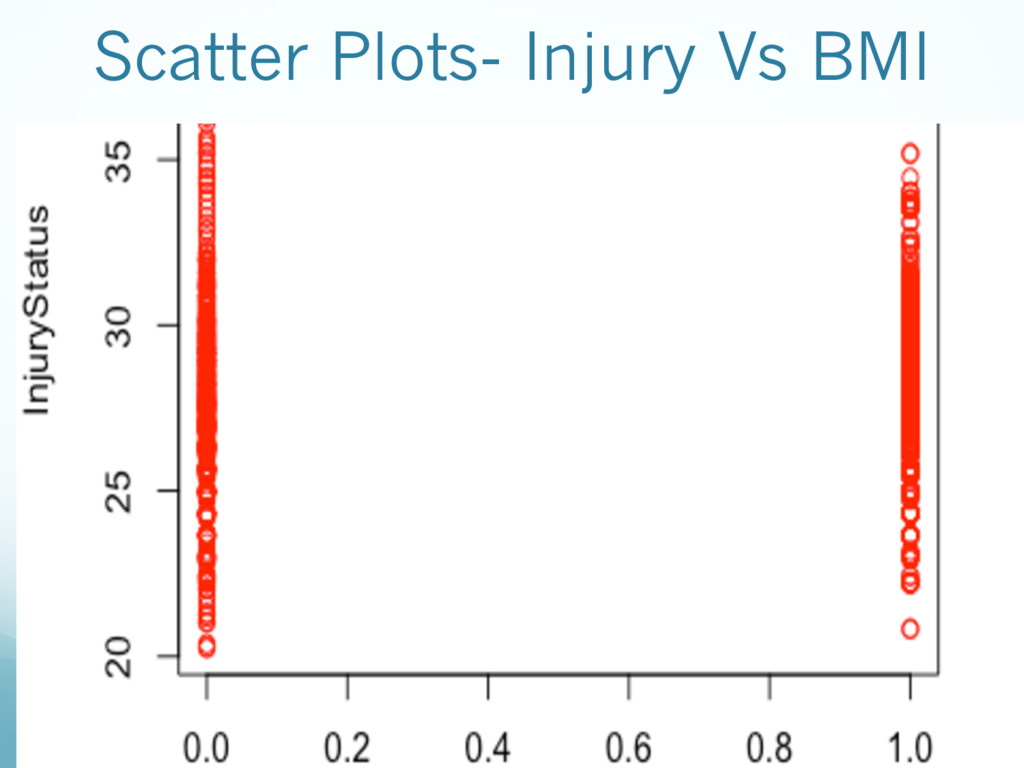
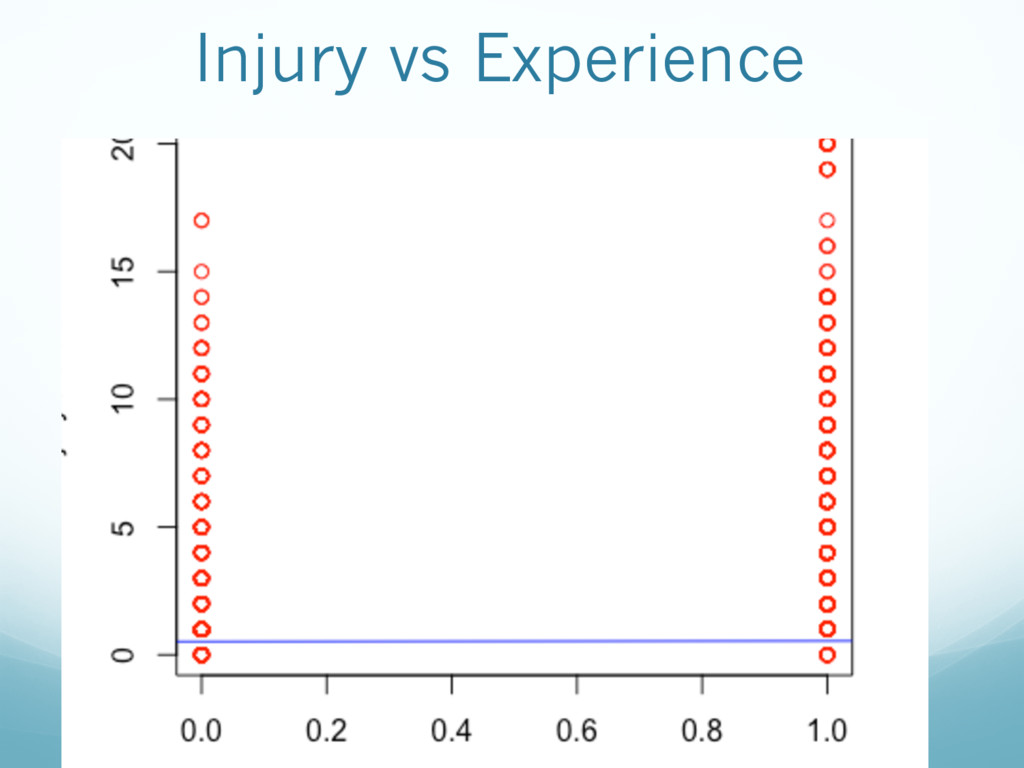
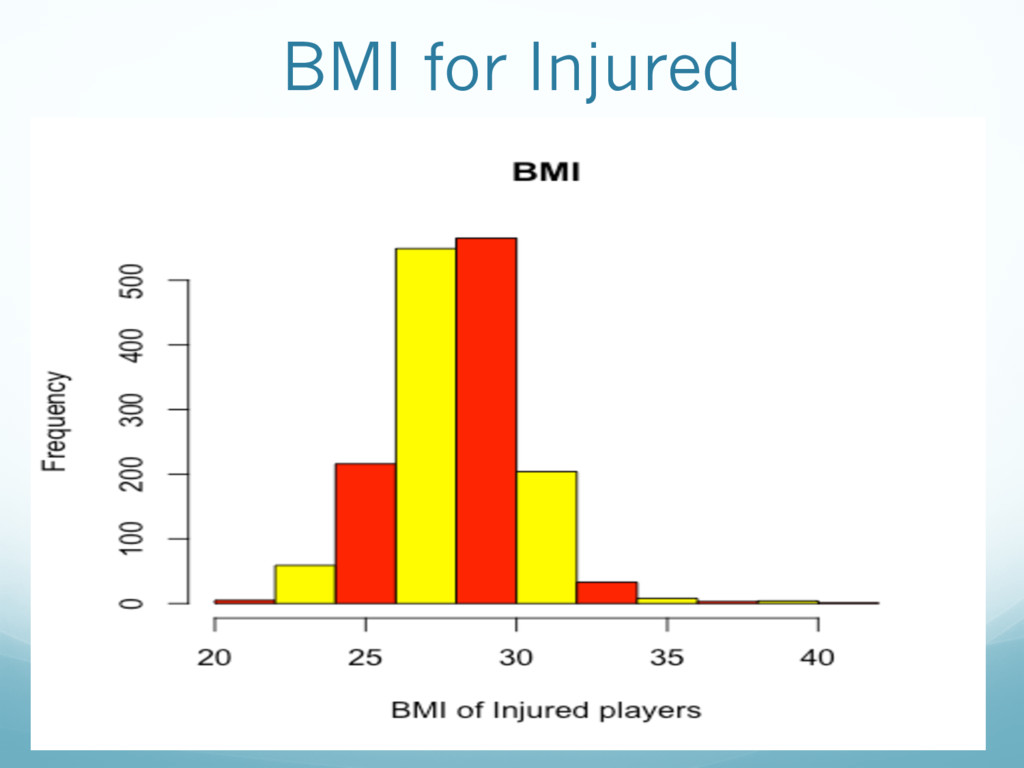
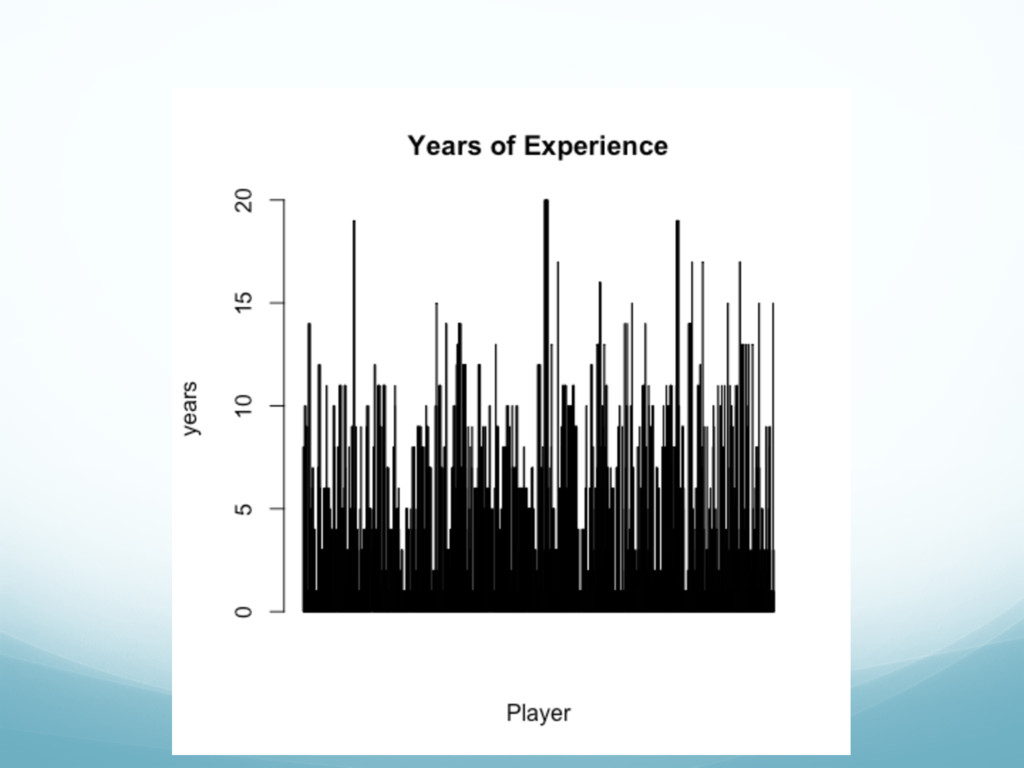
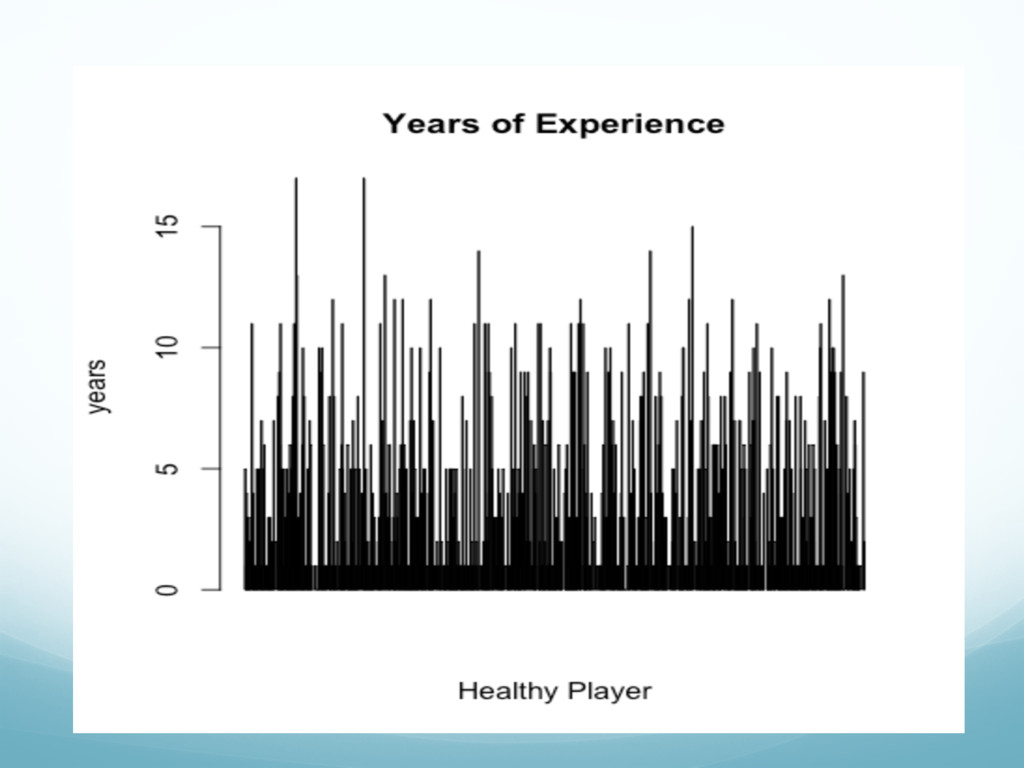
    injury 1- Injury Only 3 variables are show weak correlation with Injury Status (BMI, Years of experience, Games played by players) All the correlations looks Weak
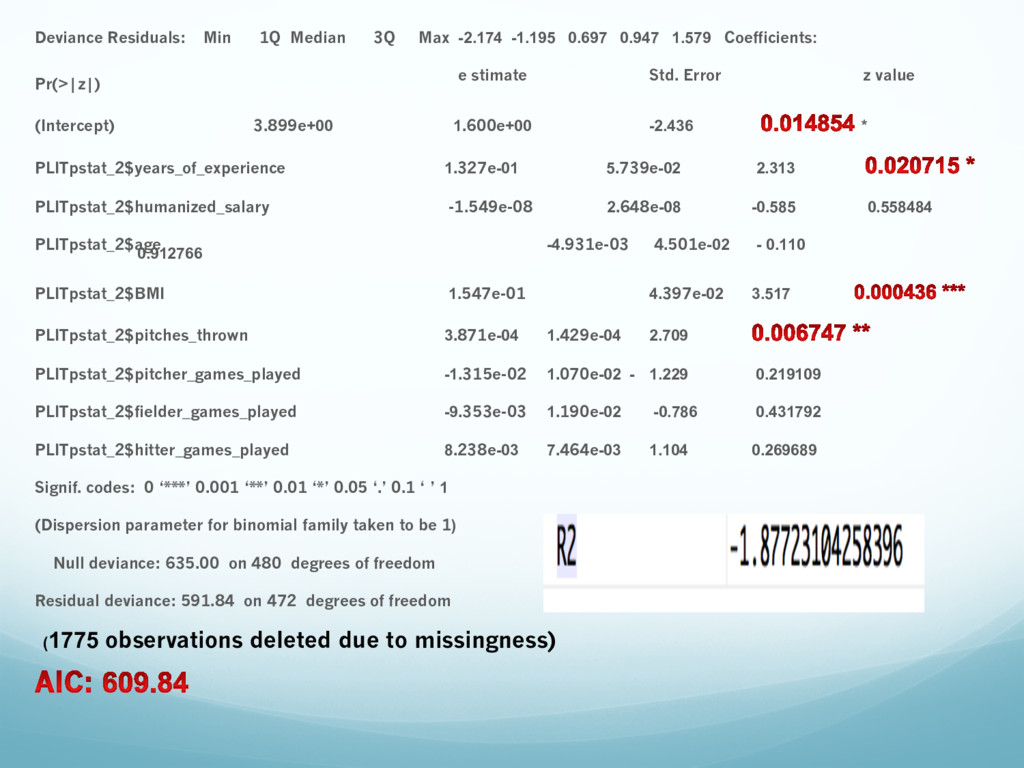
  9. Deviance Residuals: Min 1Q Median 3Q Max -2.174 -1.195 0.697

    0.947 1.579 Coefficients: e stimate Std. Error z value Pr(>|z|) (Intercept) 3.899e+00 1.600e+00 -2.436 * PLITpstat_2$years_of_experience 1.327e-01 5.739e-02 2.313 PLITpstat_2$humanized_salary -1.549e-08 2.648e-08 -0.585 0.558484 PLITpstat_2$age -4.931e-03 4.501e-02 - 0.110 0.912766 PLITpstat_2$BMI 1.547e-01 4.397e-02 3.517 PLITpstat_2$pitches_thrown 3.871e-04 1.429e-04 2.709 PLITpstat_2$pitcher_games_played -1.315e-02 1.070e-02 - 1.229 0.219109 PLITpstat_2$fielder_games_played -9.353e-03 1.190e-02 -0.786 0.431792 PLITpstat_2$hitter_games_played 8.238e-03 7.464e-03 1.104 0.269689 Signif. codes: 0 ‘***’ 0.001 ‘**’ 0.01 ‘*’ 0.05 ‘.’ 0.1 ‘ ’ 1 (Dispersion parameter for binomial family taken to be 1) Null deviance: 635.00 on 480 degrees of freedom Residual deviance: 591.84 on 472 degrees of freedom (1775 observations deleted due to missingness)
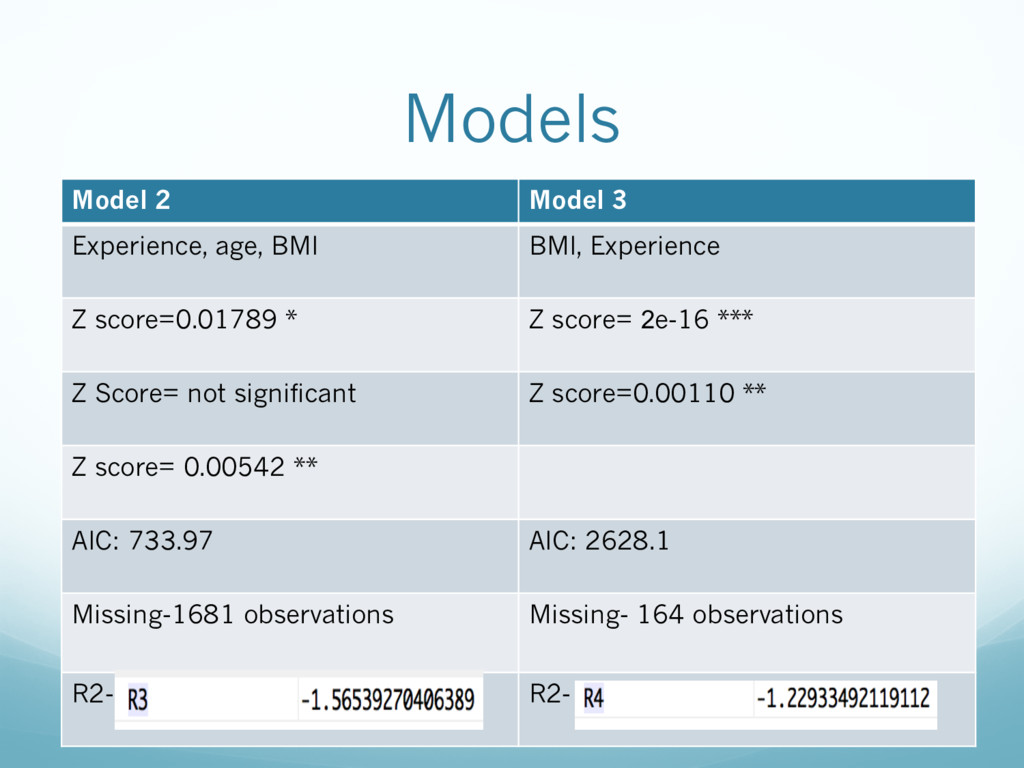
  10. Models Model 2 Model 3 Experience, age, BMI BMI, Experience

    Z score=0.01789 * Z score= 2e-16 *** Z Score= not significant Z score=0.00110 ** Z score= 0.00542 ** AIC: 733.97 AIC: 2628.1 Missing-1681 observations Missing- 164 observations R2- R2-
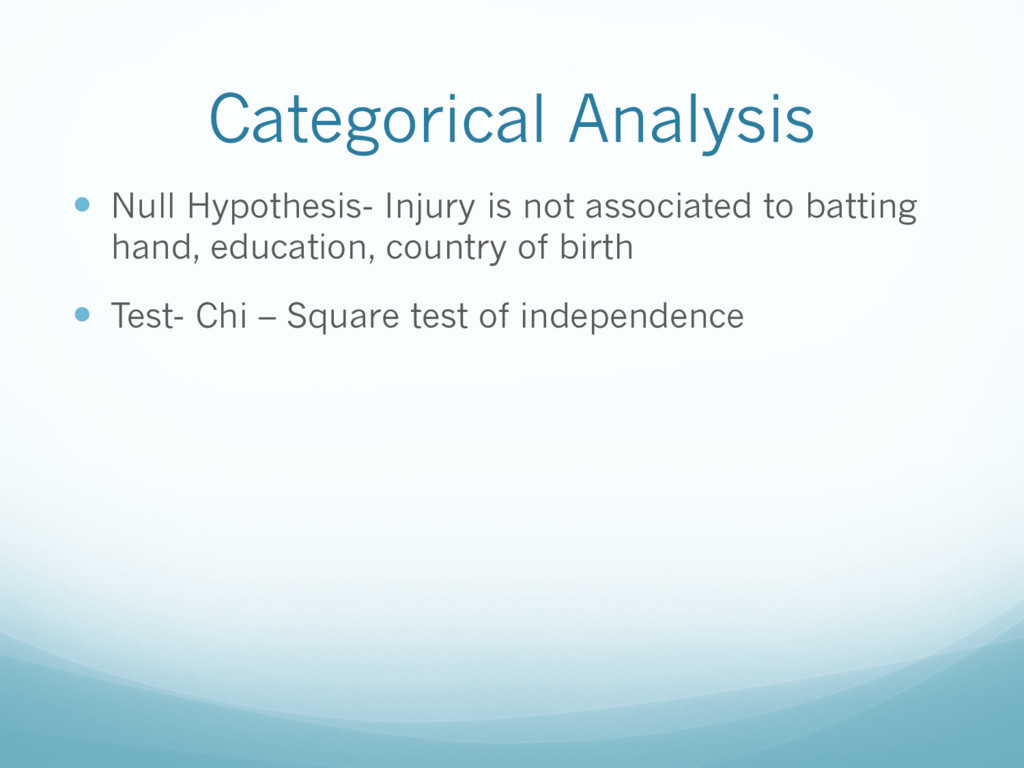
  11. Categorical Analysis — Null Hypothesis- Injury is not associated to

    batting hand, education, country of birth — Test- Chi – Square test of independence
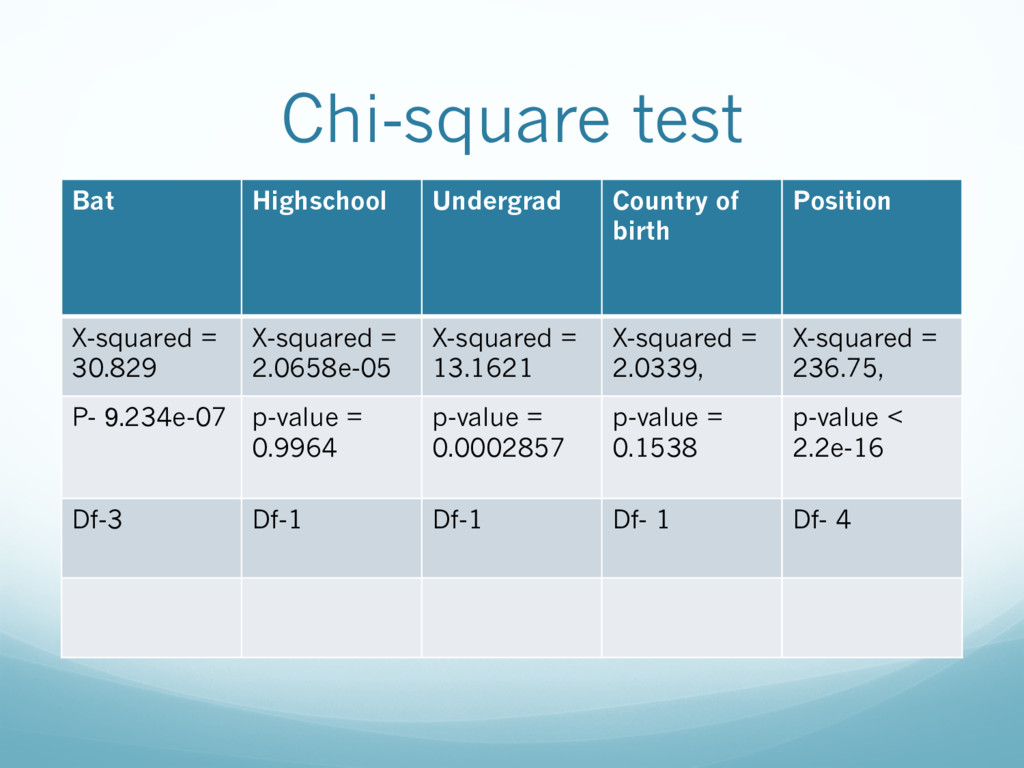
  12. Chi-square test Bat Highschool Undergrad Country of birth Position X-squared

    = 30.829 X-squared = 2.0658e-05 X-squared = 13.1621 X-squared = 2.0339, X-squared = 236.75, P- 9.234e-07 p-value = 0.9964 p-value = 0.0002857 p-value = 0.1538 p-value < 2.2e-16 Df-3 Df-1 Df-1 Df- 1 Df- 4
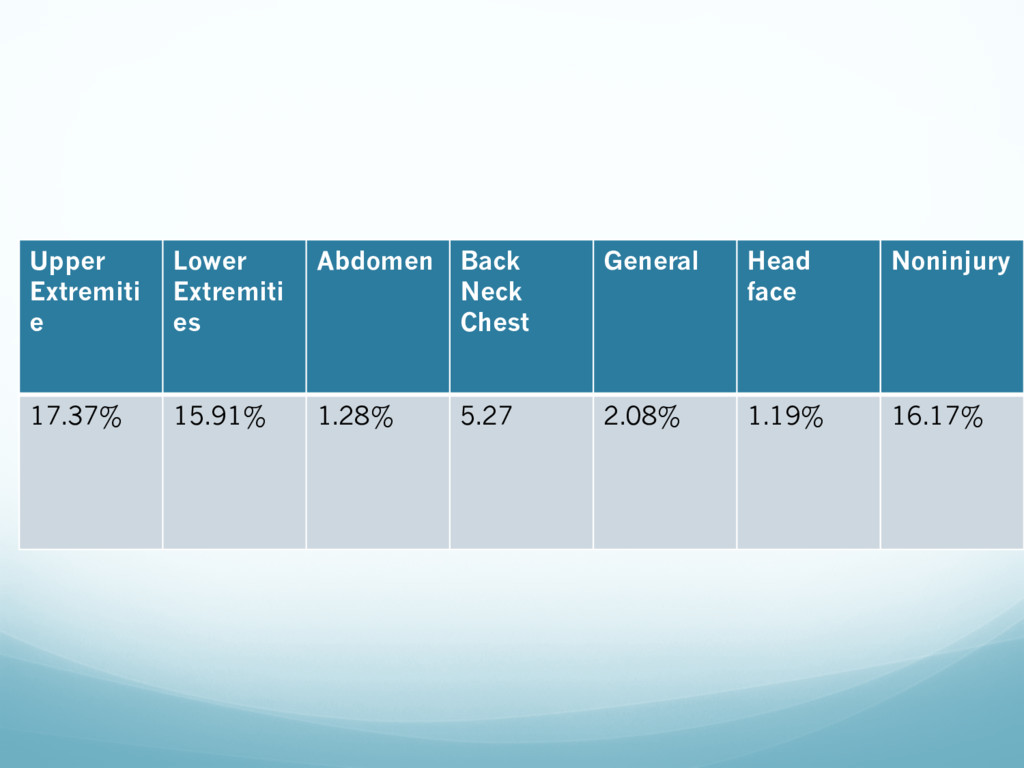
  13. Upper Extremiti e Lower Extremiti es Abdomen Back Neck Chest

    General Head face Noninjury 17.37% 15.91% 1.28% 5.27 2.08% 1.19% 16.17%
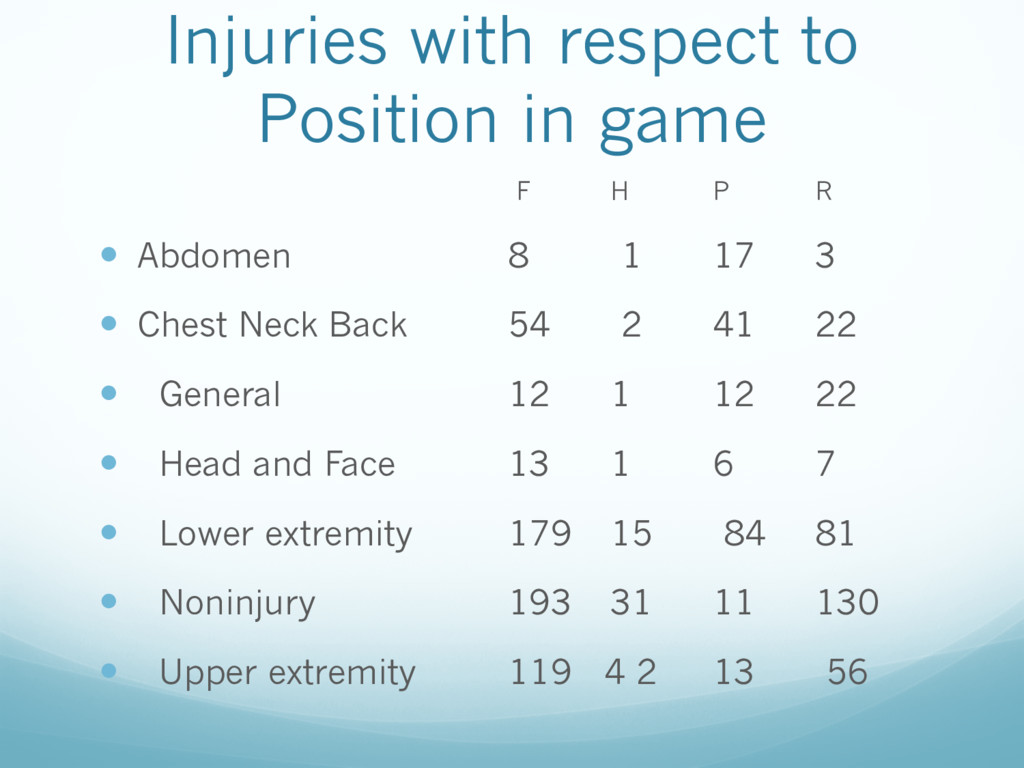
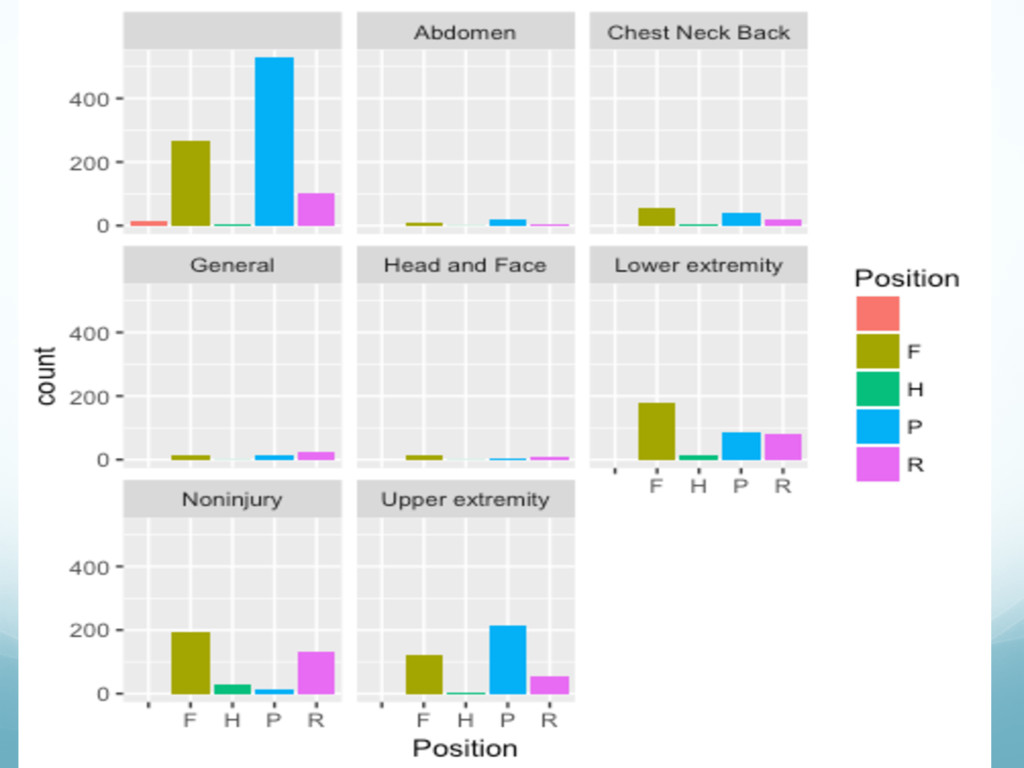
  14. Injuries with respect to Position in game F H P

    R — Abdomen 8 1 17 3 — Chest Neck Back 54 2 41 22 — General 12 1 12 22 — Head and Face 13 1 6 7 — Lower extremity 179 15 84 81 — Noninjury 193 31 11 130 — Upper extremity 119 4 2 13 56
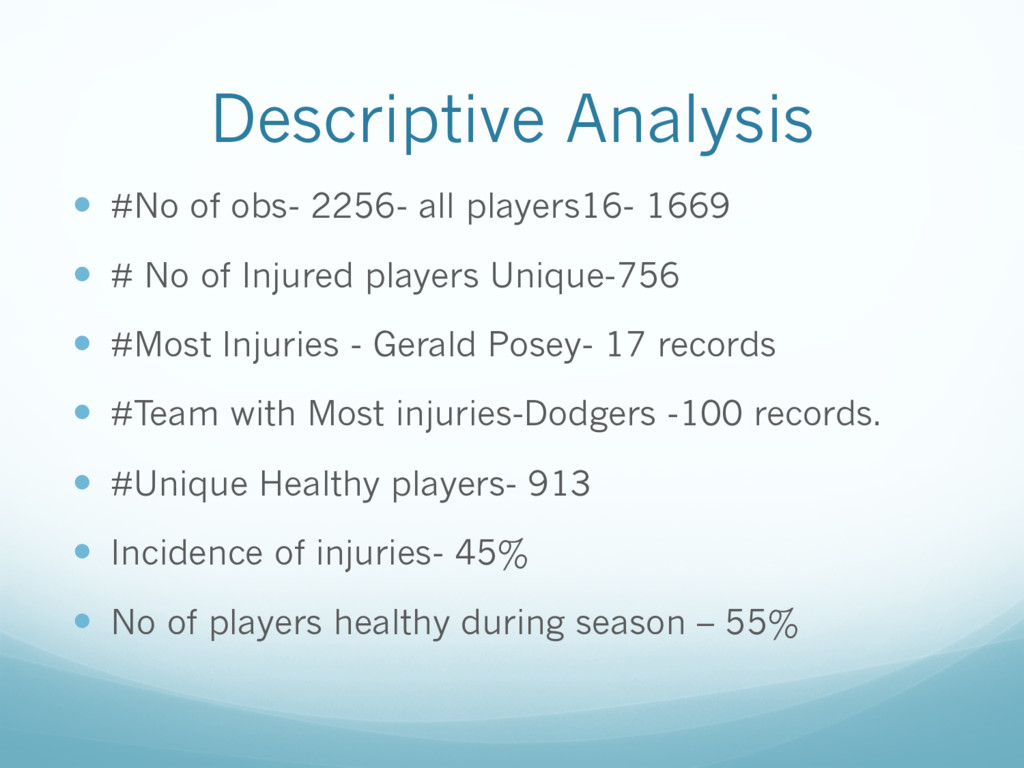
  15. Descriptive Analysis — #No of obs- 2256- all players16- 1669

    — # No of Injured players Unique-756 — #Most Injuries - Gerald Posey- 17 records — #Team with Most injuries-Dodgers -100 records. — #Unique Healthy players- 913 — Incidence of injuries- 45% — No of players healthy during season – 55%
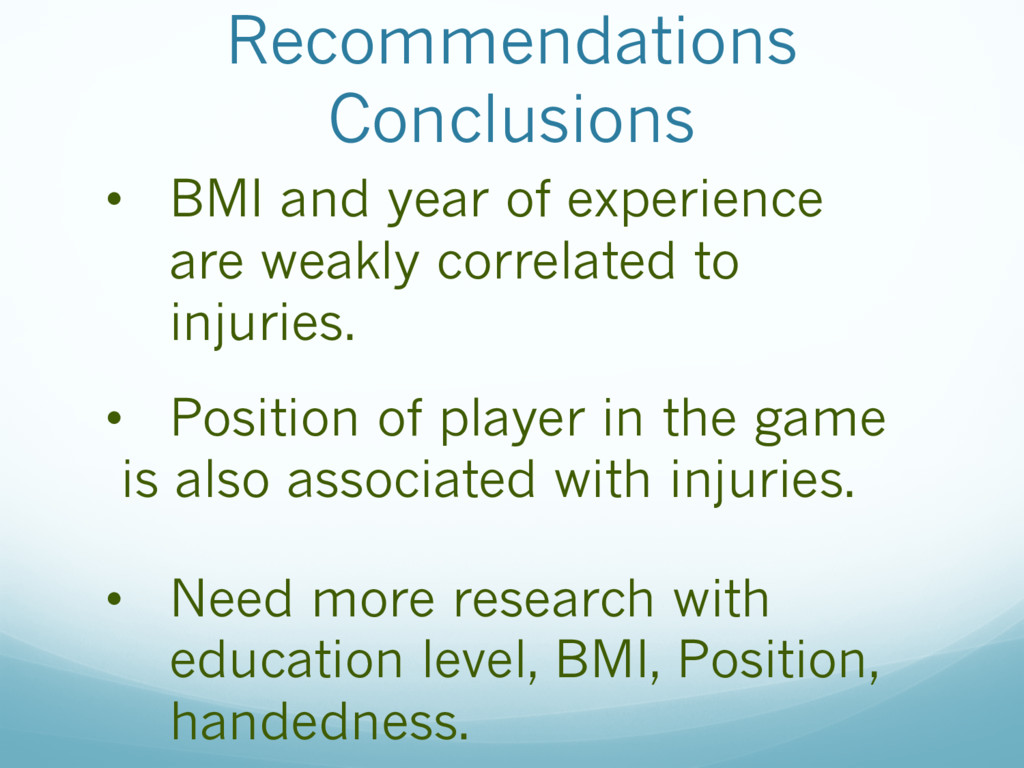
  16. Recommendations Conclusions • BMI and year of experience are weakly

    correlated to injuries. • Position of player in the game is also associated with injuries. • Need more research with education level, BMI, Position, handedness.