{ Domain-Sp CPU time profiling Mondrian [9] is an open and agile visualization engine. visualization using a graph of (possibly nested) nodes an a serious performance issue was raised1. Tracking down performance was not trivial. We first used a standard sam Execution sampling approximates the time spent in an by periodically stopping a program and recording the cu under executions. Such a profiling technique is relatively little impact on the overall execution. This sampling techn all mainstream profilers, such as JProfiler, YourKit, xprof MessageTally, the standard sampling-based profiler in P tually describes the execution in terms of CPU consumpt each method of Mondrian: 54.8% {11501ms} MOCanvas>>drawOn: 54.8% {11501ms} MORoot(MONode)>>displayOn: 30.9% {6485ms} MONode>>displayOn: | 18.1% {3799ms} MOEdge>>displayOn: ... | 8.4% {1763ms} MOEdge>>displayOn: | | 8.0% {1679ms} MOStraightLineShape>>display:on: | | 2.6% {546ms} FormCanvas>>line:to:width:color: ... 23.4% {4911ms} MOEdge>>displayOn: ... We can observe that the virtual machine spent abou the method displayOn: defined in the class MORoot. A ro nested node that contains all the nodes of the edges of t general profiling information says that rendering nodes a great share of the CPU time, but it does not help in pin and edges are responsible for the time spent. Not all grap consume resources. Traditional execution sampling profilers center their r the execution stack and completely ignore the identity of th the method call and its arguments. As a consequence, it which objects cause the slowdown. For the example above, says that we spent 30.9% in MONode>>displayOn: withou were actually refreshed too often. Coverage PetitParser is a parsing framework combining ideas from parser combinators, parsing expression grammars and pac grammars and parsers as objects that can be reconfigured 1 http://forum.world.st/Mondrian-is-slow-next-step-tc Tuesday, August 23, 11
} { CPU time profiling Mondrian [9] is an open and agile visualization engine. visualization using a graph of (possibly nested) nodes an a serious performance issue was raised1. Tracking down performance was not trivial. We first used a standard sam Execution sampling approximates the time spent in an by periodically stopping a program and recording the cu under executions. Such a profiling technique is relatively little impact on the overall execution. This sampling techn all mainstream profilers, such as JProfiler, YourKit, xprof MessageTally, the standard sampling-based profiler in P tually describes the execution in terms of CPU consumpt each method of Mondrian: 54.8% {11501ms} MOCanvas>>drawOn: 54.8% {11501ms} MORoot(MONode)>>displayOn: 30.9% {6485ms} MONode>>displayOn: | 18.1% {3799ms} MOEdge>>displayOn: ... | 8.4% {1763ms} MOEdge>>displayOn: | | 8.0% {1679ms} MOStraightLineShape>>display:on: | | 2.6% {546ms} FormCanvas>>line:to:width:color: ... 23.4% {4911ms} MOEdge>>displayOn: ... We can observe that the virtual machine spent abou the method displayOn: defined in the class MORoot. A ro nested node that contains all the nodes of the edges of t general profiling information says that rendering nodes a great share of the CPU time, but it does not help in pin and edges are responsible for the time spent. Not all grap consume resources. Traditional execution sampling profilers center their r the execution stack and completely ignore the identity of th the method call and its arguments. As a consequence, it which objects cause the slowdown. For the example above, says that we spent 30.9% in MONode>>displayOn: withou were actually refreshed too often. Coverage PetitParser is a parsing framework combining ideas from parser combinators, parsing expression grammars and pac grammars and parsers as objects that can be reconfigured 1 http://forum.world.st/Mondrian-is-slow-next-step-tc a2261116 2 http://www.pharo-project.org/ Tuesday, August 23, 11
u all mainstream profilers, such as JProfiler, YourKit, xprof [10], an MessageTally, the standard sampling-based profiler in Pharo Sm tually describes the execution in terms of CPU consumption and i each method of Mondrian: 54.8% {11501ms} MOCanvas>>drawOn: 54.8% {11501ms} MORoot(MONode)>>displayOn: 30.9% {6485ms} MONode>>displayOn: | 18.1% {3799ms} MOEdge>>displayOn: ... | 8.4% {1763ms} MOEdge>>displayOn: | | 8.0% {1679ms} MOStraightLineShape>>display:on: | | 2.6% {546ms} FormCanvas>>line:to:width:color: ... 23.4% {4911ms} MOEdge>>displayOn: ... We can observe that the virtual machine spent about 54% o the method displayOn: defined in the class MORoot. A root is the nested node that contains all the nodes of the edges of the visua general profiling information says that rendering nodes and edge great share of the CPU time, but it does not help in pinpointing Tuesday, August 23, 11
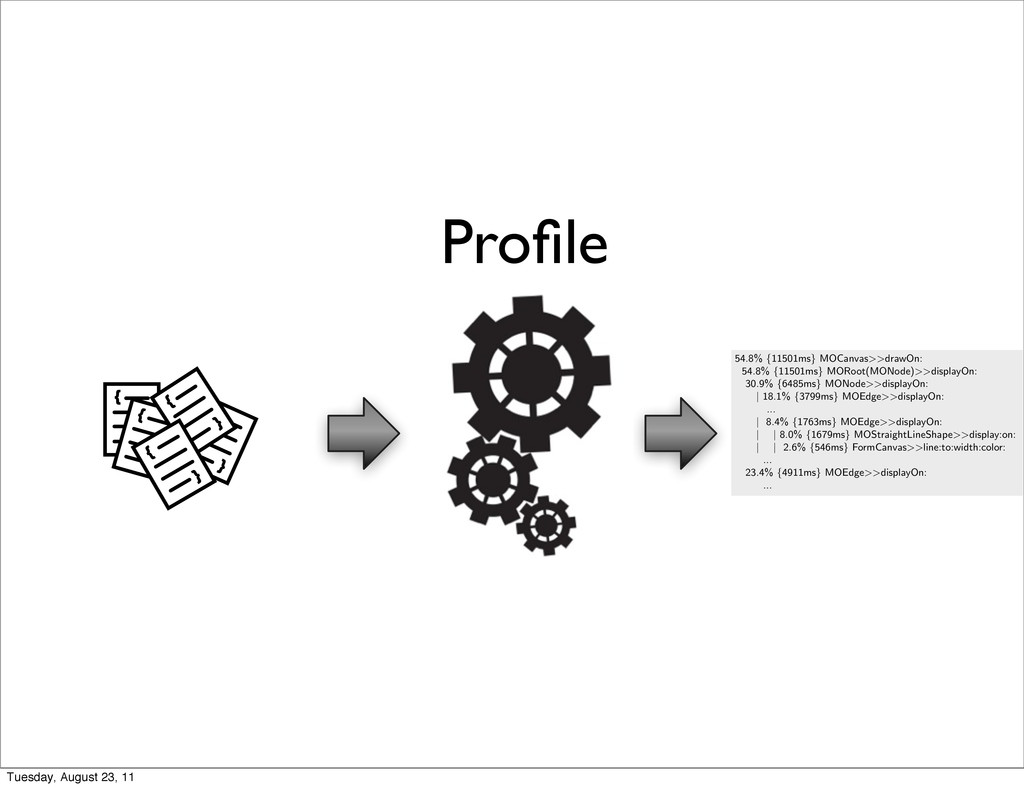
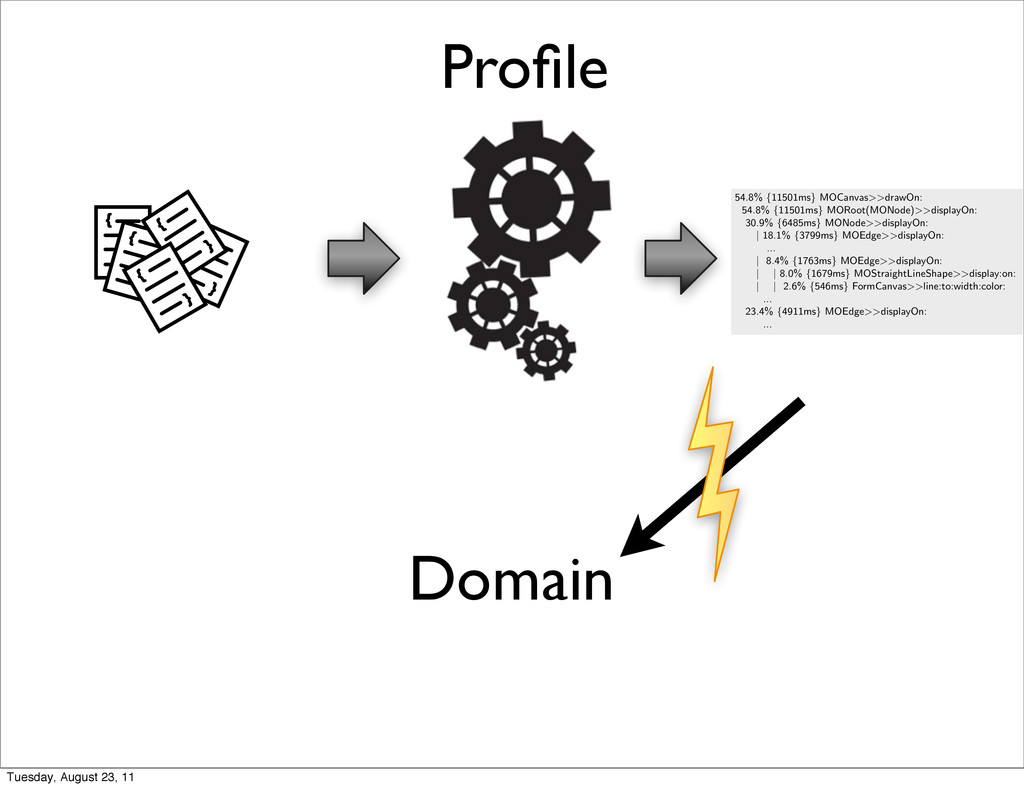
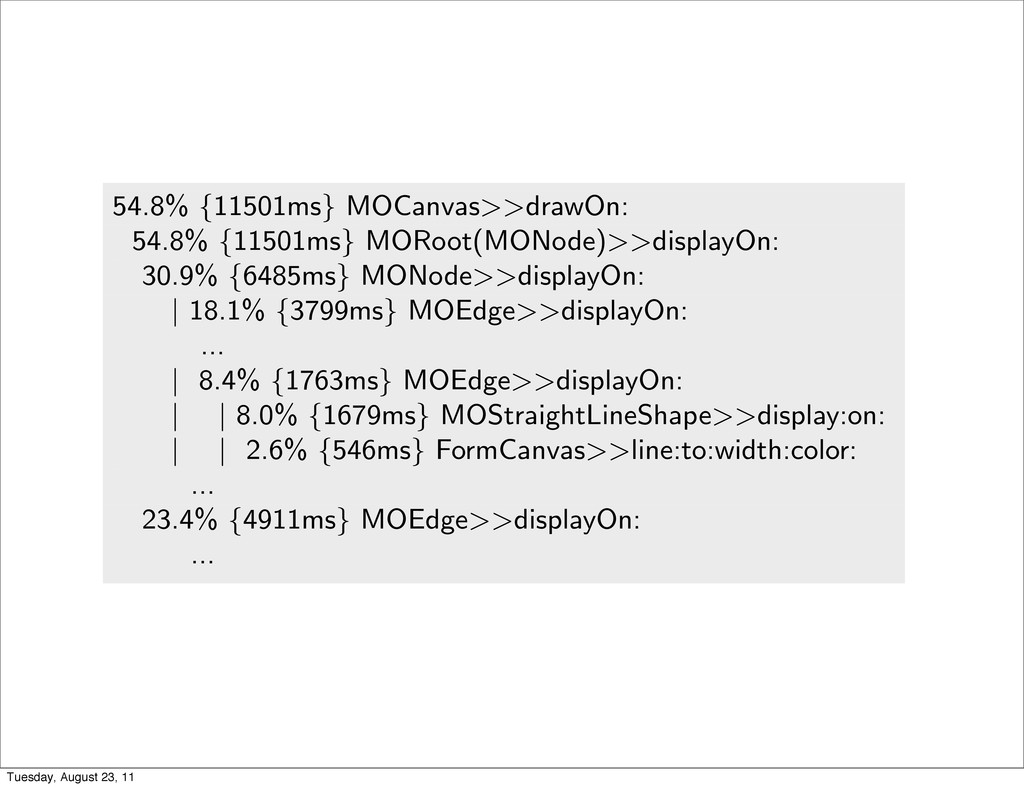
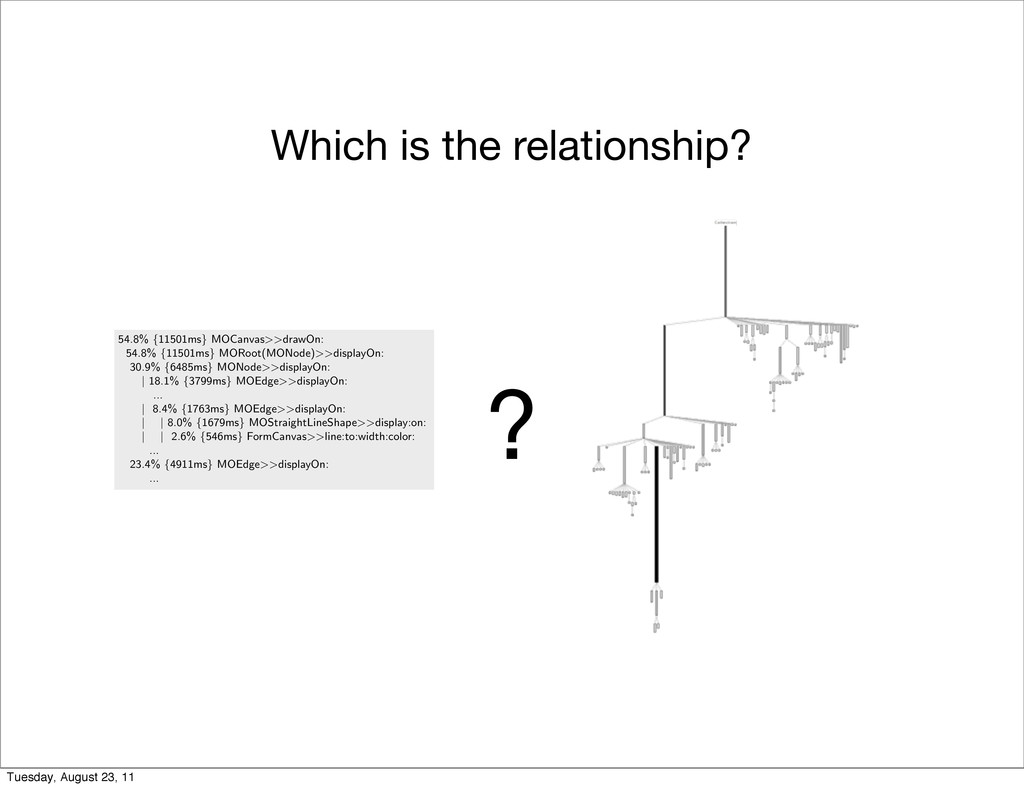
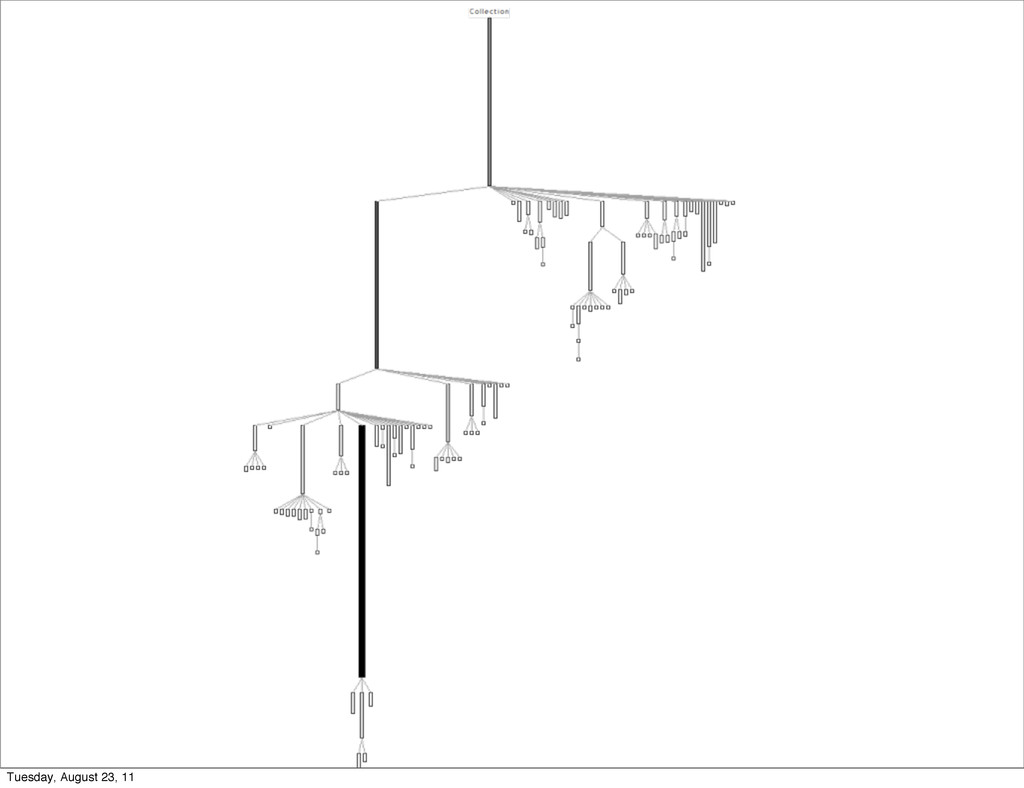
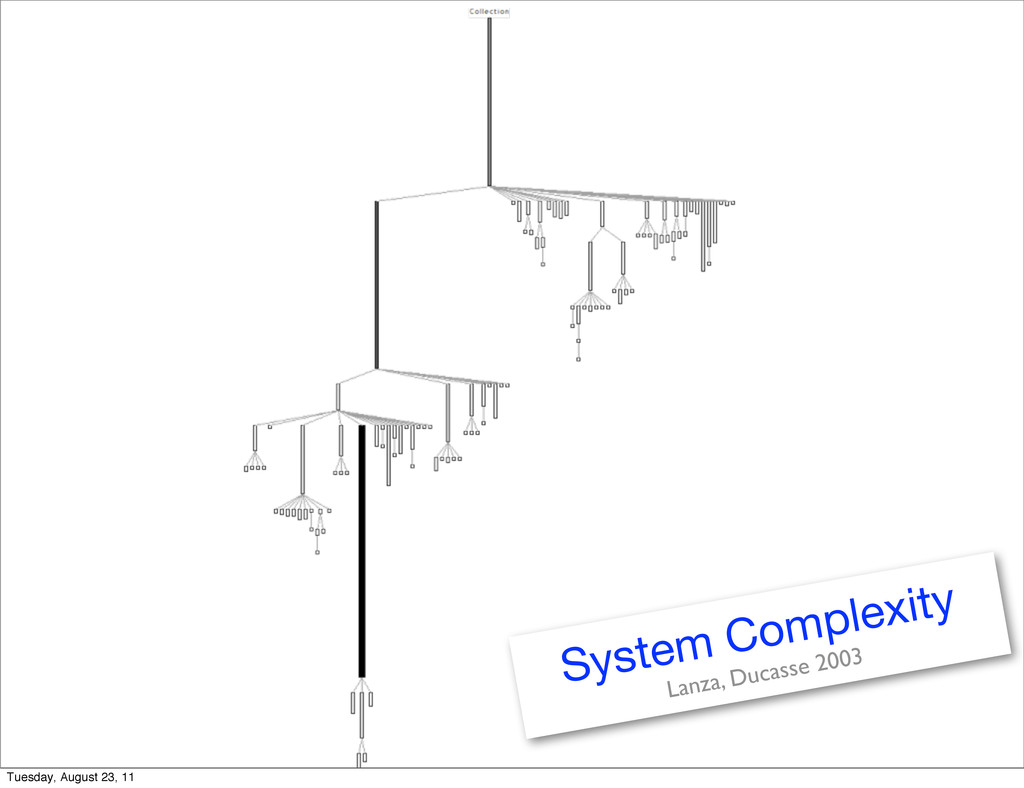
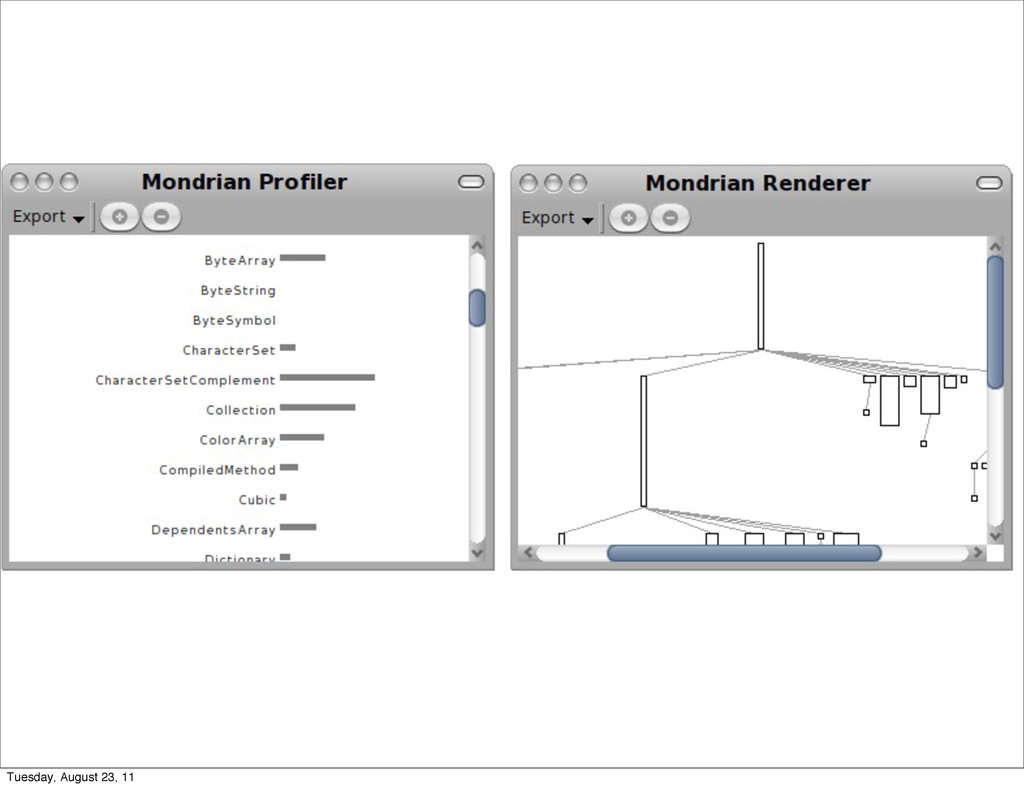
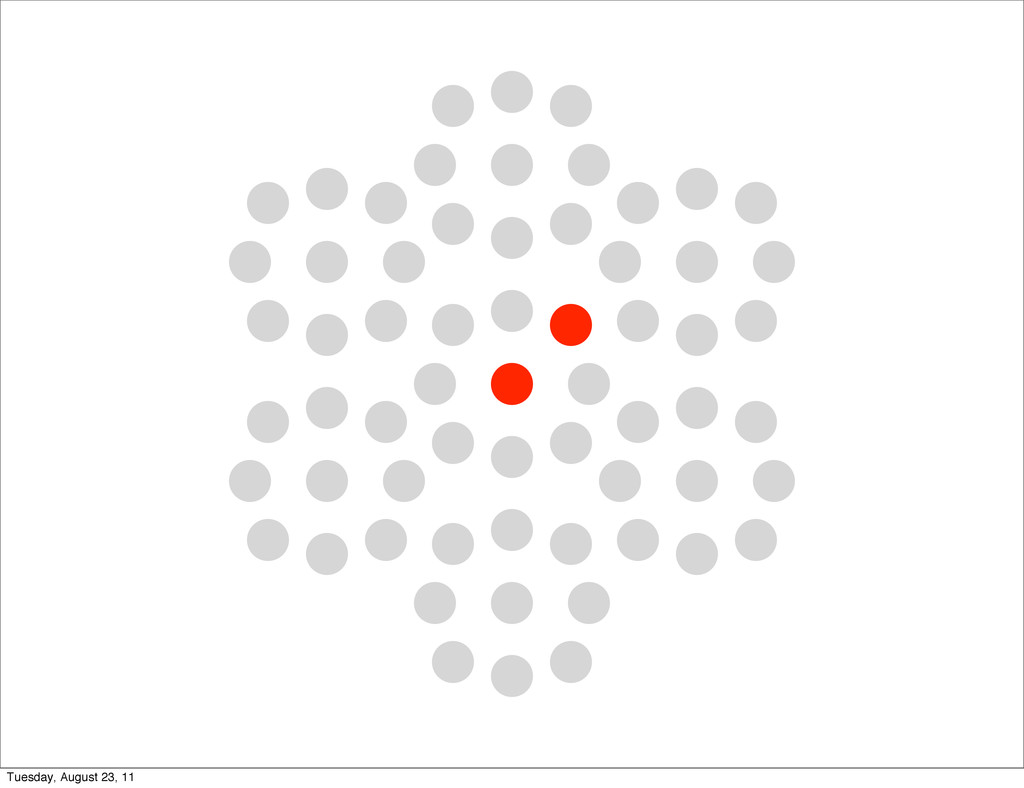
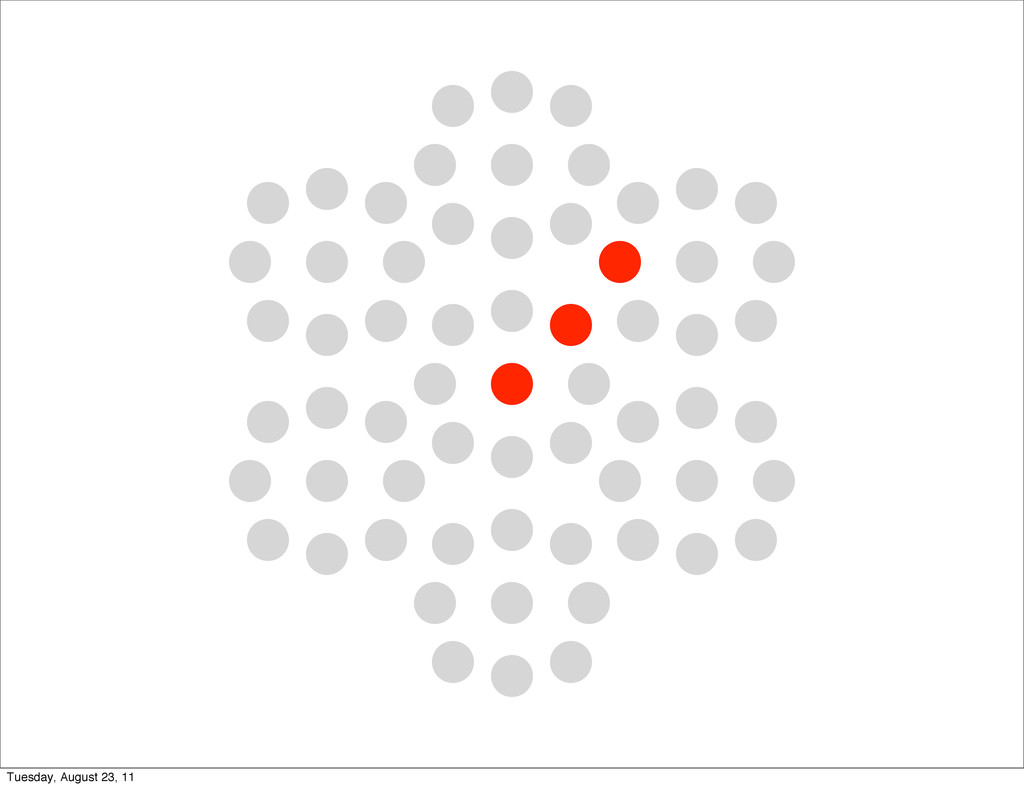
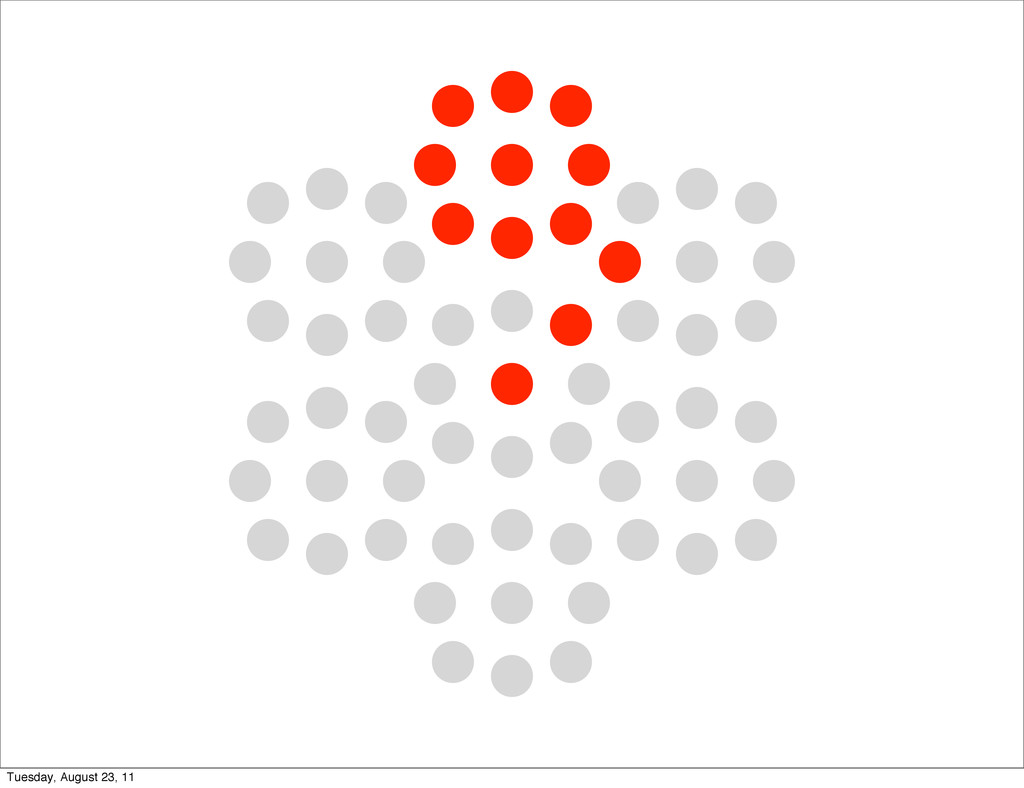
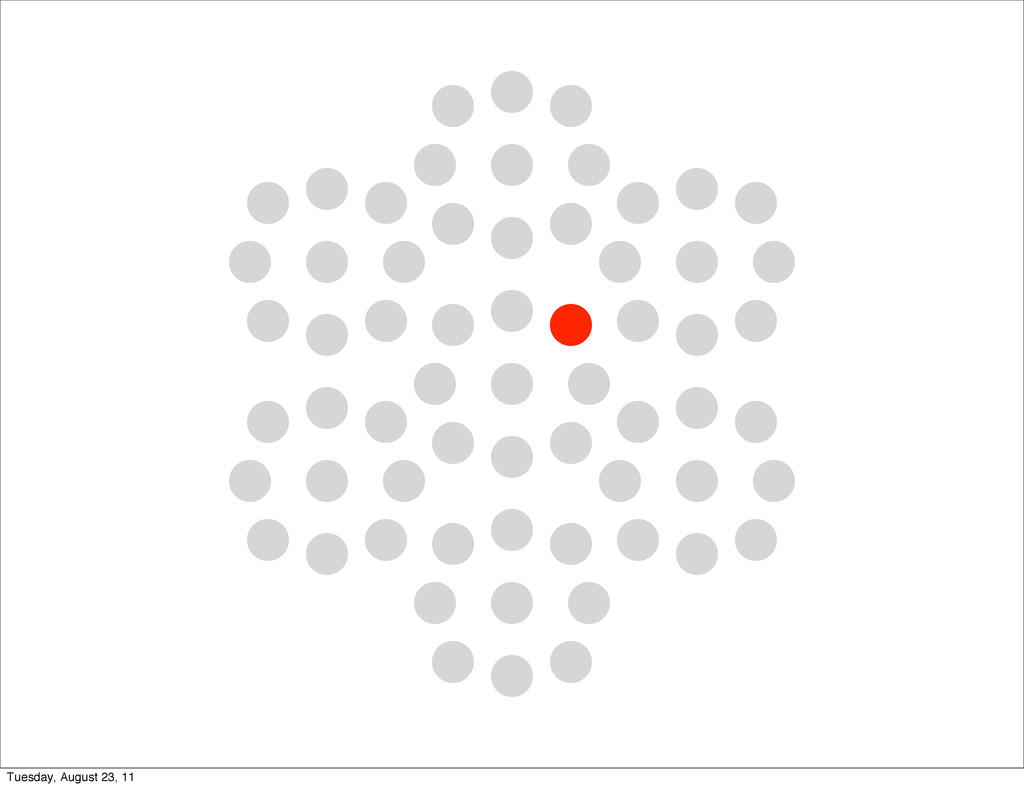
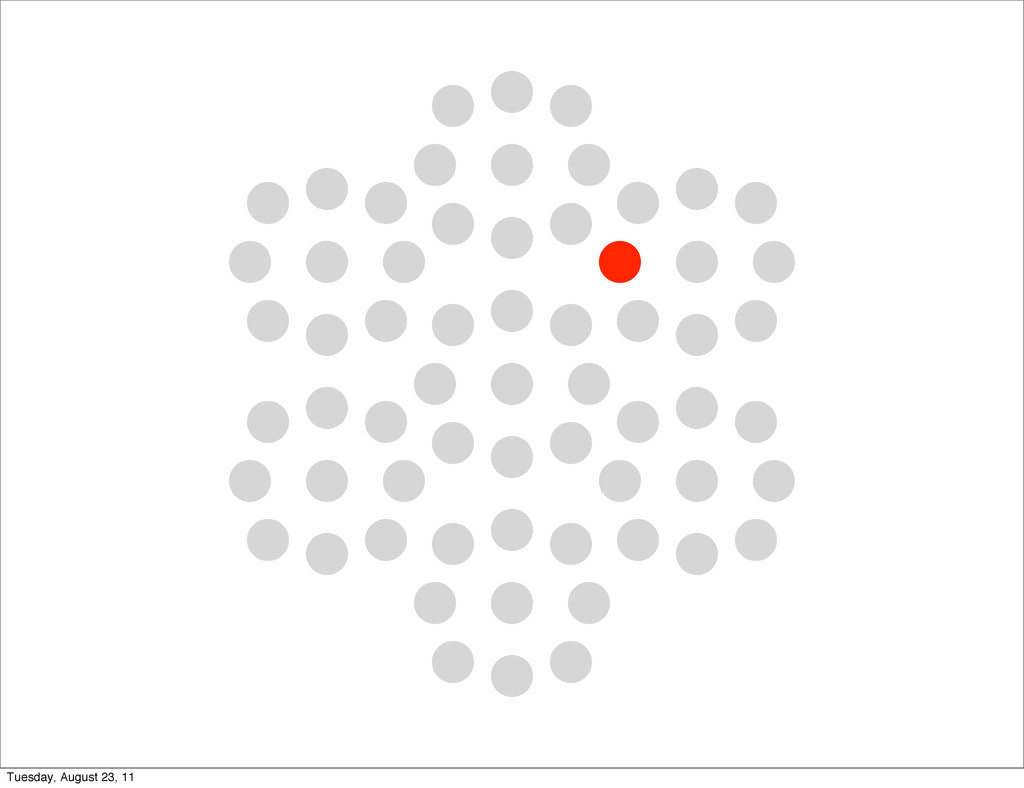
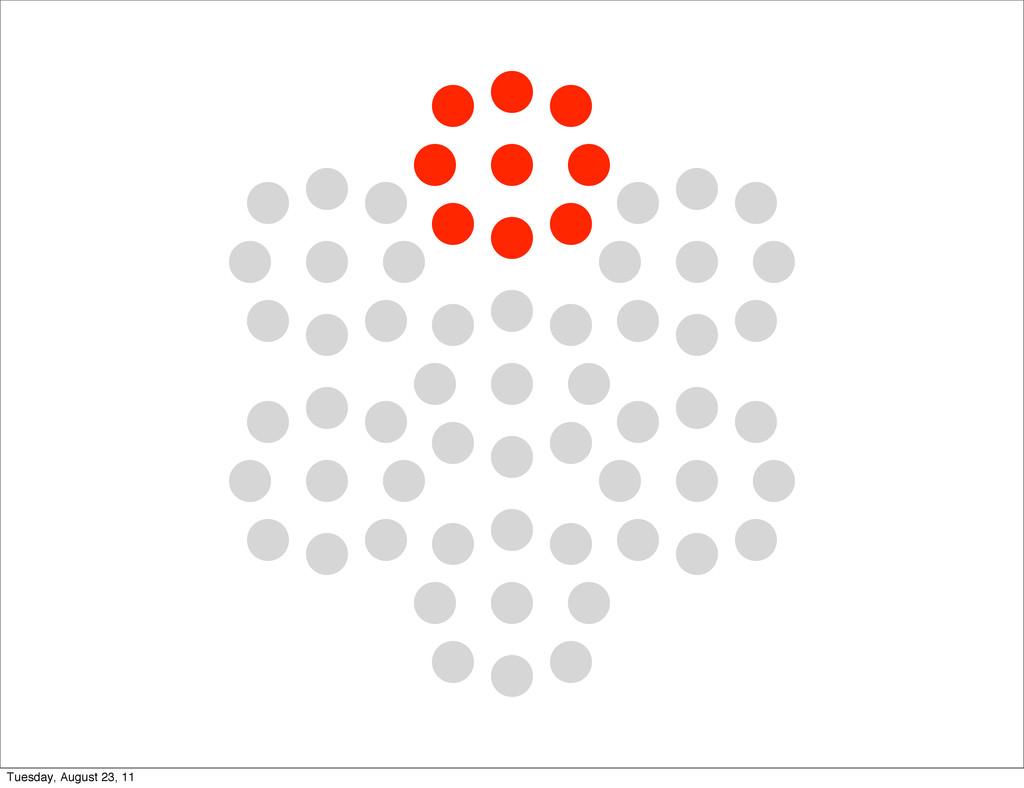
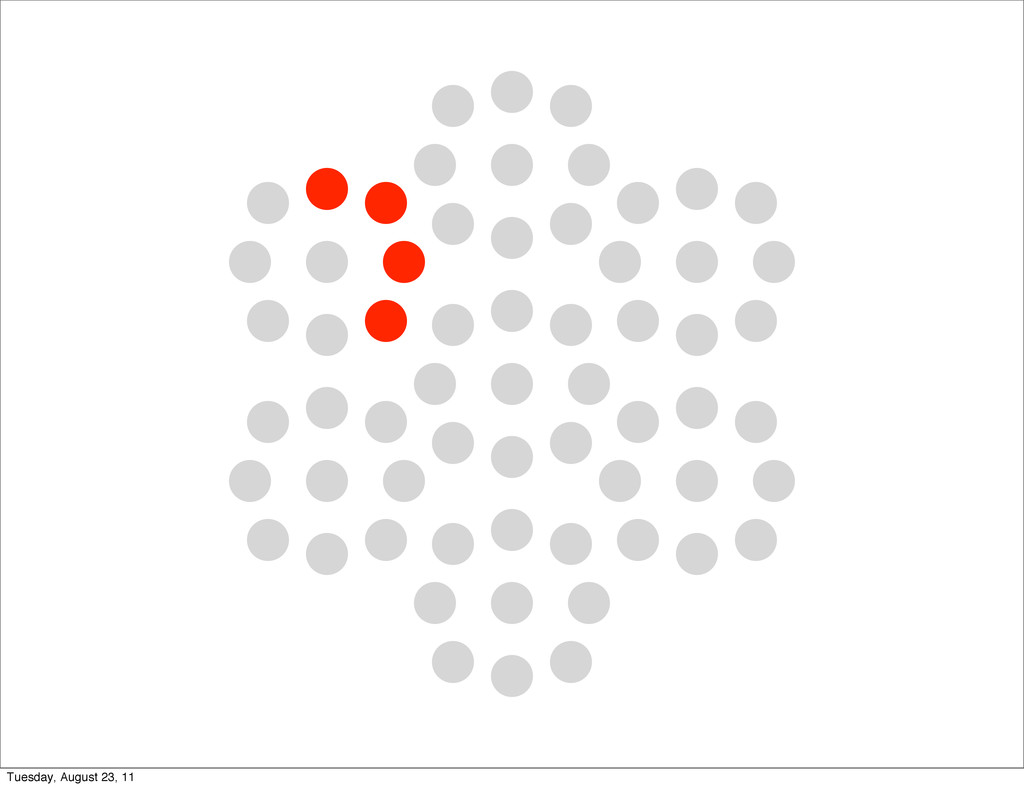
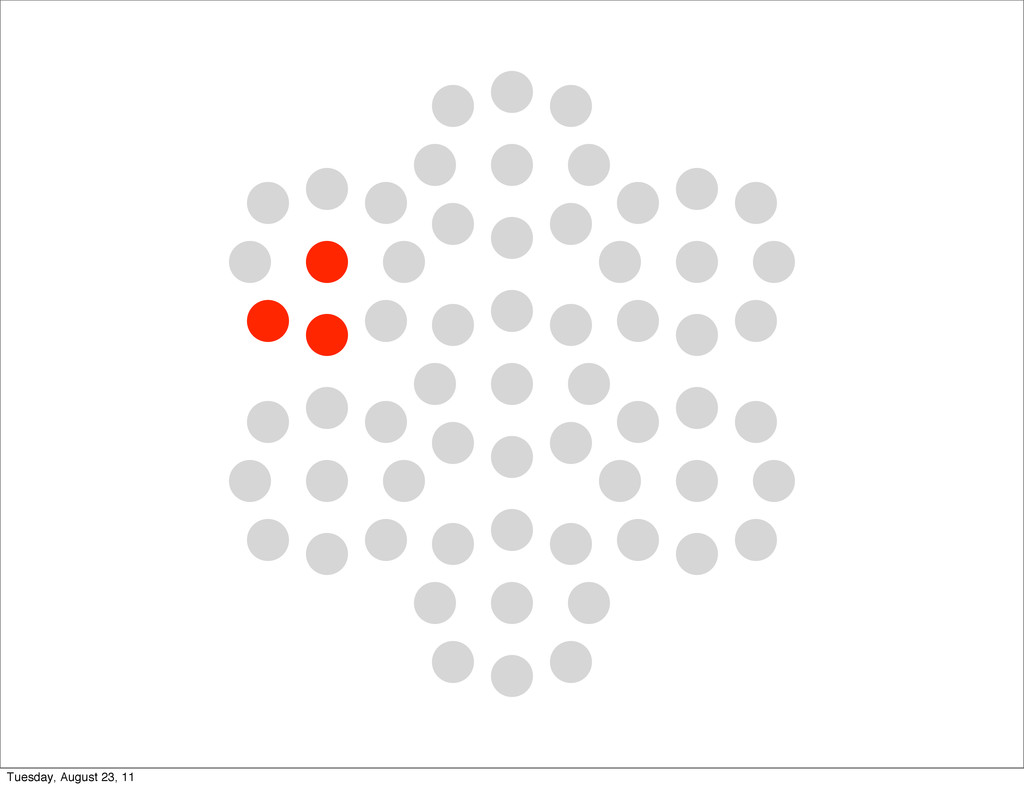
Mondrian [9] is an open and agile visualization engine. Mondrian describes a visualization using a graph of (possibly nested) nodes and edges. In June 2010 a serious performance issue was raised1. Tracking down the cause of the poor performance was not trivial. We first used a standard sample-based profiler. Execution sampling approximates the time spent in an application’s methods by periodically stopping a program and recording the current set of methods under executions. Such a profiling technique is relatively accurate since it has little impact on the overall execution. This sampling technique is used by almost all mainstream profilers, such as JProfiler, YourKit, xprof [10], and hprof. MessageTally, the standard sampling-based profiler in Pharo Smalltalk2, tex- tually describes the execution in terms of CPU consumption and invocation for each method of Mondrian: 54.8% {11501ms} MOCanvas>>drawOn: 54.8% {11501ms} MORoot(MONode)>>displayOn: 30.9% {6485ms} MONode>>displayOn: | 18.1% {3799ms} MOEdge>>displayOn: ... | 8.4% {1763ms} MOEdge>>displayOn: | | 8.0% {1679ms} MOStraightLineShape>>display:on: | | 2.6% {546ms} FormCanvas>>line:to:width:color: ... 23.4% {4911ms} MOEdge>>displayOn: ... We can observe that the virtual machine spent about 54% of its time in the method displayOn: defined in the class MORoot. A root is the unique non- nested node that contains all the nodes of the edges of the visualization. This general profiling information says that rendering nodes and edges consumes a great share of the CPU time, but it does not help in pinpointing which nodes and edges are responsible for the time spent. Not all graphical elements equally consume resources. Traditional execution sampling profilers center their result on the frames of the execution stack and completely ignore the identity of the object that received the method call and its arguments. As a consequence, it is hard to track down which objects cause the slowdown. For the example above, the traditional profiler says that we spent 30.9% in MONode>>displayOn: without saying which nodes were actually refreshed too often. Coverage PetitParser is a parsing framework combining ideas from scannerless parsing, parser combinators, parsing expression grammars and packrat parsers to model grammars and parsers as objects that can be reconfigured dynamically [11]. ? Tuesday, August 23, 11