Upgrade to Pro — share decks privately, control downloads, hide ads and more …

Reporting Apps for data projects

Riinu Ots
August 16, 2017

Reporting Apps for data projects

My plenary talk at the REDCap (https://www.project-redcap.org/) conference in NYC, August 2017. All apps are R-Shiny and code is available at https://github.com/riinuots/

Riinu Ots

August 16, 2017
Tweet

More Decks by Riinu Ots

Other Decks in Programming

Transcript

  1. Background: GlobalSurg studies ‣Use REDCap to collect data that is:

    ‣ Patient level ‣ Comprehensive - 3 instruments, 34 variables ‣ Crowdsourced ‣ Globally ‣For GlobalSurg 2 (1-Jan - 31-Jul 2016), this meant: ‣ 3,277 Registration Survey responses ‣ 2,127 REDCap users from 70 countries ‣ 554 hospitals (DAGs) ‣ 16,717 records ‣ REDCap statistics (24-Jul-2017): ‣ Edinburgh: 8,413 users in 126 Production Projects ‣ Vanderbilt: 32,217 users in 28,288 Production projects
  2. Reporting Apps ‣Monitor data collection and Aid cleaning ‣Report Aggregated

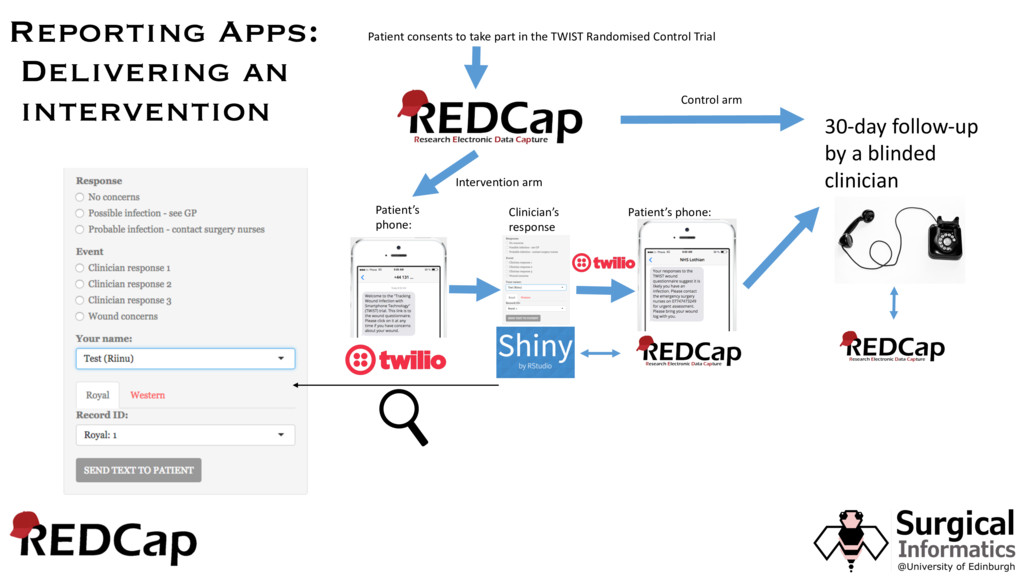
    data back to collaborators ‣Help deliver an intervention with REDCap* *TWIST (tracking Wound Infection Using Smartphone Technology): A Randomised Control Trial where the intervention is delivered by REDCap+Shiny
  3. Reporting Apps: Report Aggregated data back to collaborators Code: https://github.com/riinuots/gs2_ssi_app

    https://github.com/riinuots/shinyviz Live at: ssi.globalsurg.org Empirical Bayes credible intervals: (Reproducible code to be released shortly.)
  4. Patient consents to take part in the TWIST Randomised Control

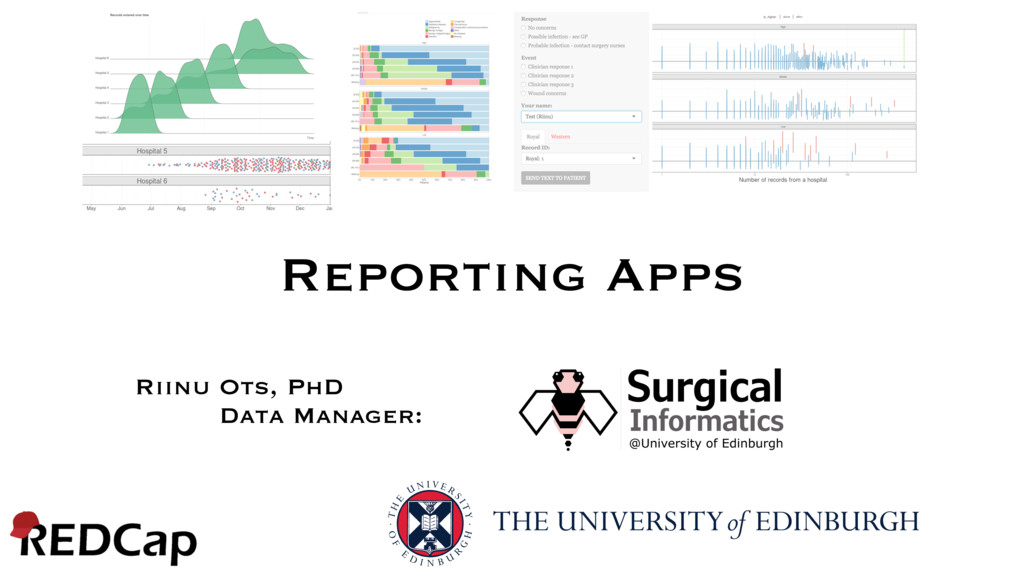
    Trial Control arm 30-day follow-up by a blinded clinician Intervention arm Patient’s phone: Clinician’s response Patient’s phone: Reporting Apps: Delivering an intervention
  5. Developed with: Statistical Programming Language Integrated Development Environment (IDE) for

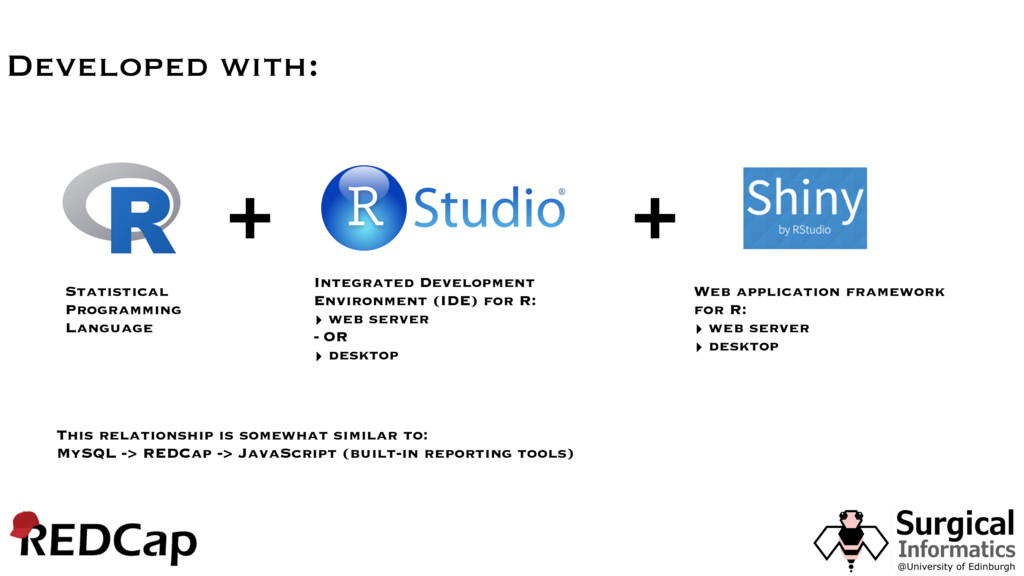
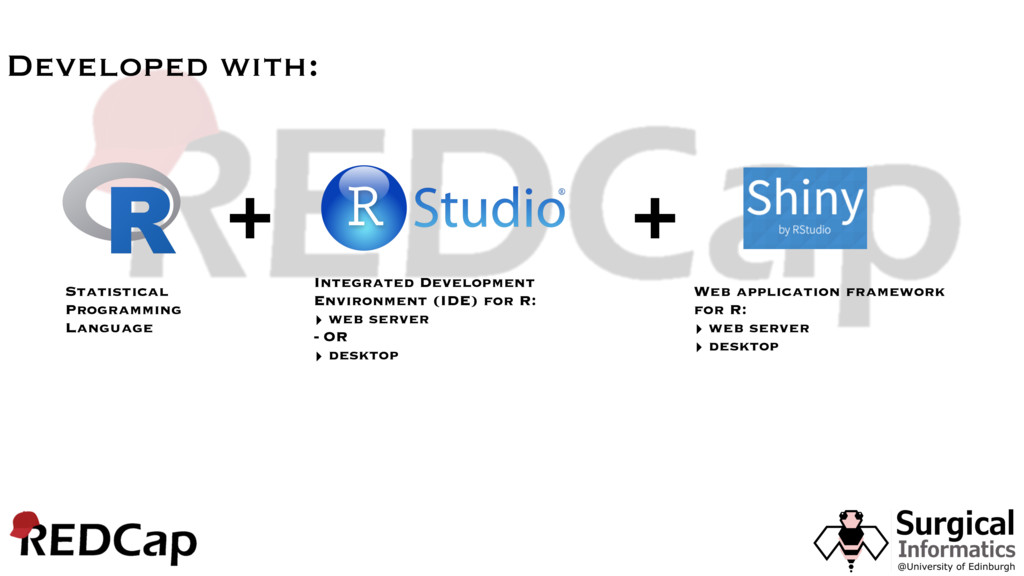
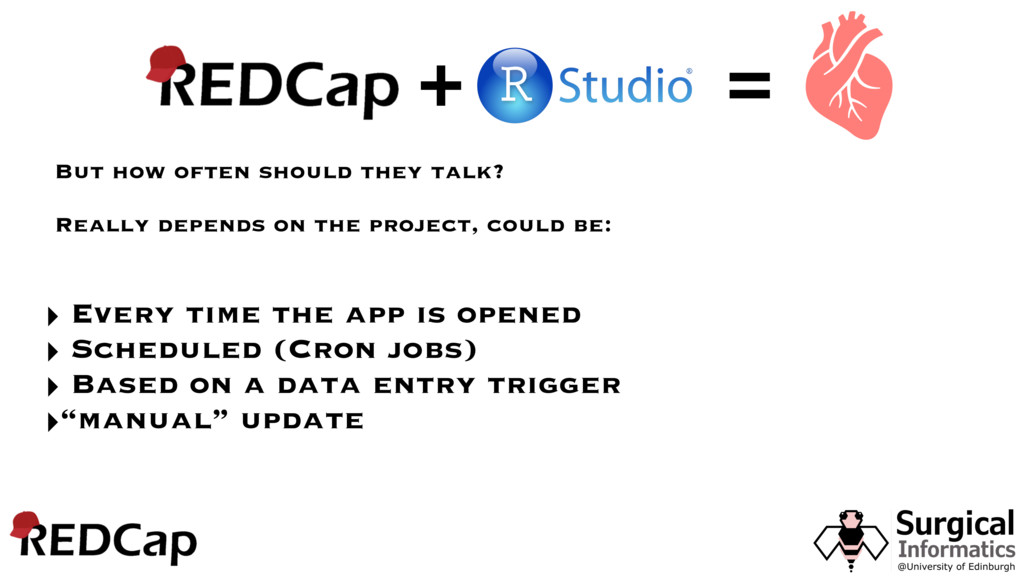
    R: ‣ web server - OR ‣ desktop Web application framework for R: ‣ web server ‣ desktop + + This relationship is somewhat similar to:
 MySQL -> REDCap -> JavaScript (built-in reporting tools)
  6. Developed with: Statistical Programming Language Integrated Development Environment (IDE) for

    R: ‣ web server - OR ‣ desktop Web application framework for R: ‣ web server ‣ desktop + +
  7. install.packages (“shiny”) + shinythemes, ggplot2, tidyr, dplyr, forcats, magrittr, scales

    (All tidyverse) shiny::runGitHub(“shinyviz”, “riinuots”) Instructions at: github.com/riinuots/shinyviz
  8. ‣ Every time the app is opened ‣ Scheduled (Cron

    jobs) ‣ Based on a data entry trigger ‣“manual” update + = But how often should they talk? Really depends on the project, could be: