Share
Embed
R for Health Data Science: from clinicians who code to Shiny interventions
Riinu Pius
September 26, 2020
Transcript
24 slides
-
R for Health Data Science: from clinicians who code to
Shiny interventions Riinu Pius, PhD www.riinu.me _Riinu_ -
Why R? • awesome visualisations • all the statistics you
can dream of • machine learning, deep learning, big data, etc… • Shiny apps • … Many people use it ➡ community -
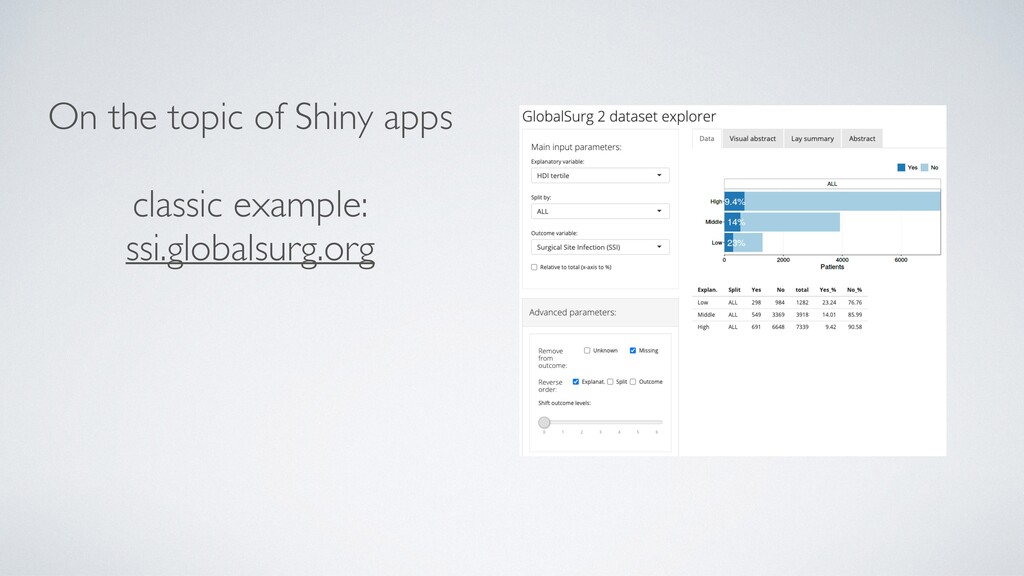
Royal Infirmary of Edinburgh 10% http://ssi.globalsurg.org/ ALL 0 2000 4000
6000 Low Middle High Patients Yes No wound infection: -
Shiny intervention: ✅ ⚠⚕ McLean KA, et al. BMJ Open
2019 keywords: wound infection, smartphone httr::POST() RESPONSE APP -
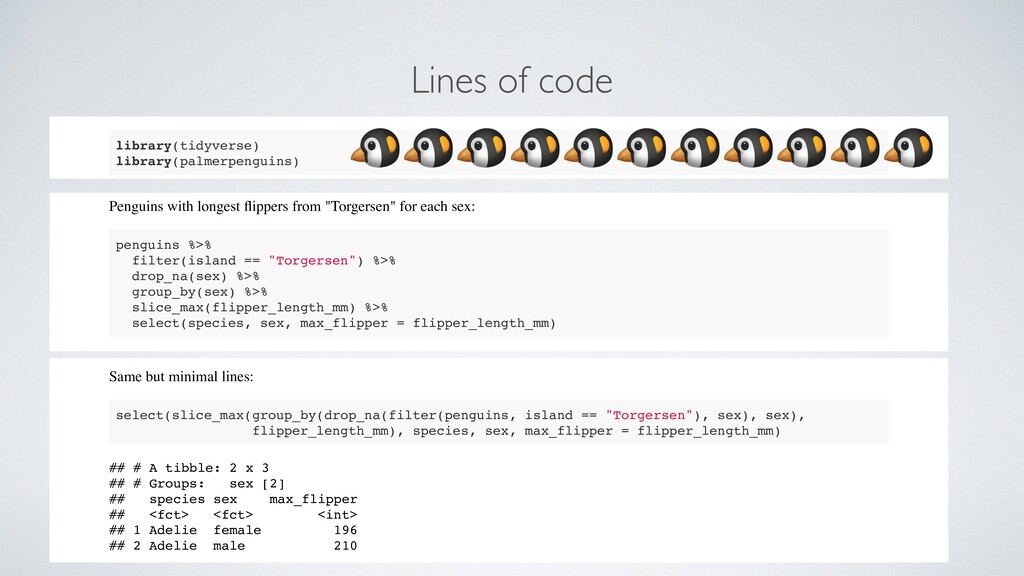
Lines of code b a ( ) b a (
) Pe g i i h l ge i e f m "T ge e " f each e : % % ( == " ") % % ( ) % % ( ) % % ( ) % % ( , , = ) Same b mi imal li e : ( ( ( ( ( , == " "), ), ), ), , , = ) ## # : 2 3 ## # : 2 ## ## < < < ## 1 196 ## 2 210 b a ( ) b a ( ) Pe g i i h l ge i e f m "T ge e " f each e : % % ( == " ") % % ( ) % % ( ) % % ( ) % % ( , , = ) Same b mi imal li e : ( ( ( ( ( , == " "), ), ), ), , , = ) ## # : 2 3 ## # : 2 ## ## < < < ## 1 196 ## 2 210 b a ( ) b a ( ) Pe g i i h l ge i e f m "T ge e " f each e : % % ( == " ") % % ( ) % % ( ) % % ( ) % % ( , , = ) Same b mi imal li e : ( ( ( ( ( , == " "), ), ), ), , , = ) ## # : 2 3 ## # : 2 ## ## < < < ## 1 196 ## 2 210 -
%>% ( ) %>% ( == ( )) %>% (
) %>% ( ) (..., = 3 = TR E/FALSE ) %>% (! . ( )) %>% _ ( ) Tip: group_by() with slice_max() Tip: drop_na(variable) -
So much data! Photo by Javier Matheu on Unsplash Royal
Infirmary of Edinburgh -
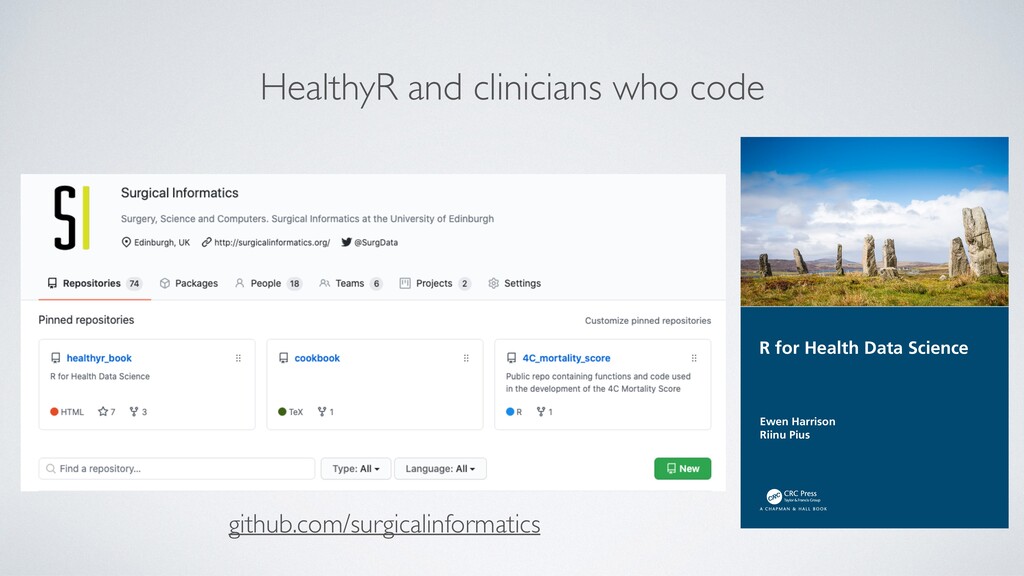
HealthyR and clinicians who code github.com/surgicalinformatics Ewen Harrison Riinu Pius
R for Health Data Science R for Health Data Science Harrison • Pius STATISTICS w w w . r o u t l e d g e . c o m CRC Press titles are available as eBook editions in a range of digital formats In this age of information, the manipulation, analysis, and interpretation of data have become a fundamental part of professional life; nowhere more so than in the delivery of healthcare. From the understanding of disease and the de- velopment of new treatments, to the diagnosis and management of individual patients, the use of data and technology is now an integral part of the busi- ness of healthcare. Those working in healthcare interact daily with data, often without realising it. The conversion of this avalanche of information to useful knowledge is essential for high-quality patient care. R for Health Data Science includes everything a healthcare professional needs to go from R novice to R guru. By the end of this book, you will be taking a sophisticated approach to health data science with beautiful visuali- sations, elegant tables, and nuanced analyses. Features • Provides an introduction to the fundamentals of R for healthcare profes- sionals • Highlights the most popular statistical approaches to health data science • Written to be as accessible as possible with minimal mathematics • Emphasises the importance of truly understanding the underlying data through the use of plots • Includes numerous examples that can be adapted for your own data • Helps you create publishable documents and collaborate across teams With this book, you are in safe hands – Prof. Harrison is a clinician and Dr. Pius is a data scientist, bringing 25 years’ combined experience of using R at the coal face. This content has been taught to hundreds of individuals from a variety of backgrounds, from rank beginners to experts moving to R from other platforms. 340175_cover_hc.indd All Pages 340175_cover_hc.indd All Pages 8/27/20 9:48 AM 8/27/20 9:48 AM -
You do not need to be a mechanic to drive
a car. AND You do not need to be a statistician to use R. Photo by Sven Vee on Unsplash -
“Using the data to guide the data analysis is almost
as dangerous as not doing so. ” - Frank Harrell -
You don’t need good breaks to go slow. Your car
has good breaks so you can go fast. Photo by Ioana Draghici on Unsplash In R - write tests! -
- ( , 1 ) ecie i e _le g
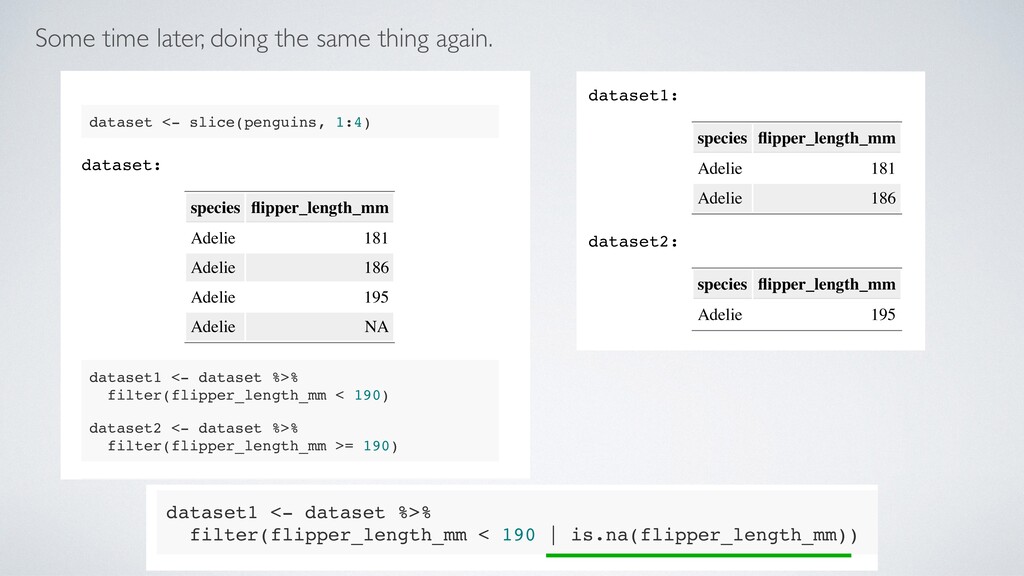
h_mm Ade e 181 Ade e 186 Ade e 195 1 - % % ( 1 0) - % % ( 1 0) 1 ecie i e _le g h_mm Ade e 181 Ade e 186 ecie i e _le g h_mm Ade e 195 - ( , 1 ) ecie i e _le g h_mm Ade e 181 Ade e 186 Ade e 195 1 - % % ( 1 0) - % % ( 1 0) 1 ecie i e _le g h_mm Ade e 181 Ade e 186 ecie i e _le g h_mm Ade e 195 Create two datasets using a filter: -
- ( , 1 4) ecie i e _le g
h_mm Ad 181 Ad 186 Ad 195 Ad NA 1 - % % ( 190) 2 - % % ( 190) 1 ecie i e _le g h_mm Ad 181 Ad 186 2 ecie i e _le g h_mm Ad 195 ( ( 1) + ( 2) ( )) ## ( 1) + ( 2) ( ) Some time later, doing the same thing again. - ( , 1 4) ecie i e _le g h_mm Ad 181 Ad 186 Ad 195 Ad NA 1 - % % ( 190) 2 - % % ( 190) 1 ecie i e _le g h_mm Ad 181 Ad 186 2 ecie i e _le g h_mm Ad 195 ( ( 1) + ( 2) ( )) ## ( 1) + ( 2) ( ) (" ' !" ( 1) + ( 2) ( )) - ( , 1 4) ecie i e _le g h_mm Ad 181 Ad 186 Ad 195 Ad NA 1 - % % ( 190) 2 - % % ( 190) 1 ecie i e Ad Ad 2 ecie i e Ad 1 - % % ( 190 . ( )) -
Photo by Long Ma on Unsplash You could have gone
faster with a test! Ad 181 Ad 186 Ad 195 Ad NA 1 - % % ( 190) 2 - % % ( 190) Ad 2 ecie i Ad 1 - % % ( 190 . ( )) ( ( 1) + ( 2) ( )) (" ' !" ( 1) + ( 2) Error: nrow(dataset1) + nrow(dataset2) == nrow(dataset) is not TRUE -
Why R For Health Data Science: • Because there’s so
much data! • The R community is strong and you can do this. • To go fast, make sure you can break.