Upgrade to Pro — share decks privately, control downloads, hide ads and more …

Apache Spark At Scale In The Cloud

Apache Spark At Scale In The Cloud

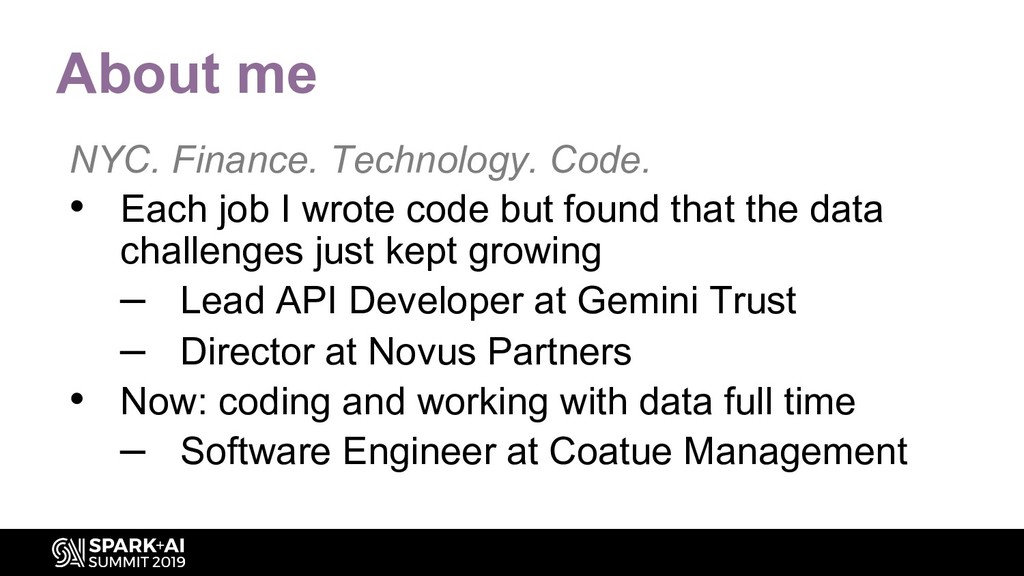
Spark+AI Summit Europe 2019 presentation
Video at https://databricks.com/session_eu19/apache-spark-at-scale-in-the-cloud

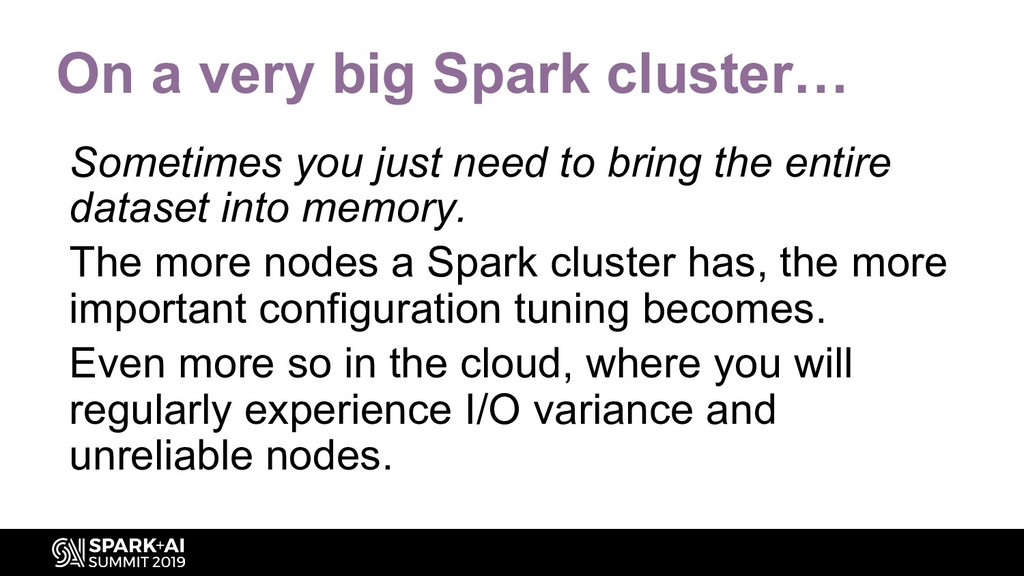
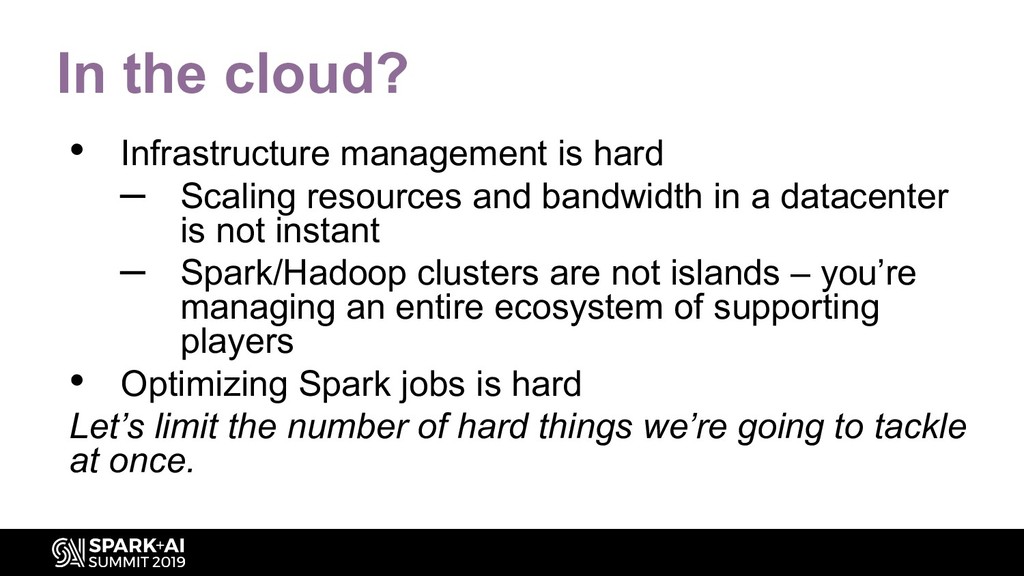
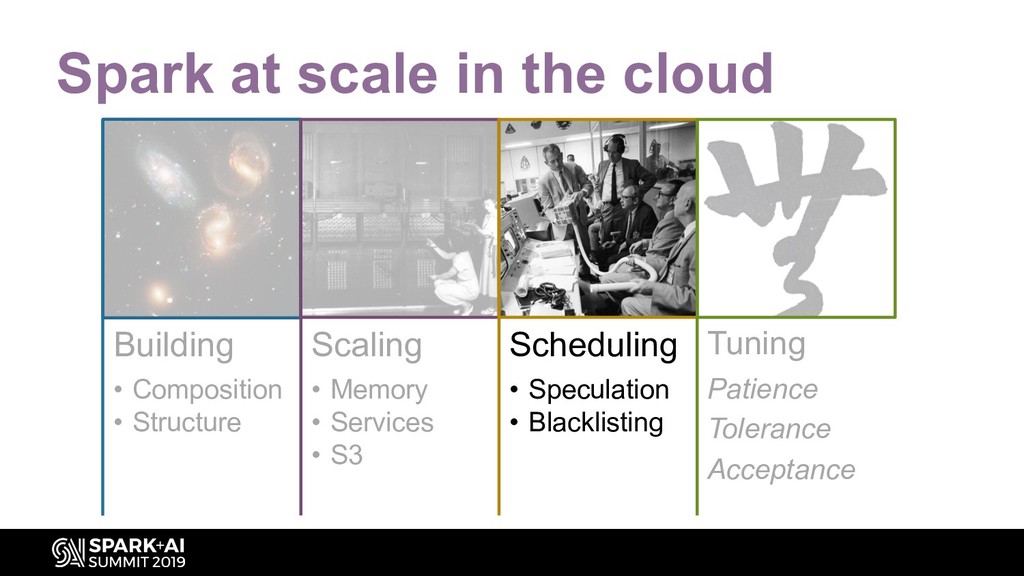
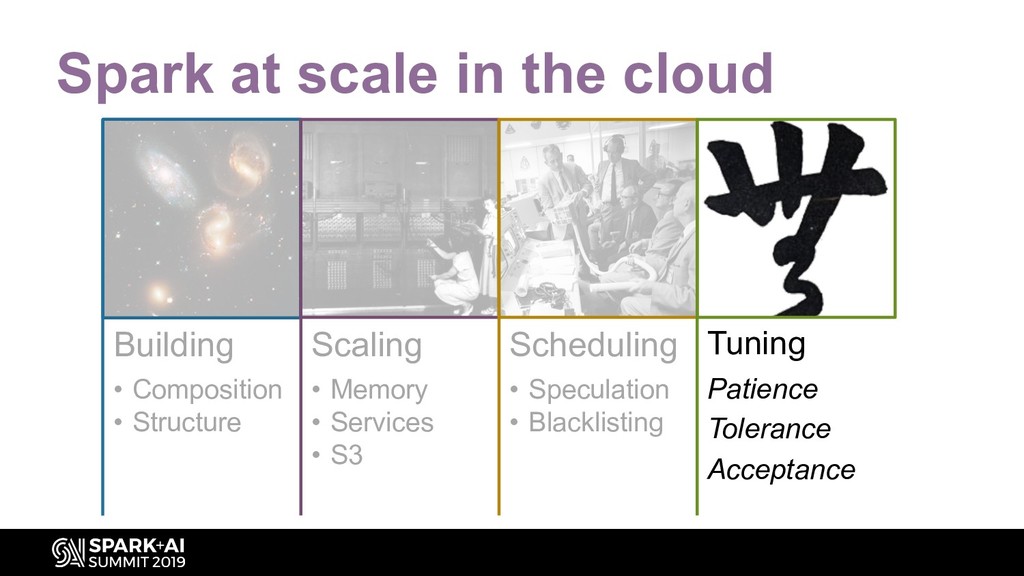
Using Apache Spark to analyze large datasets in the cloud presents a range of challenges. Different stages of your pipeline may be constrained by CPU, memory, disk and/or network IO. But what if all those stages have to run on the same cluster? In the cloud, you have limited control over the hardware your cluster runs on.

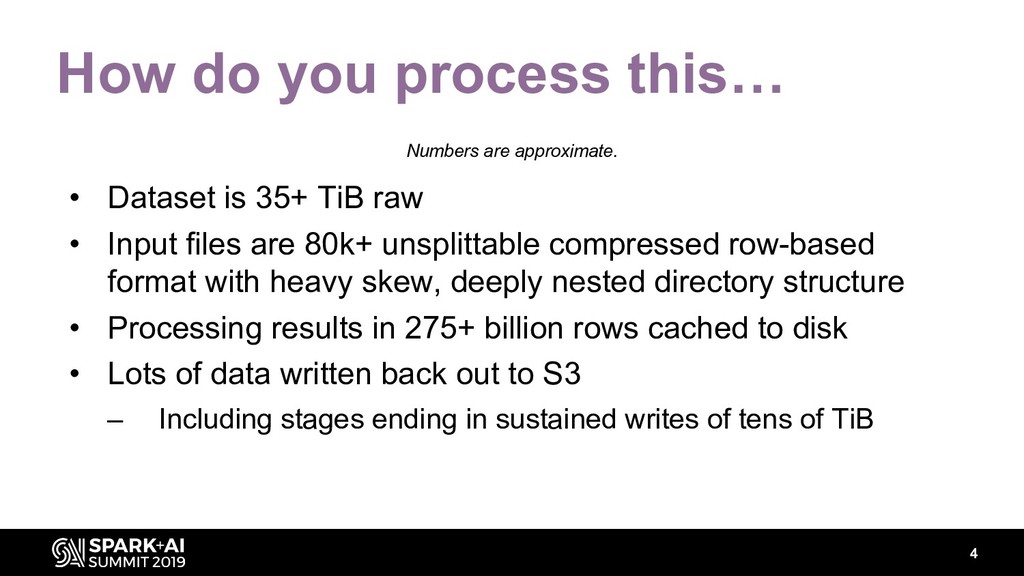
You may have even less control over the size and format of your raw input files. Performance tuning is an iterative and experimental process. It’s frustrating with very large datasets: what worked great with 30 billion rows may not work at all with 400 billion rows. But with strategic optimizations and compromises, 50+ TiB datasets can be no big deal.

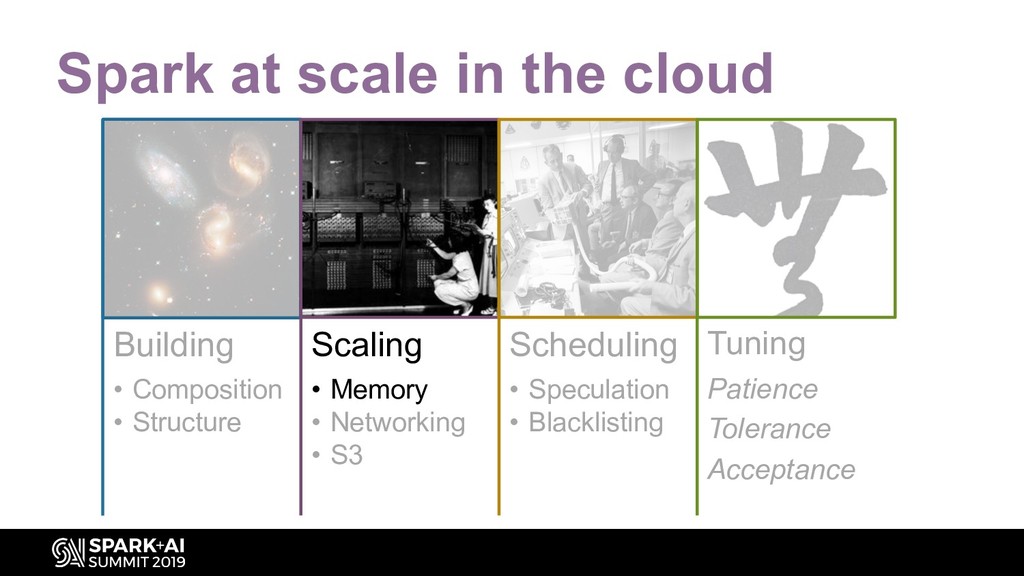
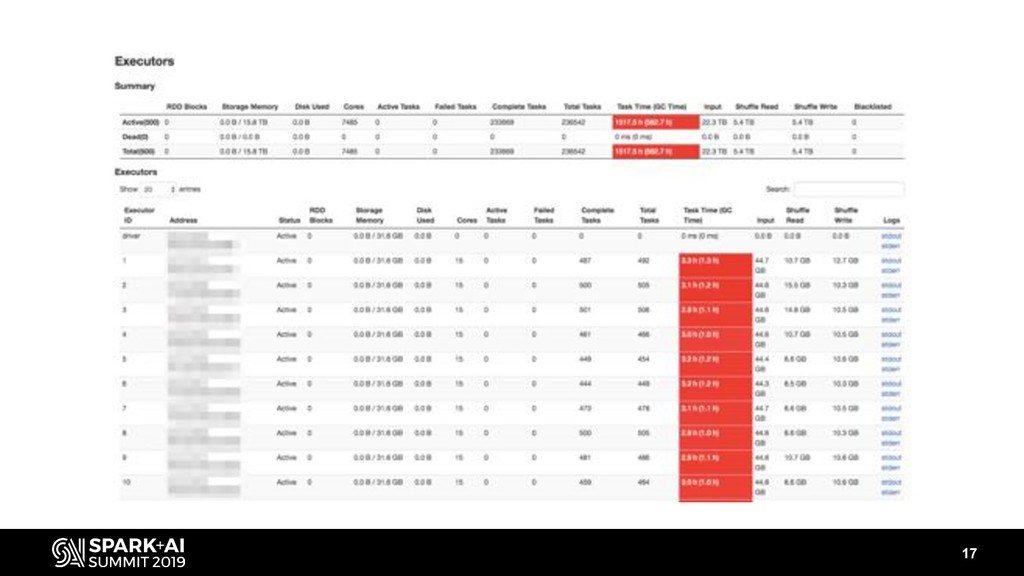
By using Spark UI and simple metrics, explore how to diagnose and remedy issues on jobs:

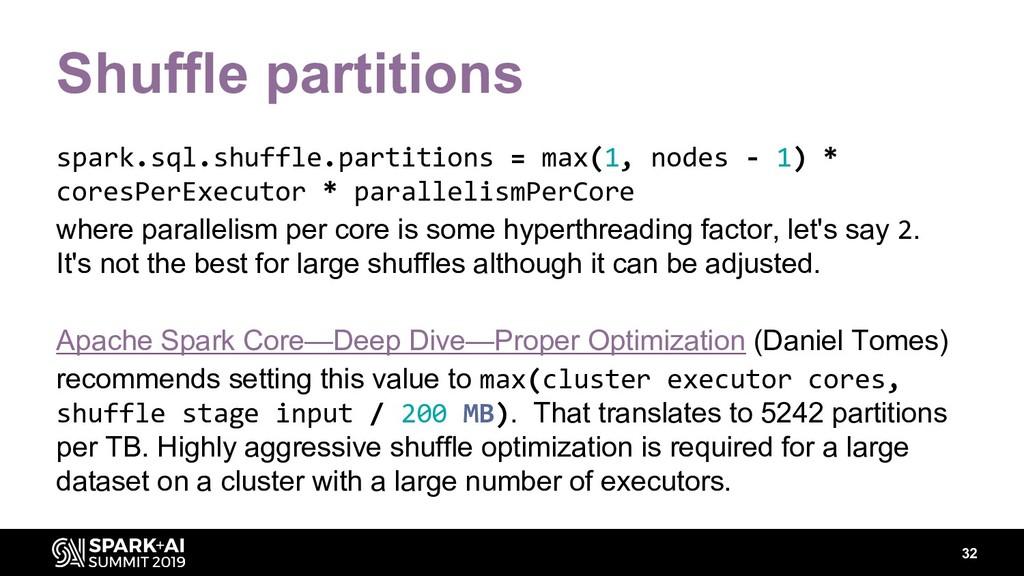
- Sizing the cluster based on your dataset (shuffle partitions)
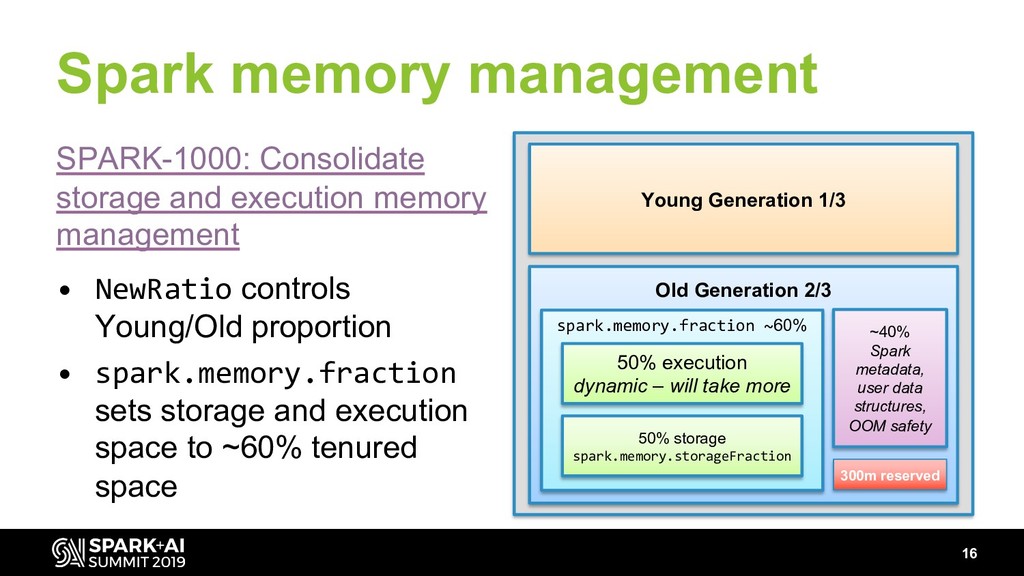
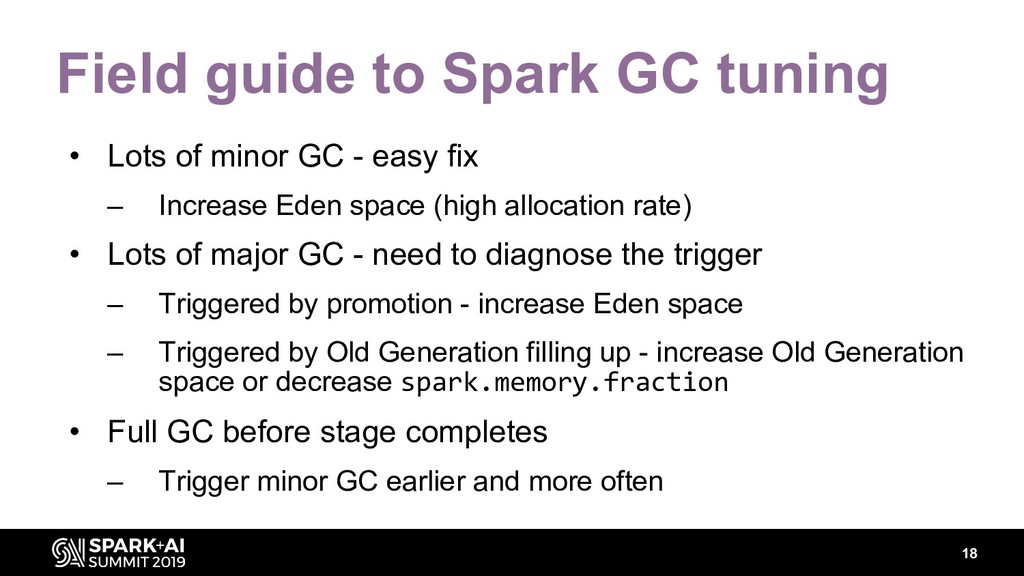
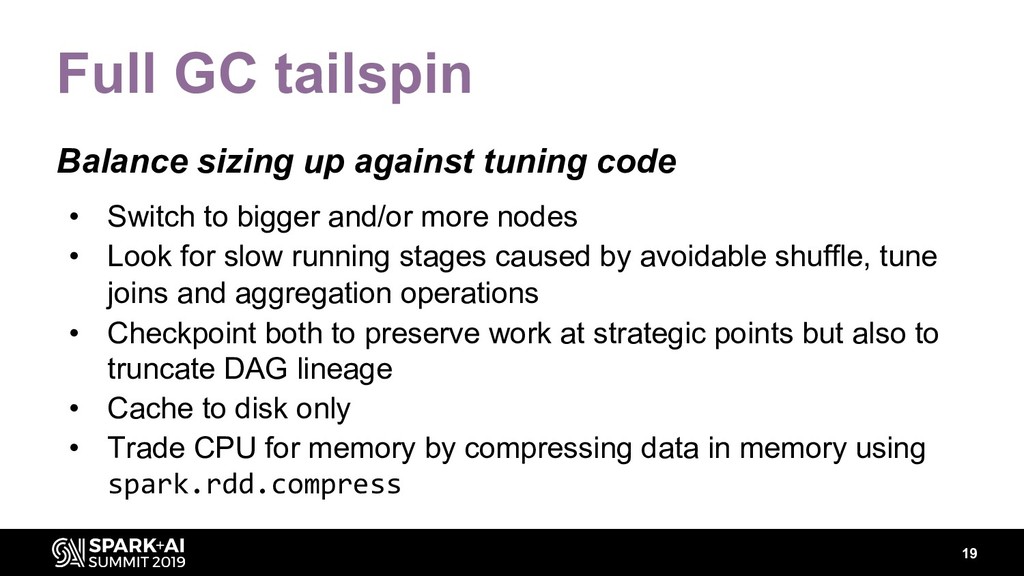
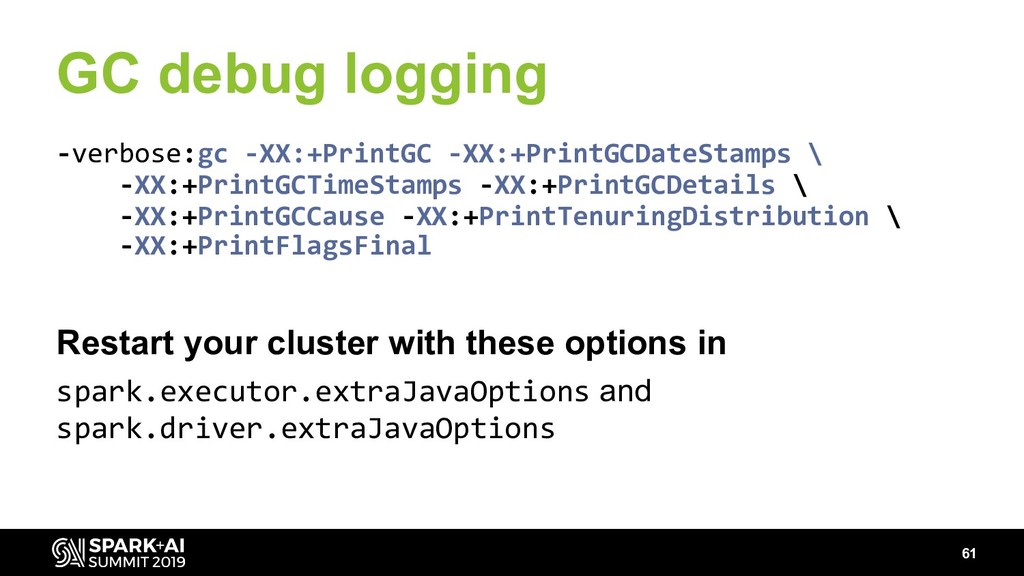
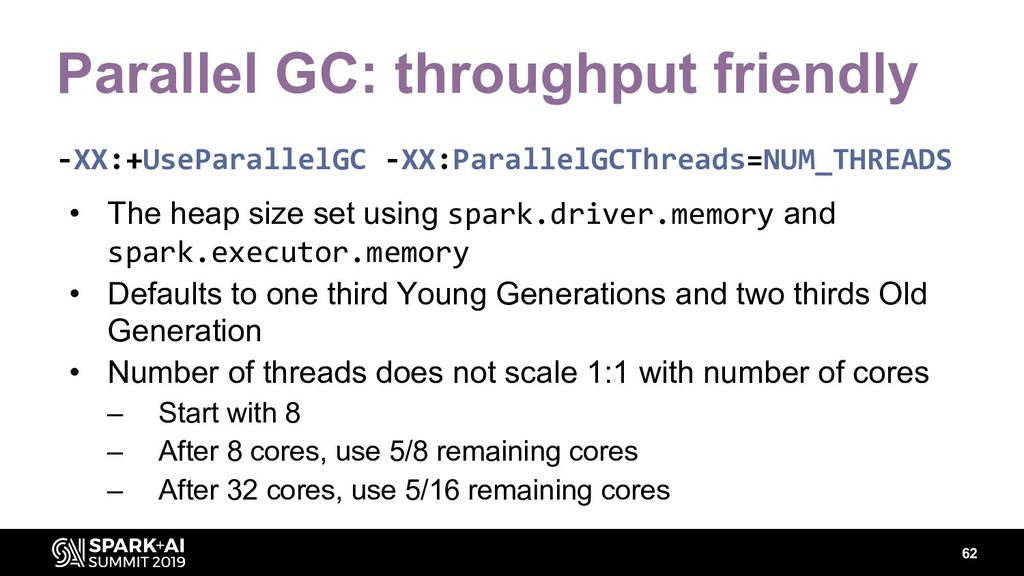
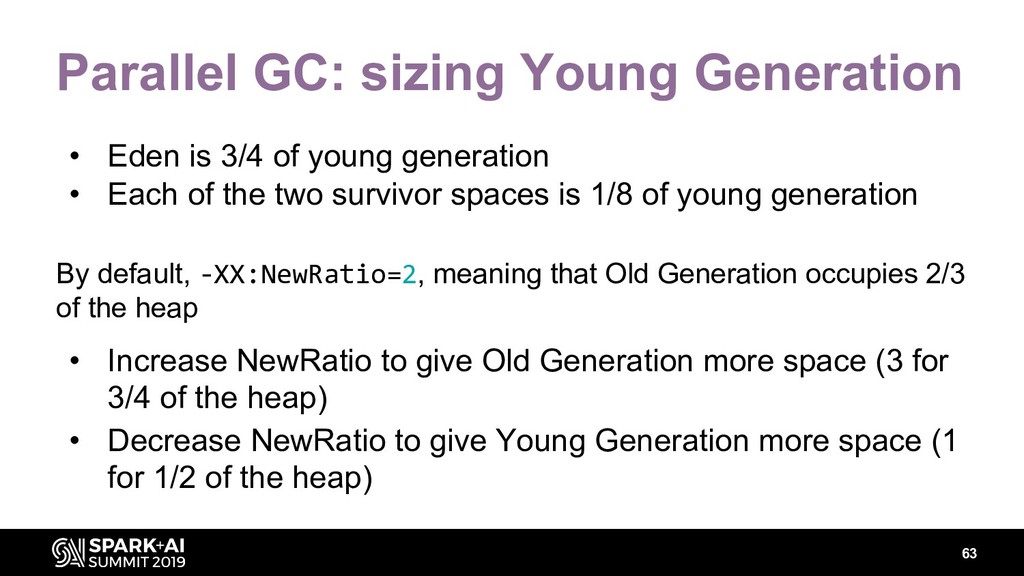
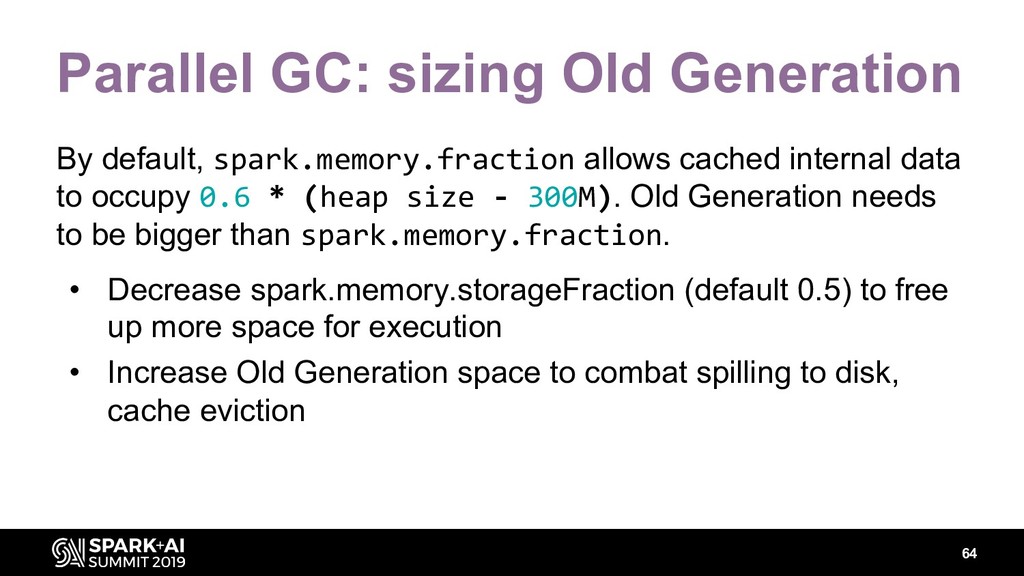
- Managing memory (sorting GC – when to go parallel, when to go G1, when offheap can help you)
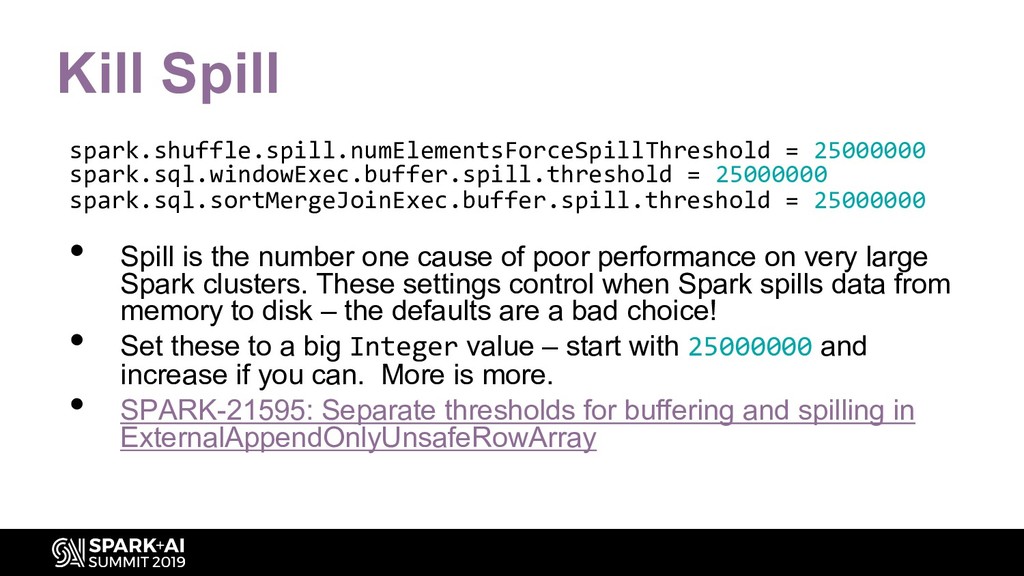
- Shuffle (give a little to get a lot – configs for better out of box shuffle) – Spill (partitioning for the win)
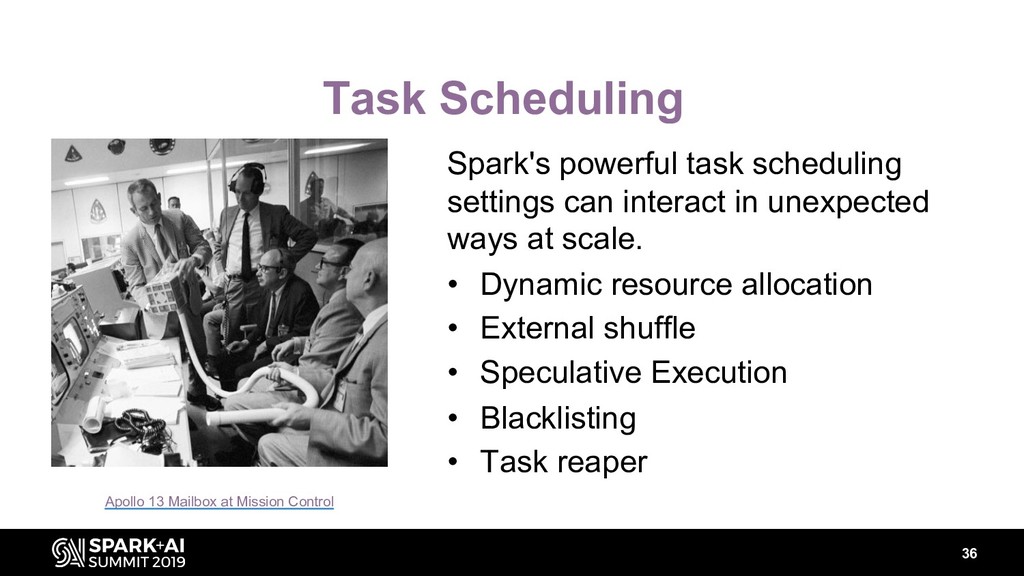
- Scheduling (FAIR vs FIFO, is there a difference for your pipeline?)
- Caching and persistence (it’s the cost of doing business, so what are your options?)
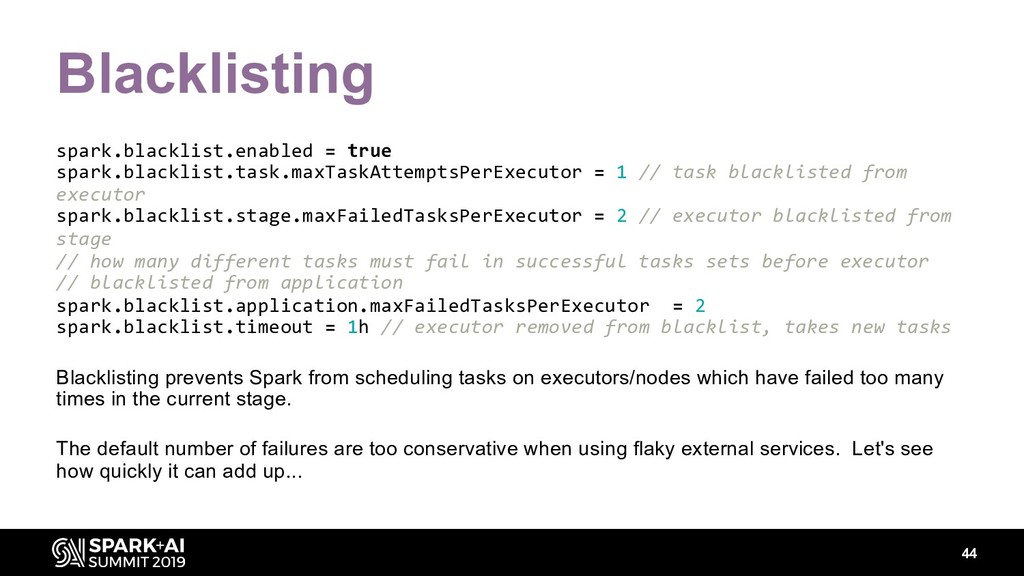
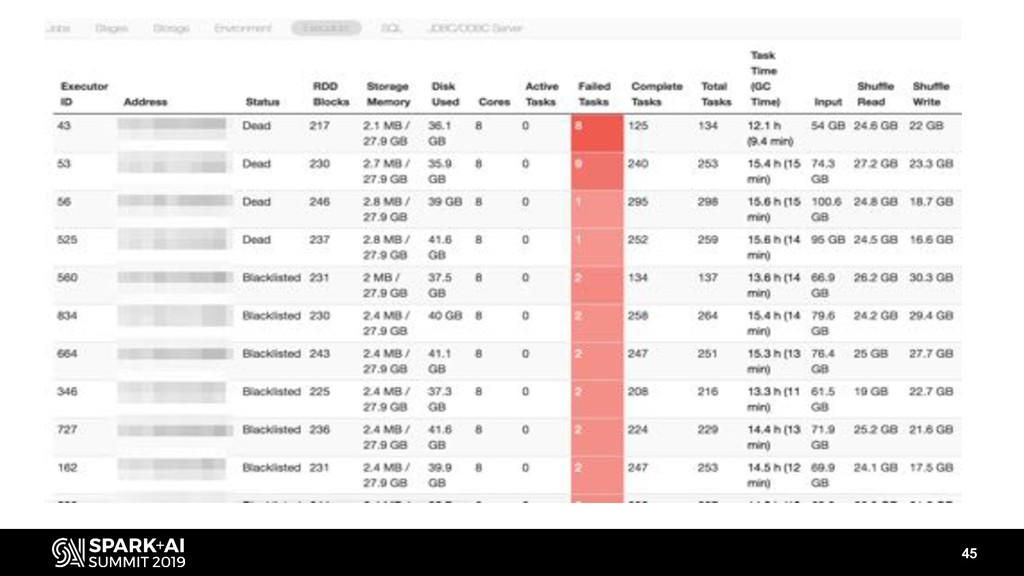
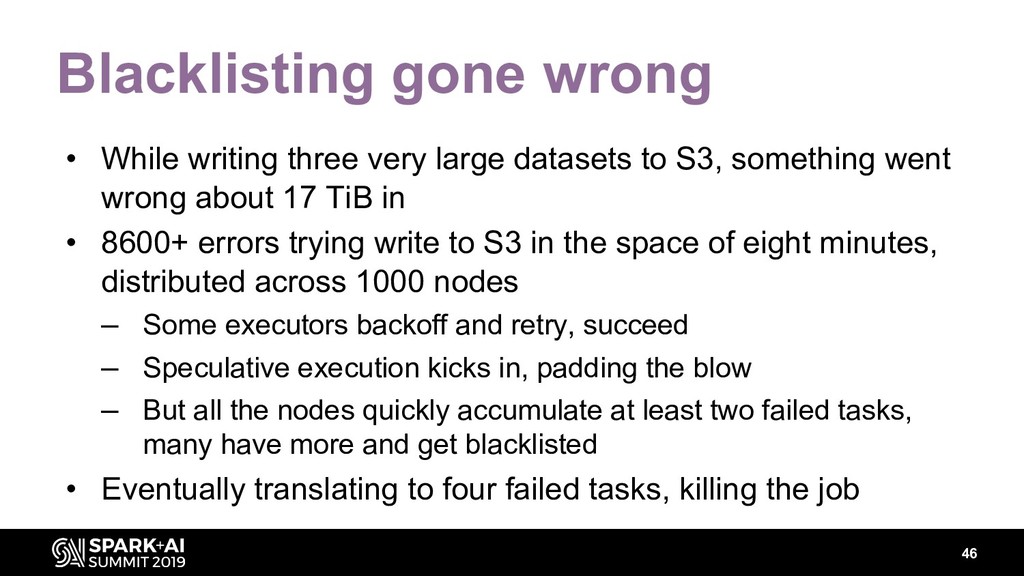
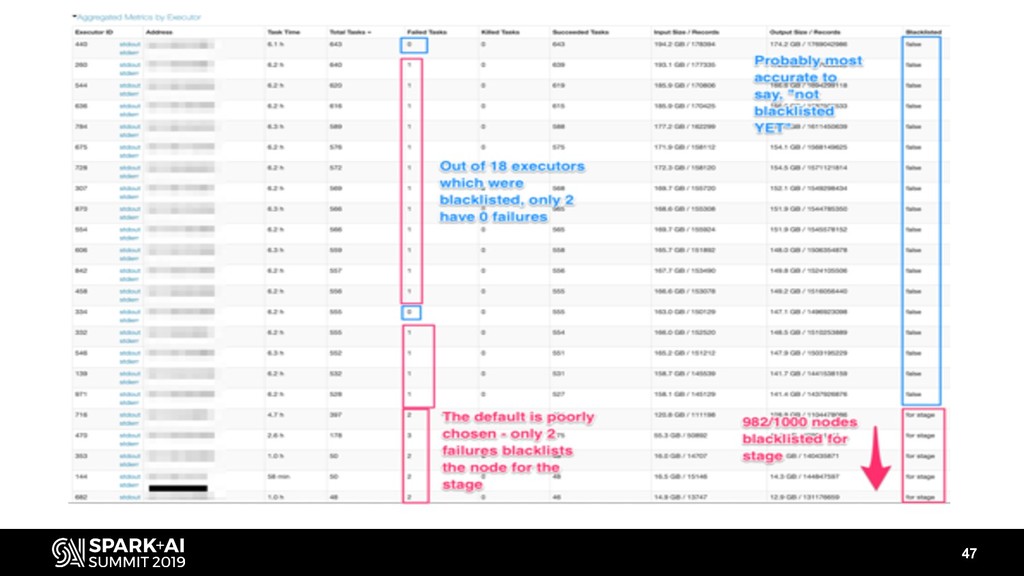
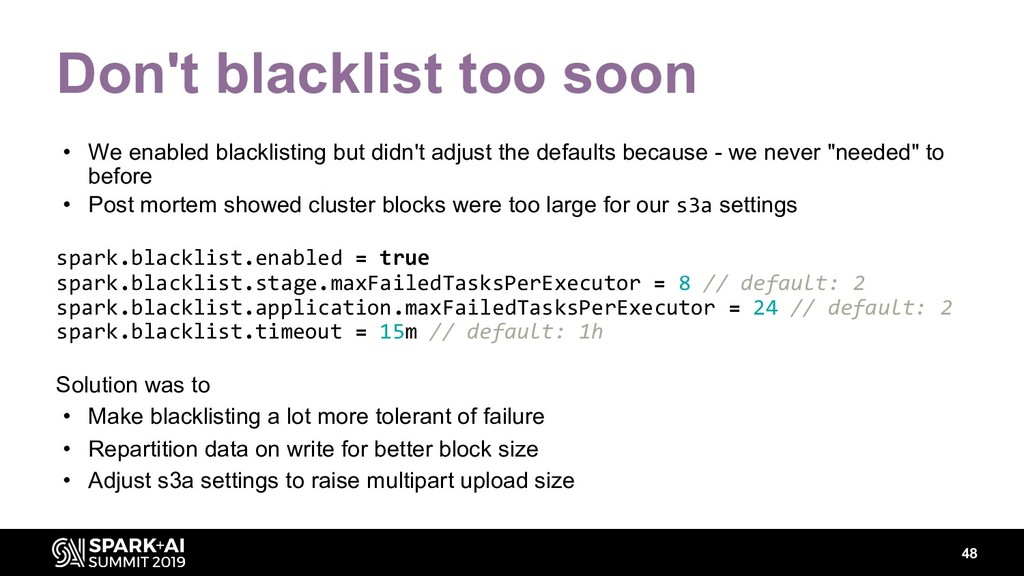
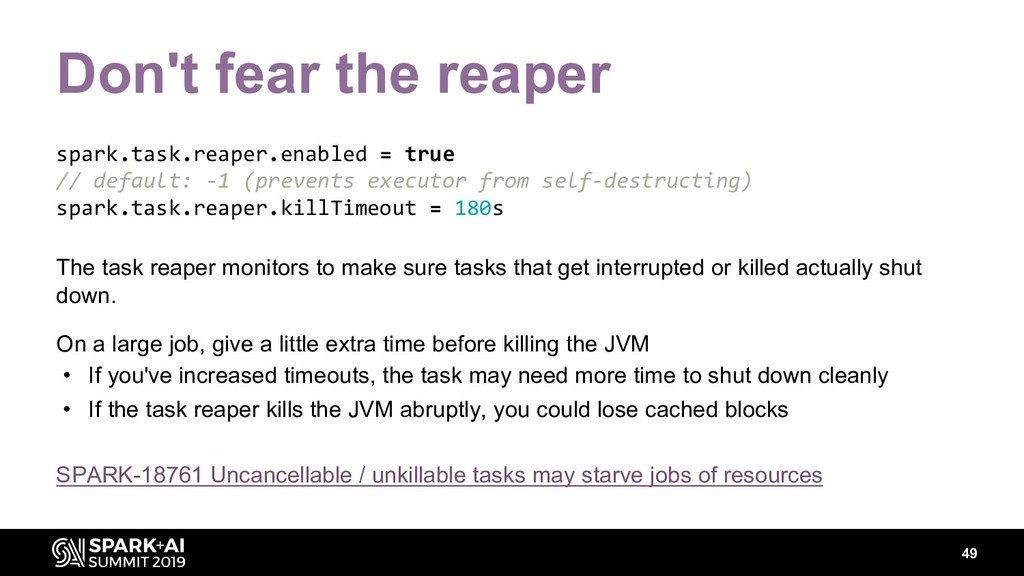
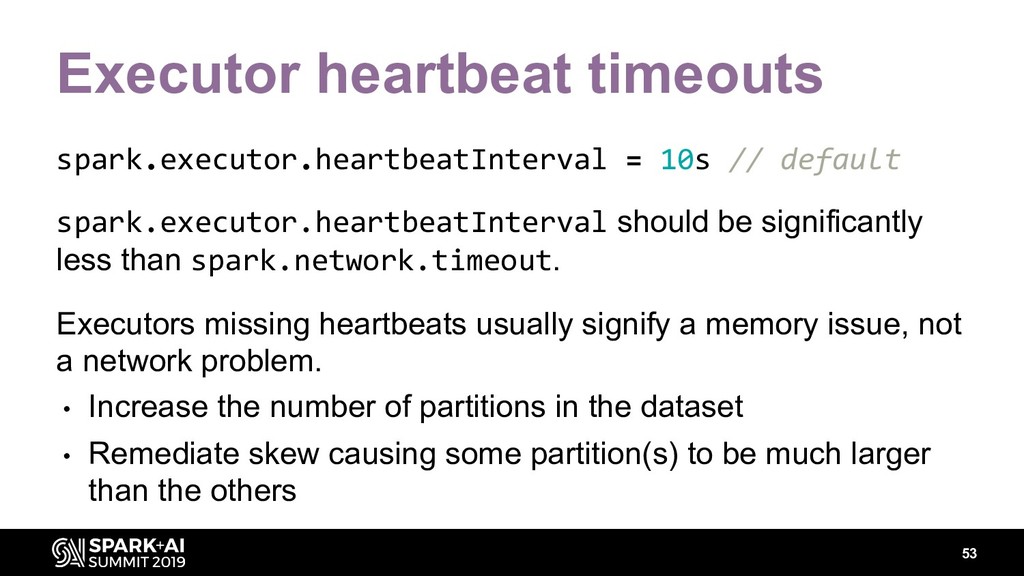
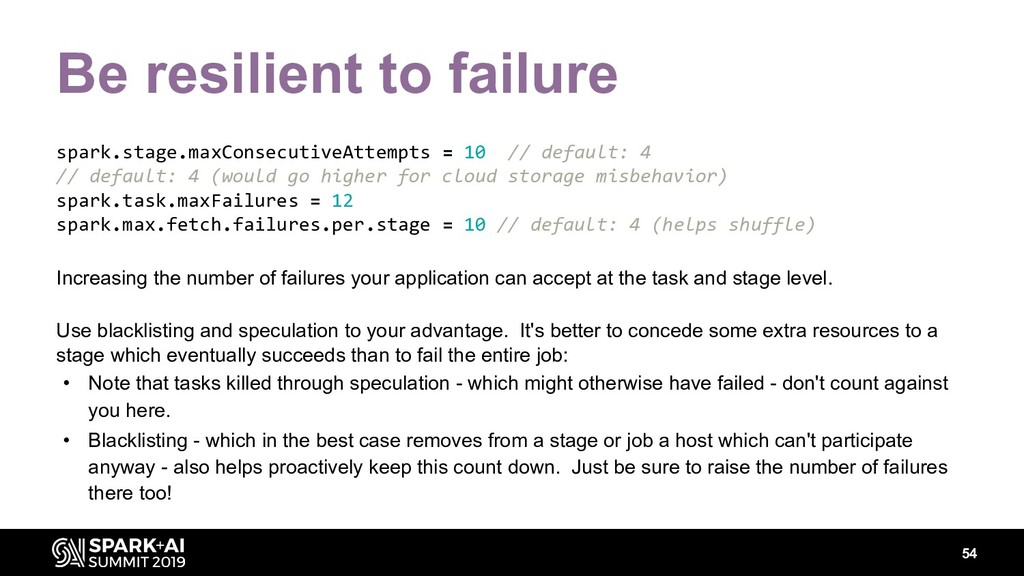
- Fault tolerance (blacklisting, speculation, task reaping)
- Making the best of a bad deal (skew joins, windowing, UDFs, very large query plans)
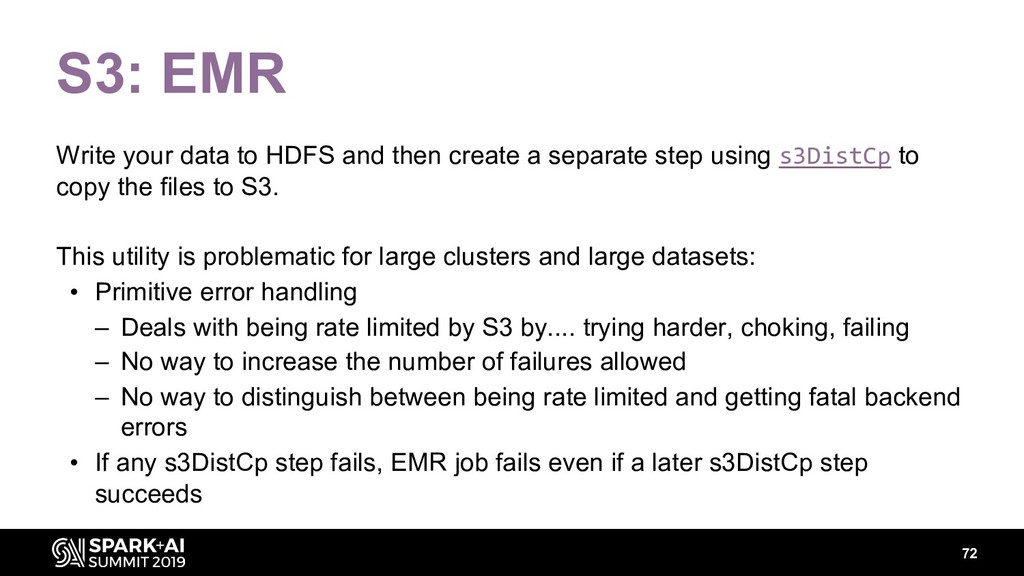
- Writing to S3 (dealing with write partitions, HDFS and s3DistCp vs writing directly to S3)

Avatar for Rose Toomey

Rose Toomey

October 16, 2019
Tweet

More Decks by Rose Toomey

Other Decks in Technology

Transcript

  1. Rose Toomey, Coatue Management Spark At Scale In the Cloud

    #UnifiedDataAnalytics #SparkAISummit
  2. About me NYC. Finance. Technology. Code. • Each job I

    wrote code but found that the data challenges just kept growing – Lead API Developer at Gemini Trust – Director at Novus Partners • Now: coding and working with data full time – Software Engineer at Coatue Management
  3. How do you process this… Numbers are approximate. • Dataset

    is 35+ TiB raw • Input files are 80k+ unsplittable compressed row-based format with heavy skew, deeply nested directory structure • Processing results in 275+ billion rows cached to disk • Lots of data written back out to S3 – Including stages ending in sustained writes of tens of TiB 4
  4. On a very big Spark cluster… Sometimes you just need

    to bring the entire dataset into memory. The more nodes a Spark cluster has, the more important configuration tuning becomes. Even more so in the cloud, where you will regularly experience I/O variance and unreliable nodes.
  5. In the cloud? • Infrastructure management is hard – Scaling

    resources and bandwidth in a datacenter is not instant – Spark/Hadoop clusters are not islands – you’re managing an entire ecosystem of supporting players • Optimizing Spark jobs is hard Let’s limit the number of hard things we’re going to tackle at once.
  6. Things going wrong at scale Everything is relative. In smaller

    clusters, these configurations worked fine. • Everything is waiting on everything else because Netty doesn't have enough firepower to shuffle faster • Speculation meets skew and relaunches the very slowest parts of a join, leaving most of the cluster idle • An external service rate limits, which causes blacklisting to sideline most of a perfectly good cluster 7
  7. Spark at scale in the cloud Building • Composition •

    Structure Scaling • Memory • Networking • S3 Scheduling • Speculation • Blacklisting Tuning Patience Tolerance Acceptance
  8. Putting together a big Spark cluster • What kind of

    nodes should the cluster have? Big? Small? Medium? • What's your resource limitation for the number of executors? – Just memory (standalone) – Both memory and vCPUs (YARN) • Individual executors should have how much memory and how many virtual CPUs? Galactic Wreckage in Stephan's Quintet 9
  9. One Very Big Standalone Node One mega instance configured with

    many "just right" executors, each provisioned with • < 32 GiB heap (sweet spot for GC) • 5 cores (for good throughput) • Minimizes shuffle overhead • Like the pony, not offered by your cloud provider. Also, poor fault tolerance. 10
  10. Multiple Medium-sized Nodes When looking at medium sized nodes, we

    have a choice: • Just one executor • Multiple executors But a single executor might not be the best resource usage: • More cores on a single executor is not necessarily better • When using a cluster manager like YARN, more executors could be a more efficient use of CPU and memory 11
  11. Many Small Nodes 12 • 500+ small nodes • Each

    node over-provisioned relative to multiple executor per node configurations • Single executor per node • Most fault tolerant but big communications overhead “Desperate affairs require desperate measures.” Vice Admiral Horatio Nelson
  12. Why ever choose the worst solution? Single executor per small

    (or medium) node is the worst configuration for cost, provisioning, and resource usage. Why not recommend against it? • Resilient to node degradation and loss • Quick transition to production: relative over-provisioning of resources to each executor behaves more like a notebook • Awkward instance sizes may provision more quickly than larger instances 13
  13. Onward! Now you have your cluster composition in mind, you’ll

    need to scale up your base infrastructure to support the number of nodes: • Memory and garbage collection • Tune RPC for cluster communications • Where do you put very large datasets? • How do you get them off the cluster? • No task left behind: scheduling in difficult times 14
  14. Spark at scale in the cloud Building • Composition •

    Structure Scaling • Memory • Networking • S3 Scheduling • Speculation • Blacklisting Tuning Patience Tolerance Acceptance
  15. Spark memory management SPARK-1000: Consolidate storage and execution memory management

    • NewRatio controls Young/Old proportion • spark.memory.fraction sets storage and execution space to ~60% tenured space 16 Young Generation 1/3 Old Generation 2/3 300m reserved spark.memory.fraction ~60% 50% execution dynamic – will take more 50% storage spark.memory.storageFraction ~40% Spark metadata, user data structures, OOM safety
  16. 17

  17. Field guide to Spark GC tuning • Lots of minor

    GC - easy fix – Increase Eden space (high allocation rate) • Lots of major GC - need to diagnose the trigger – Triggered by promotion - increase Eden space – Triggered by Old Generation filling up - increase Old Generation space or decrease spark.memory.fraction • Full GC before stage completes – Trigger minor GC earlier and more often 18
  18. Full GC tailspin Balance sizing up against tuning code •

    Switch to bigger and/or more nodes • Look for slow running stages caused by avoidable shuffle, tune joins and aggregation operations • Checkpoint both to preserve work at strategic points but also to truncate DAG lineage • Cache to disk only • Trade CPU for memory by compressing data in memory using spark.rdd.compress 19
  19. Which garbage collector? Throughput or latency? • ParallelGC favors throughput

    • G1GC is low latency – Shiny new things like string deduplication – vulnerable to wide rows Whichever you choose, collect early and often. 20
  20. Where to cache big datasets • To disk. Which is

    slow. • But frees up as much tenured space as possible for execution, and storing things which must be in memory – internal metadata – user data structures – broadcasting the skew side of joins 21
  21. 22

  22. Perils of caching to disk 19/04/13 01:27:33 WARN BlockManagerMasterEndpoint: No

    more replicas available for rdd_48_27005 ! When you lose an executor, you lose all the cached blocks stored by that executor even if the node is still running. • If lineage is gone, the entire job will fail • If lineage is present, RDD#getOrCompute tries to compensate for the missing blocks by re-ingesting the source data. While it keeps your job from failing, this could introduce enormous slowdowns if the source data is skewed, your ingestion process is complex, etc. 23
  23. Self healing block management // use this with replication >=

    2 when caching to disk in non-distributed filesystem spark.storage.replication.proactive = true Pro-active block replenishment in case of node/executor failures https://issues.apache.org/jira/browse/SPARK-15355 https://github.com/apache/spark/pull/14412 24
  24. Spark at scale in the cloud Building • Composition •

    Structure Scaling • Memory • Networking • S3 Scheduling • Speculation • Blacklisting Tuning Patience Tolerance Acceptance
  25. Tune RPC for cluster communications Netty server processing RPC requests

    is the backbone of both authentication and shuffle services. Insufficient RPC resources cause slow speed mayhem: clients disassociate, operations time out. org.apache.spark.network.util. TransportConf is the shared config for both shuffle and authentication services. Ruth Teitelbum and Marlyn Meltzer reprogramming ENIAC, 1946 26
  26. Scaling RPC // used for auth spark.rpc.io.serverThreads = coresPerDriver *

    rpcThreadMultiplier // used for shuffle spark.shuffle.io.serverThreads = coresPerDriver * rpcThreadMultiplier Where "RPC thread multiplier" is a scaling factor to increase the service's thread pool. • 8 is aggressive, might cause issues • 4 is moderately aggressive • 2 is recommended (start here, benchmark, then increase) • 1 (number of vCPU cores) is default but is too small for a large cluster 27
  27. Shuffle The definitive presentation on shuffle tuning: Tuning Apache Spark

    for Large-Scale Workloads (Gaoxiang Liu and Sital Kedia) So this section focuses on • Some differences to configurations presented in Liu and Kedia's presentation, as well as • Configurations that weren't shown in this presentation 28
  28. Strategy for lots of shuffle clients 1. Scale the server

    way up // mentioned in Liu/Kedia presentation but now deprecated // spark.shuffle.service.index.cache.entries = 2048 // default: 100 MiB spark.shuffle.service.index.cache.size = 256m // length of accept queue. default: 64 spark.shuffle.io.backLog = 8192 // default (not increased by spark.network.timeout) spark.rpc.lookupTimeout = 120s 29
  29. Strategy for lots of shuffle clients 2. make clients more

    patient, more fault tolerant, fewer simultaneous requests in flight spark.reducer.maxReqsInFlight = 5 // default: Int.MaxValue spark.shuffle.io.maxRetries = 10 // default: 3 spark.shuffle.io.retryWait = 60s // default 5s 30
  30. Strategy for lots of shuffle clients spark.shuffle.io.numConnectionsPerPeer = 1 Scaling

    this up conservatively for multiple executor per node configurations can be helpful. Not recommended to change the default for single executor per node. 31
  31. Shuffle partitions spark.sql.shuffle.partitions = max(1, nodes - 1) * coresPerExecutor

    * parallelismPerCore where parallelism per core is some hyperthreading factor, let's say 2. It's not the best for large shuffles although it can be adjusted. Apache Spark Core—Deep Dive—Proper Optimization (Daniel Tomes) recommends setting this value to max(cluster executor cores, shuffle stage input / 200 MB). That translates to 5242 partitions per TB. Highly aggressive shuffle optimization is required for a large dataset on a cluster with a large number of executors. 32
  32. Kill Spill spark.shuffle.spill.numElementsForceSpillThreshold = 25000000 spark.sql.windowExec.buffer.spill.threshold = 25000000 spark.sql.sortMergeJoinExec.buffer.spill.threshold =

    25000000 • Spill is the number one cause of poor performance on very large Spark clusters. These settings control when Spark spills data from memory to disk – the defaults are a bad choice! • Set these to a big Integer value – start with 25000000 and increase if you can. More is more. • SPARK-21595: Separate thresholds for buffering and spilling in ExternalAppendOnlyUnsafeRowArray
  33. Scaling AWS S3 Writes Hadoop AWS S3 support in 3.2.0

    is amazing • Especially the new S3A committers https://hadoop.apache.org/docs/r3.2.0/hado op-aws/tools/hadoop-aws/index.html EMR: write to HDFS and copy off using s3DistCp (limit reducers if necessary) Databricks: writing directly to S3 just works First NASA ISINGLASS rocket launch 34
  34. Spark at scale in the cloud Building • Composition •

    Structure Scaling • Memory • Services • S3 Scheduling • Speculation • Blacklisting Tuning Patience Tolerance Acceptance
  35. Task Scheduling Spark's powerful task scheduling settings can interact in

    unexpected ways at scale. • Dynamic resource allocation • External shuffle • Speculative Execution • Blacklisting • Task reaper Apollo 13 Mailbox at Mission Control 36
  36. Dynamic resource allocation Dynamic resource allocation benefits a multi-tenant cluster

    where multiple applications can share resources. If you have an ETL pipeline running on a large transient Spark cluster, dynamic allocation is not useful to your single application. Note that even in the first case, when your application no longer needs some executors, those cluster nodes don't get spun down: • Dynamic allocation requires an external shuffle service • The node stays live and shuffle blocks continue to be served from it 37
  37. External shuffle service spark.shuffle.service.enabled = true spark.shuffle.registration.timeout = 60000 //

    default: 5ms spark.shuffle.registration.maxAttempts = 5 // default: 3 Even without dynamic allocation, an external shuffle service may be a good idea. • If you lose executors through dynamic allocation, the external shuffle process still serves up those blocks. • The external shuffle service could be more responsive than the executor itself However, the registration values are insufficient for a large busy cluster: SPARK-20640 Make rpc timeout and retry for shuffle registration configurable 38
  38. Speculative execution When speculative execution works as intended, tasks running

    slowly due to transient node issues don't bog down that stage indefinitely. • Spark calculates the median execution time of all tasks in the stage • spark.speculation.quantile - don't start speculating until this percentage of tasks are complete (default 0.75) • spark.speculation.multiplier - expressed as a multiple of the median execution time, this is how slow a task must be to be considered for speculation • Whichever task is still running when the first finishes gets killed 39
  39. One size does not fit all spark.speculation = true spark.speculation.quantile

    = 0.8 //default: 0.75 spark.speculation.multiplier = 4 // default: 1.5 These were our standard speculative execution settings. They worked "fine" in most of our pipelines. But they worked fine because the median size of the tasks at 80% was OK. What happens when reasonable settings meet unreasonable data? 40
  40. Speculation: unintended consequences The median task length is based on

    the fast 80% - but due to heavy skew, this estimate is bad! Causing the scheduler to take the worst part of the job and … launches more copies of the worst longest running tasks ... one of which then gets killed. spark.speculation = true // start later (might get a better estimate) spark.speculation.quantile = 0.90 // default 1.5 - require a task to be really bad spark.speculation.multiplier = 6 The solution was two-fold: • Start speculative execution later (increase the quantile) and require a greater slowness multiplier • Do something about the skew 42
  41. Benefits of speculative execution • Speculation can be very helpful

    when the application is interacting with an external service. Example: writing to S3 • When speculation kills a task that was going to fail anyway, it doesn't count against the failed tasks for that stage/executor/node/job • Clusters are not tuned in a day! Speculation can help pave over slowdowns caused by scaling issues • Useful canary: when you see tasks being intentionally killed in any quantity, it's worth investigating why 43
  42. Blacklisting spark.blacklist.enabled = true spark.blacklist.task.maxTaskAttemptsPerExecutor = 1 // task blacklisted

    from executor spark.blacklist.stage.maxFailedTasksPerExecutor = 2 // executor blacklisted from stage // how many different tasks must fail in successful tasks sets before executor // blacklisted from application spark.blacklist.application.maxFailedTasksPerExecutor = 2 spark.blacklist.timeout = 1h // executor removed from blacklist, takes new tasks Blacklisting prevents Spark from scheduling tasks on executors/nodes which have failed too many times in the current stage. The default number of failures are too conservative when using flaky external services. Let's see how quickly it can add up... 44
  43. 45

  44. Blacklisting gone wrong • While writing three very large datasets

    to S3, something went wrong about 17 TiB in • 8600+ errors trying write to S3 in the space of eight minutes, distributed across 1000 nodes – Some executors backoff and retry, succeed – Speculative execution kicks in, padding the blow – But all the nodes quickly accumulate at least two failed tasks, many have more and get blacklisted • Eventually translating to four failed tasks, killing the job 46
  45. 47

  46. Don't blacklist too soon • We enabled blacklisting but didn't

    adjust the defaults because - we never "needed" to before • Post mortem showed cluster blocks were too large for our s3a settings spark.blacklist.enabled = true spark.blacklist.stage.maxFailedTasksPerExecutor = 8 // default: 2 spark.blacklist.application.maxFailedTasksPerExecutor = 24 // default: 2 spark.blacklist.timeout = 15m // default: 1h Solution was to • Make blacklisting a lot more tolerant of failure • Repartition data on write for better block size • Adjust s3a settings to raise multipart upload size 48
  47. Don't fear the reaper spark.task.reaper.enabled = true // default: -1

    (prevents executor from self-destructing) spark.task.reaper.killTimeout = 180s The task reaper monitors to make sure tasks that get interrupted or killed actually shut down. On a large job, give a little extra time before killing the JVM • If you've increased timeouts, the task may need more time to shut down cleanly • If the task reaper kills the JVM abruptly, you could lose cached blocks SPARK-18761 Uncancellable / unkillable tasks may starve jobs of resources 49
  48. Spark at scale in the cloud Building • Composition •

    Structure Scaling • Memory • Services • S3 Scheduling • Speculation • Blacklisting Tuning Patience Tolerance Acceptance
  49. Increase tolerance • If you find a timeout or number

    of retries, raise it • If you find a buffer, backlog, queue, or threshold, increase it • If you have a MR task with a number of reducers trying to use a service concurrently in a large cluster – Either limit the number of active tasks per reducer, or – Limit the number of reducers active at the same time 51
  50. Be more patient // default - might be too low

    for a large cluster under load spark.network.timeout = 120s Spark has a lot of different networking timeouts. This is the biggest knob to turn: increasing this increases many settings at once. (This setting does not increase the spark.rpc.timeout used by shuffle and authentication services.) 52
  51. Executor heartbeat timeouts spark.executor.heartbeatInterval = 10s // default spark.executor.heartbeatInterval should

    be significantly less than spark.network.timeout. Executors missing heartbeats usually signify a memory issue, not a network problem. • Increase the number of partitions in the dataset • Remediate skew causing some partition(s) to be much larger than the others 53
  52. Be resilient to failure spark.stage.maxConsecutiveAttempts = 10 // default: 4

    // default: 4 (would go higher for cloud storage misbehavior) spark.task.maxFailures = 12 spark.max.fetch.failures.per.stage = 10 // default: 4 (helps shuffle) Increasing the number of failures your application can accept at the task and stage level. Use blacklisting and speculation to your advantage. It's better to concede some extra resources to a stage which eventually succeeds than to fail the entire job: • Note that tasks killed through speculation - which might otherwise have failed - don't count against you here. • Blacklisting - which in the best case removes from a stage or job a host which can't participate anyway - also helps proactively keep this count down. Just be sure to raise the number of failures there too! 54
  53. Koan A Spark job that is broken is only a

    special case of a Spark job that is working. Koan Mu calligraphy by Brigitte D'Ortschy is licensed under CC BY 3.0 55
  54. Interested? • What we do: data engineering @ Coatue ‒

    Terabyte scale, billions of rows ‒ Lambda architecture ‒ Functional programming • Stack ‒ Scala (cats, shapeless, fs2, http4s) ‒ Spark / Hadoop / EMR / Databricks ‒ Data warehouses ‒ Python / R / Tableau ‒ Chat with me or email: [email protected] ‒ Twitter: @prasinous 56
  55. Desirable heap size for executors spark.executor.memory = ??? JVM flag

    -XX:+UseCompressedOops allows you to use 4-byte pointers instead of 8 (on by default in JDK 7+). < 32 GB good for prompt GC, supports compressed OOPs. 32-48 GB "dead zone." without compressed OOPs over 32 GB, you need almost 48GB to hold the same number of objects. 49 - 64+ GB very large joins or special case with wide rows and G1GC. 58
  56. How many concurrent tasks per executor? spark.executor.cores = ??? Defaults

    to number of physical cores, but represents the maximum number of concurrent tasks that can run on a single executor. < 2 Too few cores. Doesn't make good use of parallelism. 2 - 4 recommended size for "most" spark apps. 5 HDFS client performance tops out. > 8 Too many cores. Overhead from context switching outweighs benefit. 59
  57. Memory • Spark docs: Garbage Collection Tuning • Distribution of

    Executors, Cores and Memory for a Spark Application running in Yarn (spoddutur.github.io/spark-notes) • How-to: Tune Your Apache Spark Jobs (Part 2) - (Sandy Ryza) • Why Your Spark Applications Are Slow or Failing, Part 1: Memory Management (Rishitesh Mishra) • Why 35GB Heap is Less Than 32GB – Java JVM Memory Oddities (Fabian Lange) • Everything by Aleksey Shipilëv at https://shipilev.net/, @shipilev, or anywhere else 60
  58. GC debug logging Restart your cluster with these options in

    spark.executor.extraJavaOptions and spark.driver.extraJavaOptions -verbose:gc -XX:+PrintGC -XX:+PrintGCDateStamps \ -XX:+PrintGCTimeStamps -XX:+PrintGCDetails \ -XX:+PrintGCCause -XX:+PrintTenuringDistribution \ -XX:+PrintFlagsFinal 61
  59. Parallel GC: throughput friendly -XX:+UseParallelGC -XX:ParallelGCThreads=NUM_THREADS • The heap size

    set using spark.driver.memory and spark.executor.memory • Defaults to one third Young Generations and two thirds Old Generation • Number of threads does not scale 1:1 with number of cores – Start with 8 – After 8 cores, use 5/8 remaining cores – After 32 cores, use 5/16 remaining cores 62
  60. Parallel GC: sizing Young Generation • Eden is 3/4 of

    young generation • Each of the two survivor spaces is 1/8 of young generation By default, -XX:NewRatio=2, meaning that Old Generation occupies 2/3 of the heap • Increase NewRatio to give Old Generation more space (3 for 3/4 of the heap) • Decrease NewRatio to give Young Generation more space (1 for 1/2 of the heap) 63
  61. Parallel GC: sizing Old Generation By default, spark.memory.fraction allows cached

    internal data to occupy 0.6 * (heap size - 300M). Old Generation needs to be bigger than spark.memory.fraction. • Decrease spark.memory.storageFraction (default 0.5) to free up more space for execution • Increase Old Generation space to combat spilling to disk, cache eviction 64
  62. G1 GC: latency friendly -XX:+UseG1GC -XX:ParallelGCThreads=X \ -XX:ConcGCThreads=(2*X) Parallel GC

    threads are the "stop the world" worker threads. Defaults to the same calculation as parallel GC; some articles recommend 8 + max(0, cores - 8) * 0.625. Concurrent GC threads mark in parallel with the running application. The default of a quarter as many threads as used for parallel GC may be conservative for a large Spark application. Several articles recommended scaling this number of thread up in conjunction with a lower initiating heap occupancy. Garbage First Garbage Collector Tuning (Monica Beckwith) 65
  63. G1 GC logging Same as shown for parallel GC, but

    also -XX:+UnlockDiagnosticVMOptions \ -XX:+PrintAdaptiveSizePolicy \ -XX:+G1SummarizeConcMark G1 offers a range of GC logging information on top of the standard parallel GC logging options. Collecting and reading G1 garbage collector logs - part 2 (Matt Robson) 66
  64. G1 Initiating heap occupancy -XX:InitiatingHeapOccupancyPercent=35 By default, G1 GC will

    initiate garbage collection when the heap is 45 percent full. This can lead to a situation where full GC is necessary before the less costly concurrent phase has run or completed. By triggering concurrent GC sooner and scaling up the number of threads available to perform the concurrent work, the more aggressive concurrent phase can forestall full collections. Best practices for successfully managing memory for Apache Spark applications on Amazon EMR (Karunanithi Shanmugam) Taming GC Pauses for Humongous Java Heaps in Spark Graph Computing (Eric Kaczmarek and Liqi Yi, Intel) 67
  65. G1 Region size -XX:G1HeapRegionSize=16 The heap defaults to region size

    between 1 and 32 MiB. For example, a heap with <= 32 GiB has a region size of 8 MiB; one with <= 16 GiB has 4 MiB. If you see Humongous Allocation in your GC logs, indicating an object which occupies > 50% of your current region size, then consider increasing G1HeapRegionSize. Changing this setting is not recommended for most cases because • Increasing region size reduces the number of available regions, plus • The additional cost of copying/cleaning up the larger regions may reduce throughput or increase latency Most commonly caused by a dataset with very wide rows. If you can't improve G1 performance, switch back to parallel GC. Plumbr.io handbook: GC Tuning: In Practice: Other Examples: Humongous Allocations 68
  66. G1 string deduplication -XX:+UseStringDeduplication \ -XX:+PrintStringDeduplicationStatistics May decrease your memory

    usage if you have a significant number of duplicate String instances in memory. JEP 192: String Deduplication in G1 69
  67. Shuffle • Scaling Apache Spark at Facebook (Ankit Agarwal and

    Sameer Agarwal) • Spark Shuffle Deep Dive (Bo Yang) These older presentations sometimes pertain to previous versions of Spark but still have substantial value. • Optimal Strategies for Large Scale Batch ETL Jobs (Emma Tang) - 2017 • Apache Spark @Scale: A 60 TB+ production use case from Facebook (Sital Kedia, Shuojie Wang and Avery Ching) - 2016 • Apache Spark the fastest open source engine for sorting a petabyte (Reynold Xin) - 2014 70
  68. S3 • Best Practices Design Patterns: Optimizing Amazon S3 Performance

    (Mai-Lan Tomsen Bukovec, Andy Warfield, and Tim Harris) • Seven Tips for Using S3DistCp on Amazon EMR to Move Data Efficiently Between HDFS and Amazon S3 (Illya Yalovyy) • Cost optimization through performance improvement of S3DistCp (Sarang Anajwala) 71
  69. S3: EMR Write your data to HDFS and then create

    a separate step using s3DistCp to copy the files to S3. This utility is problematic for large clusters and large datasets: • Primitive error handling – Deals with being rate limited by S3 by.... trying harder, choking, failing – No way to increase the number of failures allowed – No way to distinguish between being rate limited and getting fatal backend errors • If any s3DistCp step fails, EMR job fails even if a later s3DistCp step succeeds 72
  70. Using s3DistCp on a large cluster -D mapreduce.job.reduces=(numExecutors / 2)

    The default number of reducers is one per executor - documentation says the "right" number is probably 0.95 or 1.75. All three choices are bad for s3DistCp, where the reduce phase of the job writes to S3. Experiment to figure out how much to scale down the number of reducers so the data is copied off in a timely manner without too much rate limiting. On large jobs, recommend running s3DistCp step as many times as necessary to ensure all your data makes it off HDFS to S3 before the cluster shuts down. Hadoop Map Reduce Tutorial: Map-Reduce User Interfaces 73
  71. Databricks fs.s3a.multipart.threshold = 2147483647 // default (in bytes) fs.s3a.multipart.size =

    104857600 fs.s3a.connection.maximum = min(clusterNodes, 500) fs.s3a.connection.timeout = 60000 // default: 20000ms fs.s3a.block.size = 134217728 // default: 32M - used for reading fs.s3a.fast.upload = true // disable if writes are failing // spark.stage.maxConsecutiveAttempts = 10 // default 4 - increase if writes are failing Databricks Runtimes uses their own S3 committer code which provides reliable performance writing directly to S3. 74
  72. Hadoop 3.2.0 // https://hadoop.apache.org/docs/r3.2.0/hadoop-aws/tools/hadoop-aws/committers.html fs.s3a.committer.name = directory fs.s3a.committer.staging.conflict-mode = replace

    // replace == overwrite fs.s3a.attempts.maximum = 20 // How many times we should retry commands on transient errors fs.s3a.retry.throttle.limit = 20 // number of times to retry throttled request fs.s3a.retry.throttle.interval = 1000ms // Controls the maximum number of simultaneous connections to S3 fs.s3a.connection.maximum = ??? // Number of (part)uploads allowed to the queue before blocking additional uploads. fs.s3a.max.total.tasks = ??? If you're lucky enough to have access to Hadoop 3.2.0, here's some highlights pertinent to large clusters. 75