University: from August 2013, University of Lancaster Correlation analysis - 2013 Rob Davies (Department of Psychology, Oxford Brookes University: from August 2013, University of Lancaster) Correlation and regression Correlation analysis - 2013 1 / 27
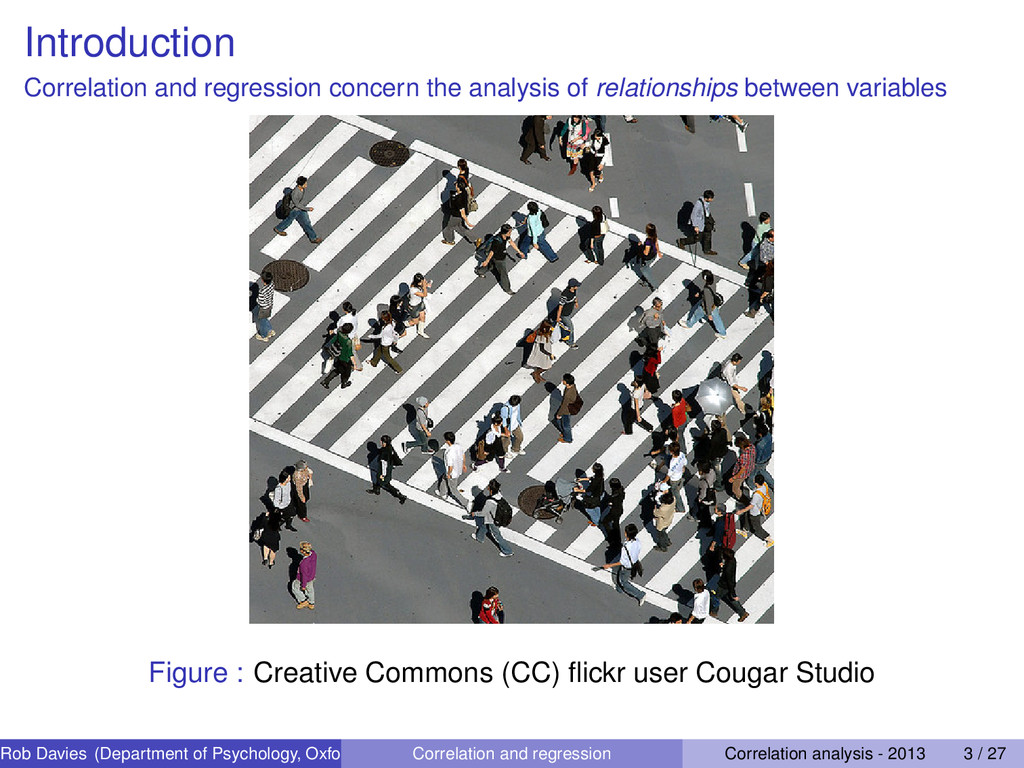
variables Figure : Creative Commons (CC) flickr user Cougar Studio Rob Davies (Department of Psychology, Oxford Brookes University: from August 2013, University of Lancaster) Correlation and regression Correlation analysis - 2013 3 / 27
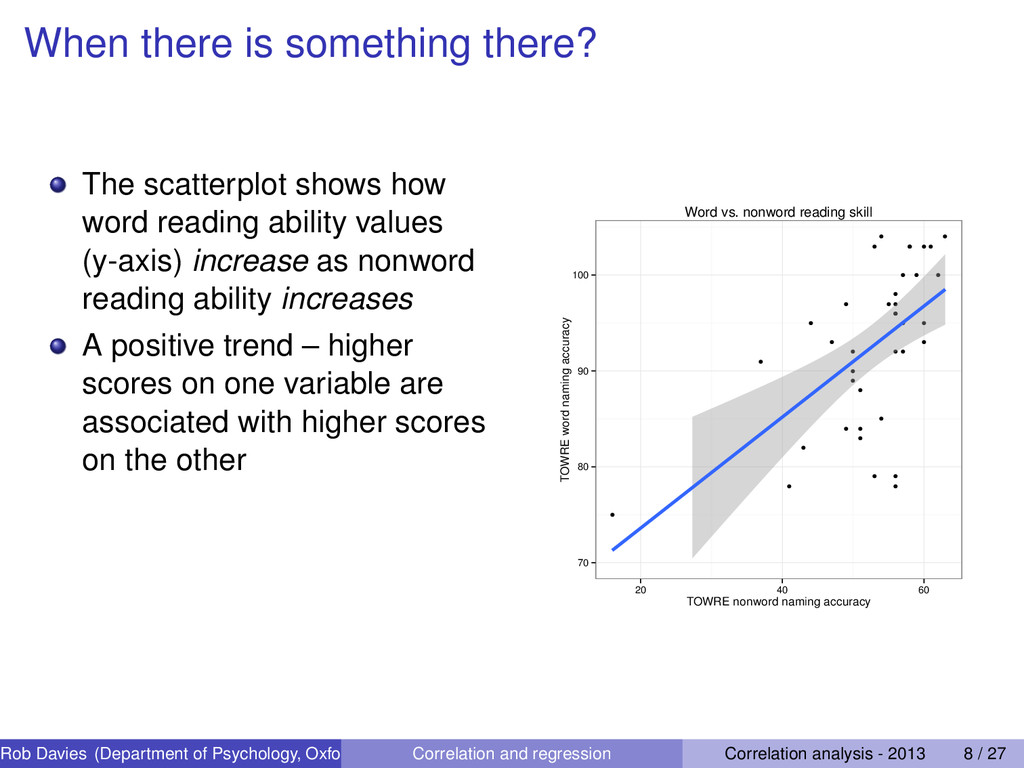
stimulus, person to person, study to study Figure : A relationship between word reading ability and nonword reading ability? Rob Davies (Department of Psychology, Oxford Brookes University: from August 2013, University of Lancaster) Correlation and regression Correlation analysis - 2013 4 / 27
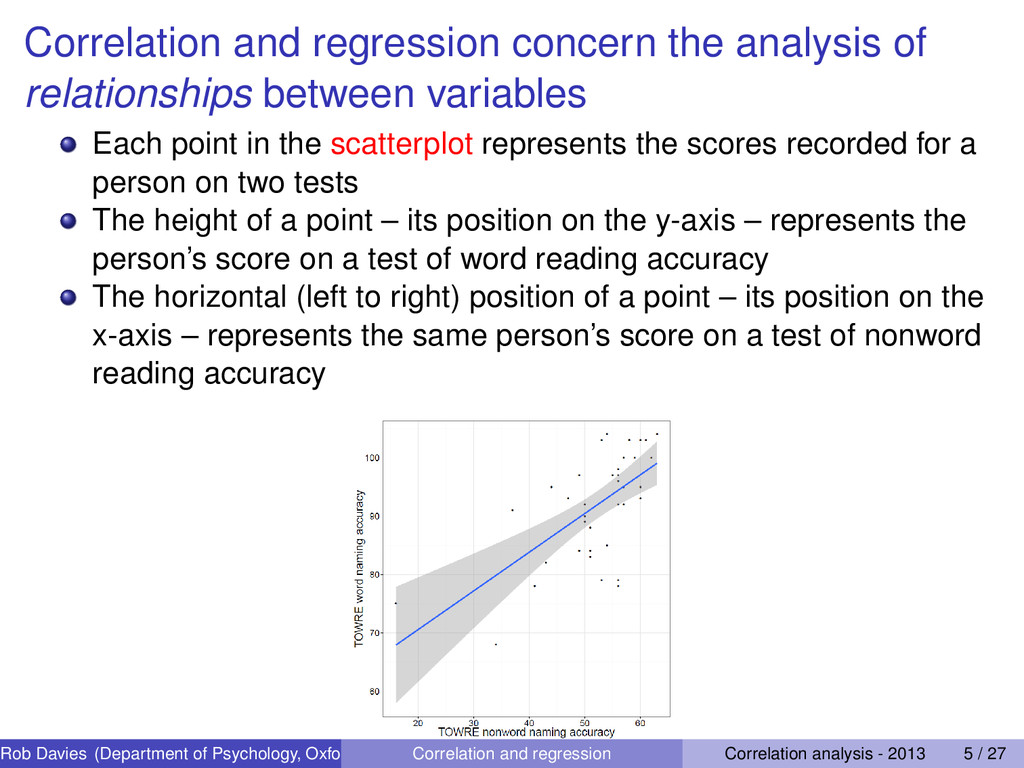
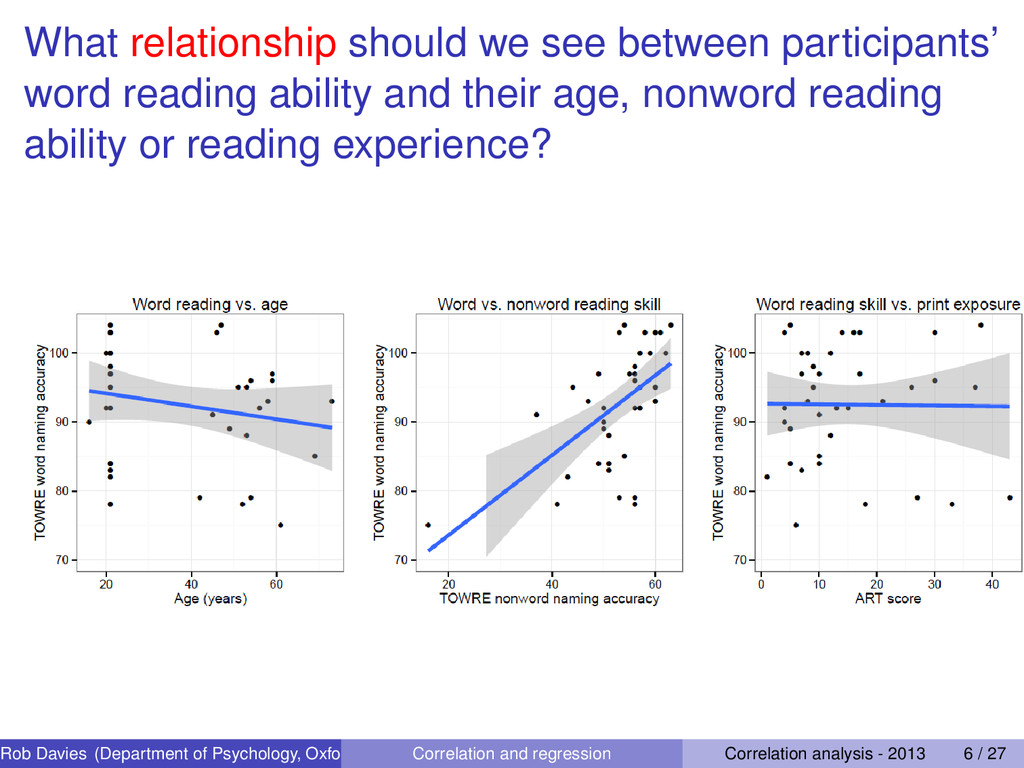
Each point in the scatterplot represents the scores recorded for a person on two tests The height of a point – its position on the y-axis – represents the person’s score on a test of word reading accuracy The horizontal (left to right) position of a point – its position on the x-axis – represents the same person’s score on a test of nonword reading accuracy Rob Davies (Department of Psychology, Oxford Brookes University: from August 2013, University of Lancaster) Correlation and regression Correlation analysis - 2013 5 / 27
and their age, nonword reading ability or reading experience? Rob Davies (Department of Psychology, Oxford Brookes University: from August 2013, University of Lancaster) Correlation and regression Correlation analysis - 2013 6 / 27
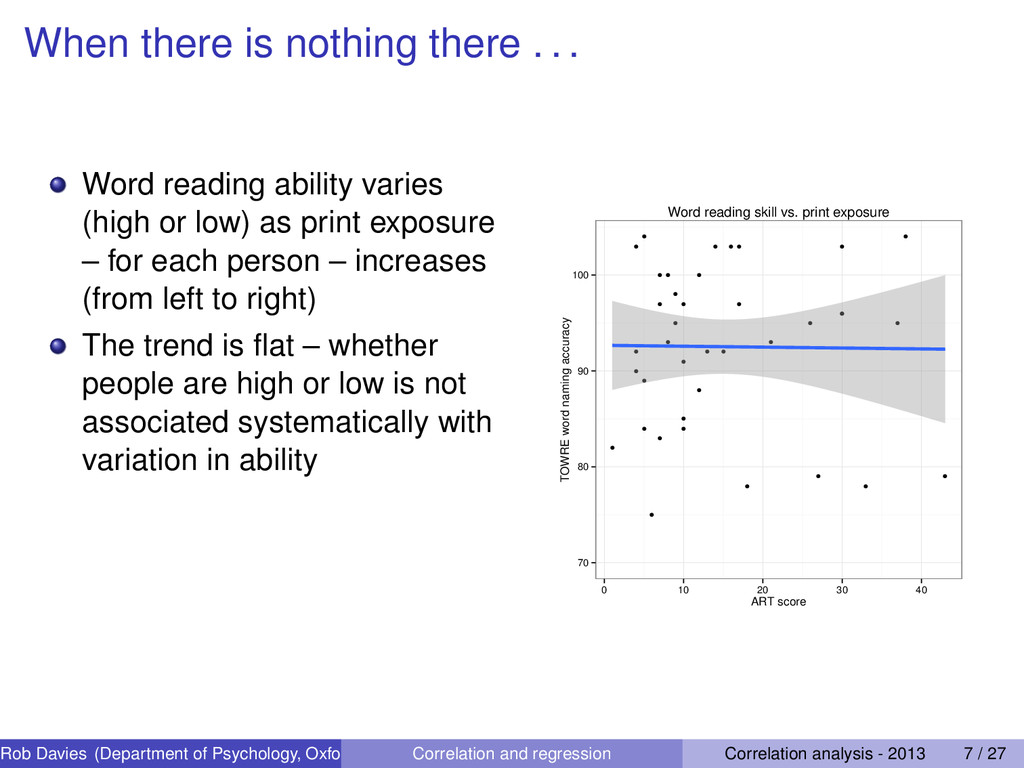
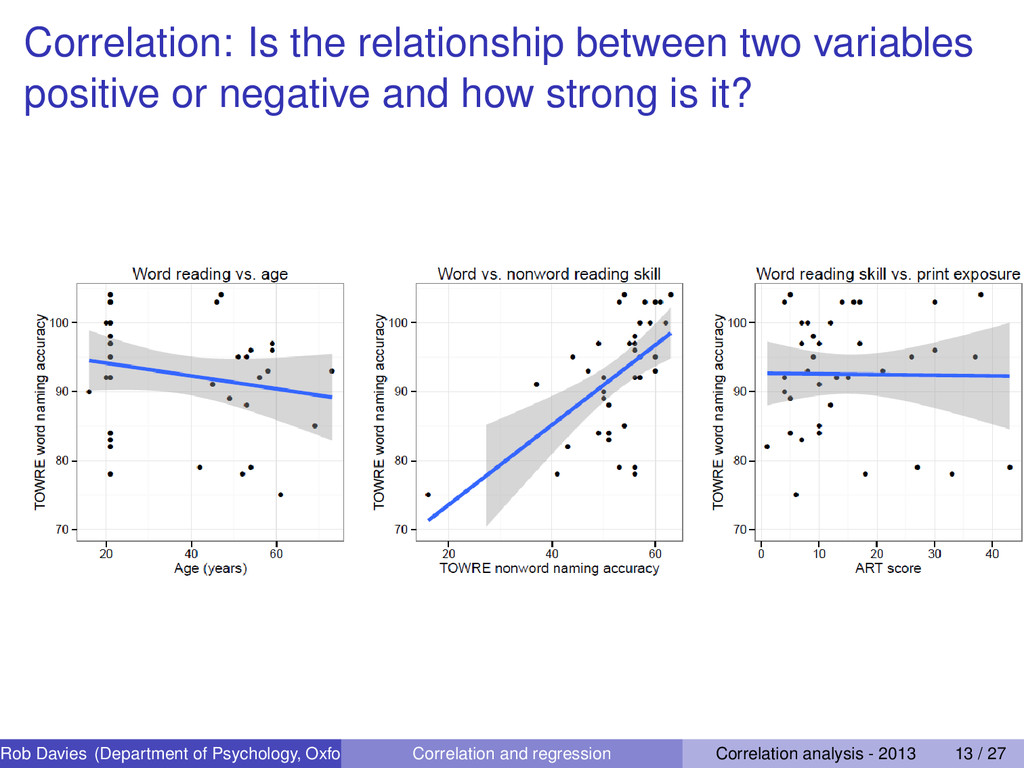
ability varies (high or low) as print exposure – for each person – increases (from left to right) The trend is flat – whether people are high or low is not associated systematically with variation in ability q q q q q q q q q q q q q q q q q q q q q q q q q q q q q q q q q q q q q q 70 80 90 100 0 10 20 30 40 ART score TOWRE word naming accuracy Word reading skill vs. print exposure Rob Davies (Department of Psychology, Oxford Brookes University: from August 2013, University of Lancaster) Correlation and regression Correlation analysis - 2013 7 / 27
associated 2 Nonword reading reflects phonological coding knowledge which should also feed into word reading ability or vice versa 3 Do not expect to see a relationship if the hypothesized relationship is not valid Rob Davies (Department of Psychology, Oxford Brookes University: from August 2013, University of Lancaster) Correlation and regression Correlation analysis - 2013 9 / 27
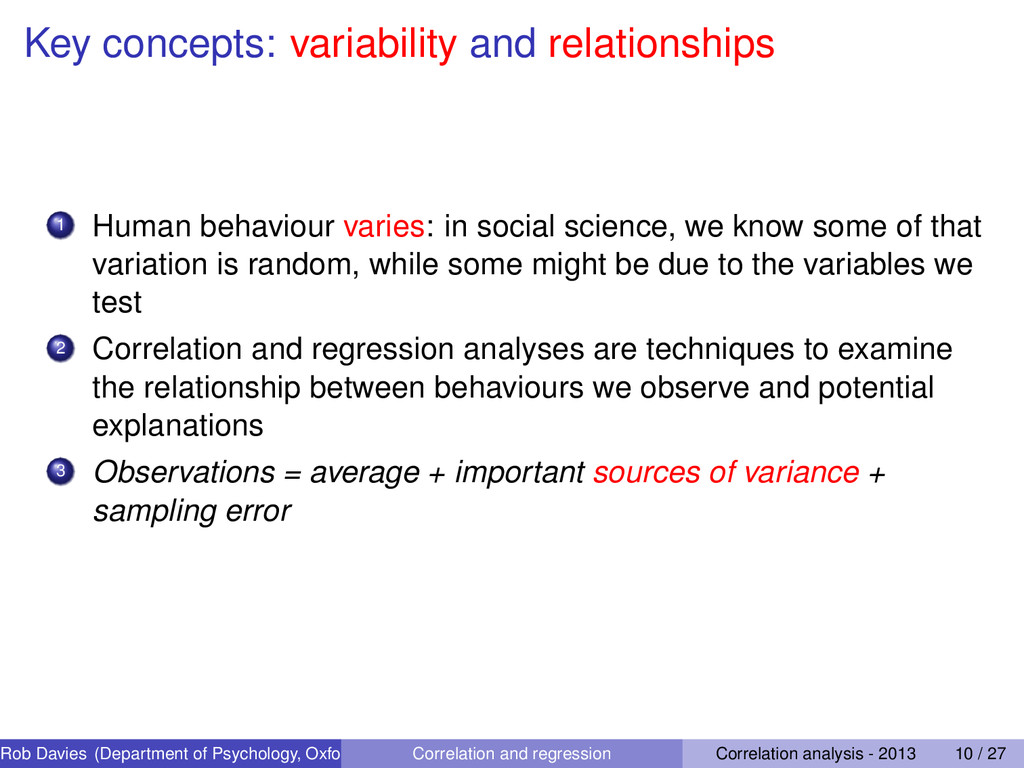
social science, we know some of that variation is random, while some might be due to the variables we test 2 Correlation and regression analyses are techniques to examine the relationship between behaviours we observe and potential explanations 3 Observations = average + important sources of variance + sampling error Rob Davies (Department of Psychology, Oxford Brookes University: from August 2013, University of Lancaster) Correlation and regression Correlation analysis - 2013 10 / 27
Davies (Department of Psychology, Oxford Brookes University: from August 2013, University of Lancaster) Correlation and regression Correlation analysis - 2013 11 / 27
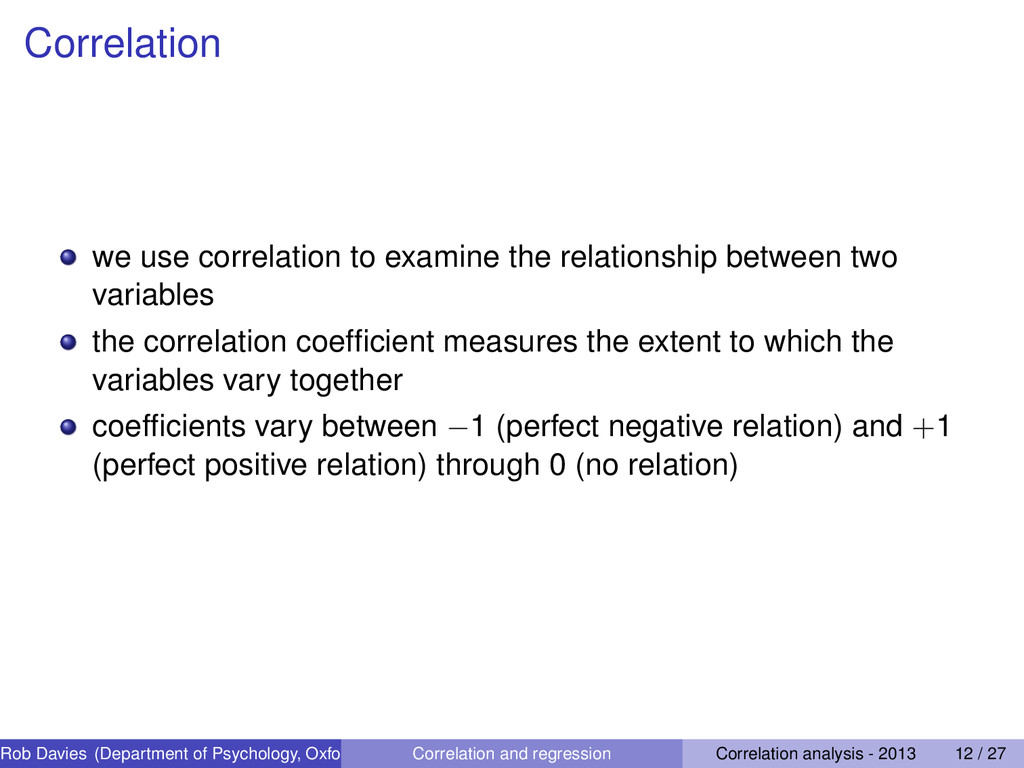
variables the correlation coefficient measures the extent to which the variables vary together coefficients vary between −1 (perfect negative relation) and +1 (perfect positive relation) through 0 (no relation) Rob Davies (Department of Psychology, Oxford Brookes University: from August 2013, University of Lancaster) Correlation and regression Correlation analysis - 2013 12 / 27
and how strong is it? Rob Davies (Department of Psychology, Oxford Brookes University: from August 2013, University of Lancaster) Correlation and regression Correlation analysis - 2013 13 / 27
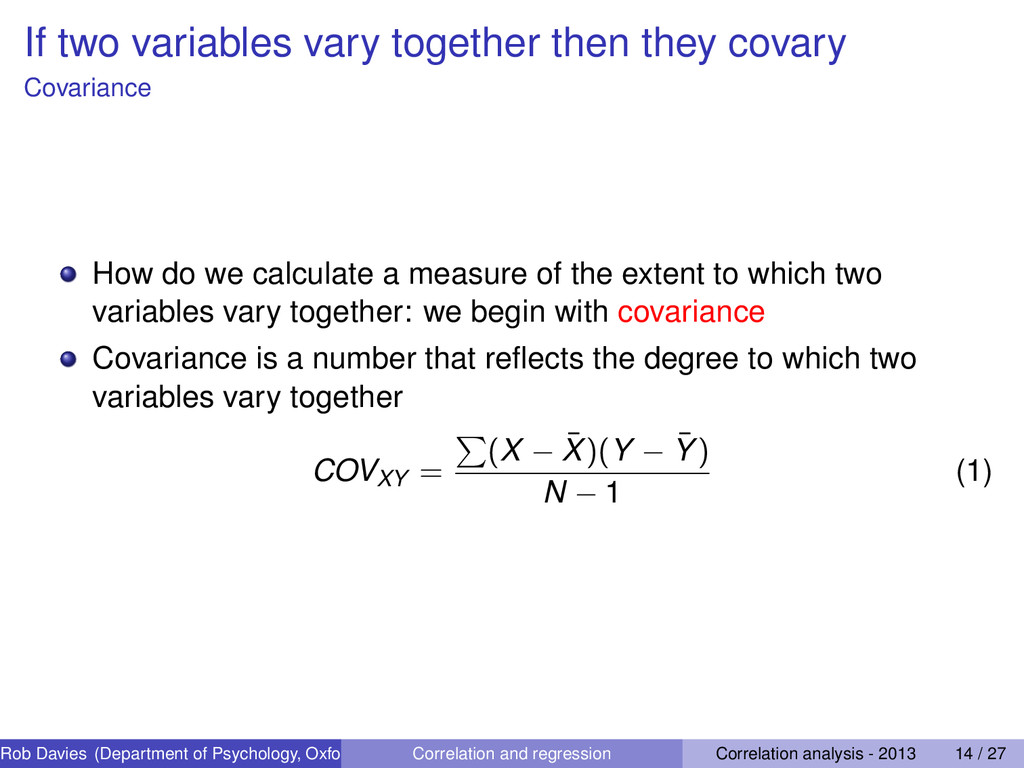
do we calculate a measure of the extent to which two variables vary together: we begin with covariance Covariance is a number that reflects the degree to which two variables vary together COVXY = (X − ¯ X)(Y − ¯ Y) N − 1 (1) Rob Davies (Department of Psychology, Oxford Brookes University: from August 2013, University of Lancaster) Correlation and regression Correlation analysis - 2013 14 / 27
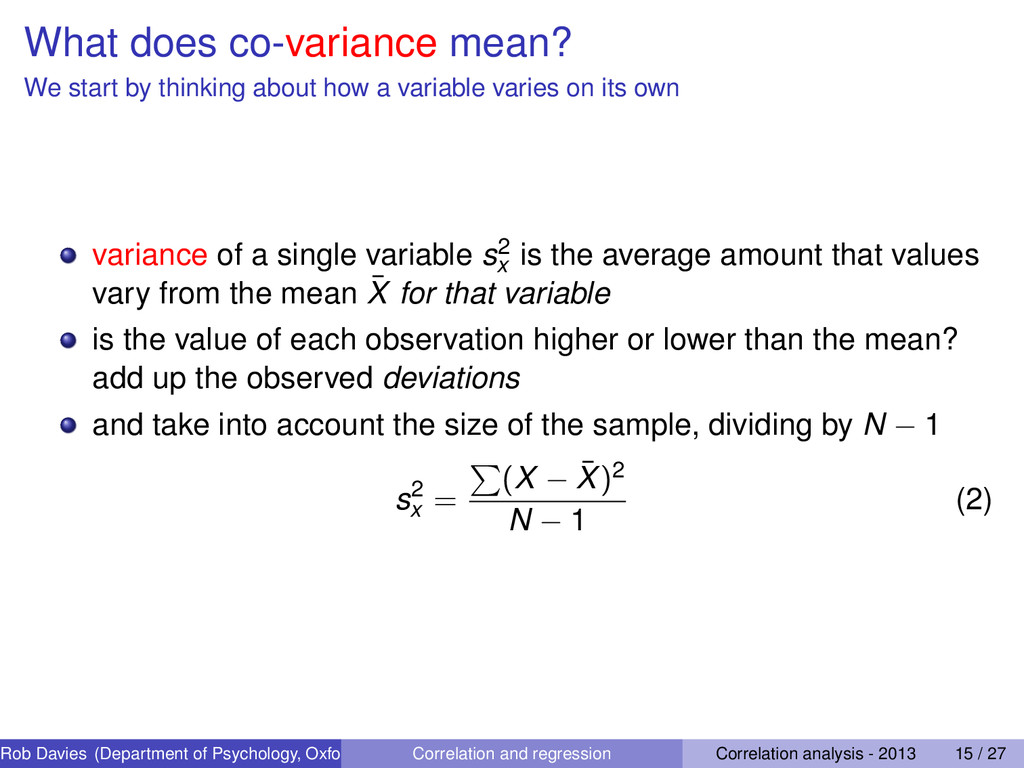
a variable varies on its own variance of a single variable s2 x is the average amount that values vary from the mean ¯ X for that variable is the value of each observation higher or lower than the mean? add up the observed deviations and take into account the size of the sample, dividing by N − 1 s2 x = (X − ¯ X)2 N − 1 (2) Rob Davies (Department of Psychology, Oxford Brookes University: from August 2013, University of Lancaster) Correlation and regression Correlation analysis - 2013 15 / 27
degree to which two variables vary together if positive relationship: if values in one variable are higher than the mean, values in the other variable also are higher if negative relationship: if values in one variable are higher than the mean, values in the other variable are lower if no relationship: if values in one variable are higher, values in the other variable are higher or lower about equally Rob Davies (Department of Psychology, Oxford Brookes University: from August 2013, University of Lancaster) Correlation and regression Correlation analysis - 2013 16 / 27
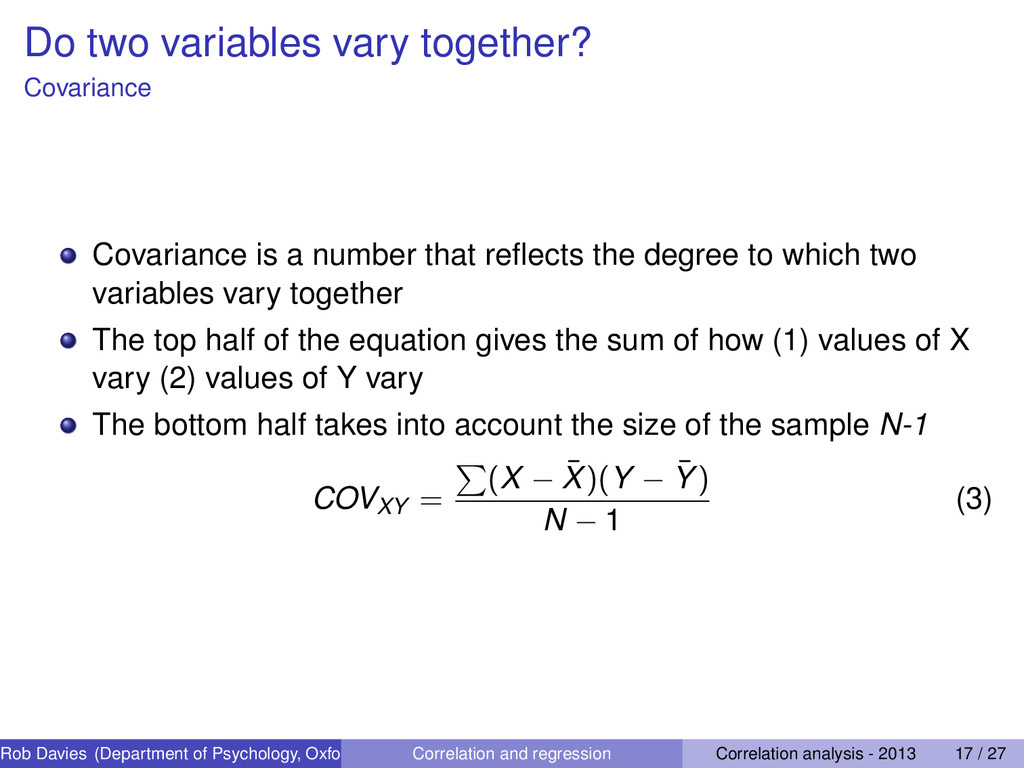
that reflects the degree to which two variables vary together The top half of the equation gives the sum of how (1) values of X vary (2) values of Y vary The bottom half takes into account the size of the sample N-1 COVXY = (X − ¯ X)(Y − ¯ Y) N − 1 (3) Rob Davies (Department of Psychology, Oxford Brookes University: from August 2013, University of Lancaster) Correlation and regression Correlation analysis - 2013 17 / 27
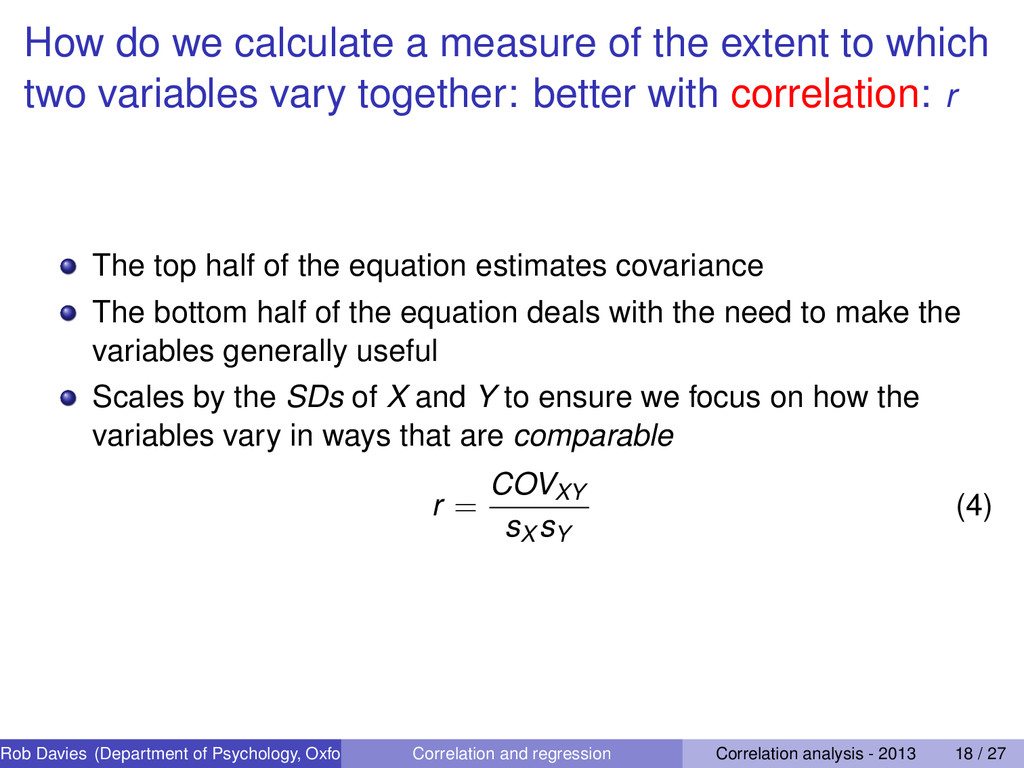
which two variables vary together: better with correlation: r The top half of the equation estimates covariance The bottom half of the equation deals with the need to make the variables generally useful Scales by the SDs of X and Y to ensure we focus on how the variables vary in ways that are comparable r = COVXY sX sY (4) Rob Davies (Department of Psychology, Oxford Brookes University: from August 2013, University of Lancaster) Correlation and regression Correlation analysis - 2013 18 / 27
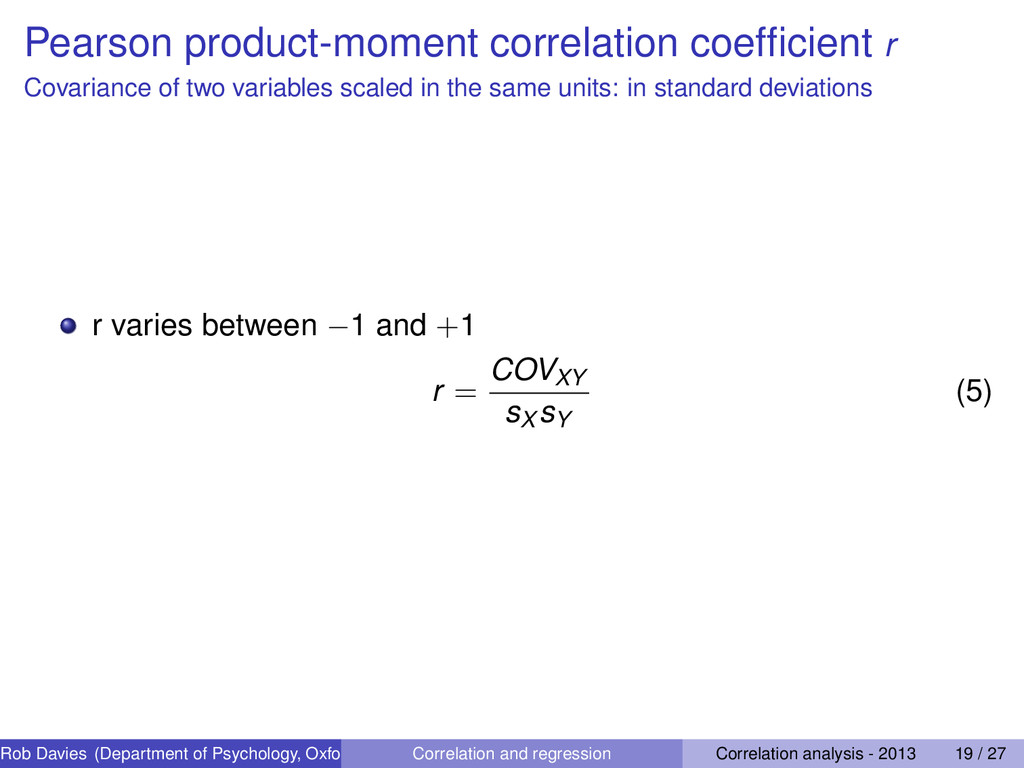
in the same units: in standard deviations r varies between −1 and +1 r = COVXY sX sY (5) Rob Davies (Department of Psychology, Oxford Brookes University: from August 2013, University of Lancaster) Correlation and regression Correlation analysis - 2013 19 / 27
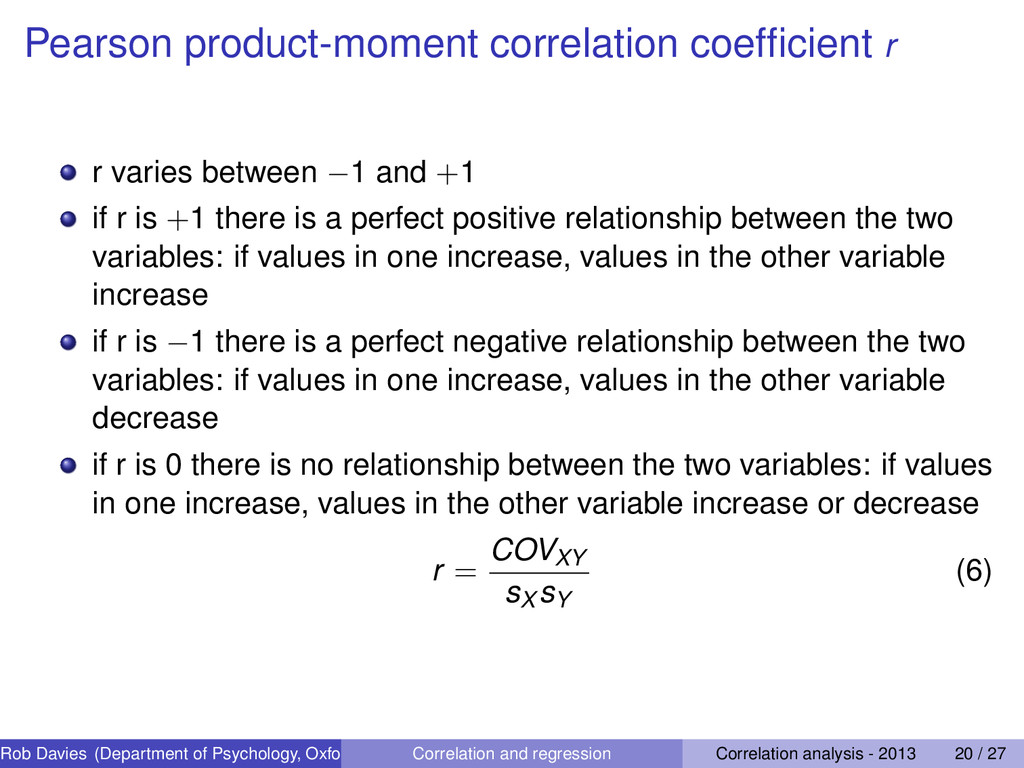
+1 if r is +1 there is a perfect positive relationship between the two variables: if values in one increase, values in the other variable increase if r is −1 there is a perfect negative relationship between the two variables: if values in one increase, values in the other variable decrease if r is 0 there is no relationship between the two variables: if values in one increase, values in the other variable increase or decrease r = COVXY sX sY (6) Rob Davies (Department of Psychology, Oxford Brookes University: from August 2013, University of Lancaster) Correlation and regression Correlation analysis - 2013 20 / 27
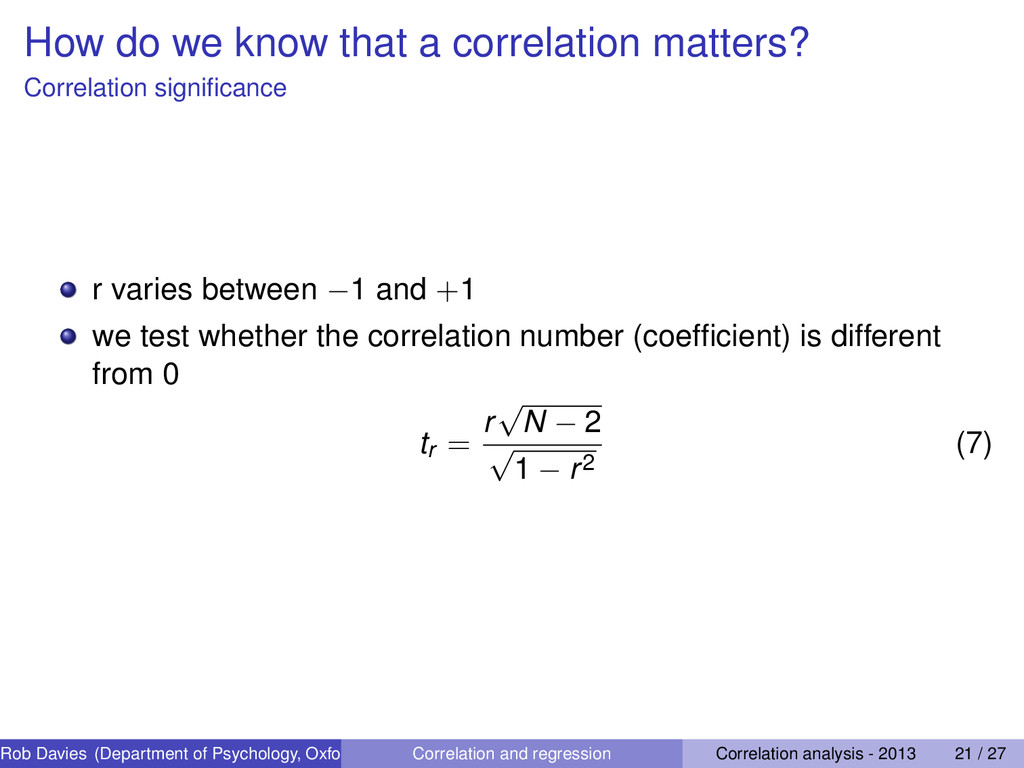
r varies between −1 and +1 we test whether the correlation number (coefficient) is different from 0 tr = r √ N − 2 √ 1 − r2 (7) Rob Davies (Department of Psychology, Oxford Brookes University: from August 2013, University of Lancaster) Correlation and regression Correlation analysis - 2013 21 / 27
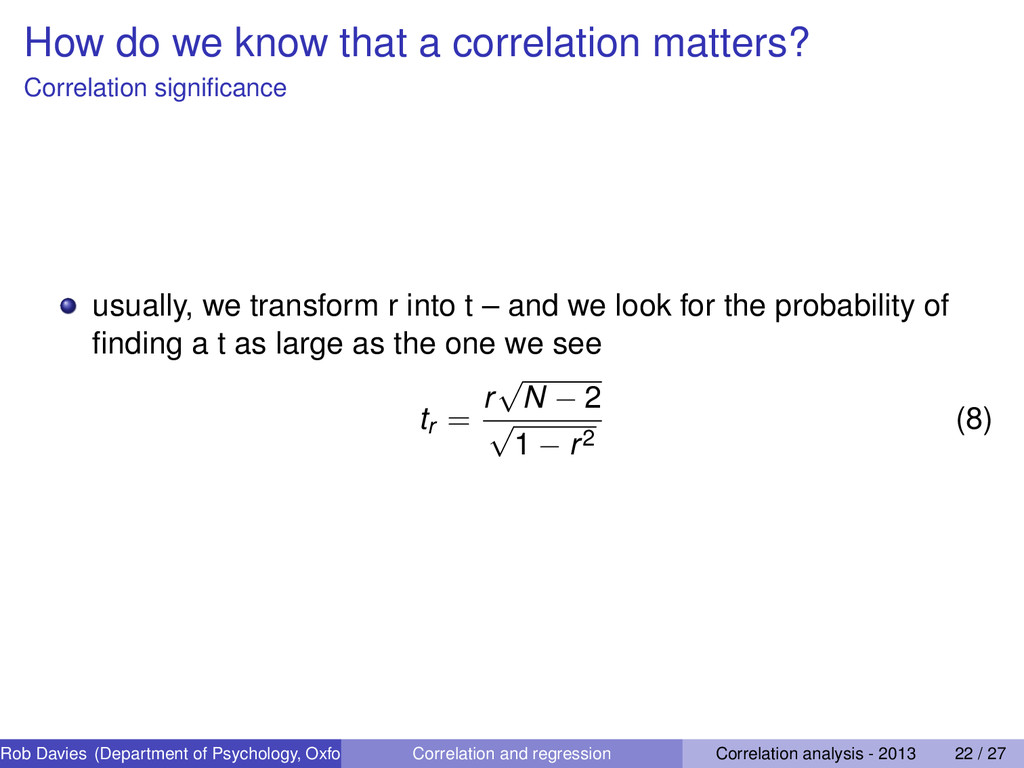
usually, we transform r into t – and we look for the probability of finding a t as large as the one we see tr = r √ N − 2 √ 1 − r2 (8) Rob Davies (Department of Psychology, Oxford Brookes University: from August 2013, University of Lancaster) Correlation and regression Correlation analysis - 2013 22 / 27
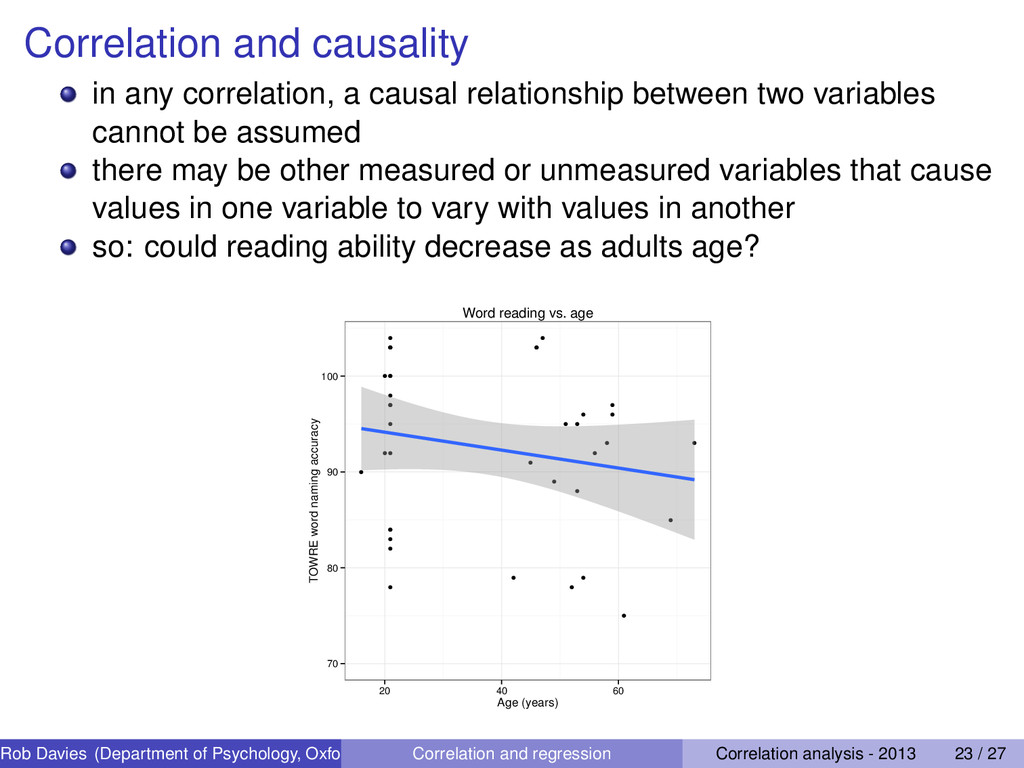
two variables cannot be assumed there may be other measured or unmeasured variables that cause values in one variable to vary with values in another so: could reading ability decrease as adults age? q q q q q q q q q q q q q q q q q q q q q q q q q q q q q q q q q q q q q q 70 80 90 100 20 40 60 Age (years) TOWRE word naming accuracy Word reading vs. age Rob Davies (Department of Psychology, Oxford Brookes University: from August 2013, University of Lancaster) Correlation and regression Correlation analysis - 2013 23 / 27
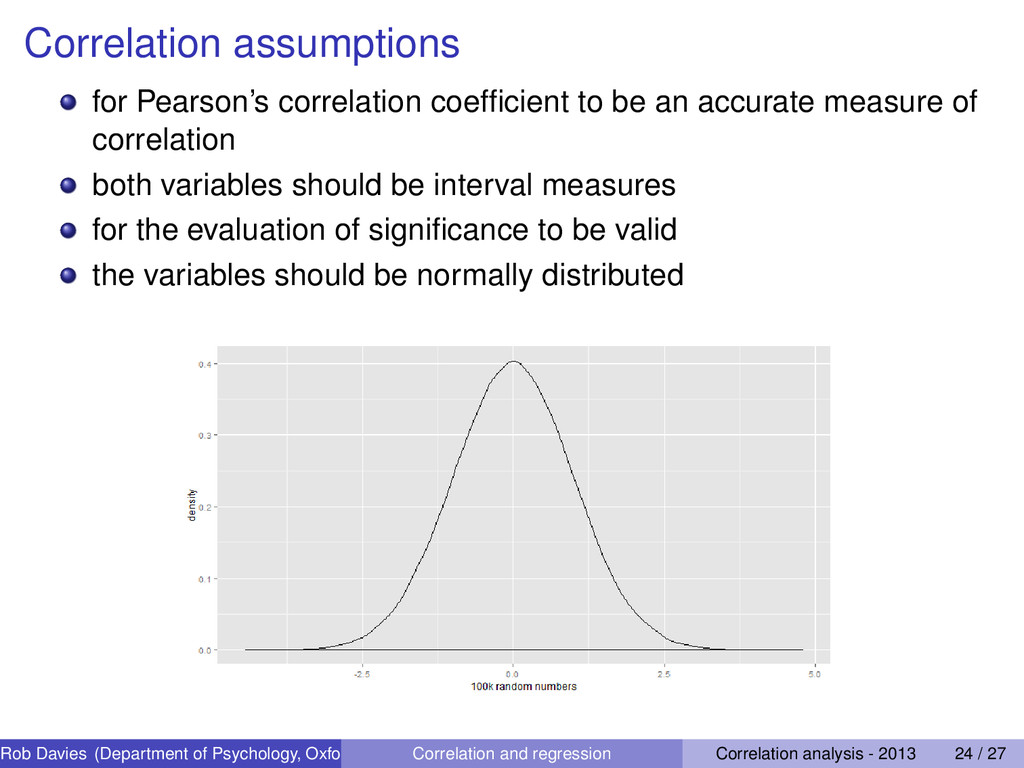
measure of correlation both variables should be interval measures for the evaluation of significance to be valid the variables should be normally distributed Rob Davies (Department of Psychology, Oxford Brookes University: from August 2013, University of Lancaster) Correlation and regression Correlation analysis - 2013 24 / 27
reaction time and word frequency, r = .87, p = 0.05.” You report the correlation coefficient “r = .87” You report the significance “p = 0.05.” Rob Davies (Department of Psychology, Oxford Brookes University: from August 2013, University of Lancaster) Correlation and regression Correlation analysis - 2013 25 / 27
variables the correlation coefficient measures the extent to which the variables vary together coefficients vary between −1 (perfect negative relationship) and +1 (perfect positive relationship) Rob Davies (Department of Psychology, Oxford Brookes University: from August 2013, University of Lancaster) Correlation and regression Correlation analysis - 2013 26 / 27