cycling For Modelling on the Move seminar, 22/01/14, Westminster University, London By Robin Lovelace University of Leeds, TALISMAN Slides available: robinlovelace.net
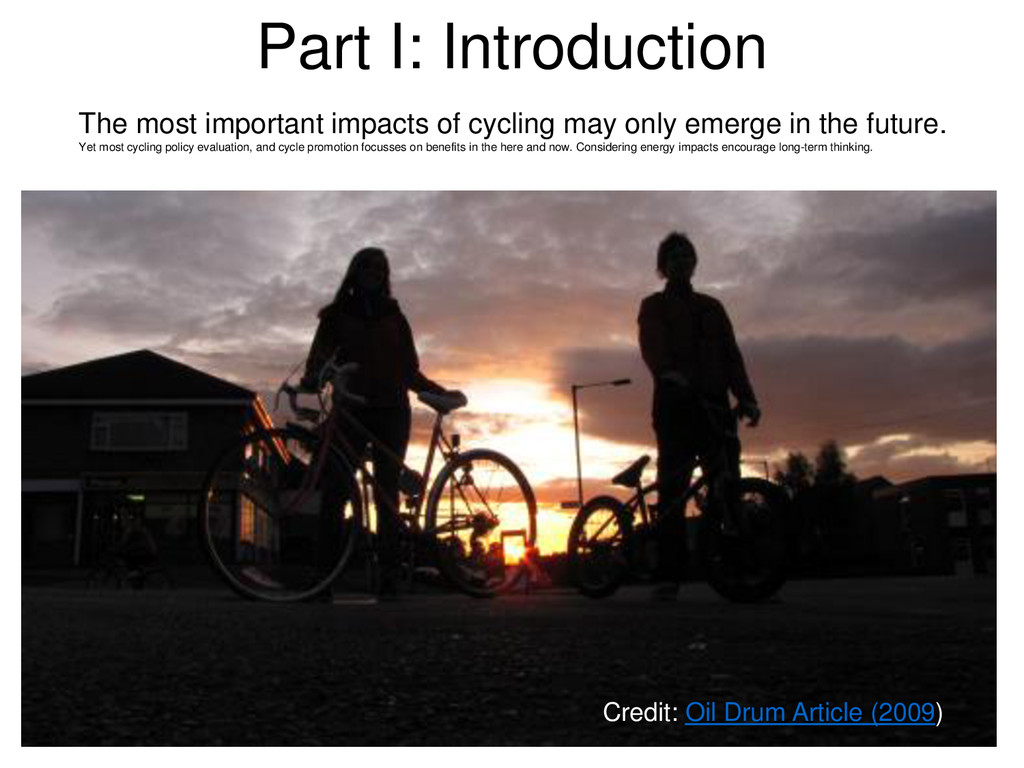
only emerge in the future. Yet most cycling policy evaluation, and cycle promotion focusses on benefits in the here and now. Considering energy impacts encourage long-term thinking. Credit: Oil Drum Article (2009)
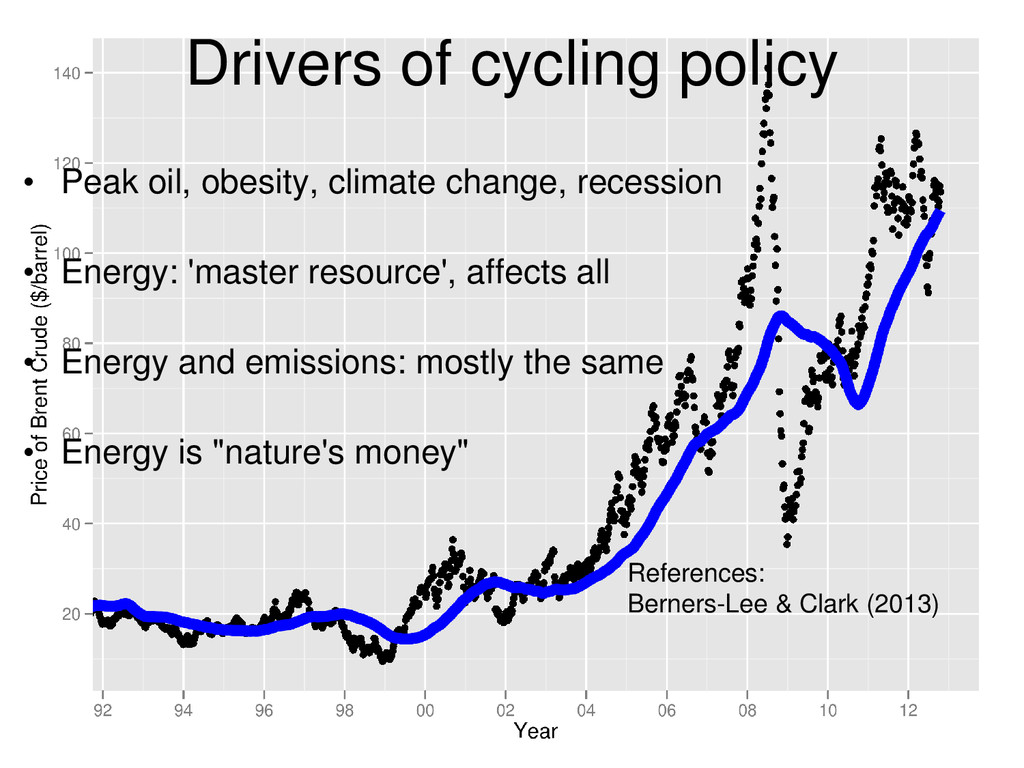
recession • Energy: 'master resource', affects all • Energy and emissions: mostly the same • Energy is "nature's money" References: Berners-Lee & Clark (2013)
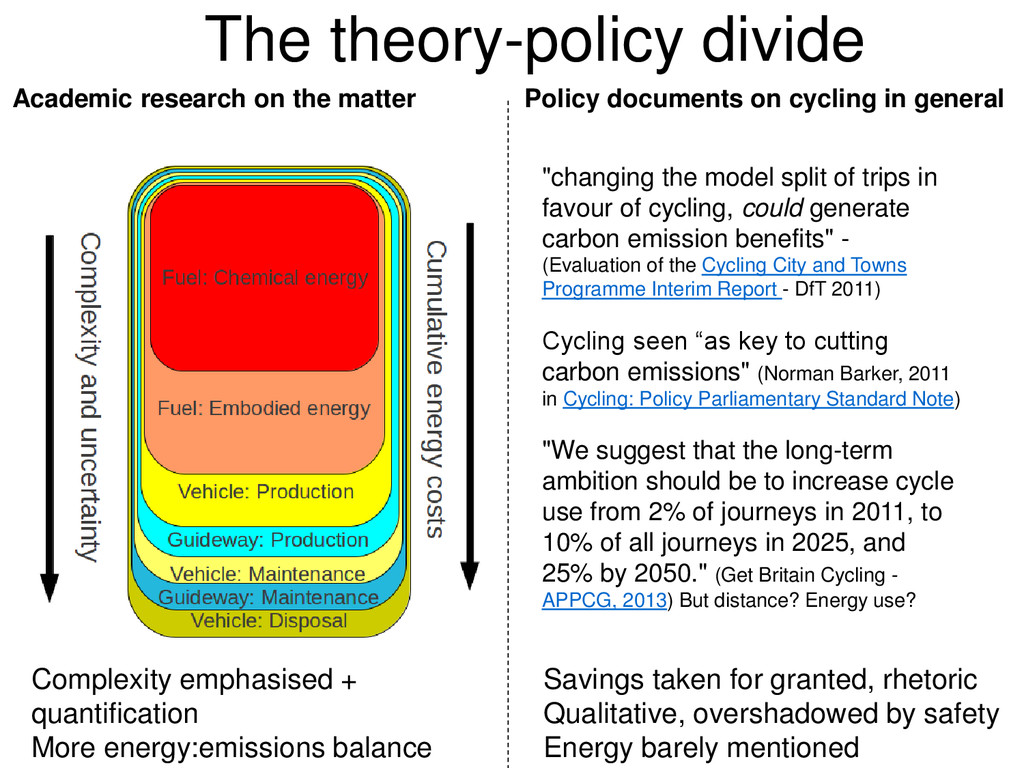
favour of cycling, could generate carbon emission benefits" - (Evaluation of the Cycling City and Towns Programme Interim Report - DfT 2011) Cycling seen “as key to cutting carbon emissions" (Norman Barker, 2011 in Cycling: Policy Parliamentary Standard Note) "We suggest that the long-term ambition should be to increase cycle use from 2% of journeys in 2011, to 10% of all journeys in 2025, and 25% by 2050." (Get Britain Cycling - APPCG, 2013) But distance? Energy use? Complexity emphasised + Savings taken for granted, rhetoric quantification Qualitative, overshadowed by safety More energy:emissions balance Energy barely mentioned Academic research on the matter Policy documents on cycling in general
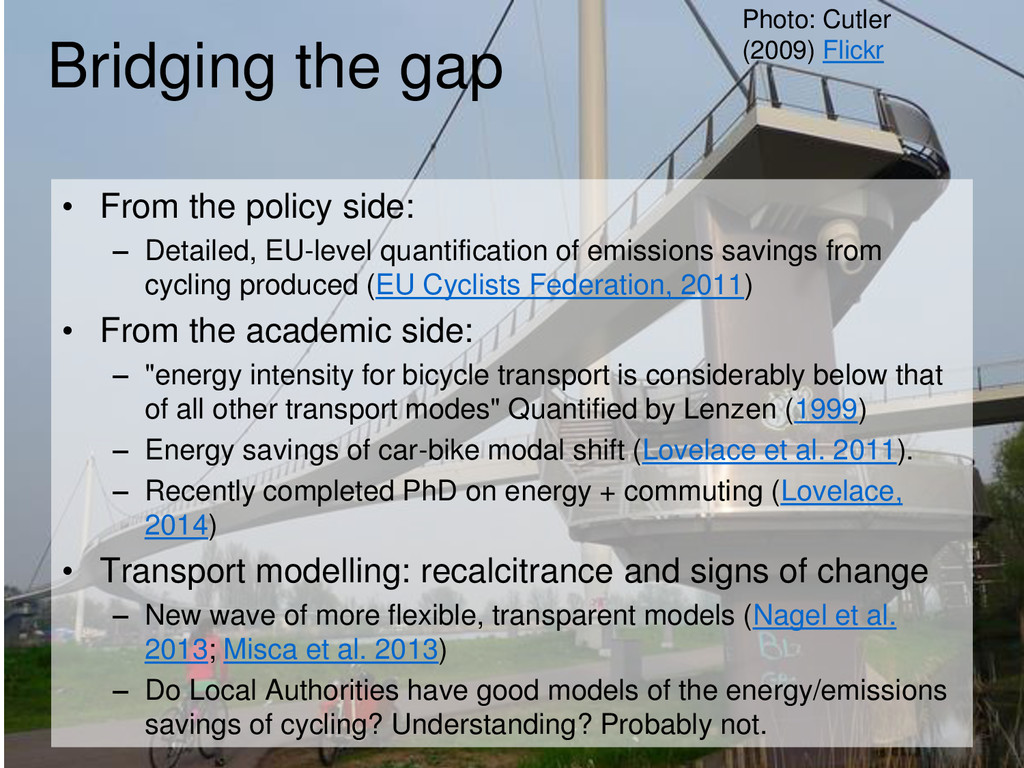
EU-level quantification of emissions savings from cycling produced (EU Cyclists Federation, 2011) • From the academic side: – "energy intensity for bicycle transport is considerably below that of all other transport modes" Quantified by Lenzen (1999) – Energy savings of car-bike modal shift (Lovelace et al. 2011). – Recently completed PhD on energy + commuting (Lovelace, 2014) • Transport modelling: recalcitrance and signs of change – New wave of more flexible, transparent models (Nagel et al. 2013; Misca et al. 2013) – Do Local Authorities have good models of the energy/emissions savings of cycling? Understanding? Probably not. Photo: Cutler (2009) Flickr
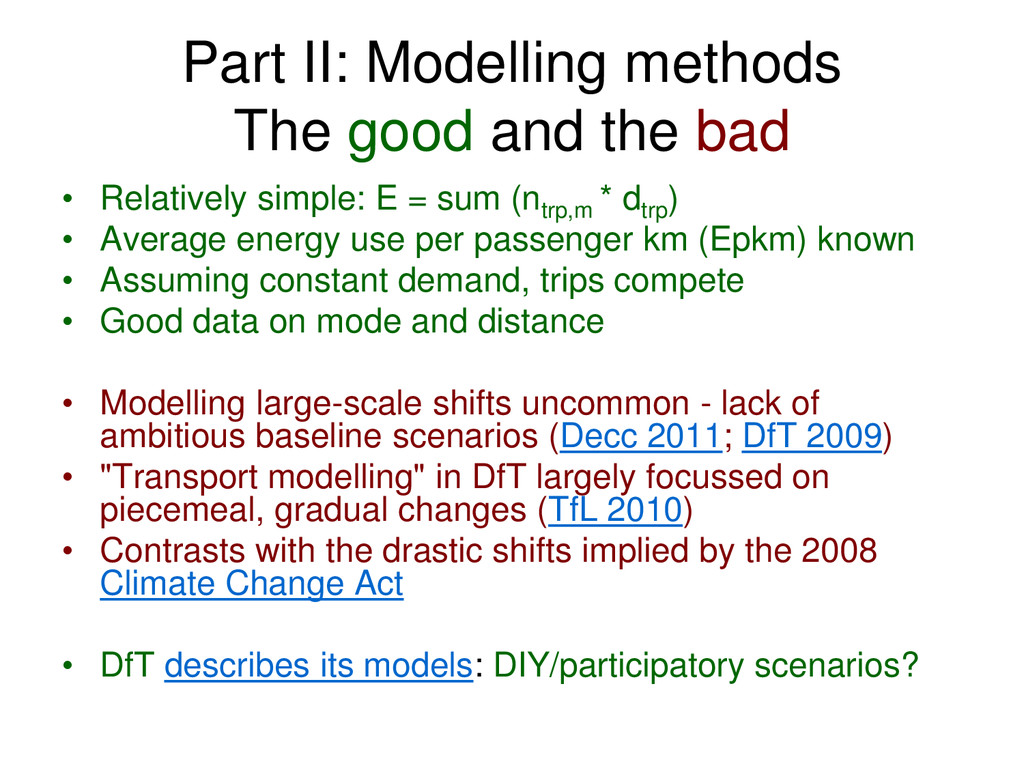
Relatively simple: E = sum (ntrp,m * dtrp ) • Average energy use per passenger km (Epkm) known • Assuming constant demand, trips compete • Good data on mode and distance • Modelling large-scale shifts uncommon - lack of ambitious baseline scenarios (Decc 2011; DfT 2009) • "Transport modelling" in DfT largely focussed on piecemeal, gradual changes (TfL 2010) • Contrasts with the drastic shifts implied by the 2008 Climate Change Act • DfT describes its models: DIY/participatory scenarios?
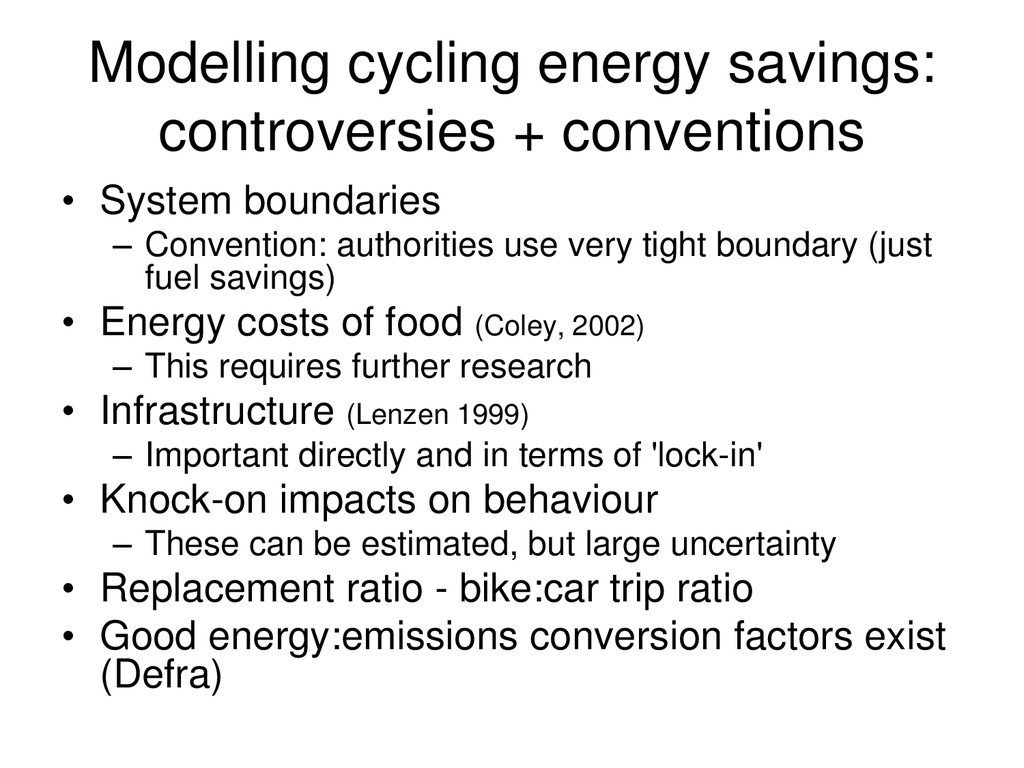
– Convention: authorities use very tight boundary (just fuel savings) • Energy costs of food (Coley, 2002) – This requires further research • Infrastructure (Lenzen 1999) – Important directly and in terms of 'lock-in' • Knock-on impacts on behaviour – These can be estimated, but large uncertainty • Replacement ratio - bike:car trip ratio • Good energy:emissions conversion factors exist (Defra)
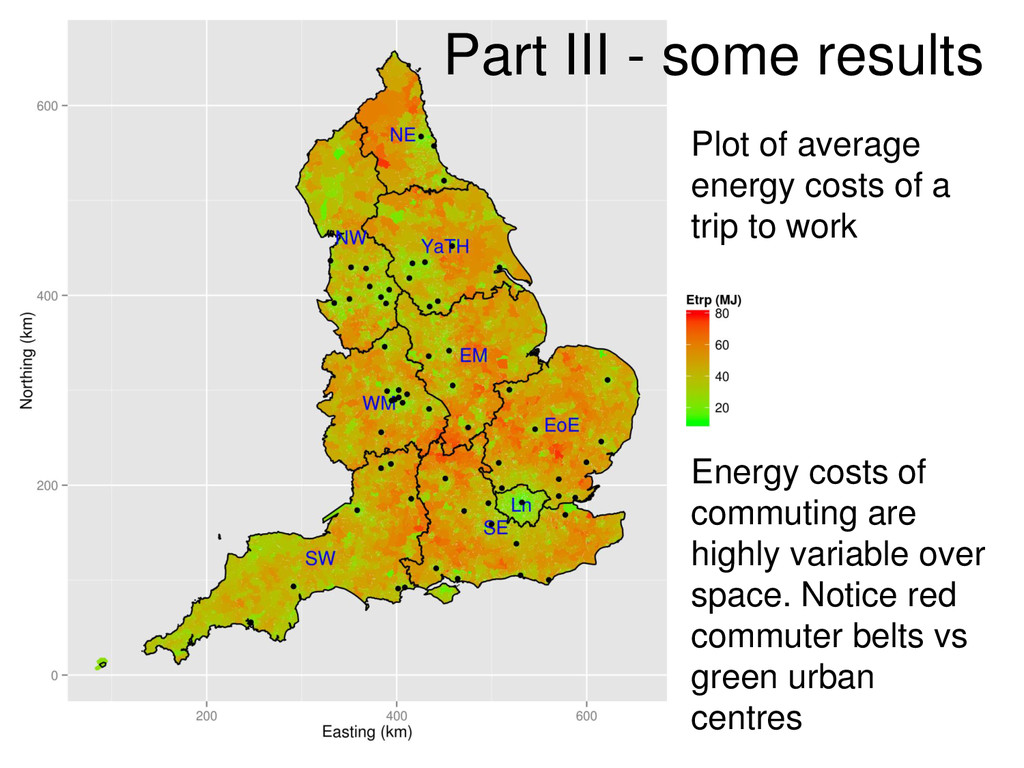
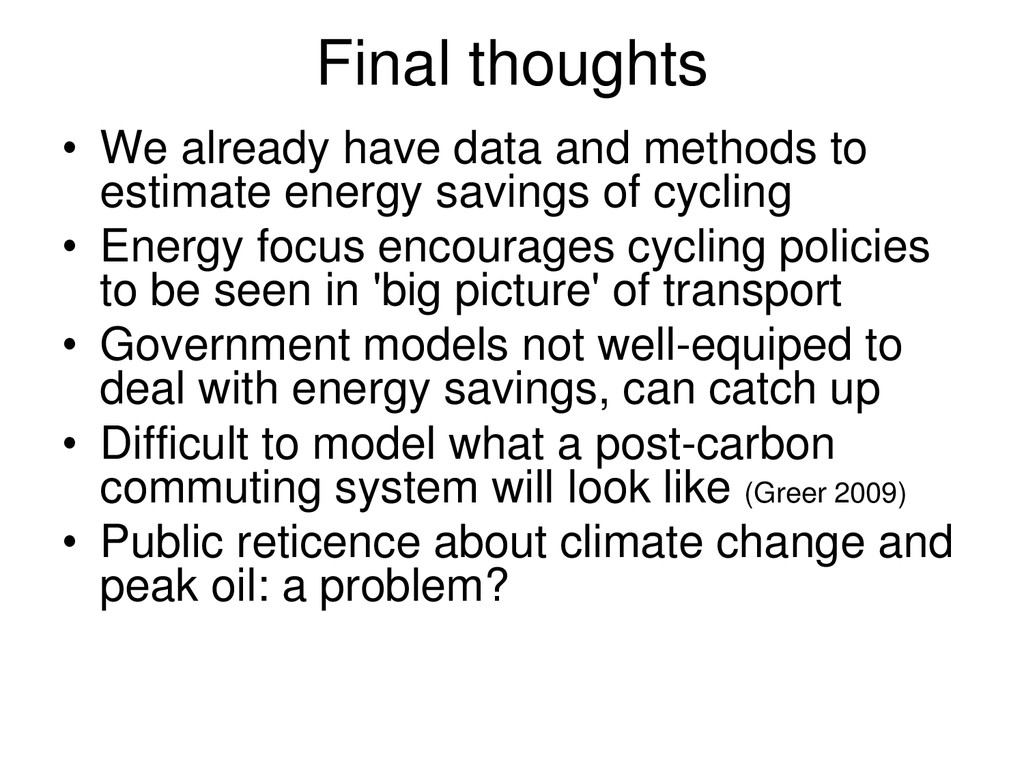
estimate energy savings of cycling • Energy focus encourages cycling policies to be seen in 'big picture' of transport • Government models not well-equiped to deal with energy savings, can catch up • Difficult to model what a post-carbon commuting system will look like (Greer 2009) • Public reticence about climate change and peak oil: a problem?
Question: We can’t burn half the world's oil, coal and gas. So how do we quit? Profile Books Coley, D. A. (2002). Emission factors for human activity. Energy policy, 30(1), 3-5. Greer, J. M. (2009). The Ecotechnic Future: Envisioning a Post-Peak World. Aztext Press. Lenzen, M. (1999). Total requirements of energy and greenhouse gases for Australian transport. Transportation Research Part D: Transport and Environment, 4(4), 265-290. Lovelace, R., Ballas, D., & Watson, M. (2013). A spatial microsimulation approach for the analysis of commuter patterns: from individual to regional levels. Journal of Transport Geography Lovelace, R., Beck, S. B. M. B. M., Watson, M., & Wild, A. (2011). Assessing the energy implications of replacing car trips with bicycle trips in Sheffield, UK. Energy Policy New email address: R . Lovelace @ Leeds . ac . uk