Upgrade to Pro — share decks privately, control downloads, hide ads and more …

From static PDFs to interactive geospatial PDFs...

Sponsored · Your Podcast. Everywhere. Effortlessly. Share. Educate. Inspire. Entertain. You do you. We'll handle the rest.
Avatar for Robin Wilson Robin Wilson
April 19, 2026
2

From static PDFs to interactive geospatial PDFs - FOSS4G 2021

Avatar for Robin Wilson

Robin Wilson

April 19, 2026

Transcript

  1. From static PDFs to interactive, geospatial PDFs or, ‘I never

    knew that PDFs could do that!’ by Robin Wilson [email protected] www.rtwilson.com @sciremotesense 29 Sept 2021 on Buenos Aires room
  2. PDFs Great for static sharing of complex graphical layouts in

    a device-independent, print-friendly manner So…perfect for maps! But: No way to get back the original data Difficult to edit No interactivity However…
  3. GDAL – PDF from XML Composition File gdal_create output.pdf -co

    COMPOSITION_FILE=input.xml Sponsored development 👍
  4. XML Composition File <PDFComposition> <Metadata> <Author>Robin Wilson</Author> </Metadata> <LayerTree displayOnlyOnVisiblePages="true">

    <Layer id="background" name="Background chart"/> <Layer id="nelson" name="Nelson"/> <Layer id="collingwood" name="Collingwood"/> </LayerTree> ...
  5. XML Composition File <Page id="page_1"> <DPI>72</DPI> <Width>841.698</Width> <Height>595.14</Height> <Georeferencing id="georeferenced">

    <SRS>EPSG:4326</SRS> <ControlPoint x="1" y="1" GeoY="50" GeoX="-0.8"/> <ControlPoint x="1" y="595.14" GeoY="50.4" GeoX="-0.8"/> <ControlPoint x="841.698" y="1" GeoY="50" GeoX="-0.1"/> <ControlPoint x="841.698" y="595.14" GeoY="50.4" GeoX="-0.1"/> </Georeferencing> ...
  6. XML Composition File <Content> <IfLayerOn layerId="background"> <Raster dataset="chart.tif" georeferencingId="georeferenced"/> </IfLayerOn>

    <IfLayerOn layerId="nelson"> <Vector dataset="Nelson.shp" layer="Nelson" georeferencingId="georeferenced" ogrStyleString='SYMBOL(c:#bd1b44,s:2,id:"ogr-sym-3")’> <LogicalStructure displayLayerName="Nelson" fieldToDisplay="time"/> </Vector> </IfLayerOn> ...
  7. Preprocessing • Convert series of points to a line •

    Extract points: • Every hour • Every 10 minutes • First point
  8. <IfLayerOn layerId="Nelson"> <Vector dataset="Nelson_10min.geojson" layer="Nelson_10min" georeferencingId="georeferenced" ogrStyleString='SYMBOL(c:#bd1b44,s:2,id:"ogr-sym-3")’> <LogicalStructure displayLayerName="Nelson" fieldToDisplay="time"/>

    </Vector> <VectorLabel dataset="Nelson_Hourly.geojson" layer="Nelson_Hourly" georeferencingId="georeferenced" ogrStyleString='LABEL(t:{time_str},c:#bd1b44,s:24pt,p:4,dx:7mm,bo:1)’/> <VectorLabel dataset="Nelson_FirstPoint.geojson" layer="Nelson_FirstPoint" georeferencingId="georeferenced" ogrStyleString='LABEL(t:"Nelson",c:#bd1b44,s:24pt,p:2,dy:10mm,bo:1)’/> <Vector dataset="Nelson_Lines.geojson" layer="Nelson_Lines" georeferencingId="georeferenced" ogrStyleString='PEN(c:#bd1b44,w:5px)'/> </IfLayerOn>
  9. PDF Javascript <Javascript> ... </Javascript> var btn = this.addField("btn1" ,

    "button", 1, fldRect); btn.setAction("MouseUp", "JS CODE HERE") var ocgs = this.getOCGs(); ocgs[0].state = false ocgs[0].state = true
  10. PDF Javascript app.setInterval("nextTimestep()", 1000); function nextTimestep() { // Simplified to

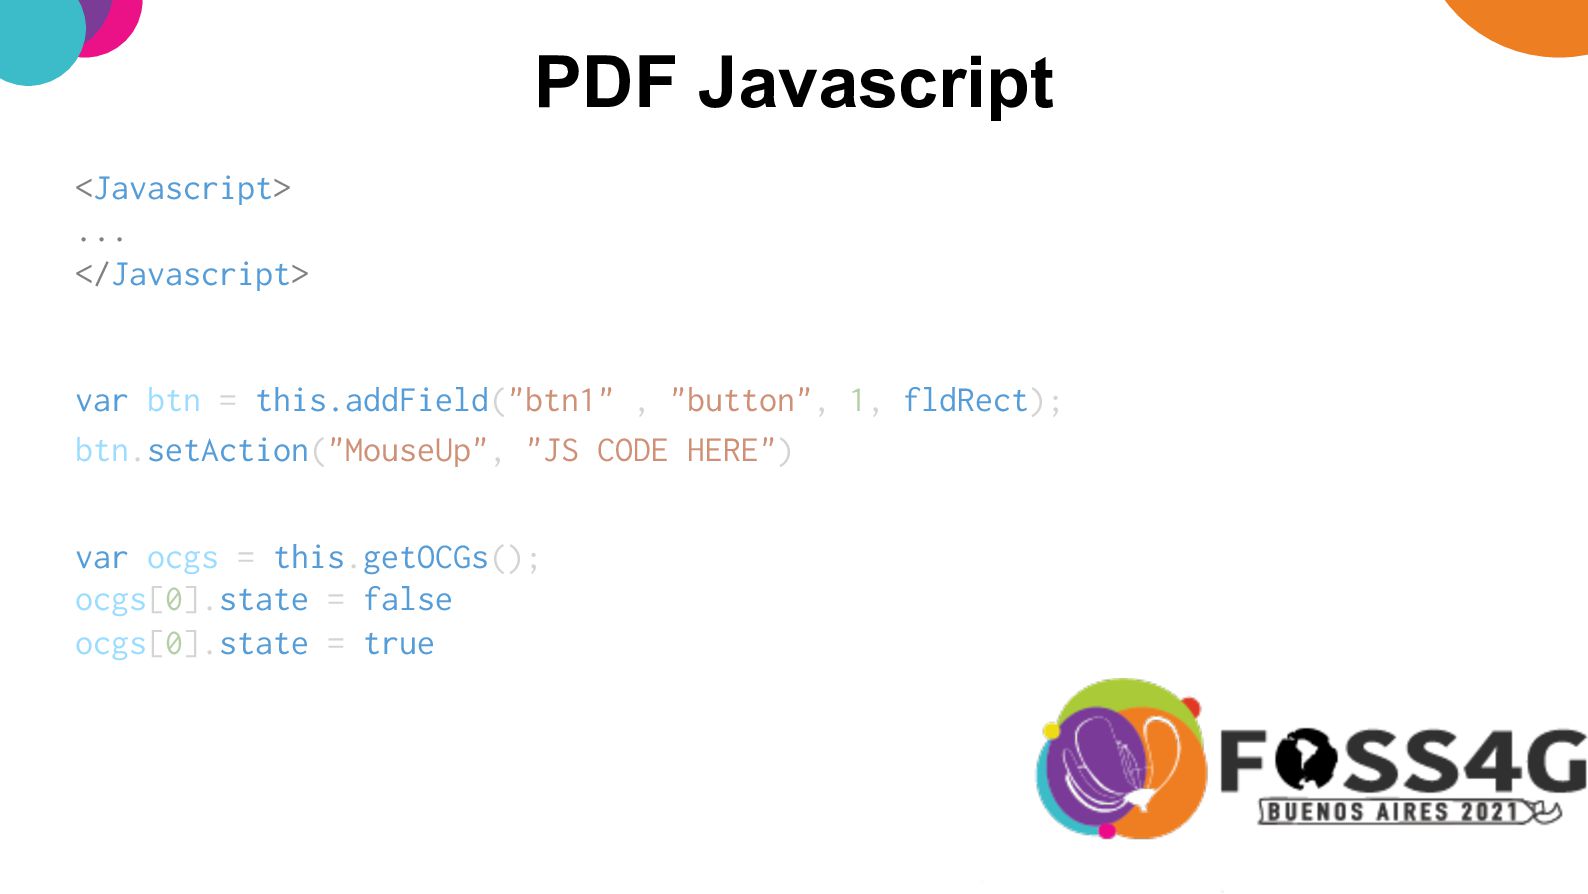
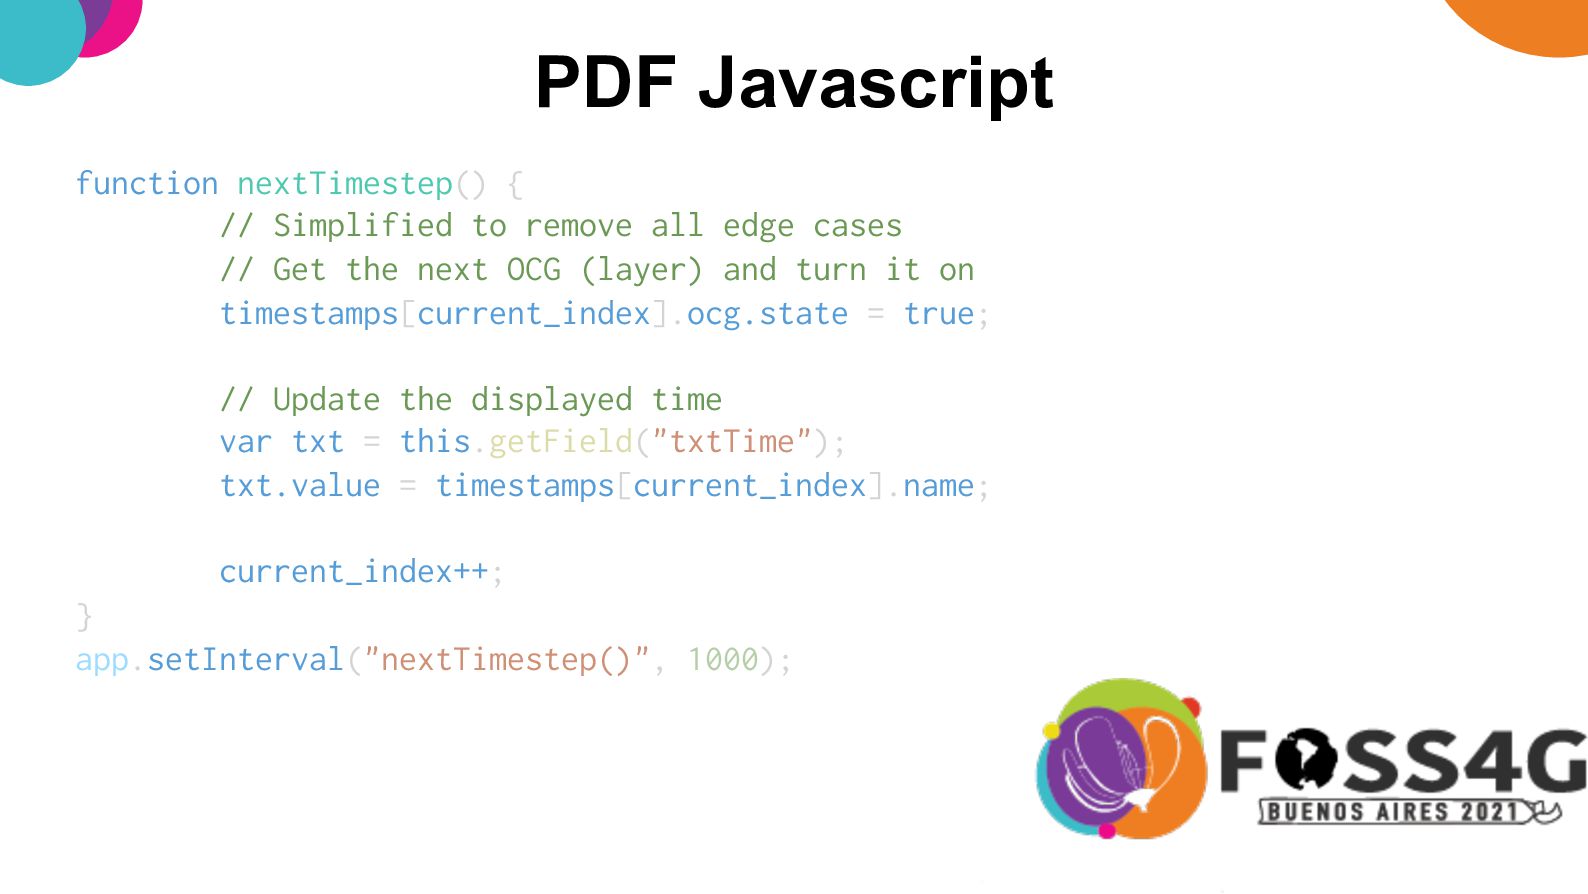
    remove all edge cases // Get the next OCG (layer) and turn it on timestamps[current_index].ocg.state = true; // Update the displayed time var txt = this.getField("txtTime"); txt.value = timestamps[current_index].name; current_index++; }
  11. Advantages…? • No need to install other software – just

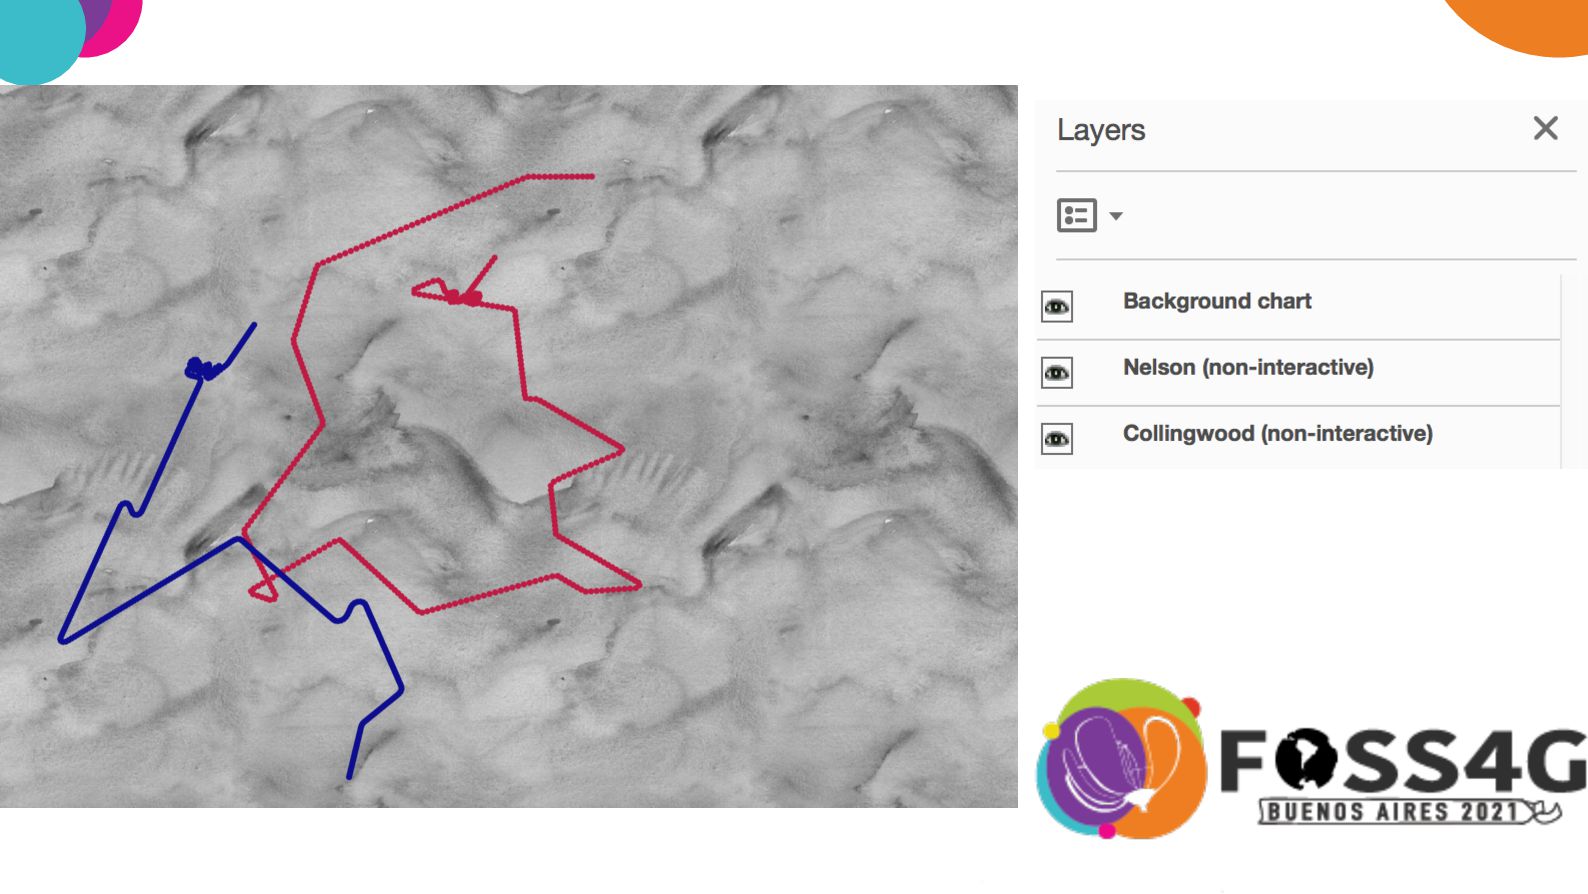
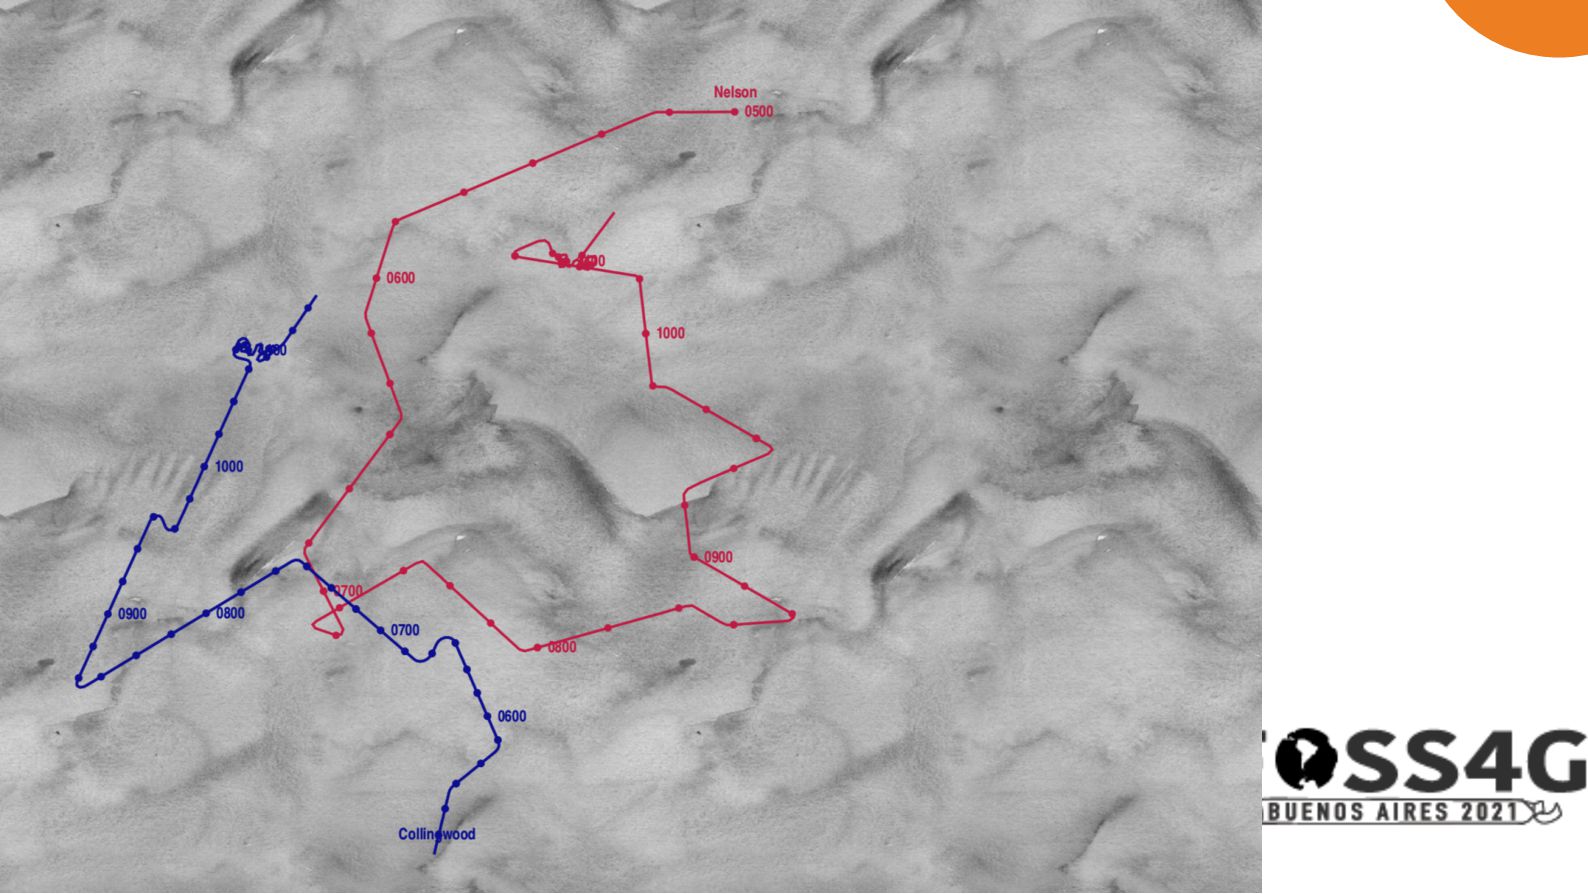
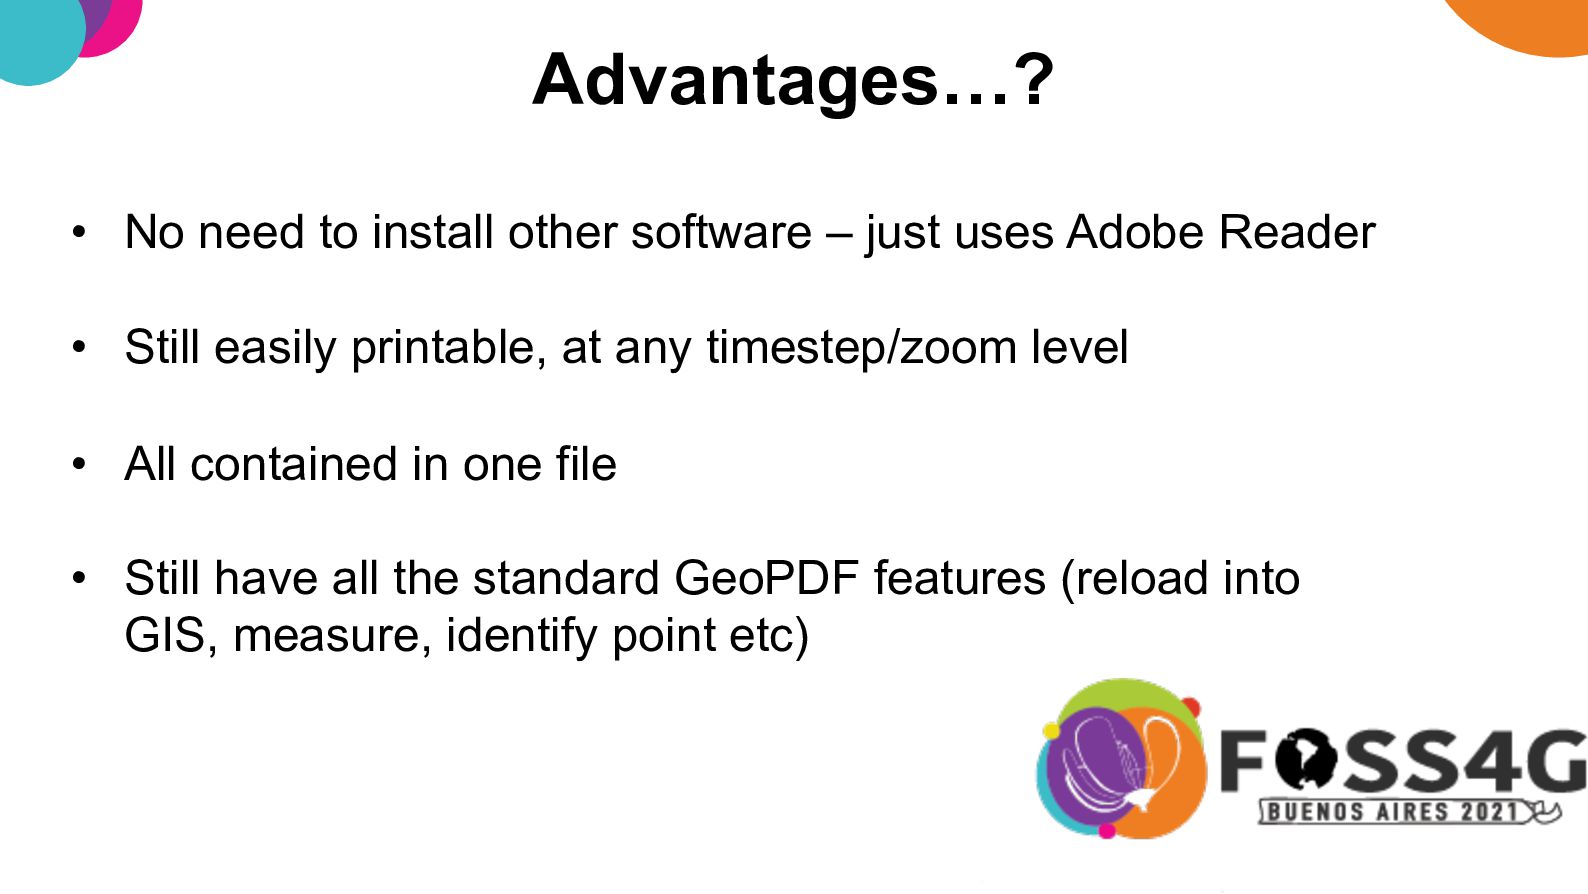
    uses Adobe Reader • Still easily printable, at any timestep/zoom level • All contained in one file • Still have all the standard GeoPDF features (reload into GIS, measure, identify point etc)
  12. PDF Javascript strangeness // Print these elements to the console.

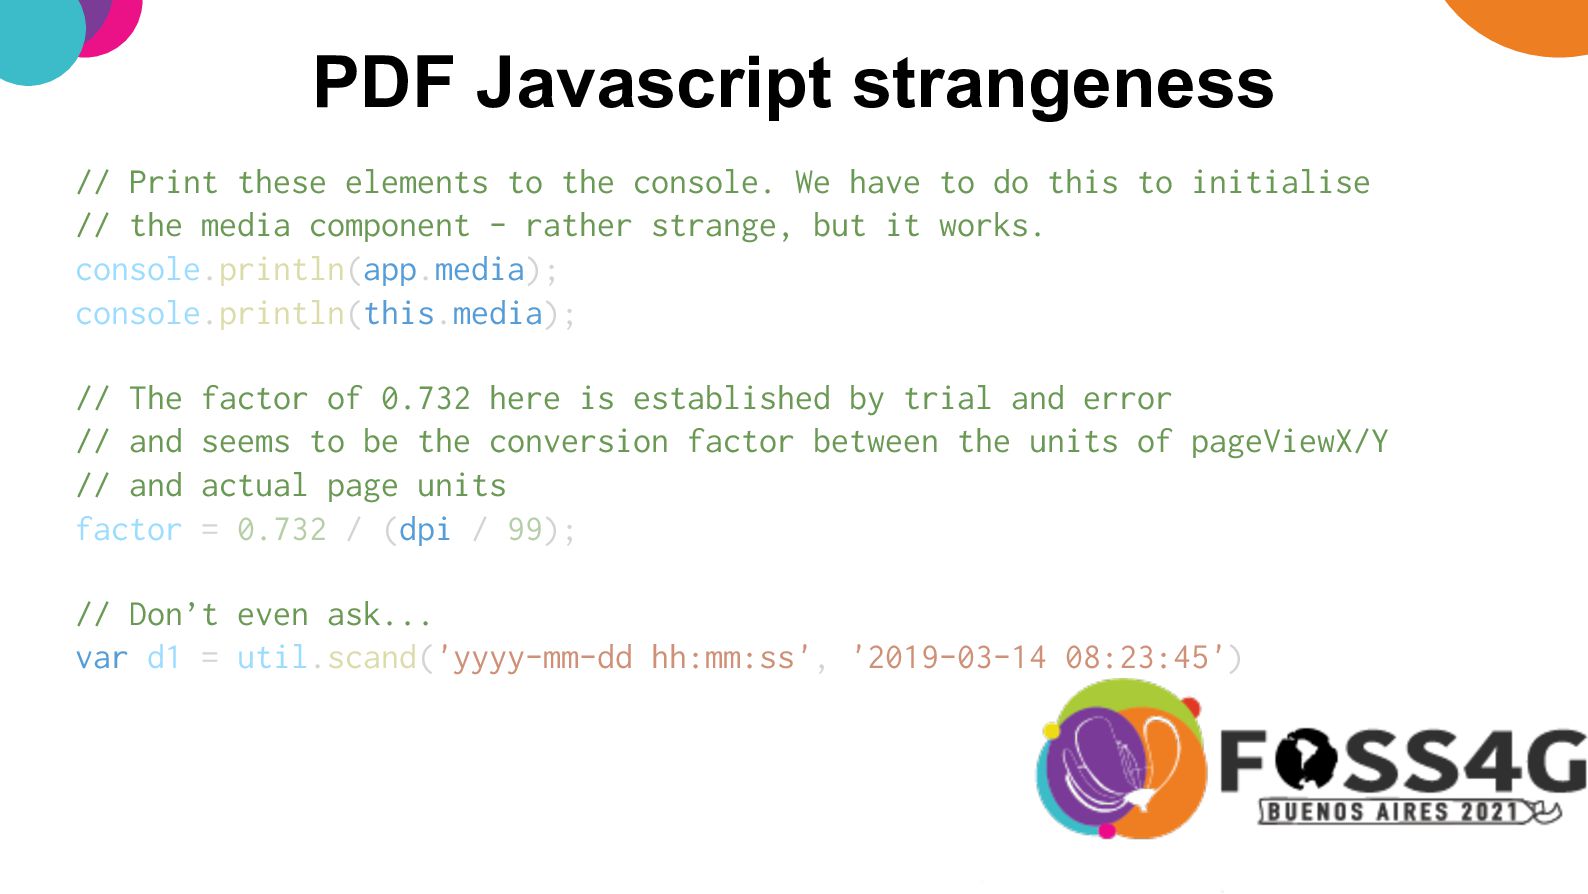
    We have to do this to initialise // the media component - rather strange, but it works. console.println(app.media); console.println(this.media); // The factor of 0.732 here is established by trial and error // and seems to be the conversion factor between the units of pageViewX/Y // and actual page units factor = 0.732 / (dpi / 99); // Don’t even ask... var d1 = util.scand('yyyy-mm-dd hh:mm:ss', '2019-03-14 08:23:45')
  13. Summary • QGIS can export to GeoPDF • Basic GeoPDF’s

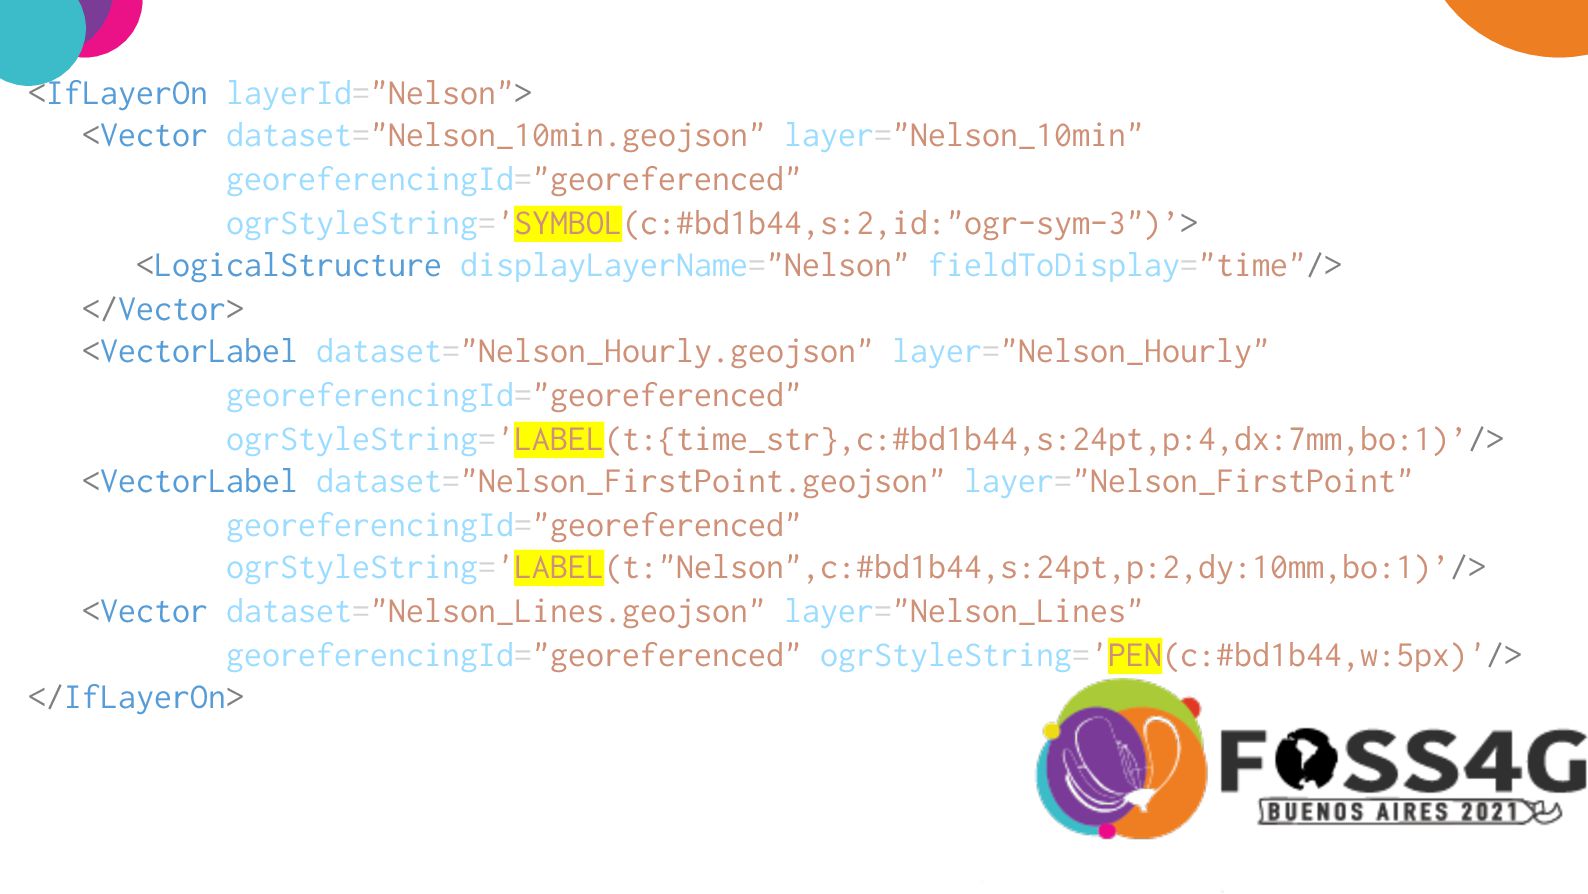
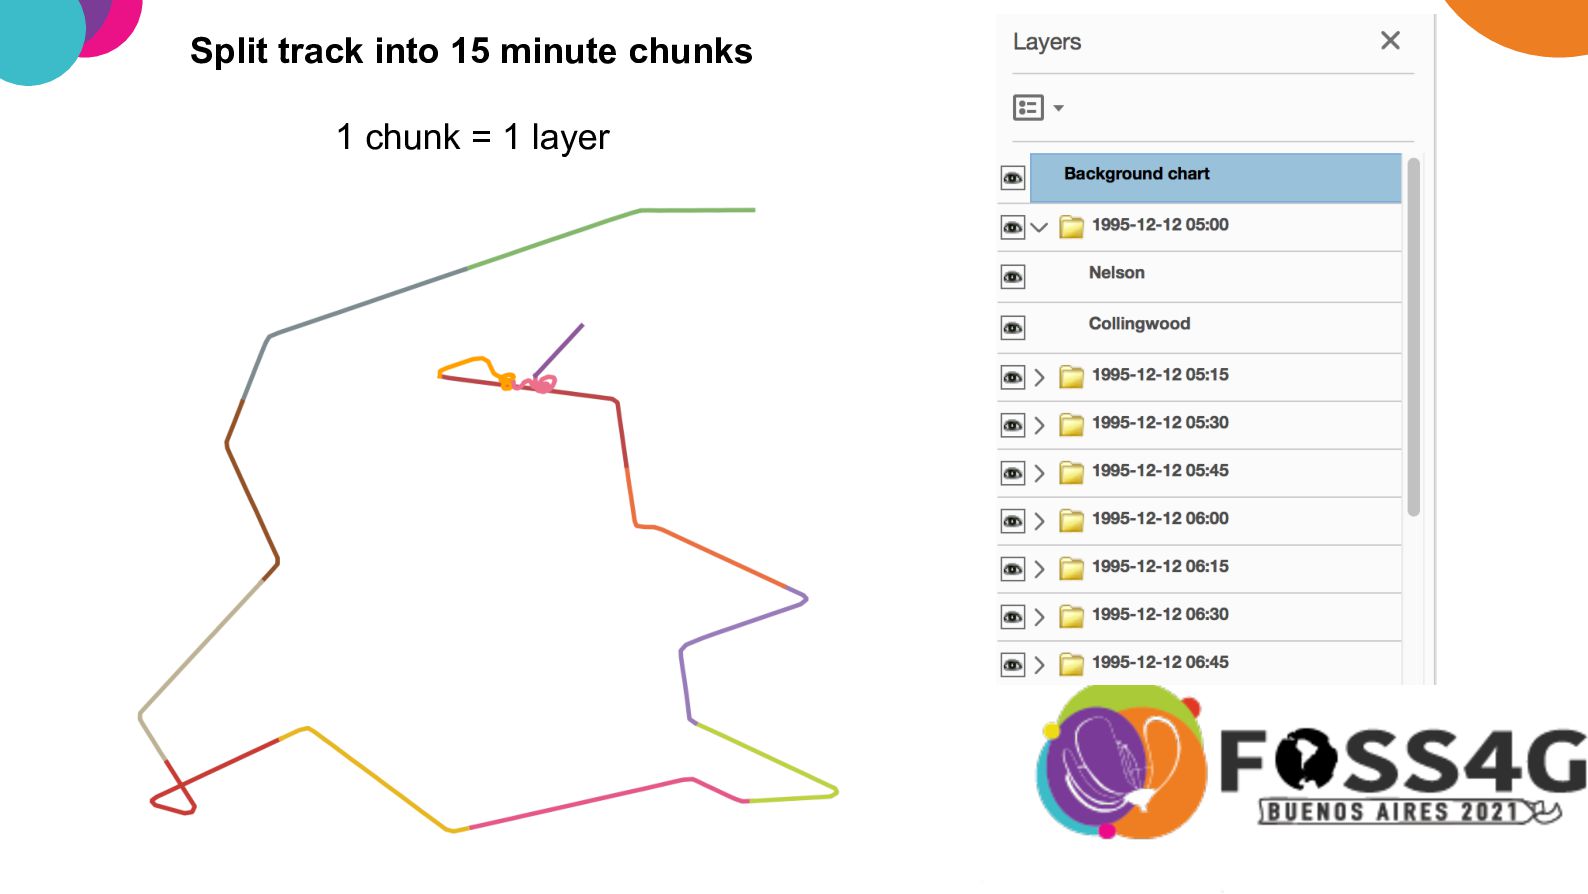
    can be quite powerful • GDAL can create them – including (basic) styling • You can even do (crazy) Javascript stuff to make it fully interactive Any questions?