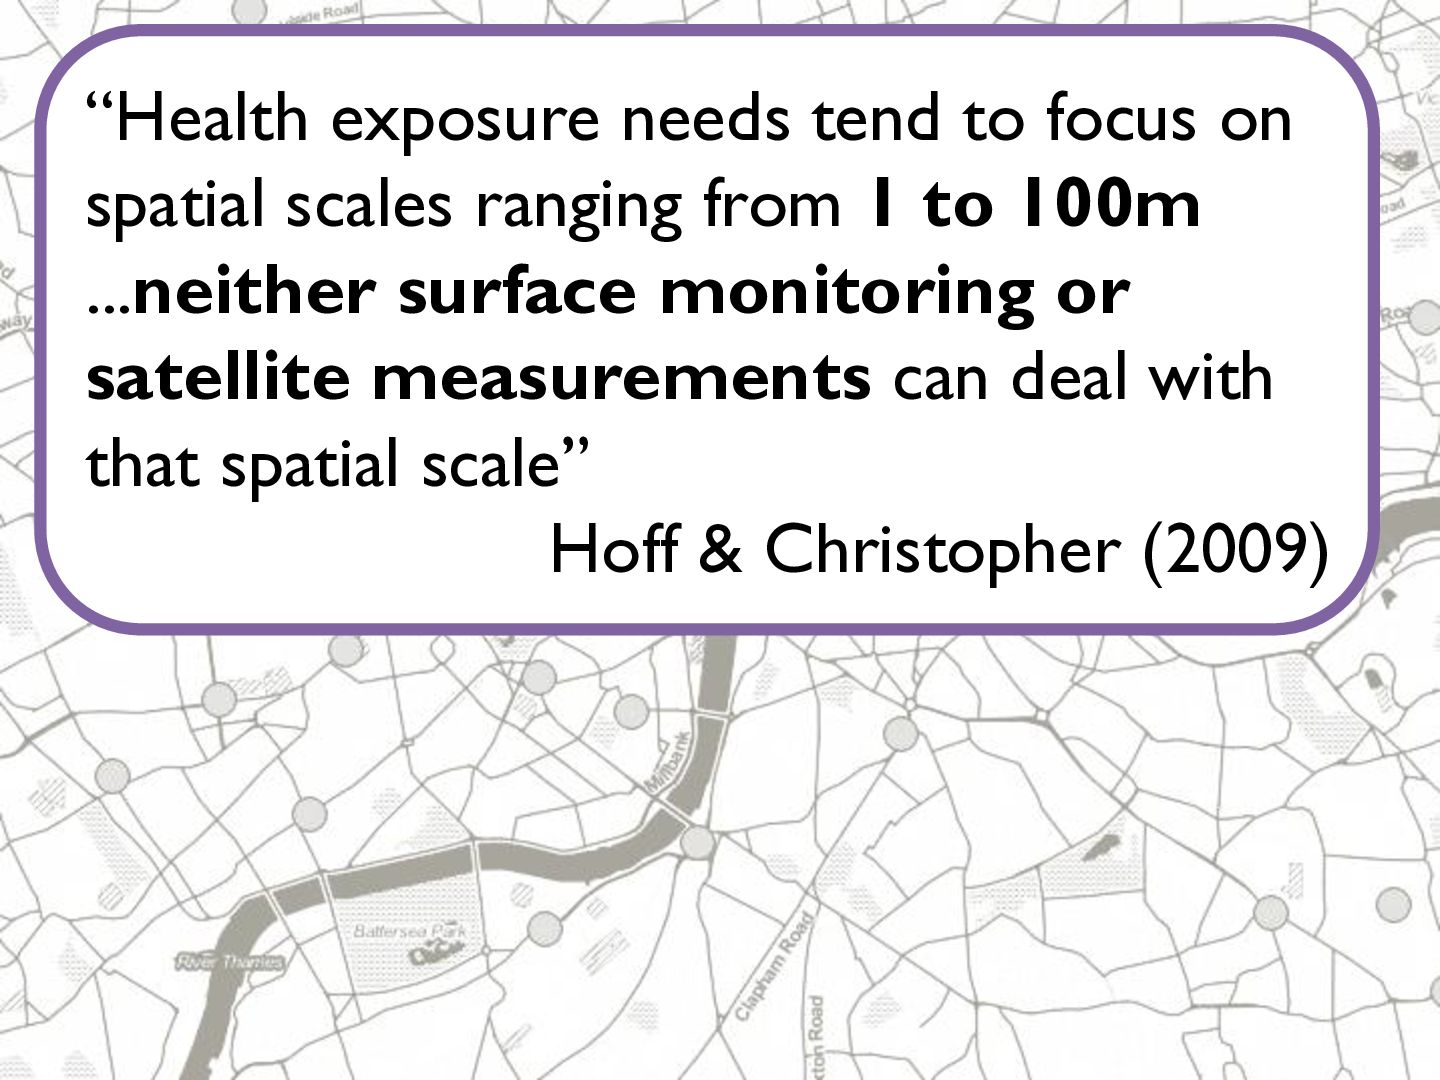
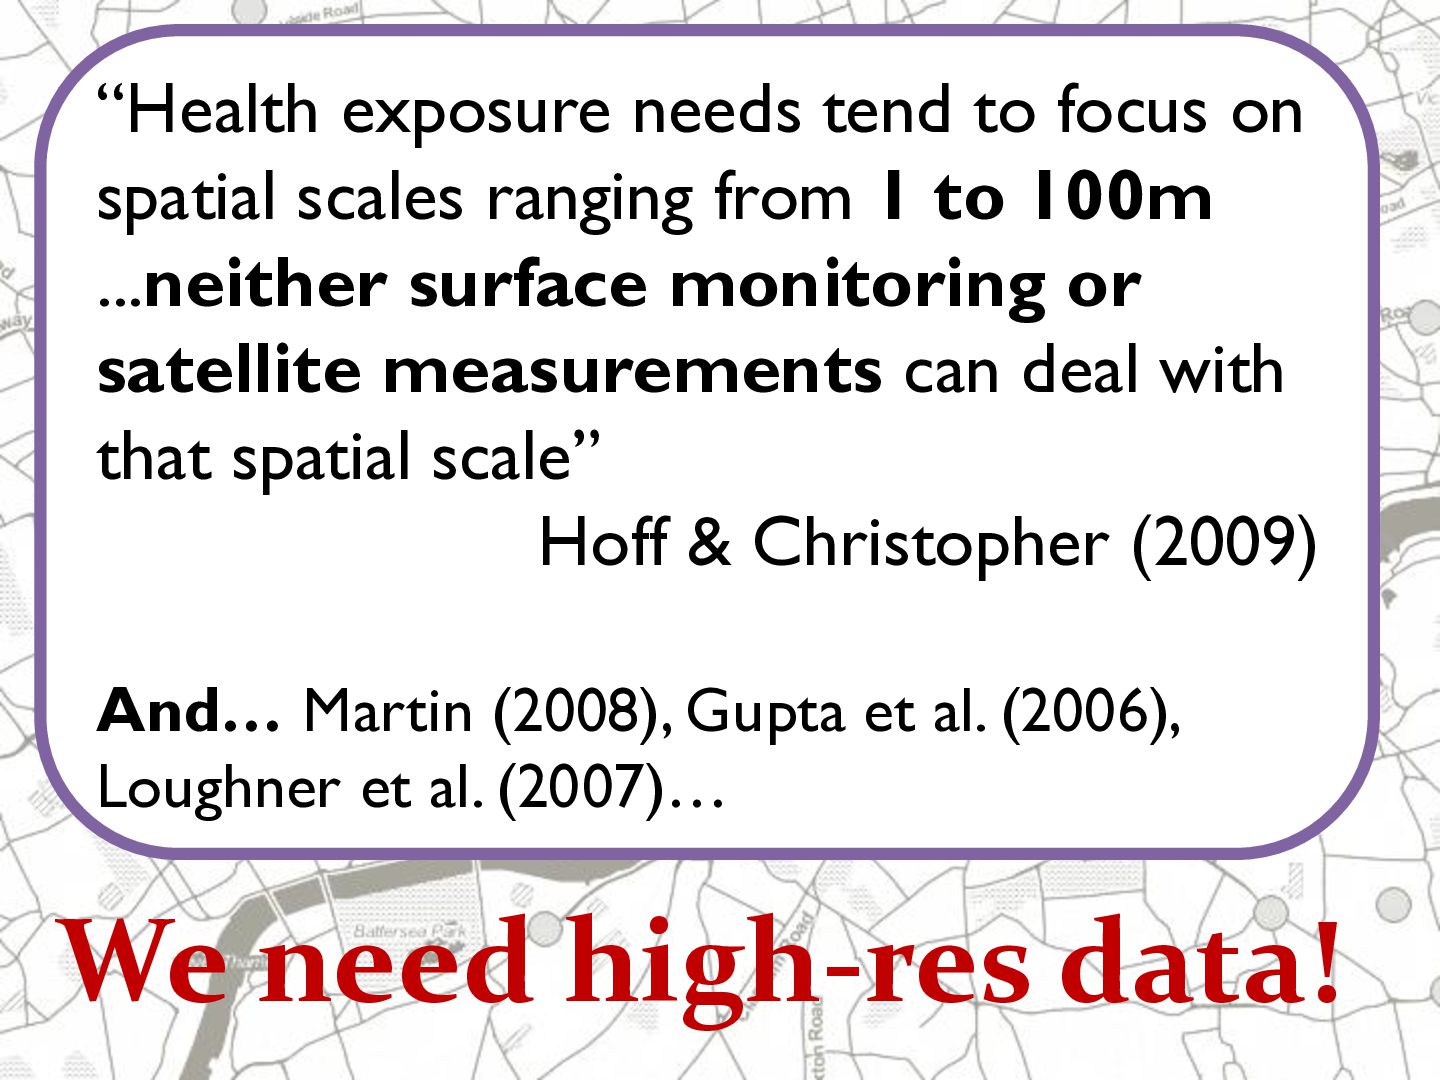
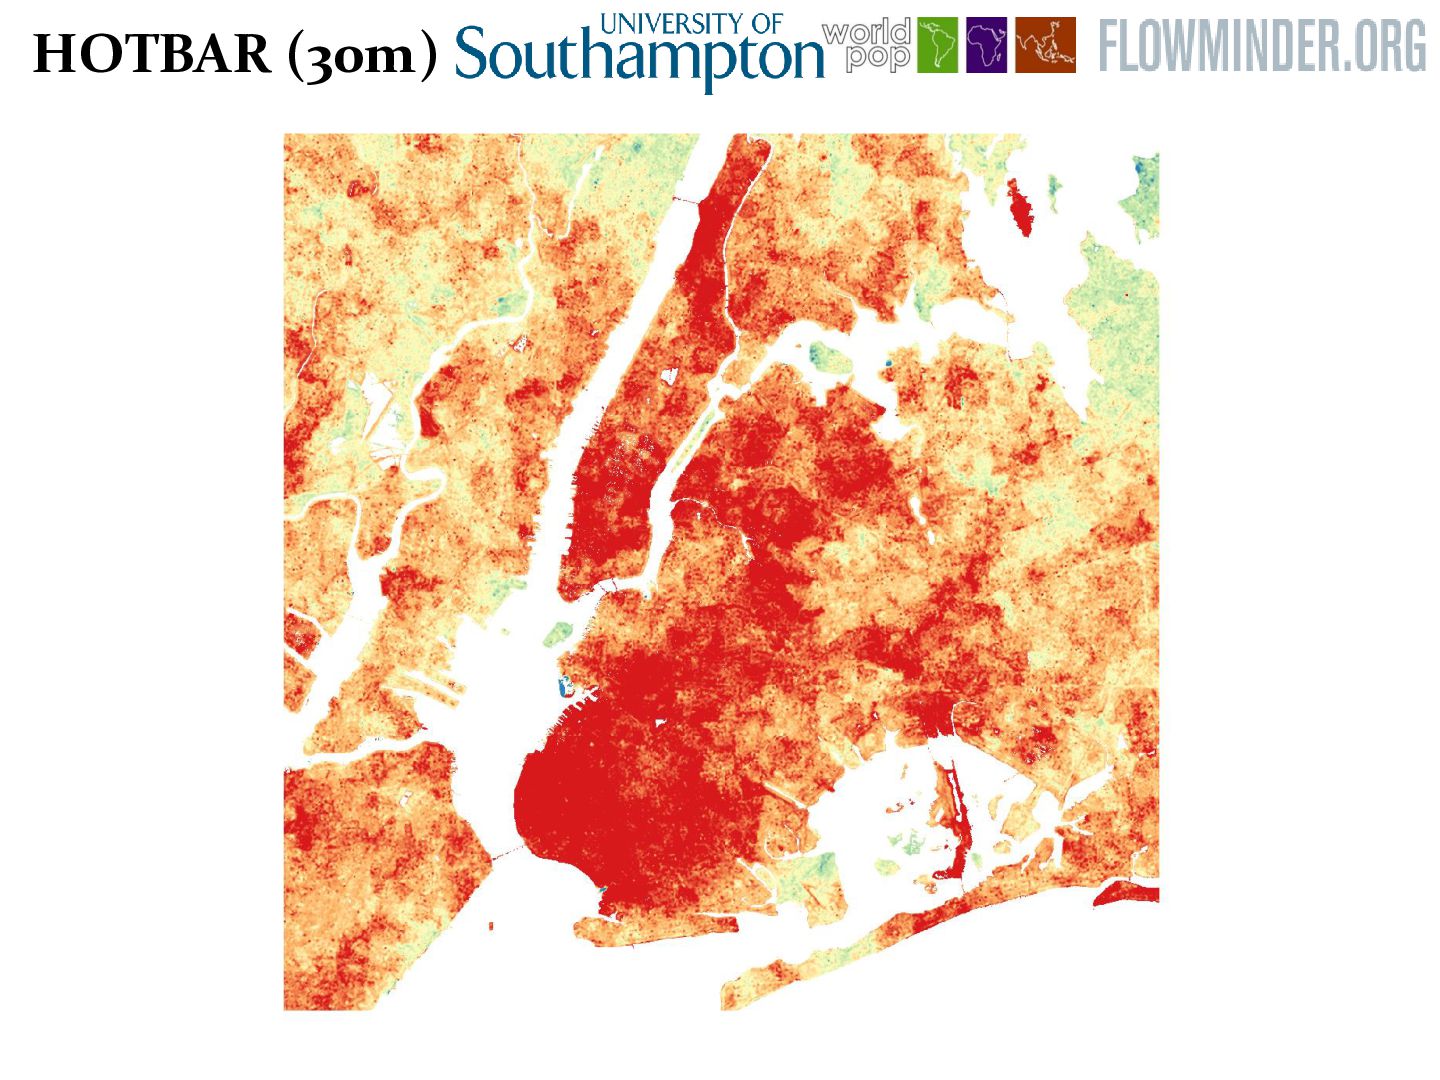
from 1 to 100m ...neither surface monitoring or satellite measurements can deal with that spatial scale” Hoff & Christopher (2009) And… Martin (2008), Gupta et al. (2006), Loughner et al. (2007)… We need high-res data!
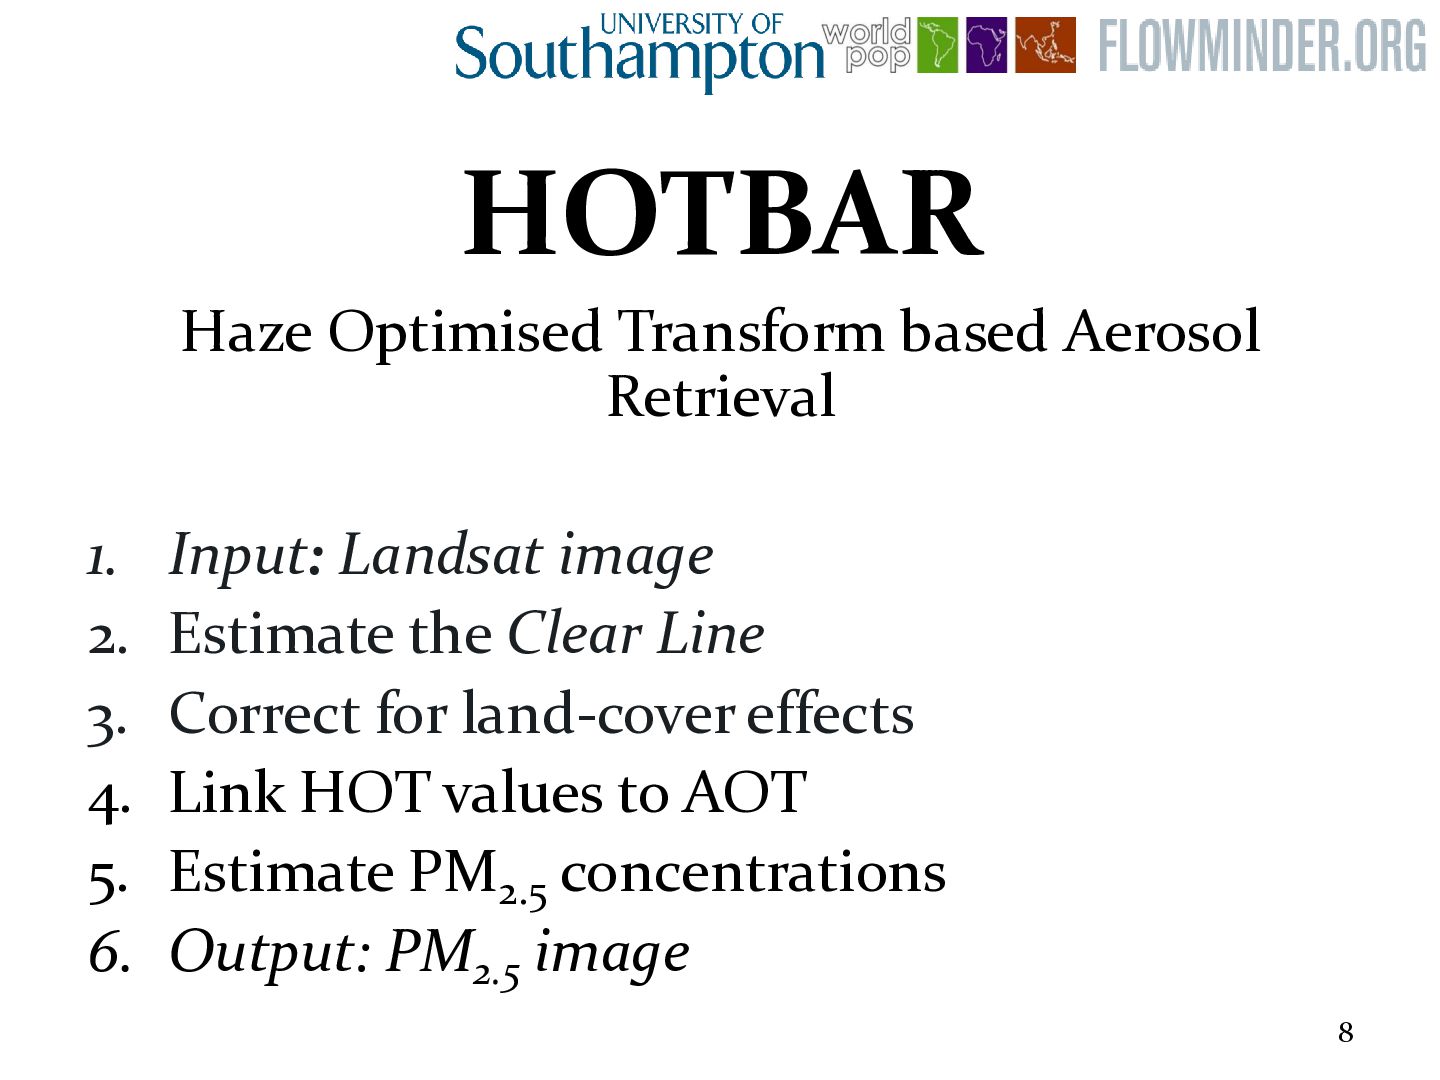
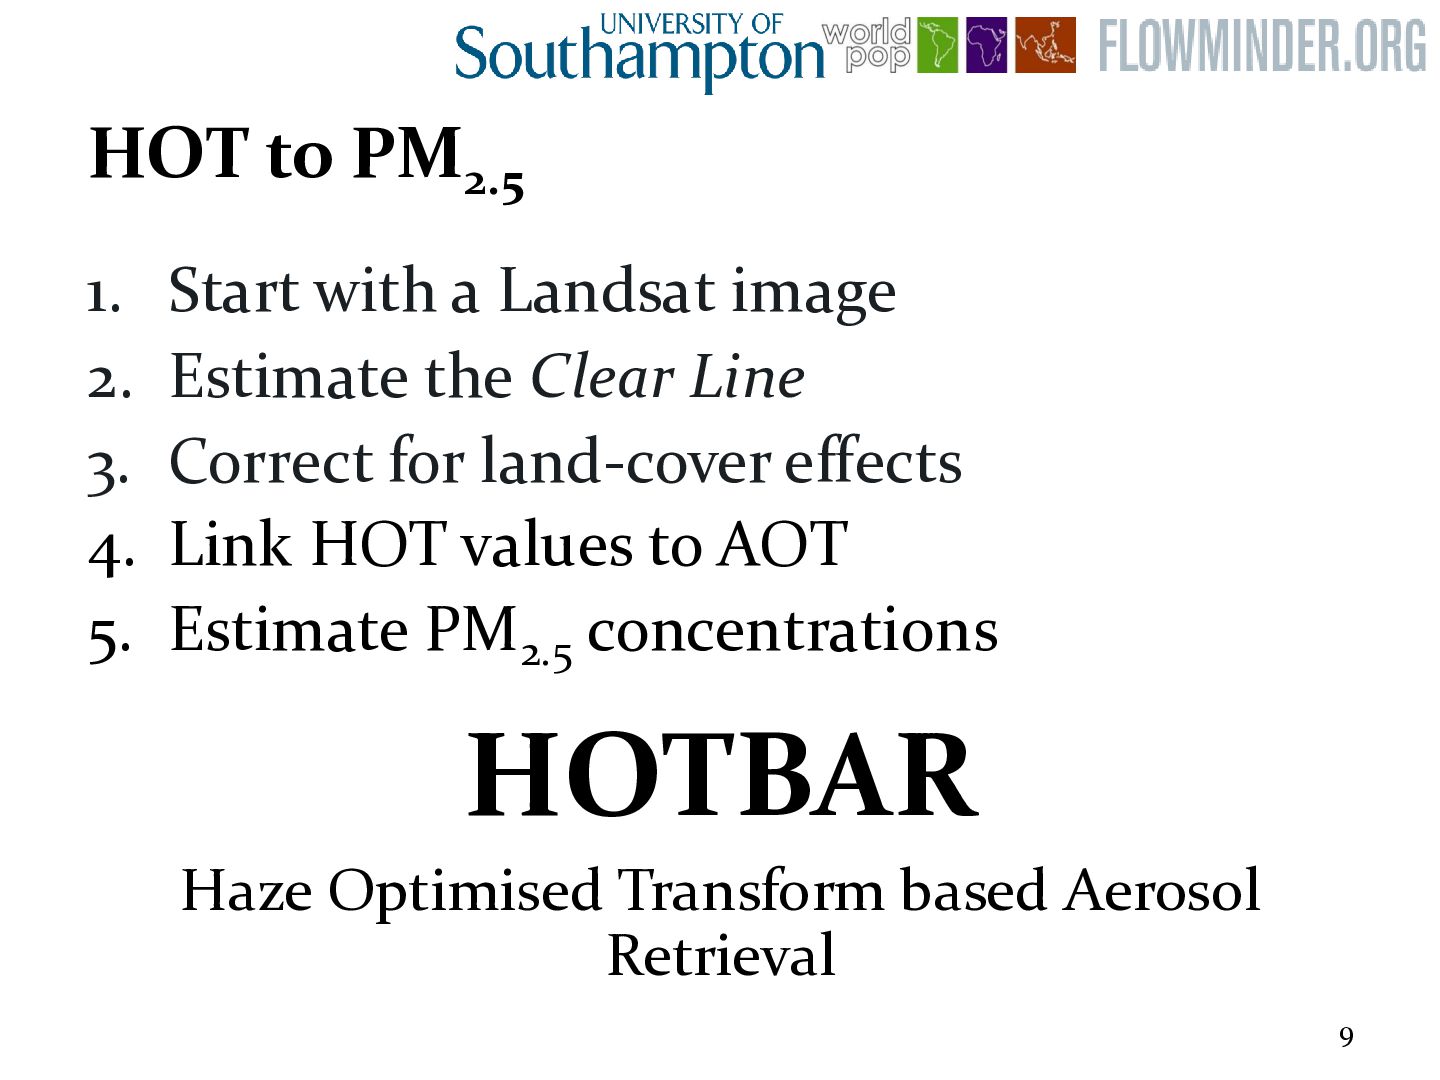
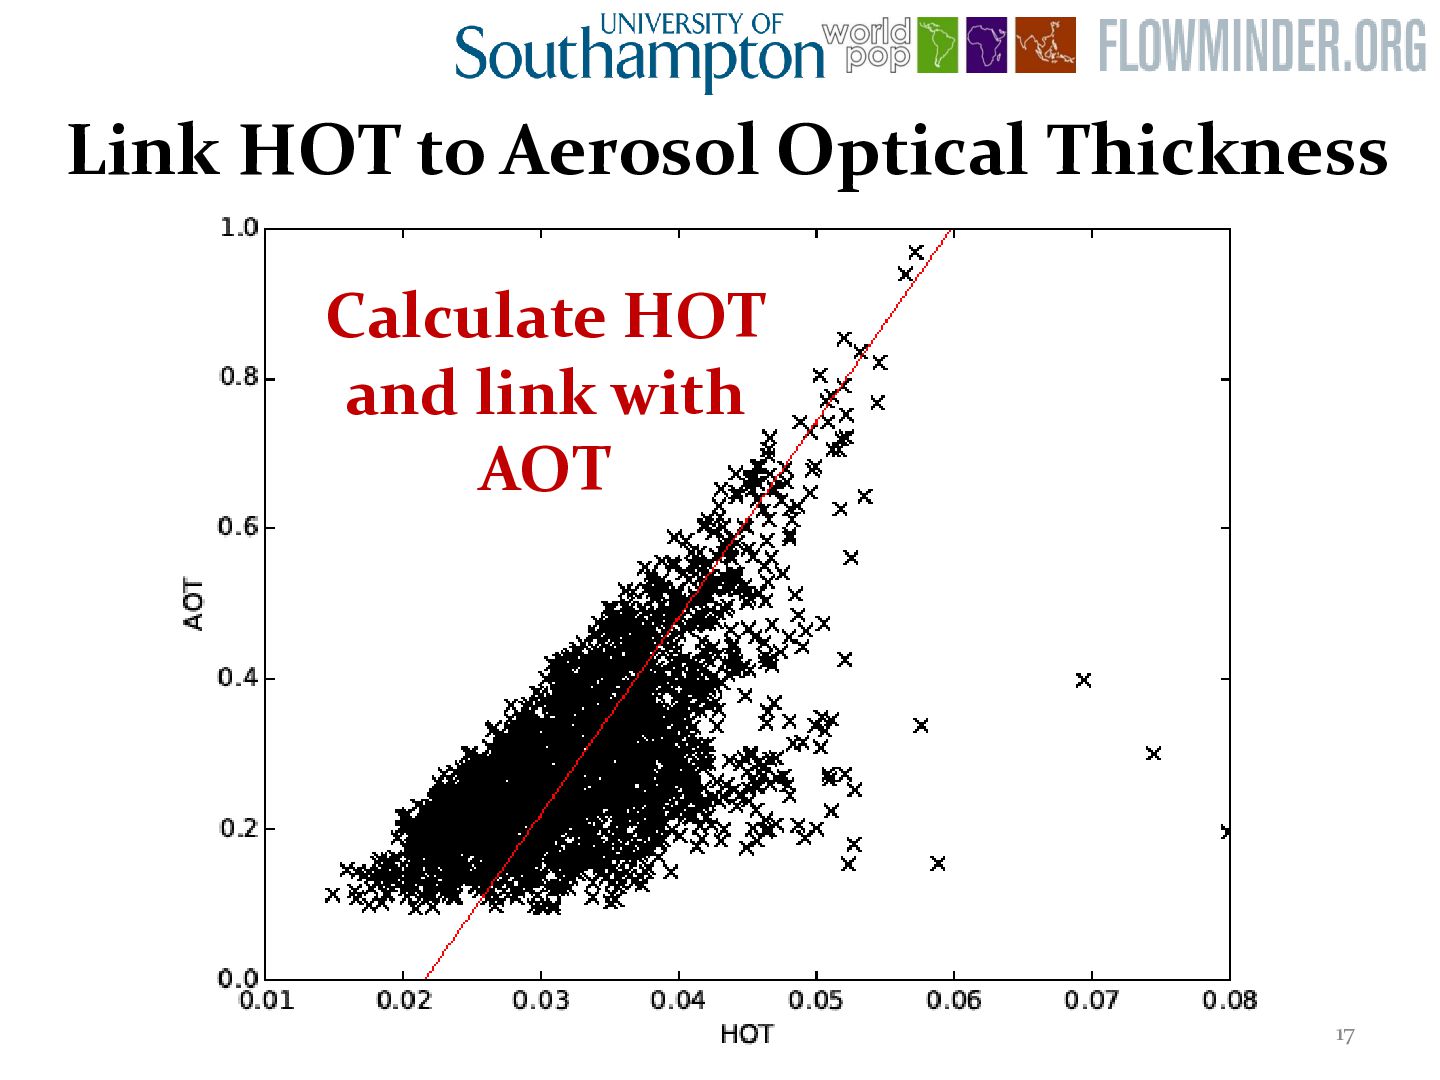
Estimate the Clear Line 3. Correct for land-cover effects 4. Link HOT values to AOT 5. Estimate PM2.5 concentrations HOTBAR Haze Optimised Transform based Aerosol Retrieval 9
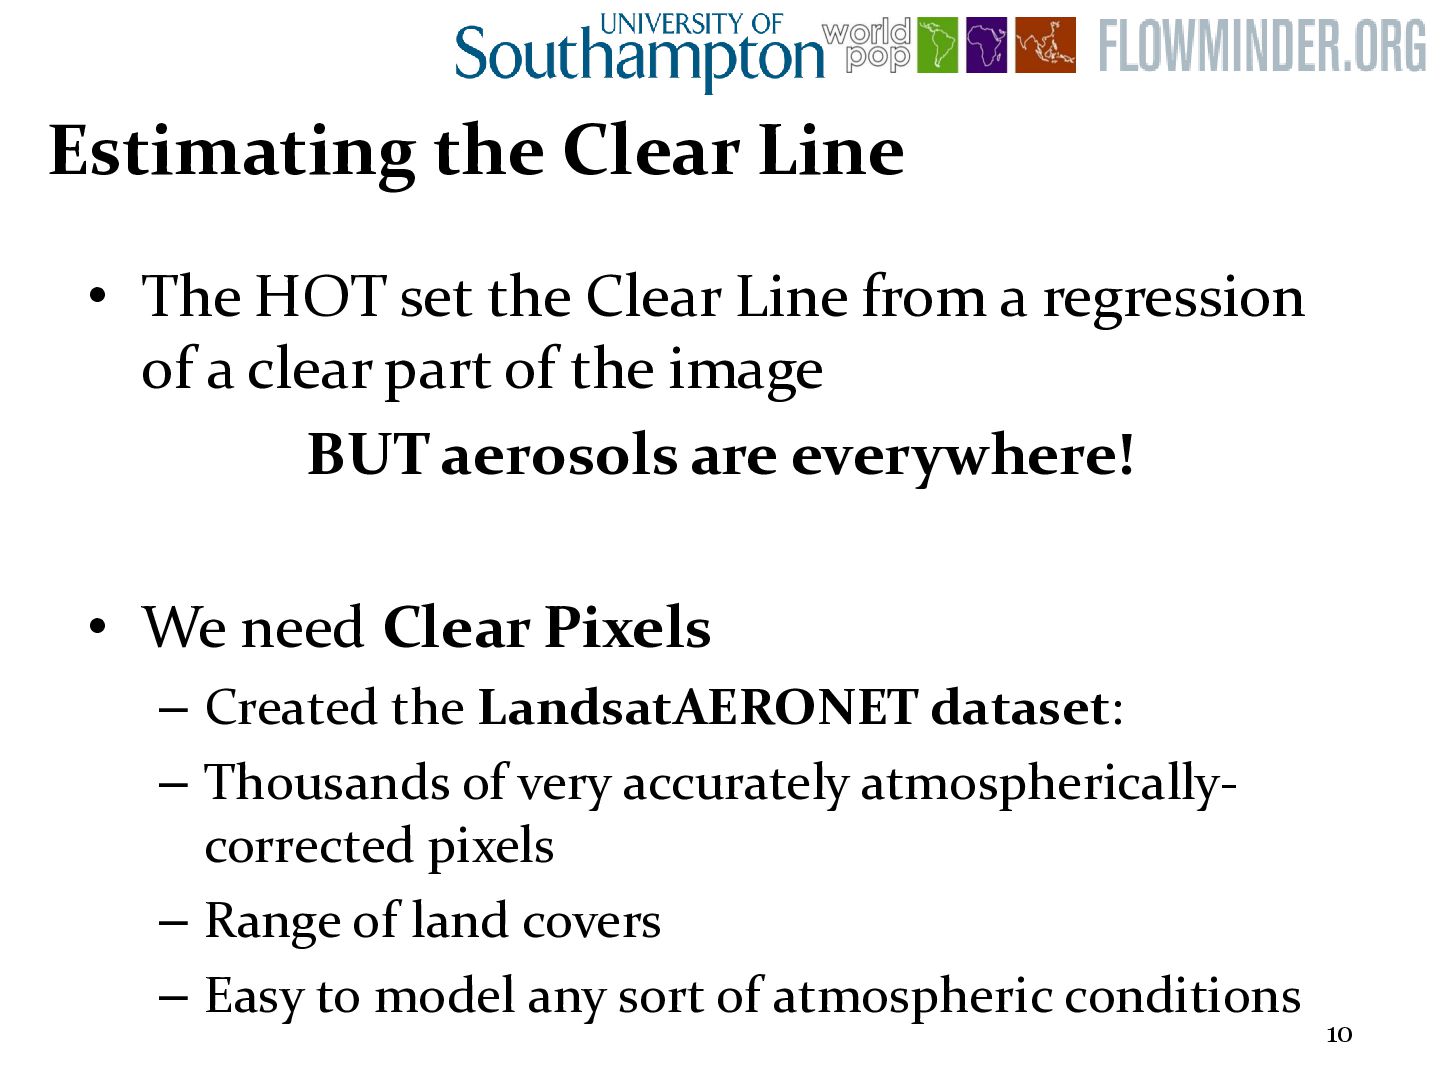
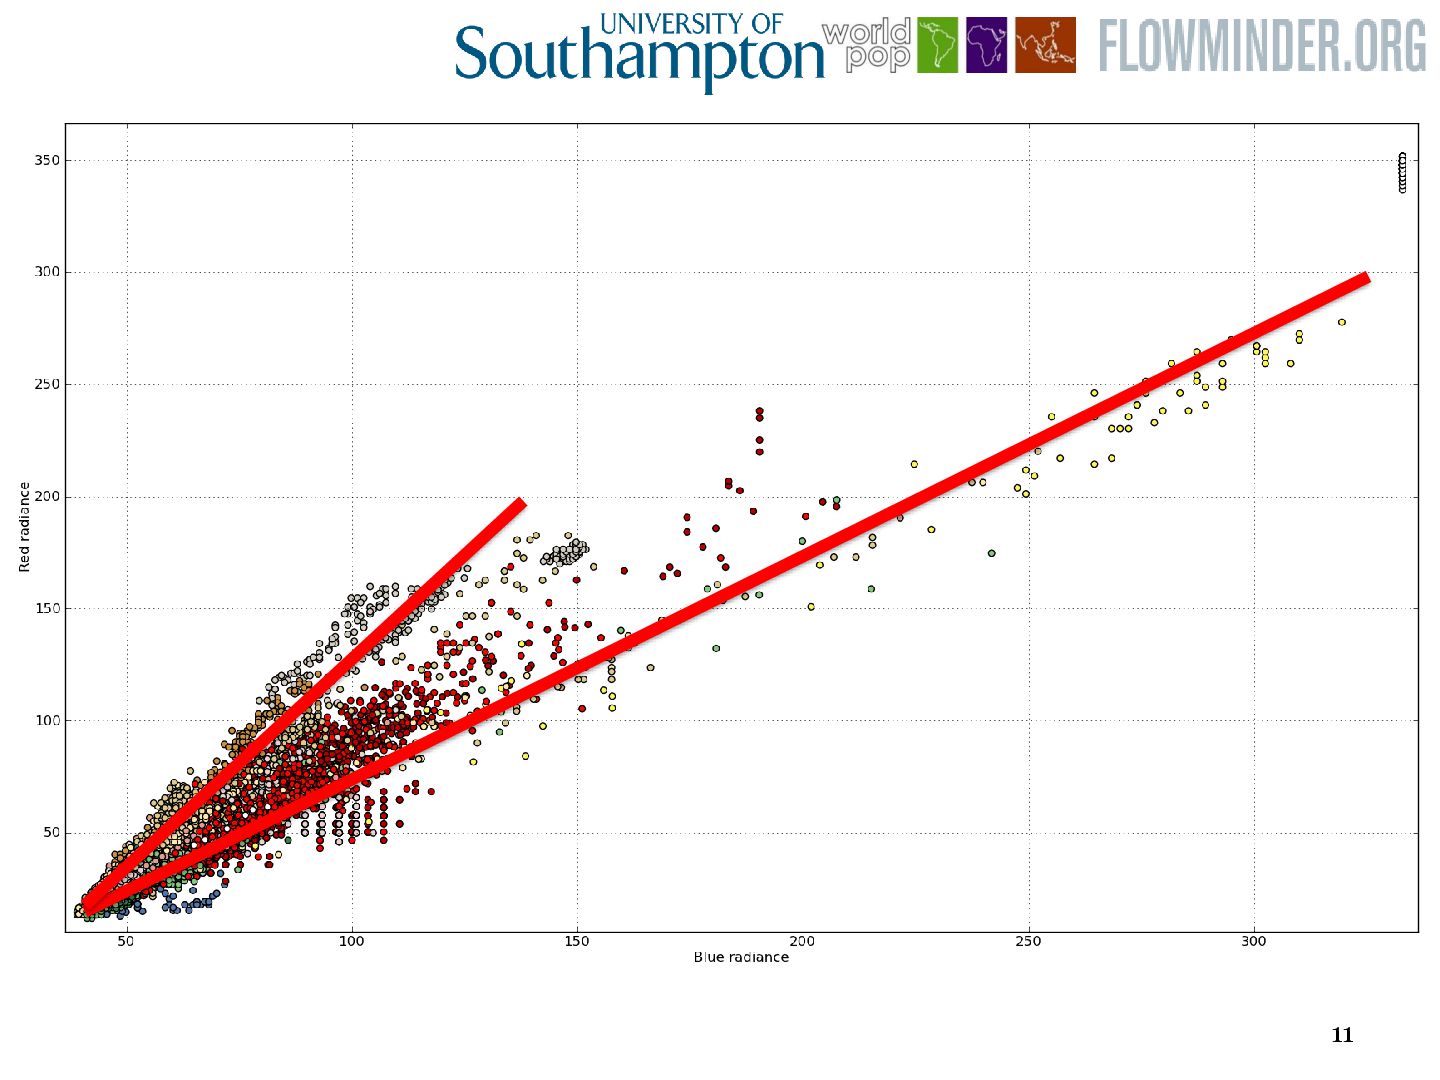
Line from a regression of a clear part of the image BUT aerosols are everywhere! • We need Clear Pixels – Created the LandsatAERONET dataset: – Thousands of very accurately atmospherically- corrected pixels – Range of land covers – Easy to model any sort of atmospheric conditions 10
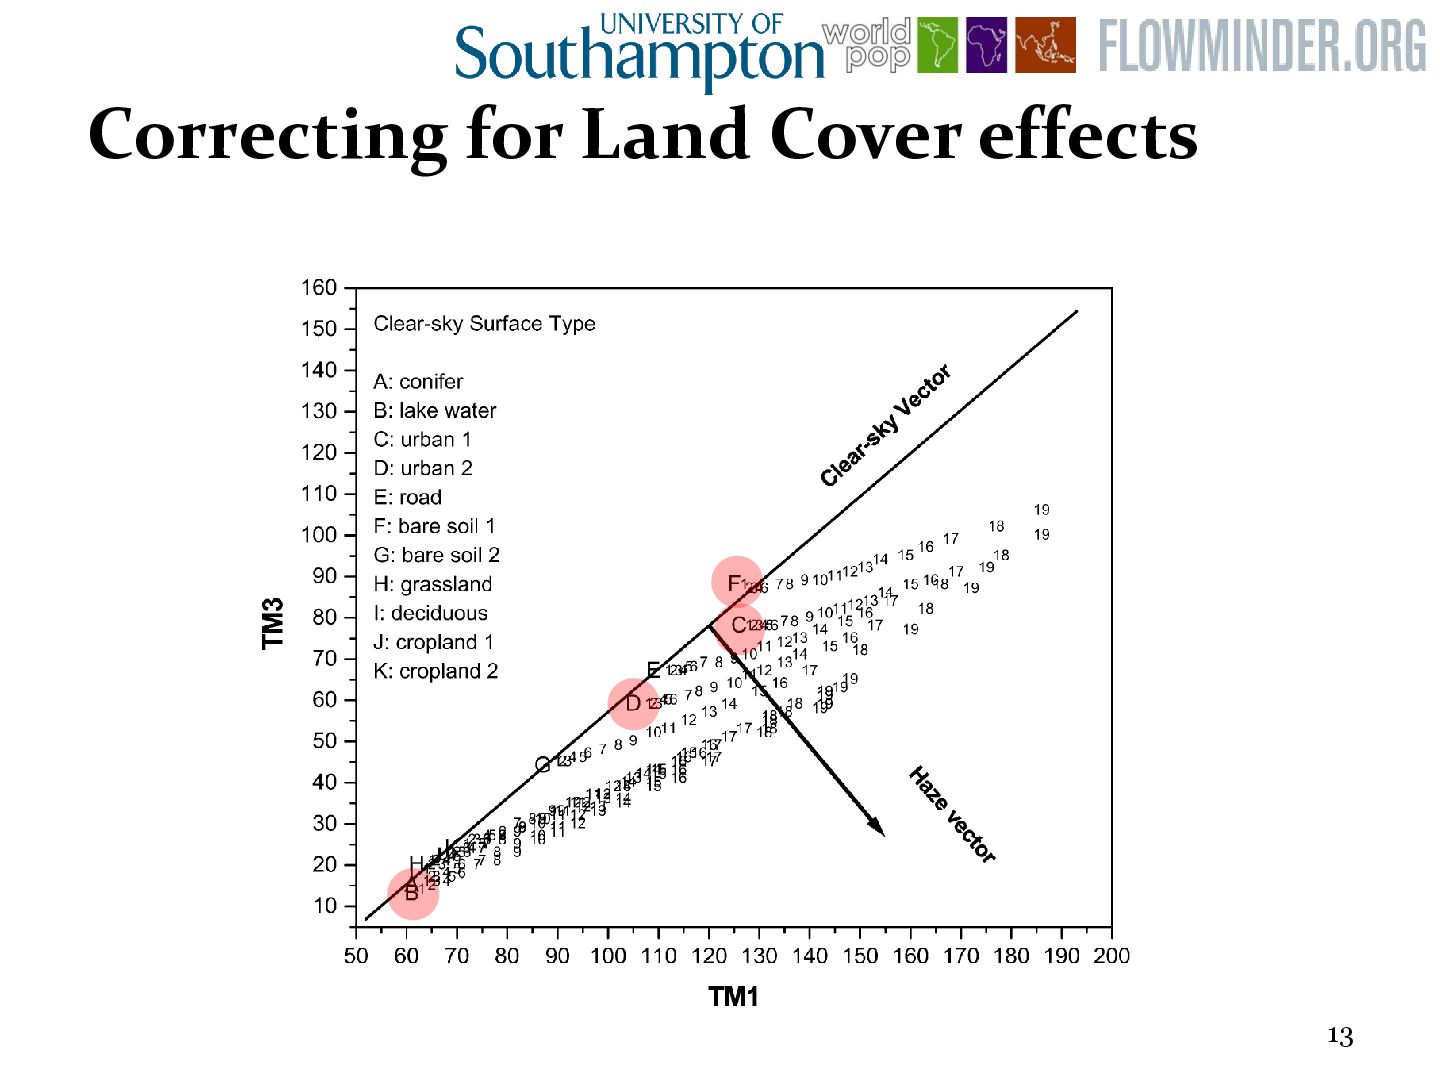
Land Cover invariant • We need to correct for this – how? – Aerosols mix in the atmosphere → no sharp boundaries – Land covers often have sharp boundaries • Look for sharp boundaries, correct the pixel values inside these ‘objects’ → Object-based Image Analysis 14
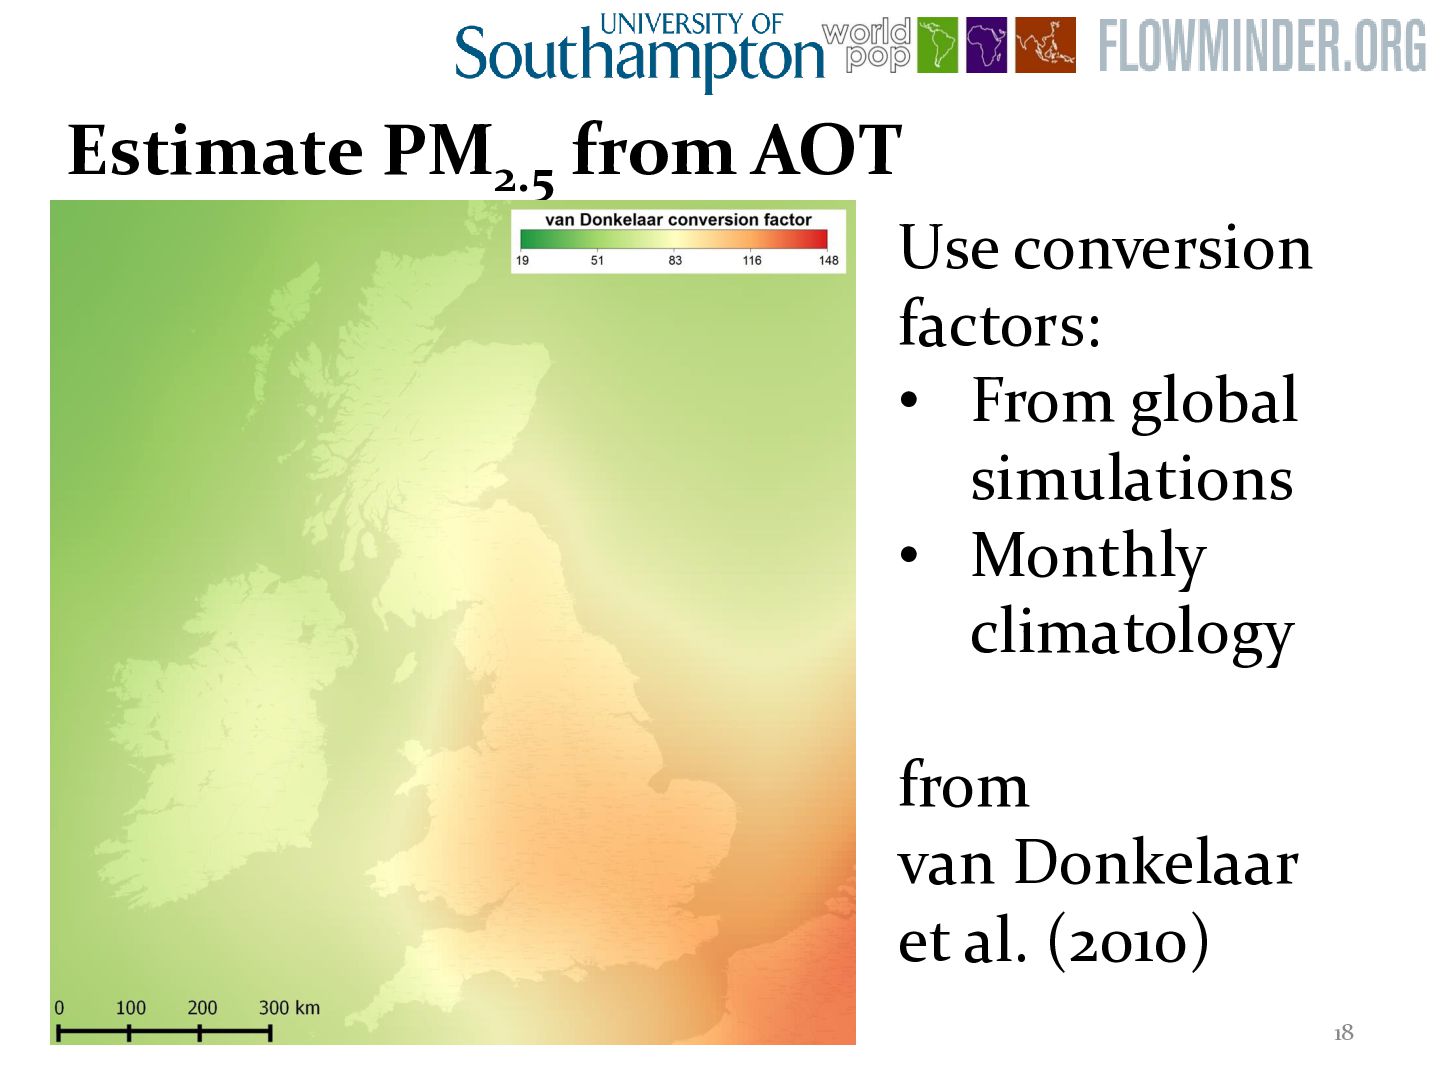
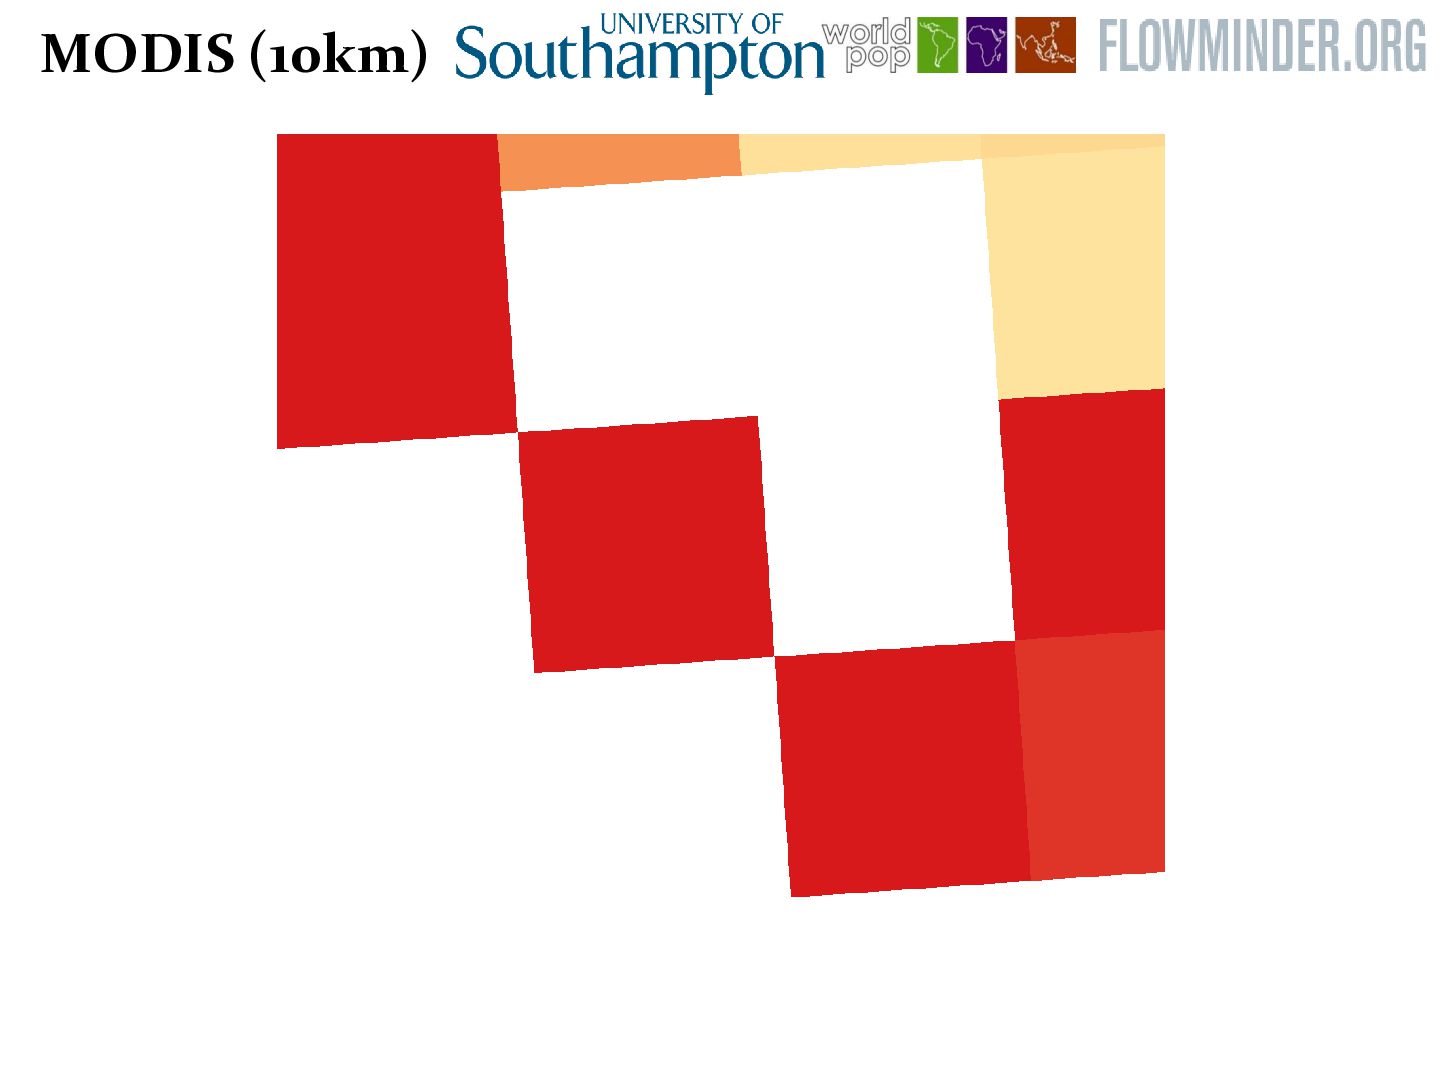
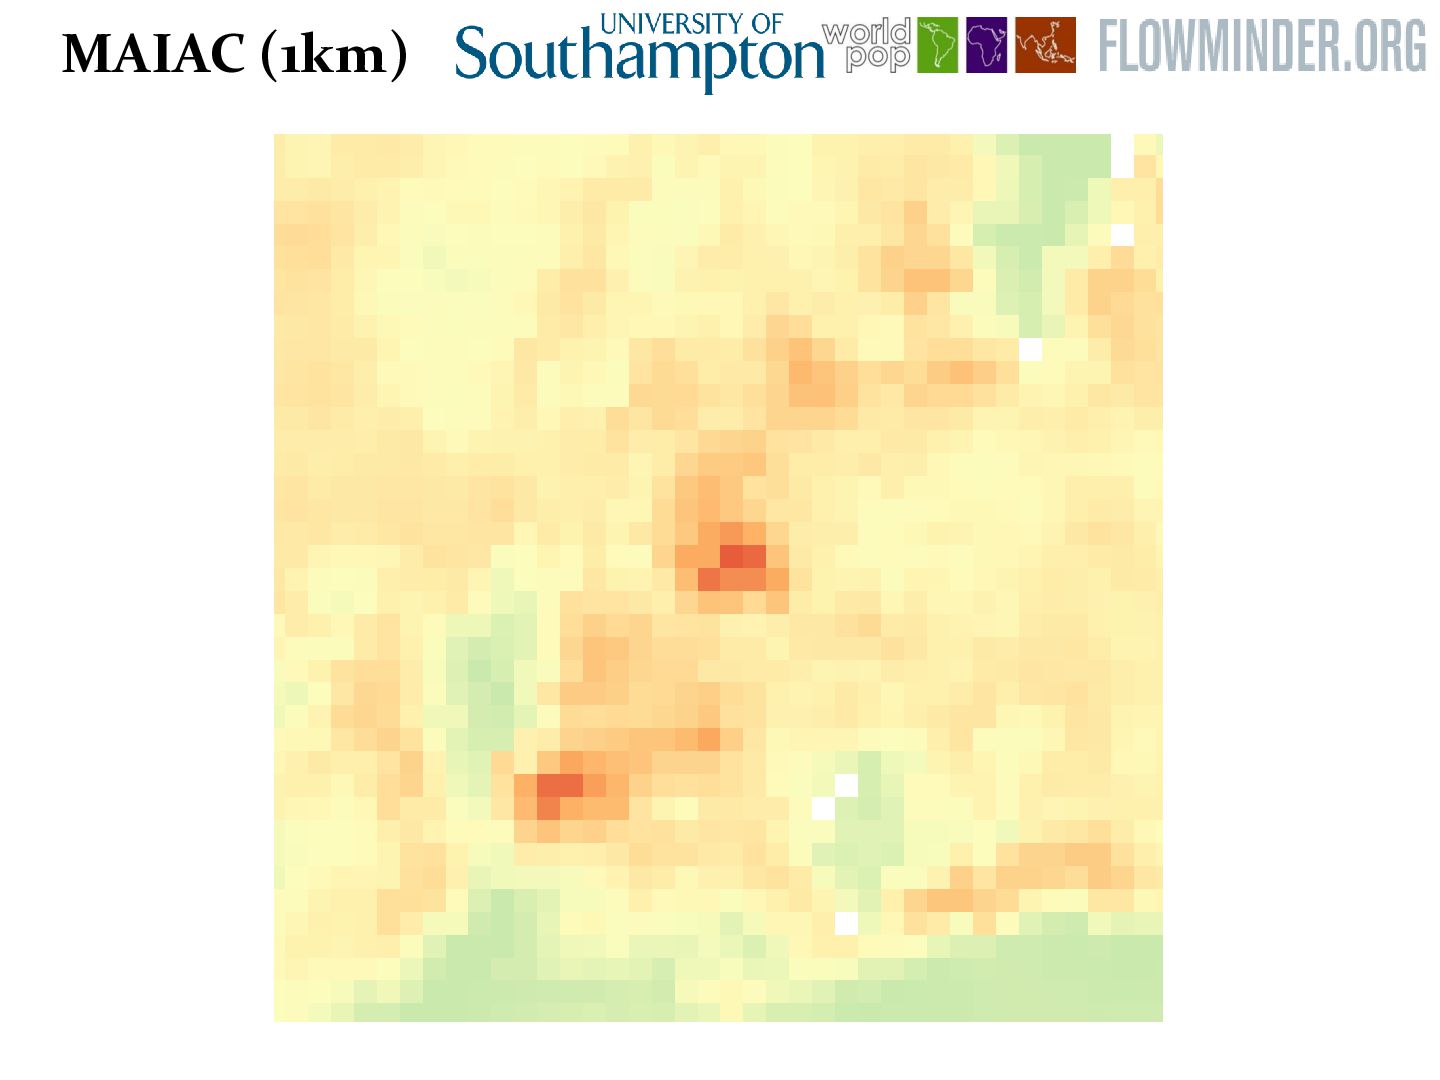
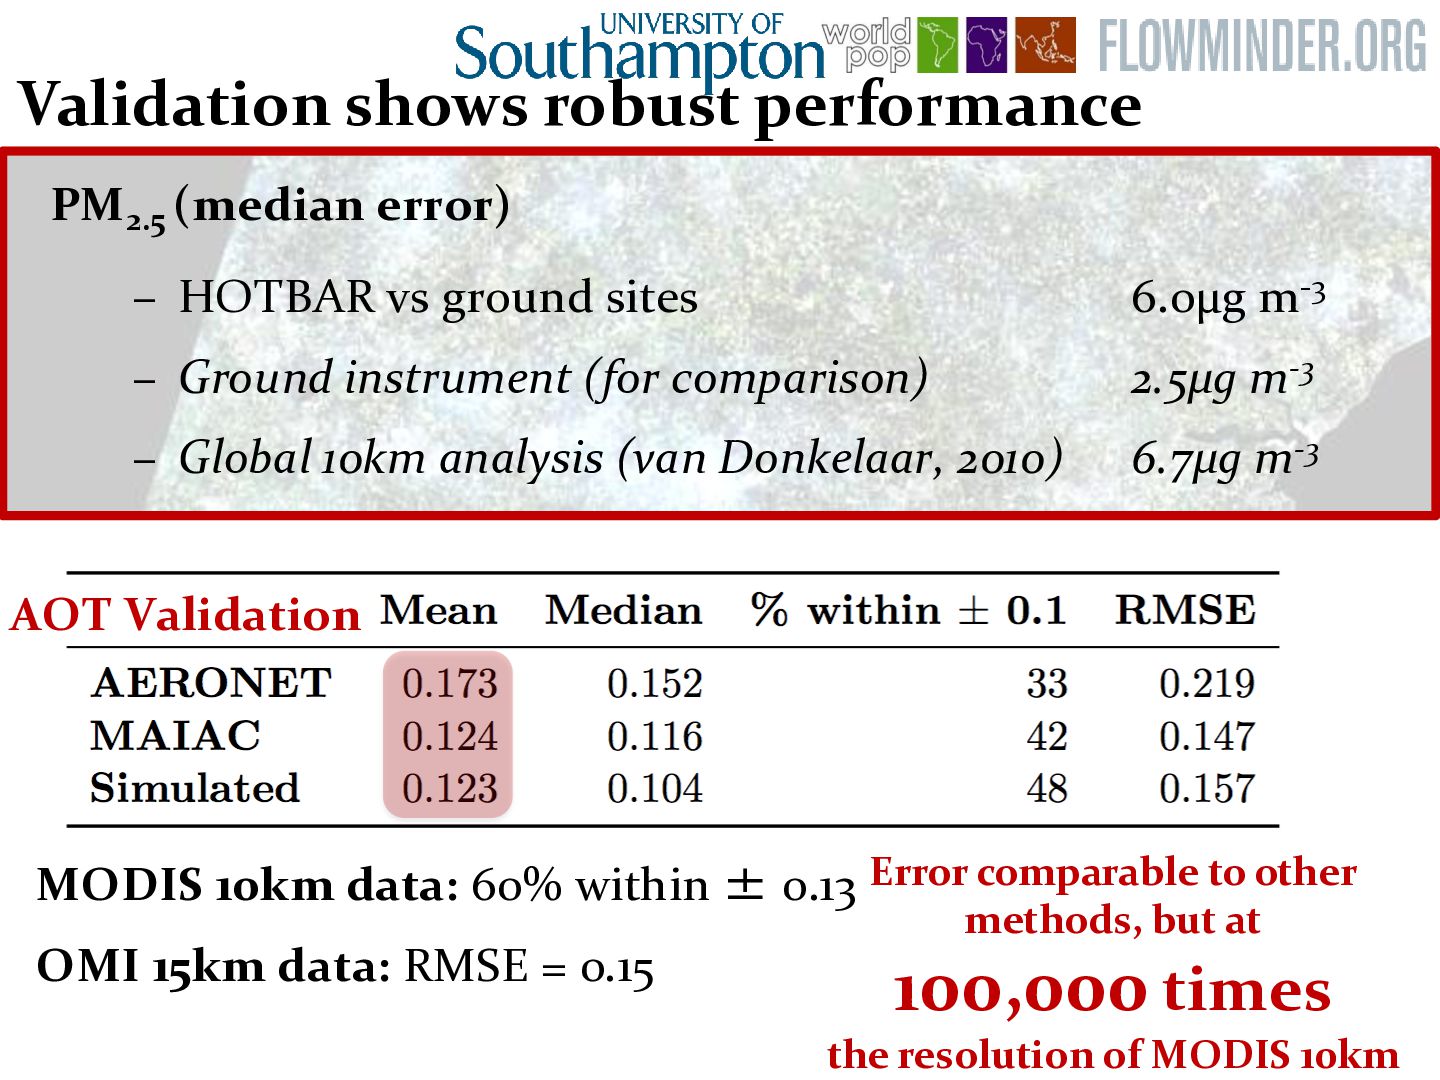
– Ground instrument (for comparison) 2.5μg m-3 – Global 10km analysis (van Donkelaar, 2010) 6.7μg m-3 AOT Validation Validation shows robust performance MODIS 10km data: 60% within ± 0.13 OMI 15km data: RMSE = 0.15 Error comparable to other methods, but at 100,000 times the resolution of MODIS 10km
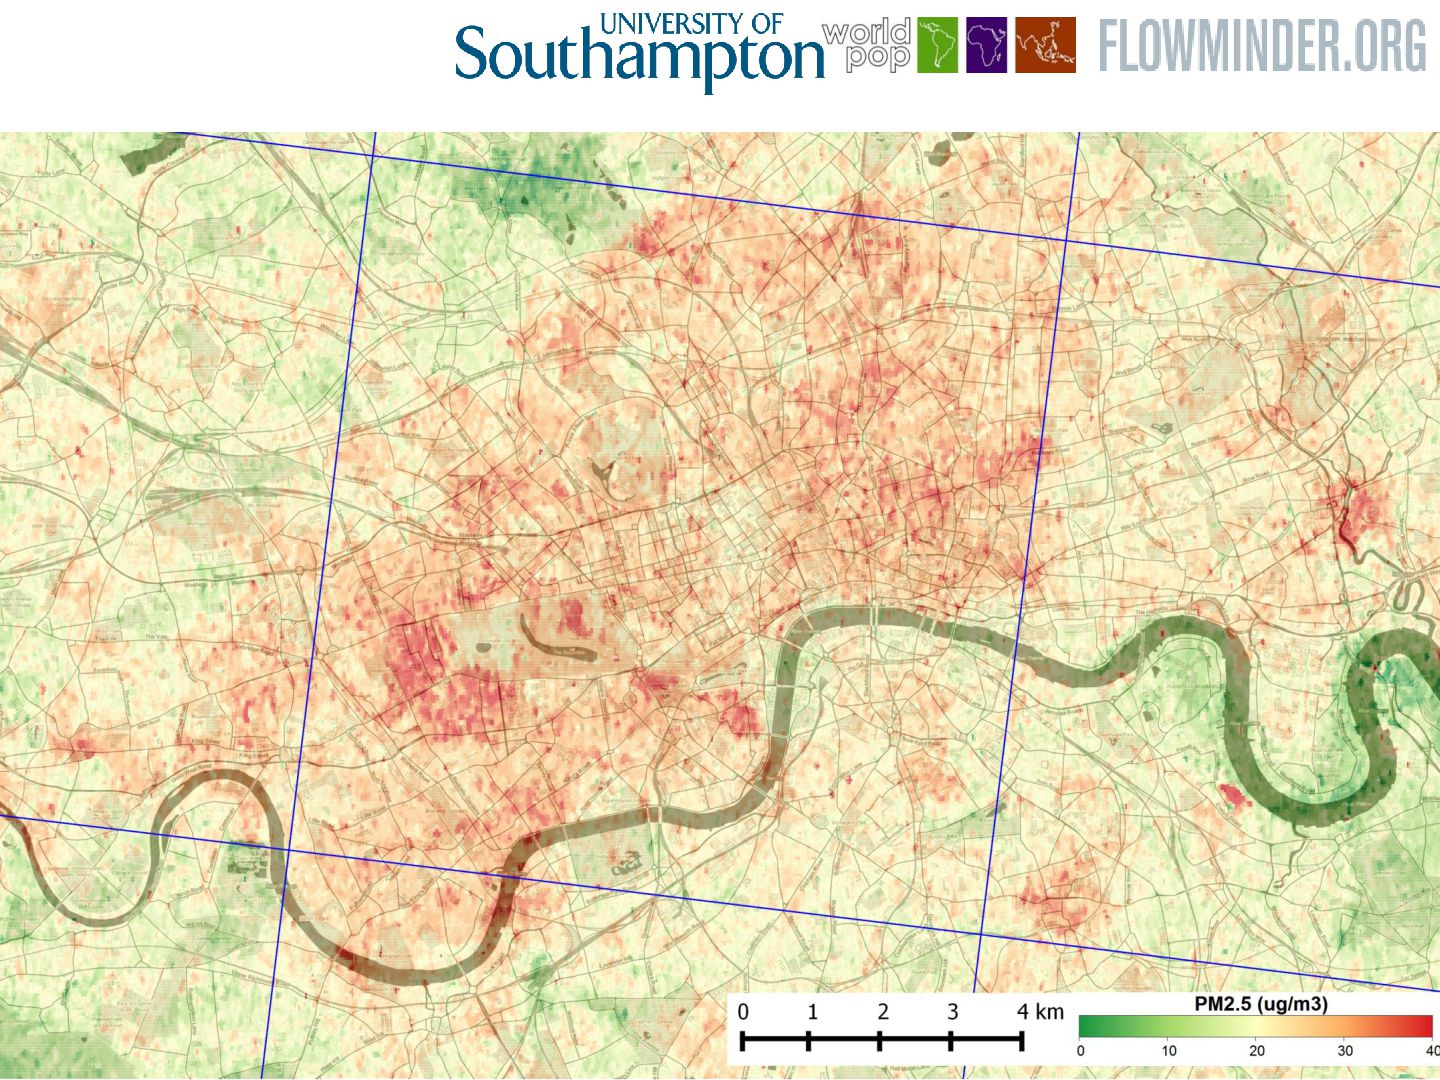
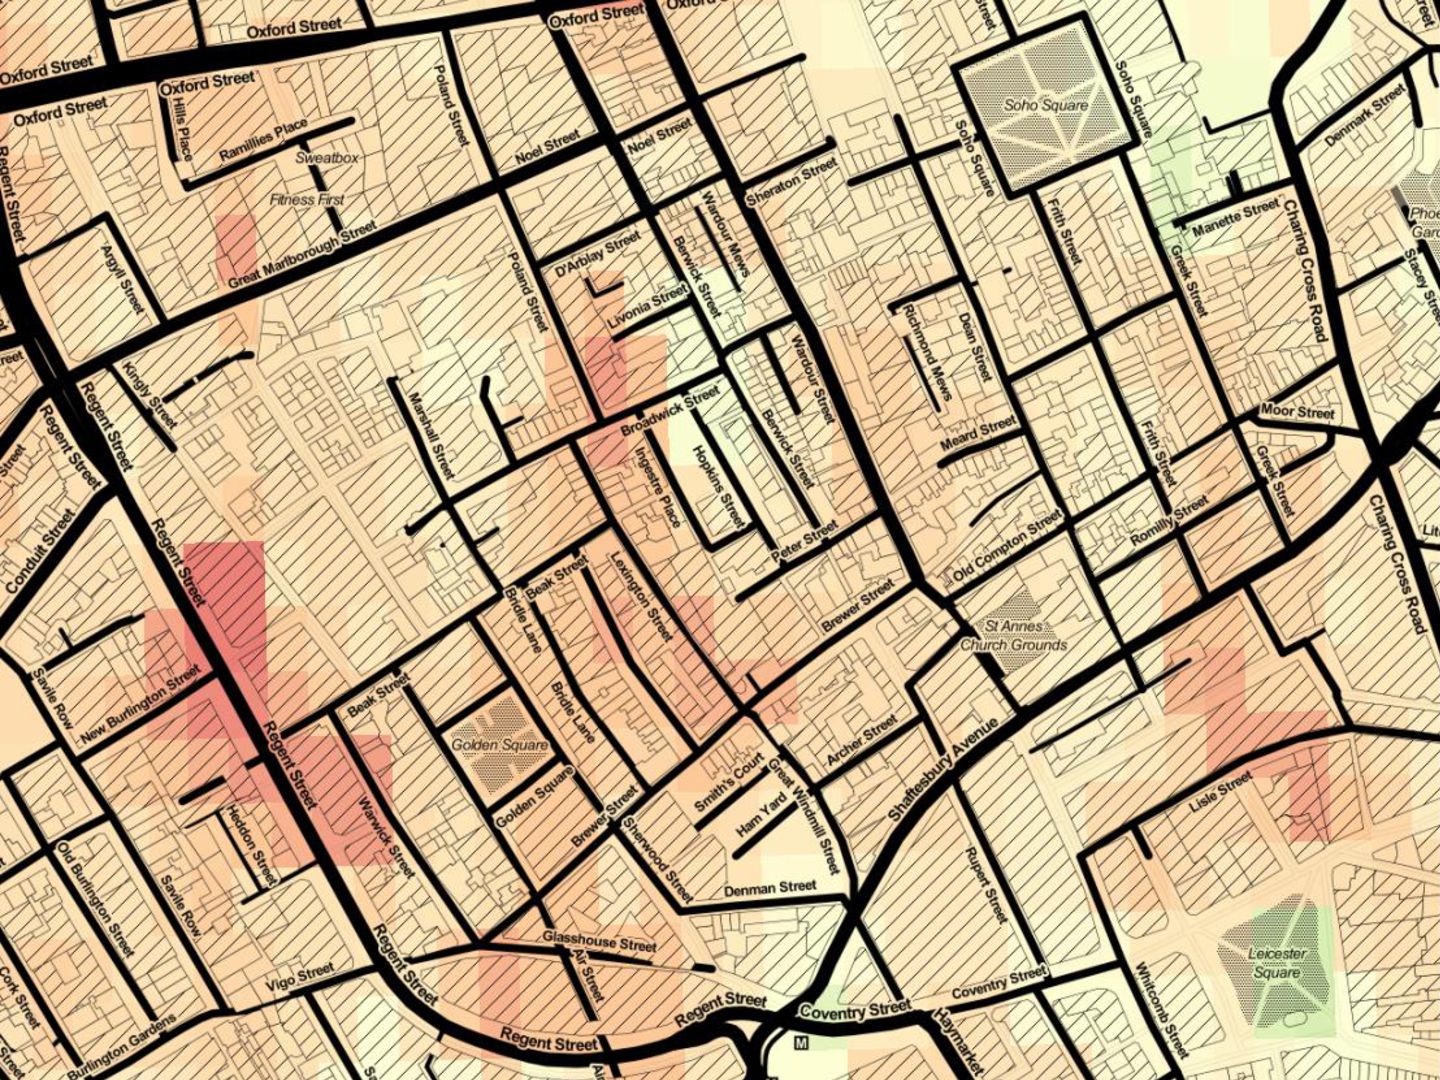
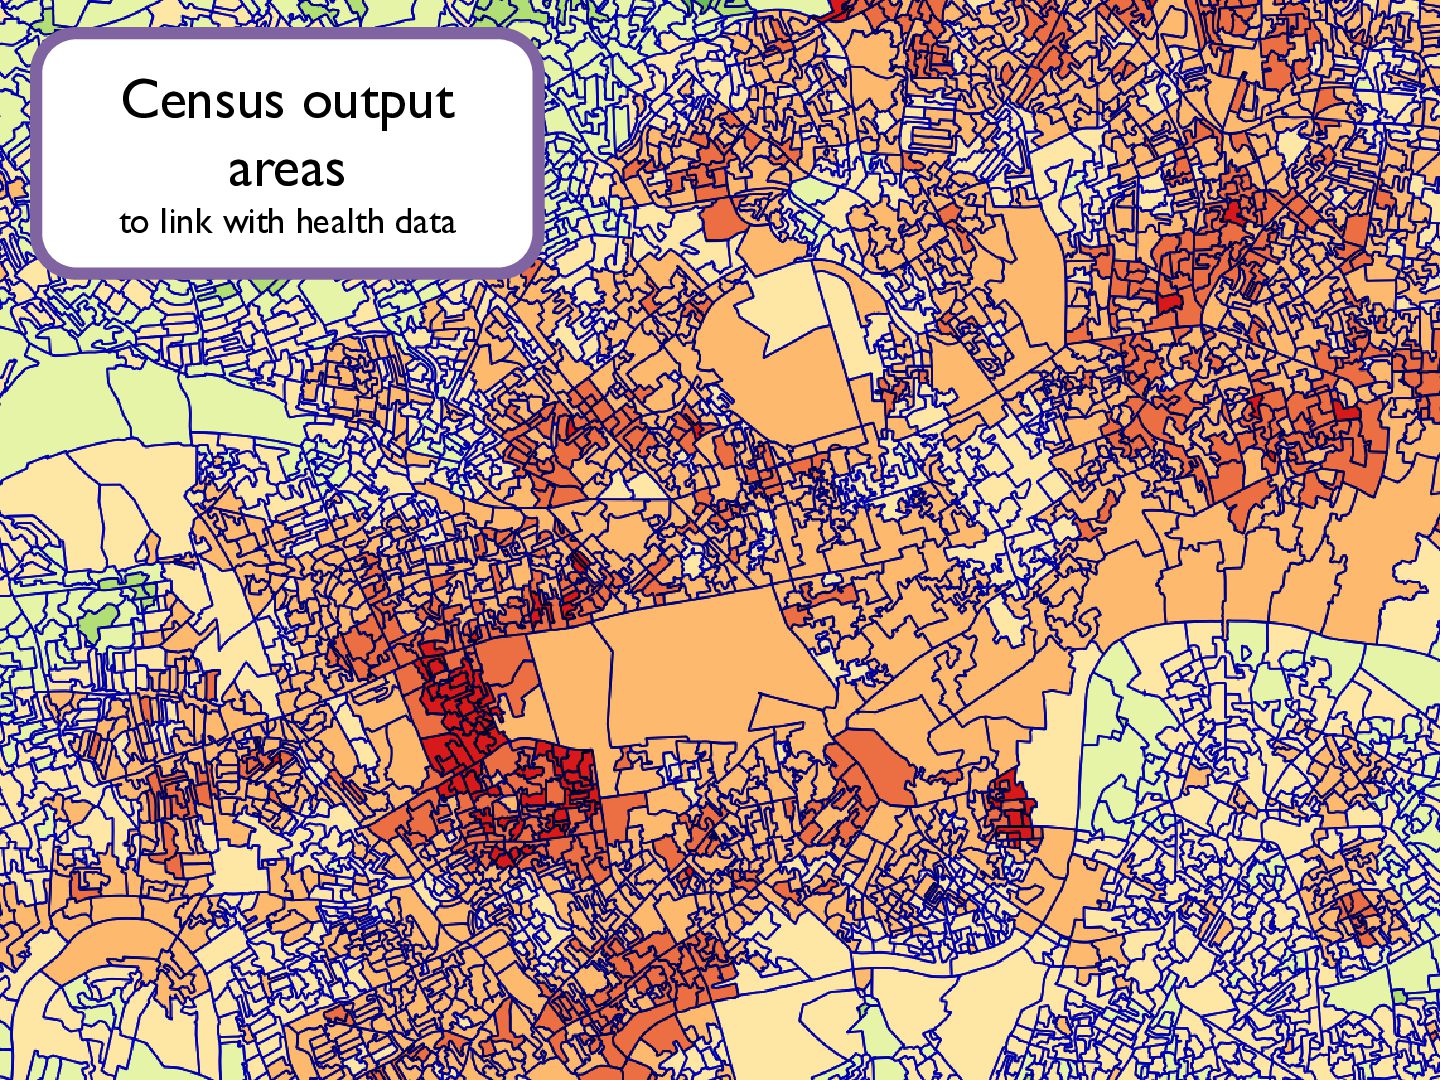
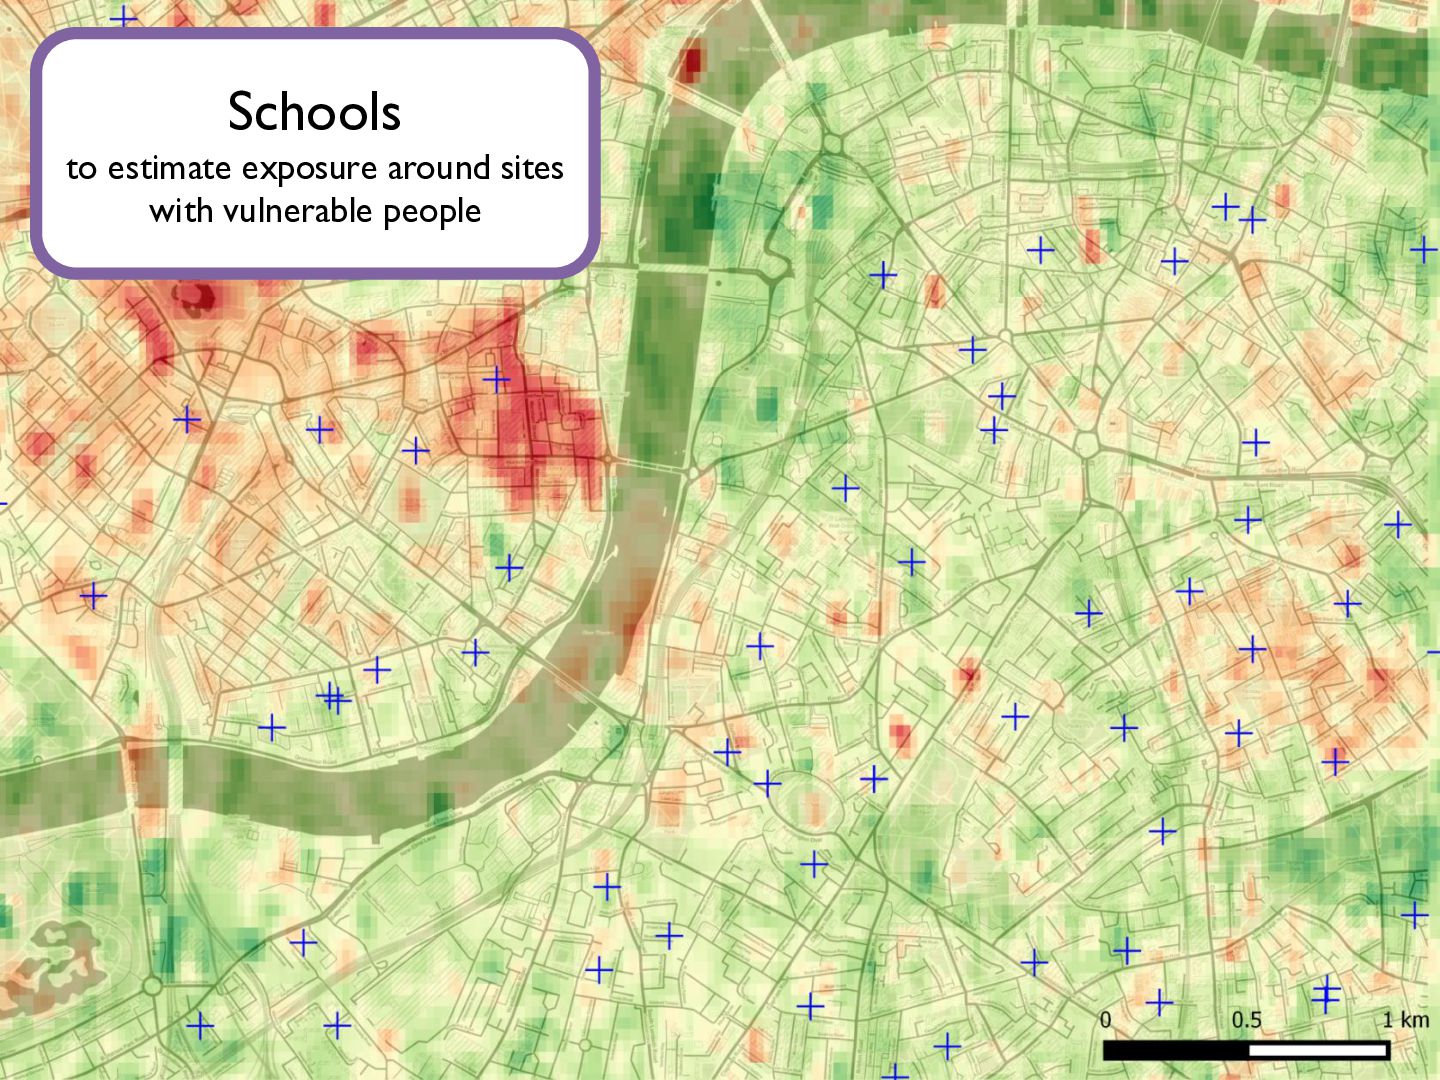
• Includes extension to Landsat 8 & operationalisation • Applications • PM2.5 mapping for exposure estimation • Linking to health data • Combining ground data & other satellite data to get ‘the best of all worlds’ Ongoing work
![28 Any questions? [email protected] @sciremotesense](https://files.speakerdeck.com/presentations/caffc08f63fd4fd9921f33fa6a53c9e7/slide_27.jpg)