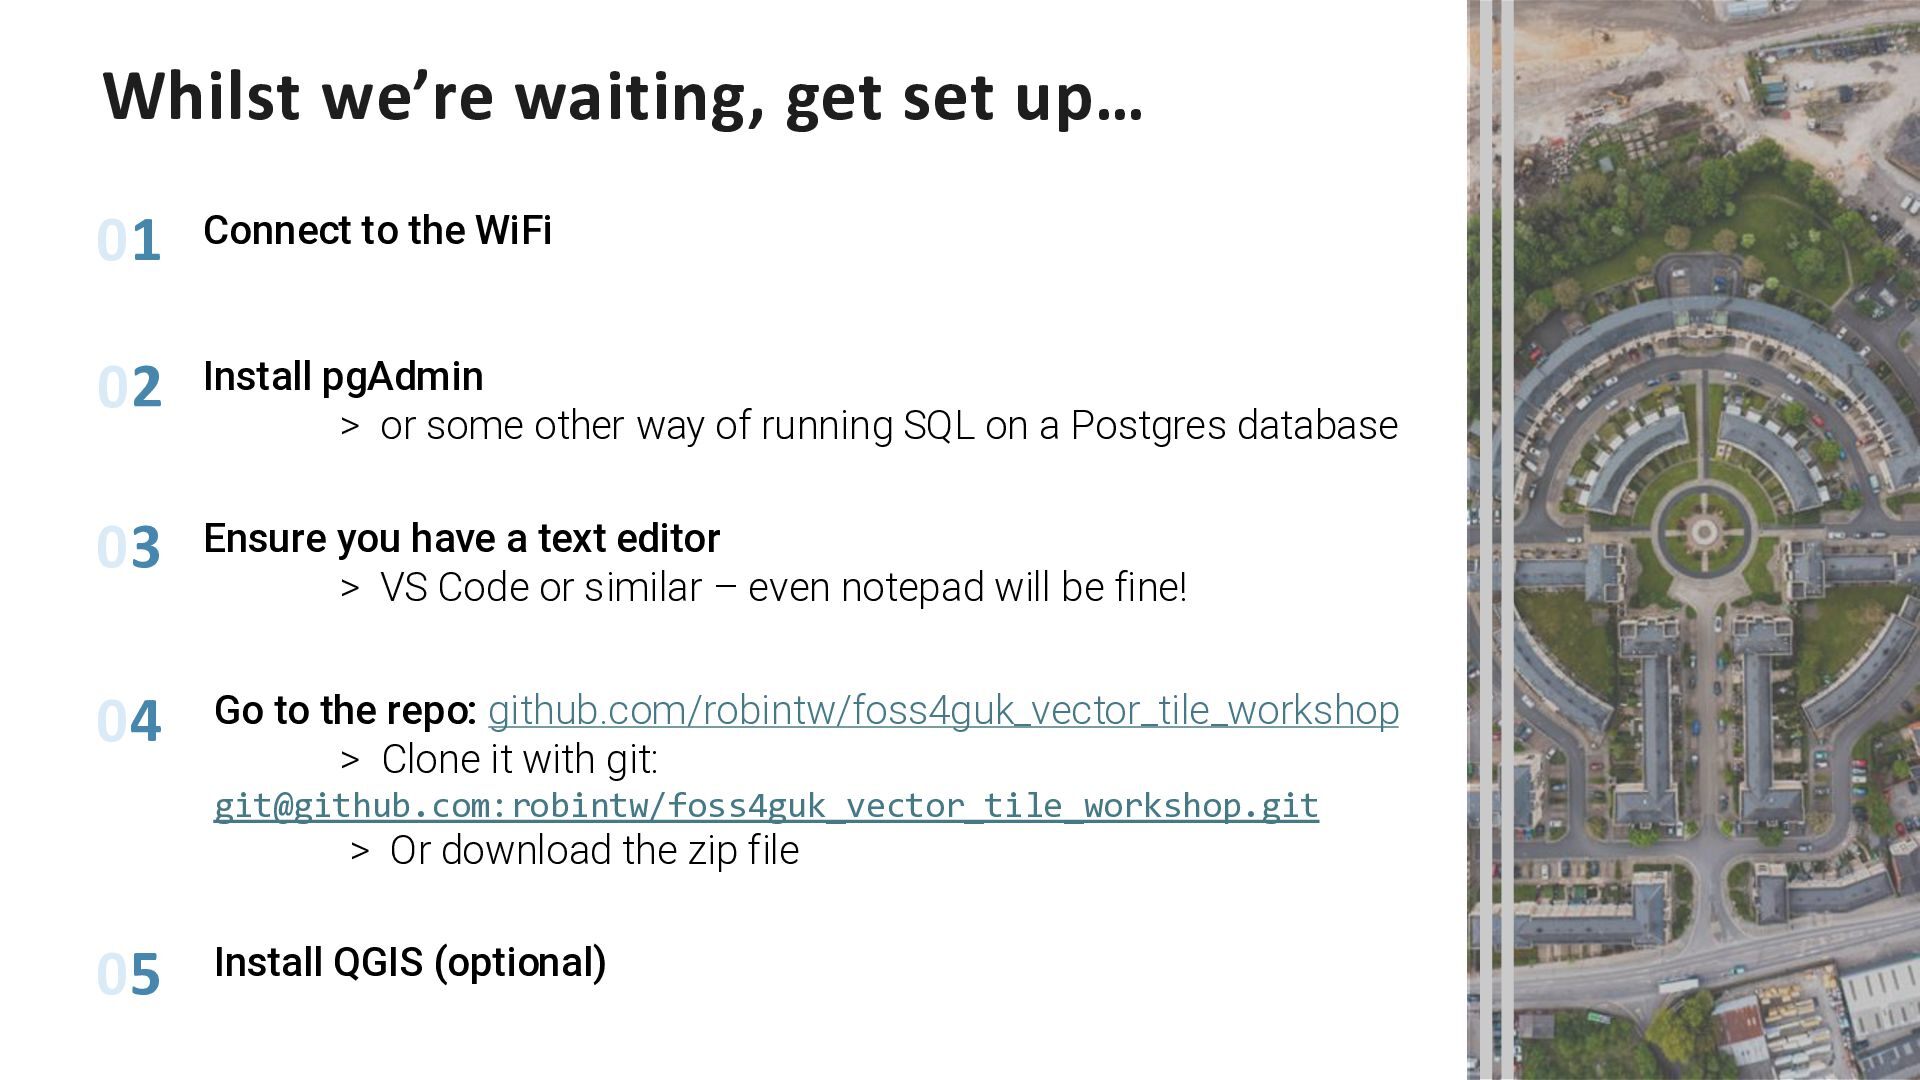
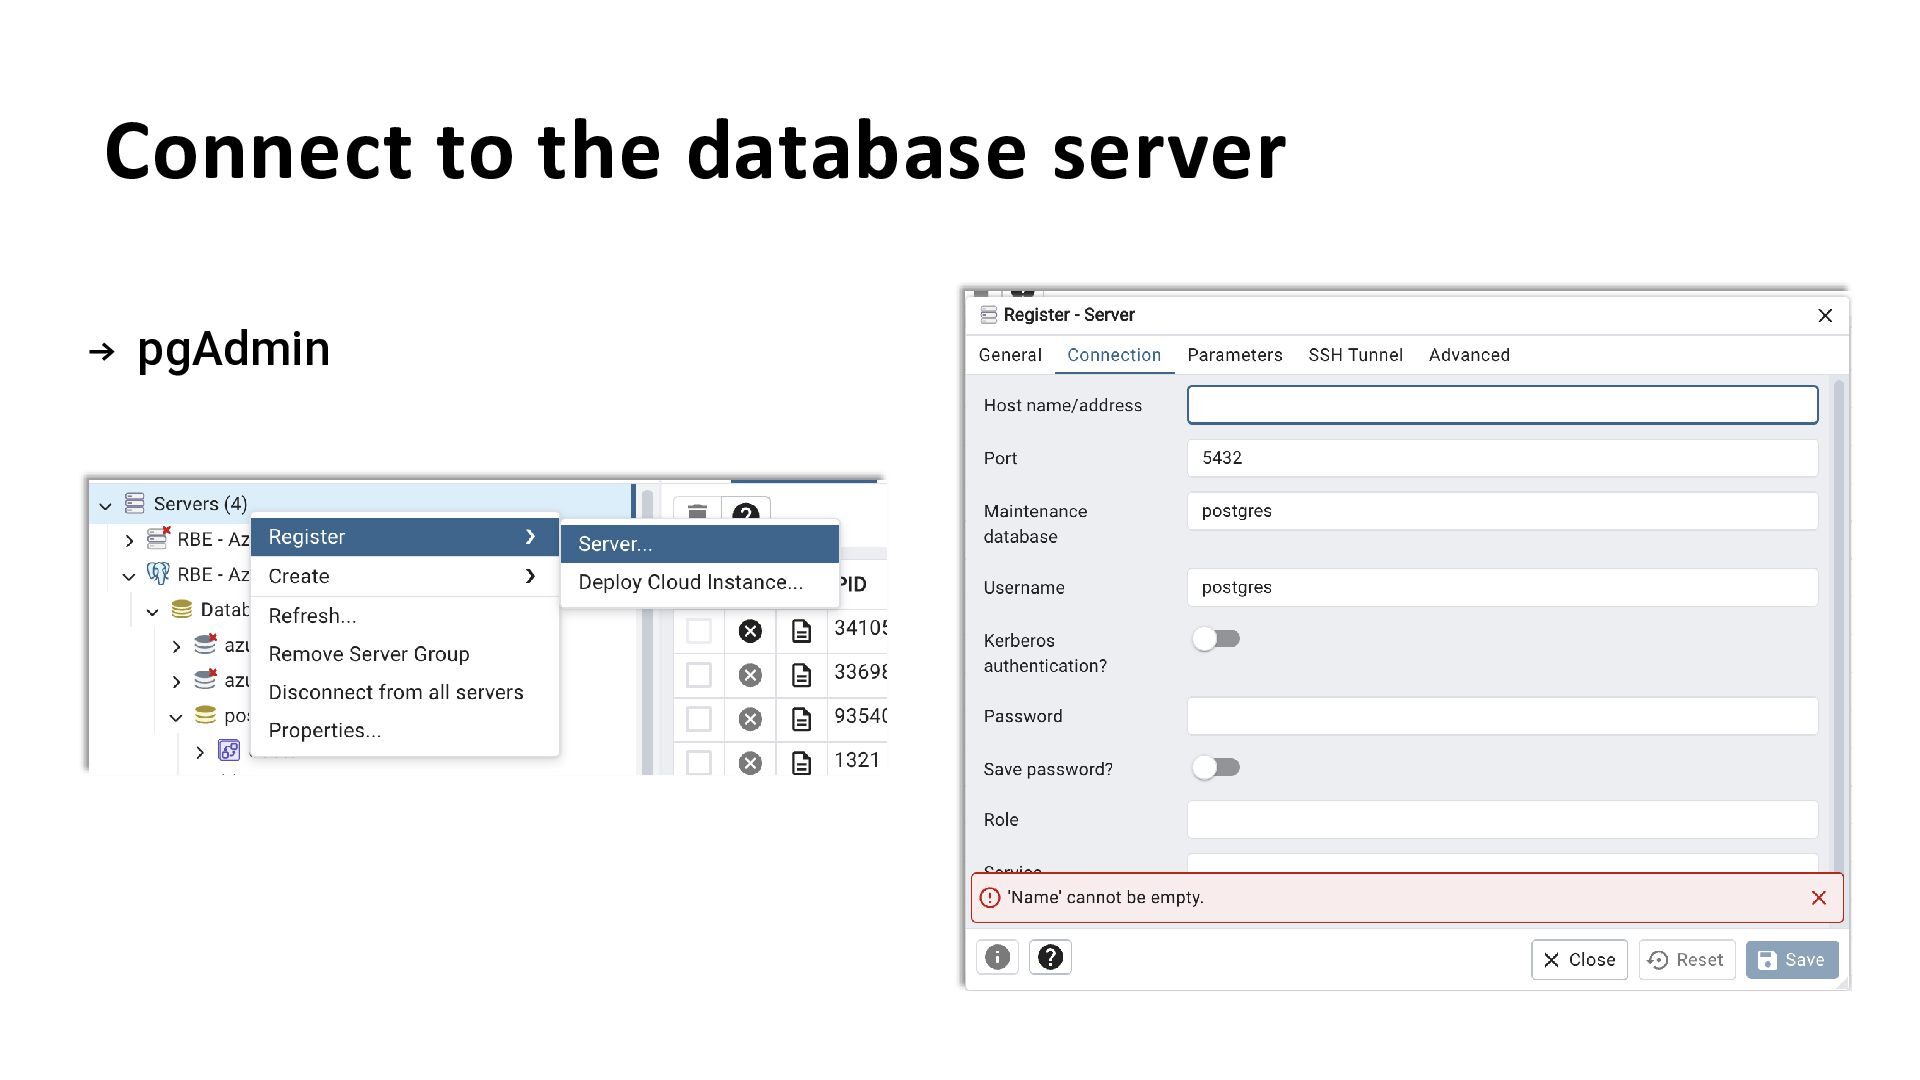
01 02 03 04 Install pgAdmin > or some other way of running SQL on a Postgres database 05 Ensure you have a text editor > VS Code or similar – even notepad will be fine! Go to the repo: github.com/robintw/foss4guk_vector_tile_workshop > Clone it with git: [email protected]:robintw/foss4guk_vector_tile_workshop.git > Or download the zip file Install QGIS (optional)
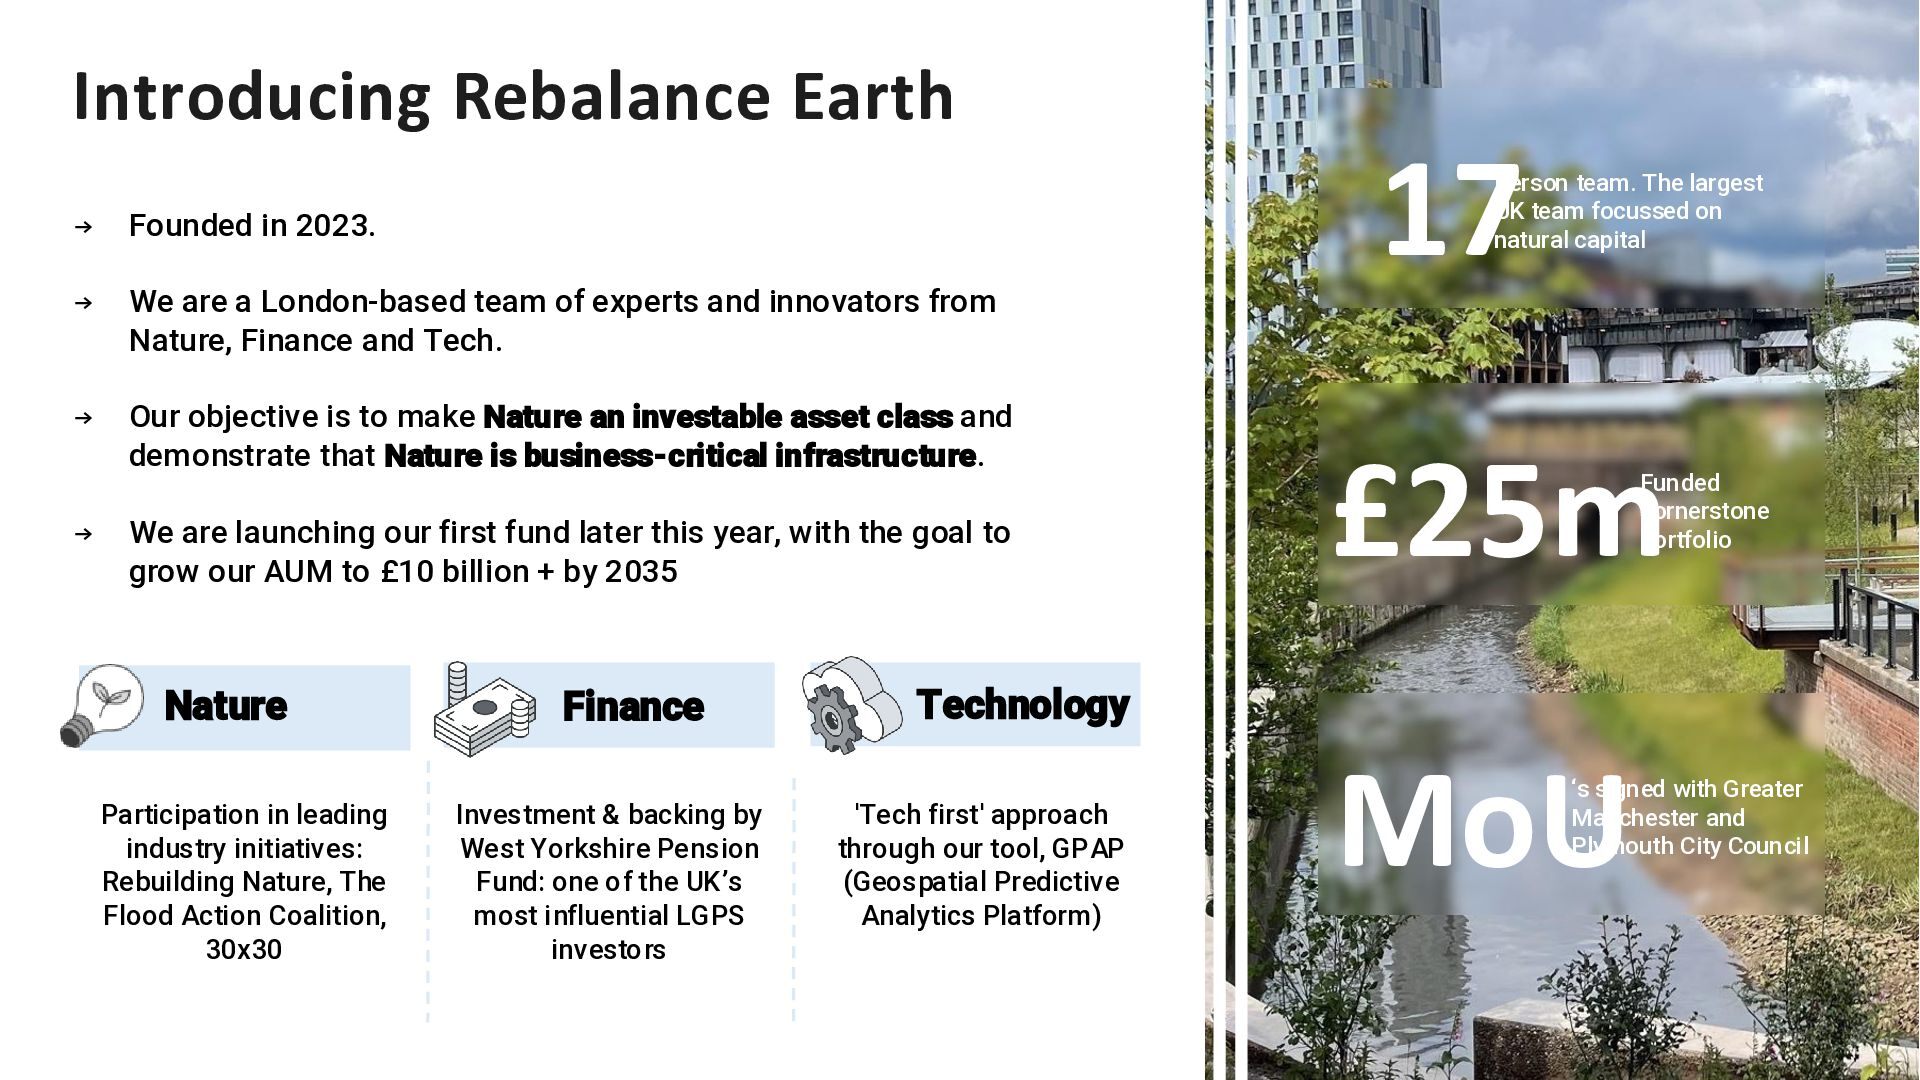
Flood Action Coalition, 30x30 Investment & backing by West Yorkshire Pension Fund: one of the UK’s most influential LGPS investors 'Tech first' approach through our tool, GPAP (Geospatial Predictive Analytics Platform) 17 Person team. The largest UK team focussed on natural capital £25mFunded cornerstone portfolio MoU ‘s signed with Greater Manchester and Plymouth City Council Introducing Rebalance Earth → Founded in 2023. → We are a London-based team of experts and innovators from Nature, Finance and Tech. → Our objective is to make Nature an investable asset class and demonstrate that Nature is business-critical infrastructure. → We are launching our first fund later this year, with the goal to grow our AUM to £10 billion + by 2035 Technology
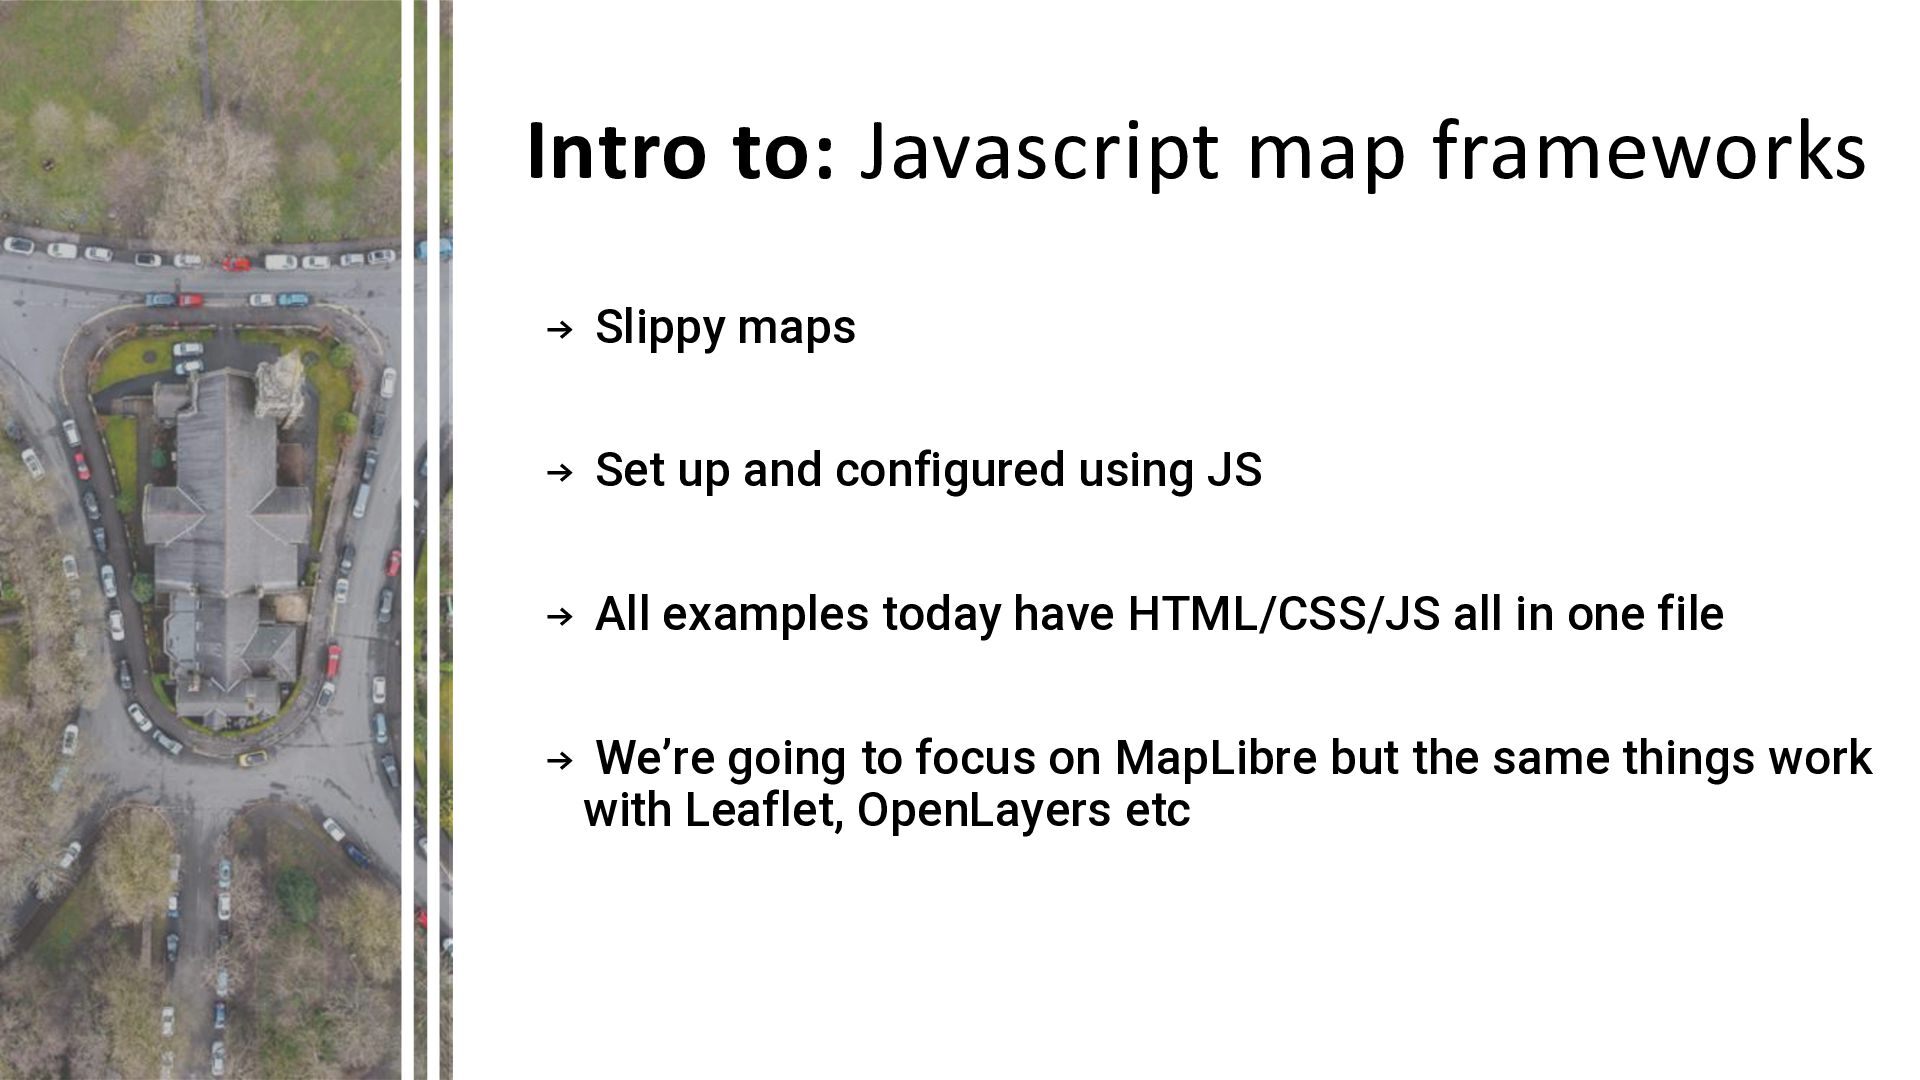
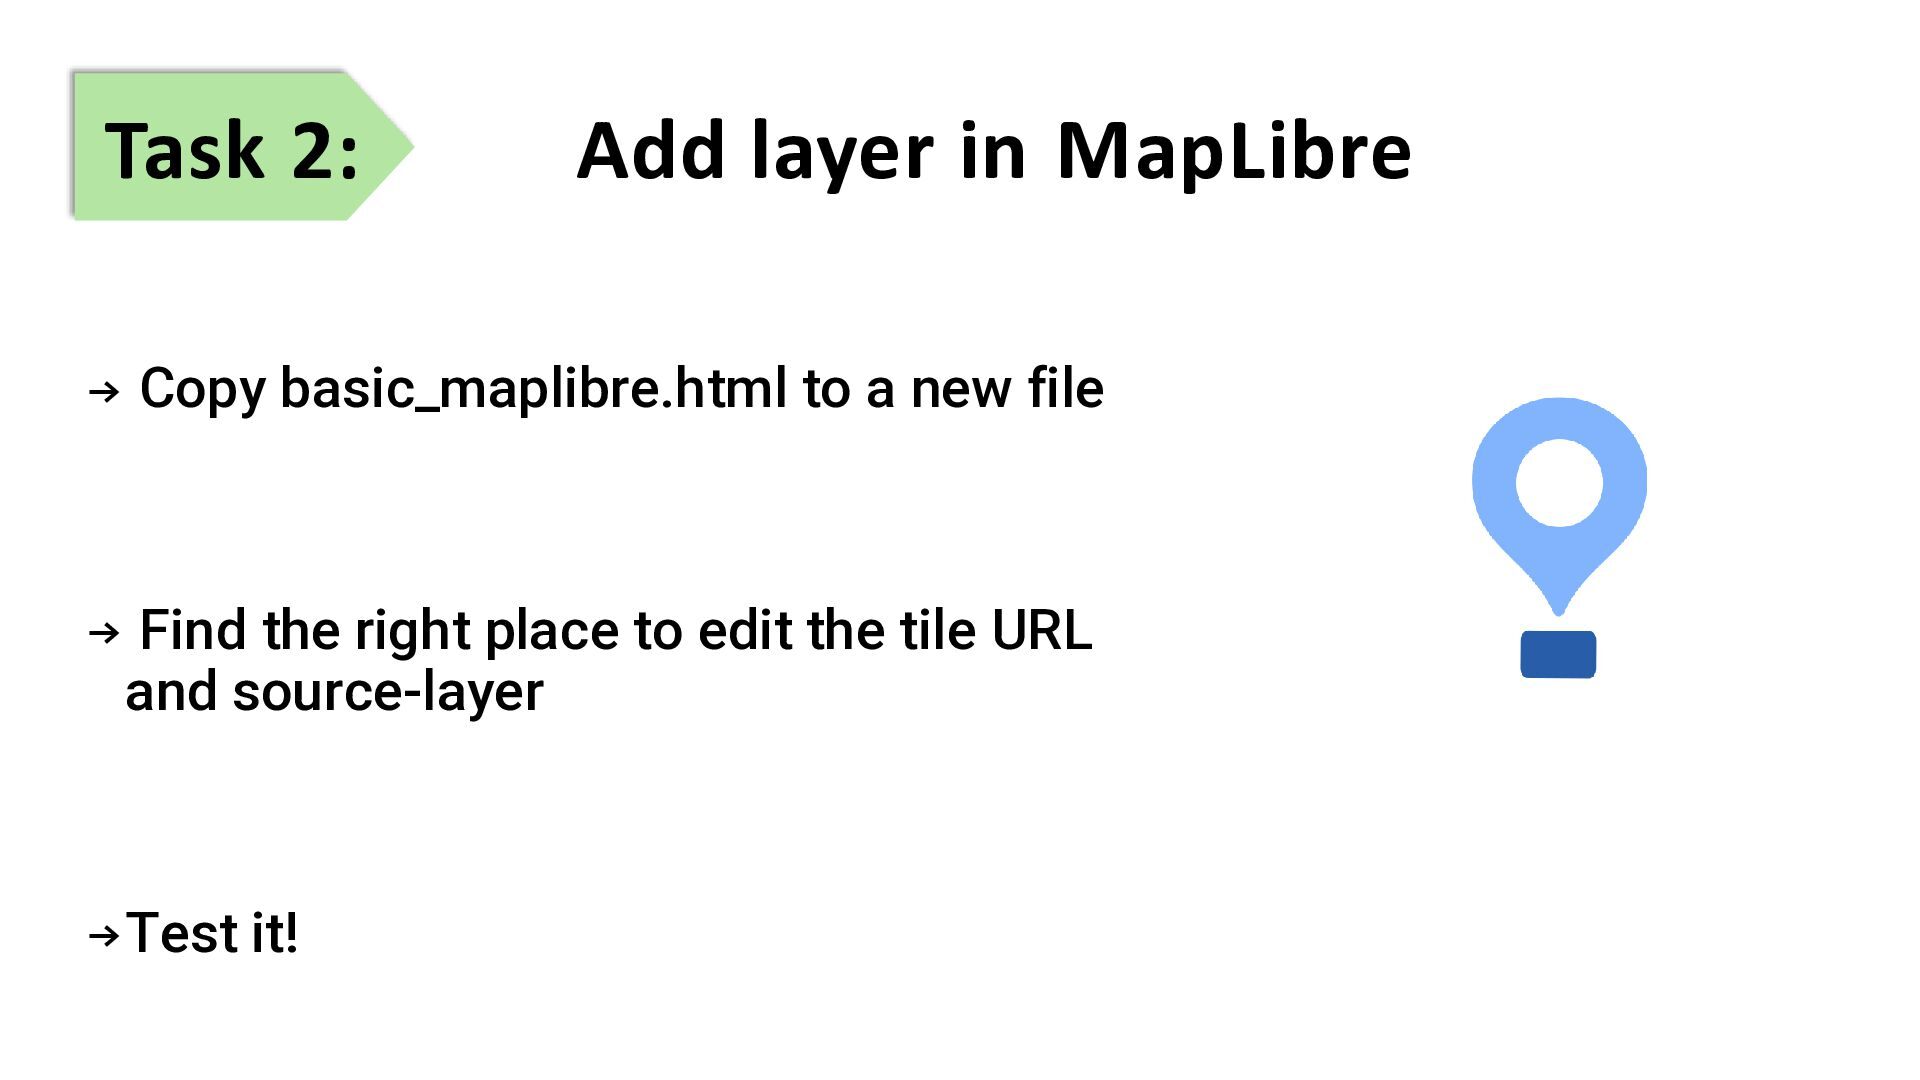
up and configured using JS → All examples today have HTML/CSS/JS all in one file → We’re going to focus on MapLibre but the same things work with Leaflet, OpenLayers etc
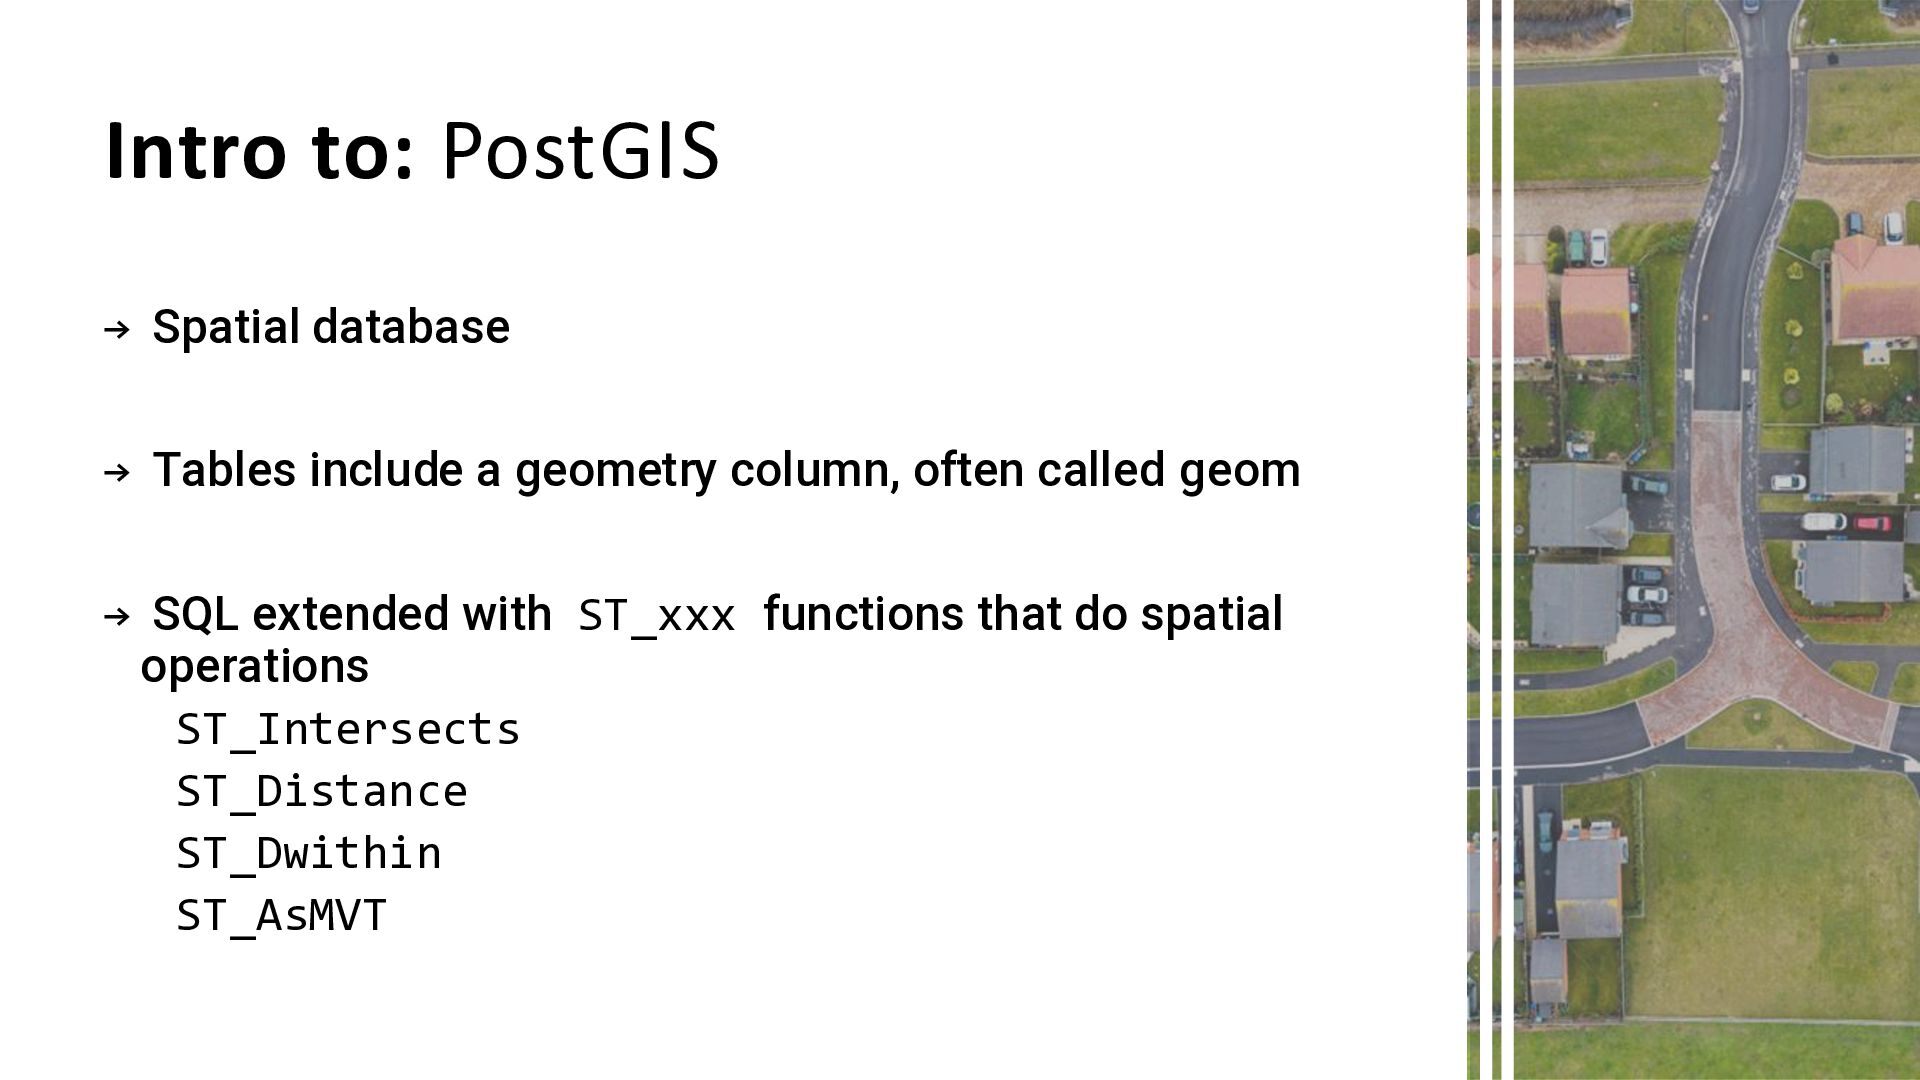
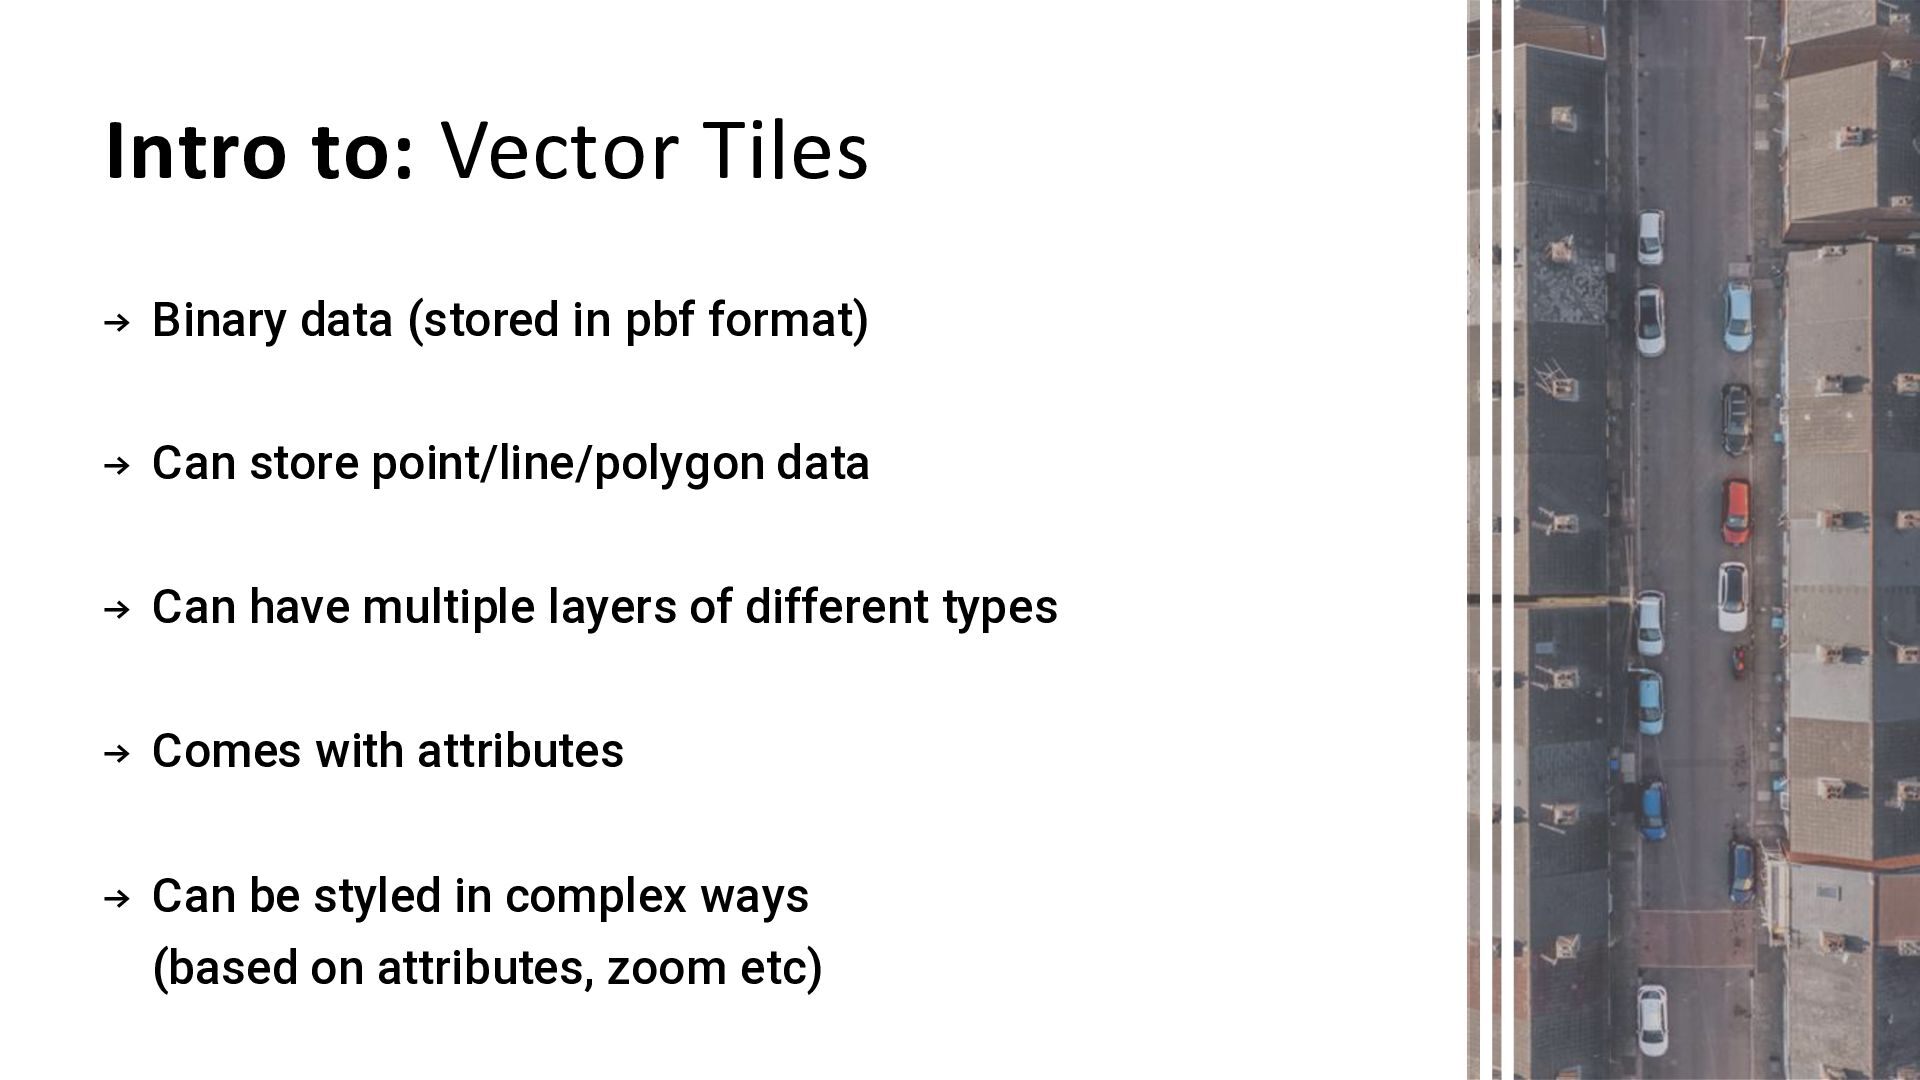
format) → Can store point/line/polygon data → Can have multiple layers of different types → Comes with attributes → Can be styled in complex ways (based on attributes, zoom etc)
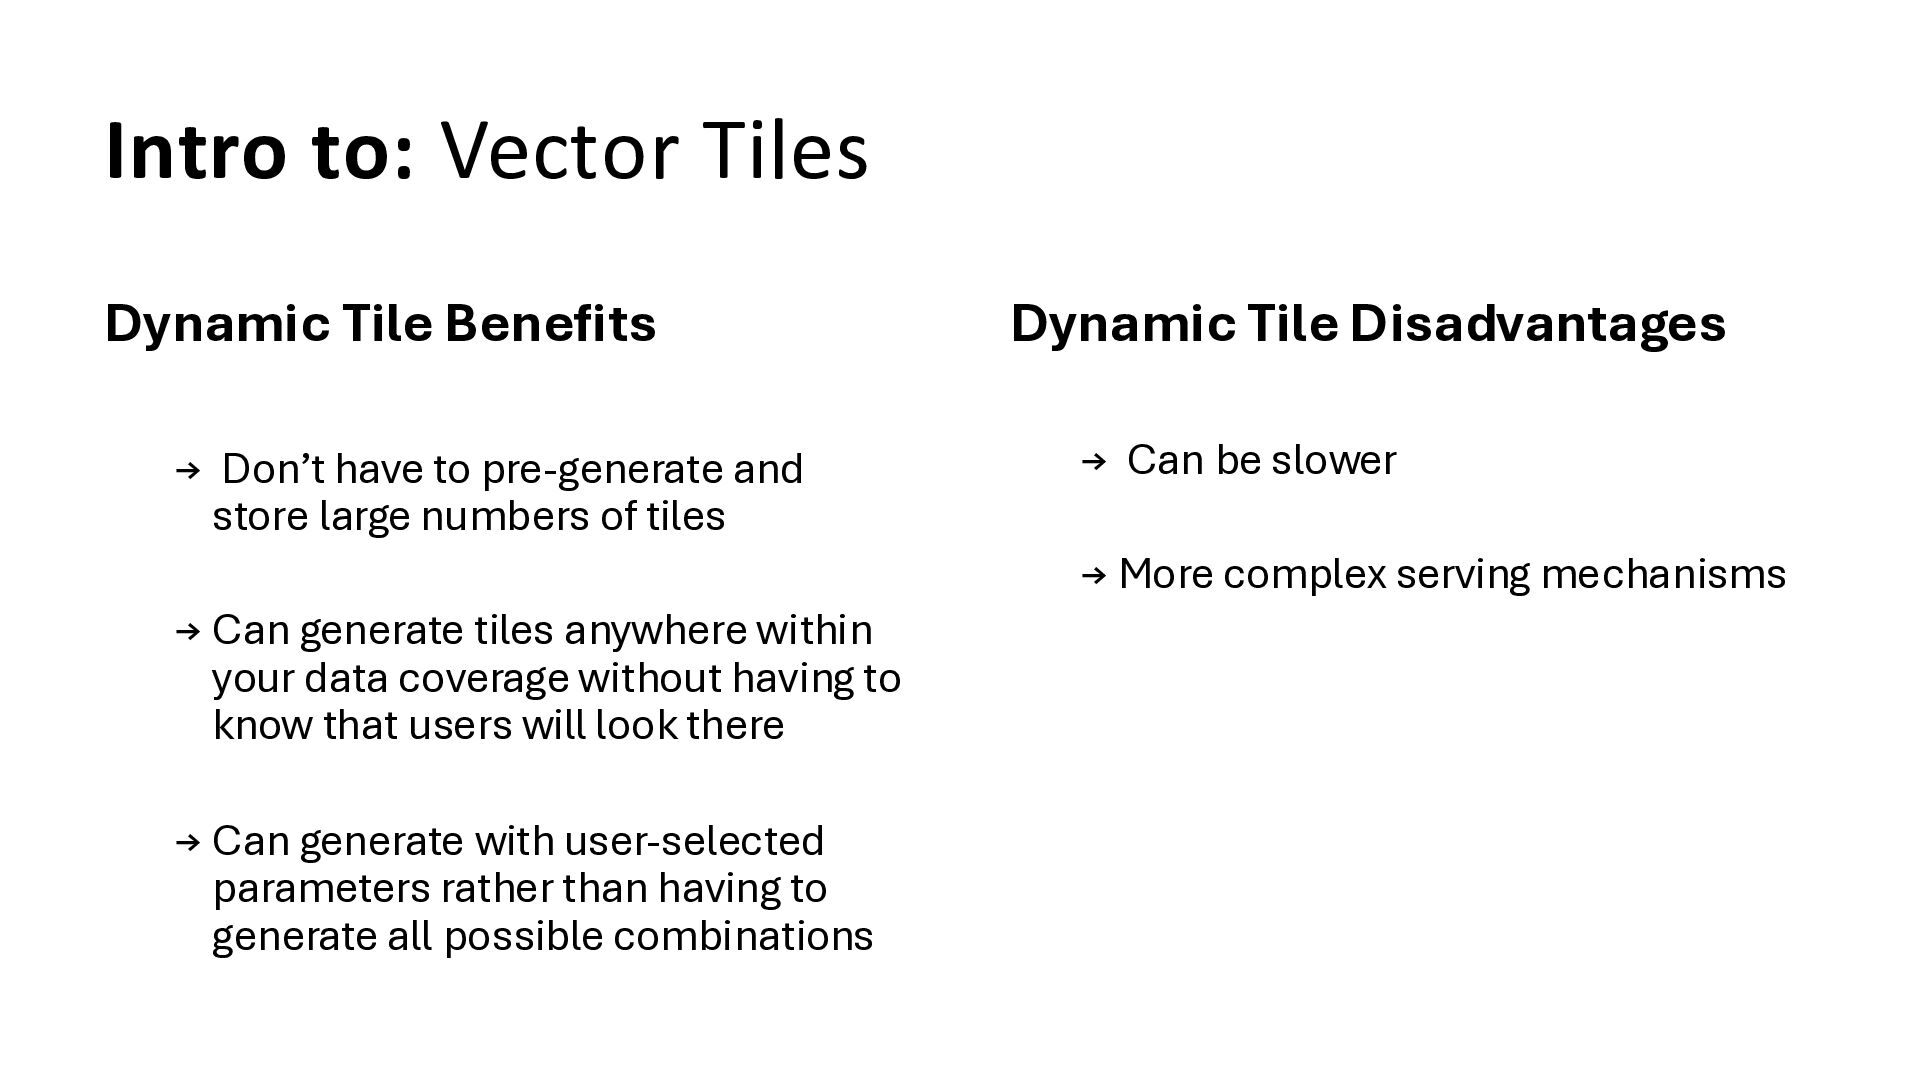
to pre-generate and store large numbers of tiles → Can generate tiles anywhere within your data coverage without having to know that users will look there → Can generate with user-selected parameters rather than having to generate all possible combinations Dynamic Tile Disadvantages → Can be slower → More complex serving mechanisms
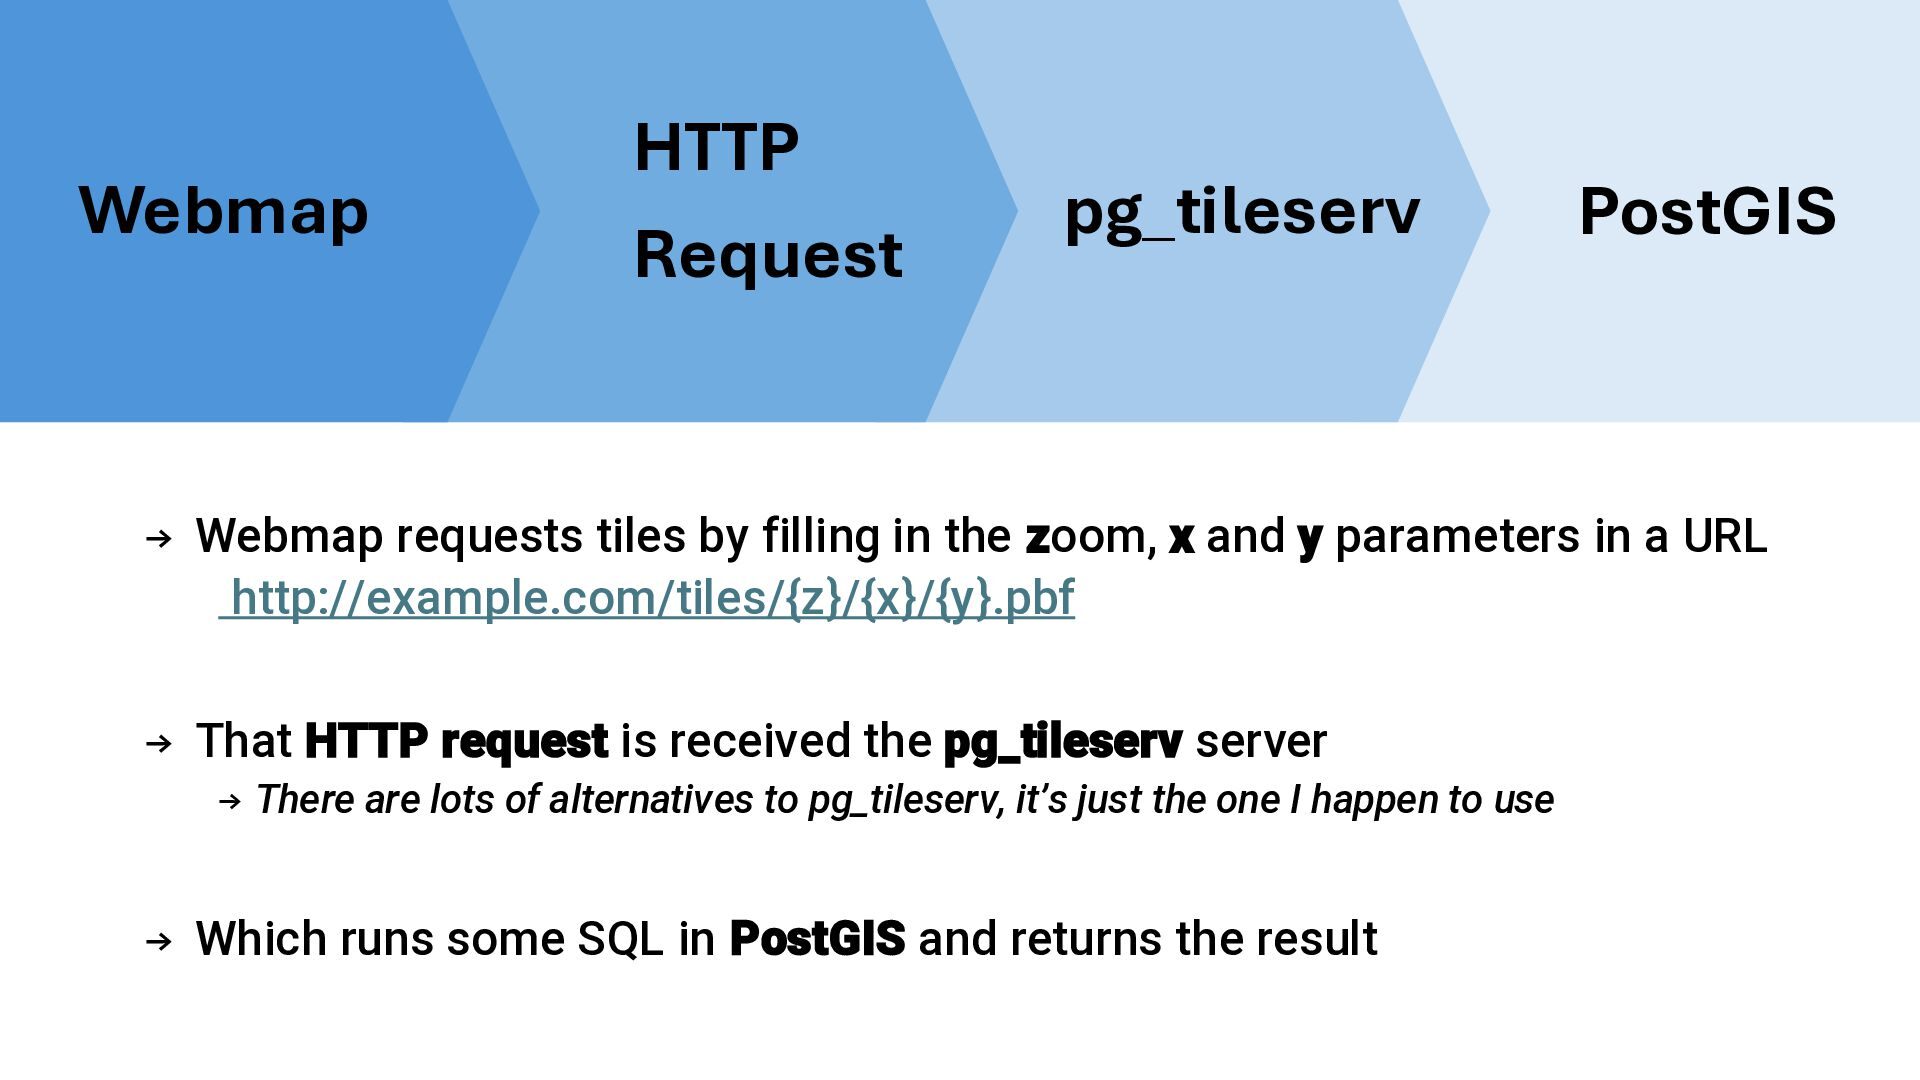
and y parameters in a URL http://example.com/tiles/{z}/{x}/{y}.pbf → That HTTP request is received the pg_tileserv server → There are lots of alternatives to pg_tileserv, it’s just the one I happen to use → Which runs some SQL in PostGIS and returns the result Webmap HTTP Request pg_tileserv PostGIS
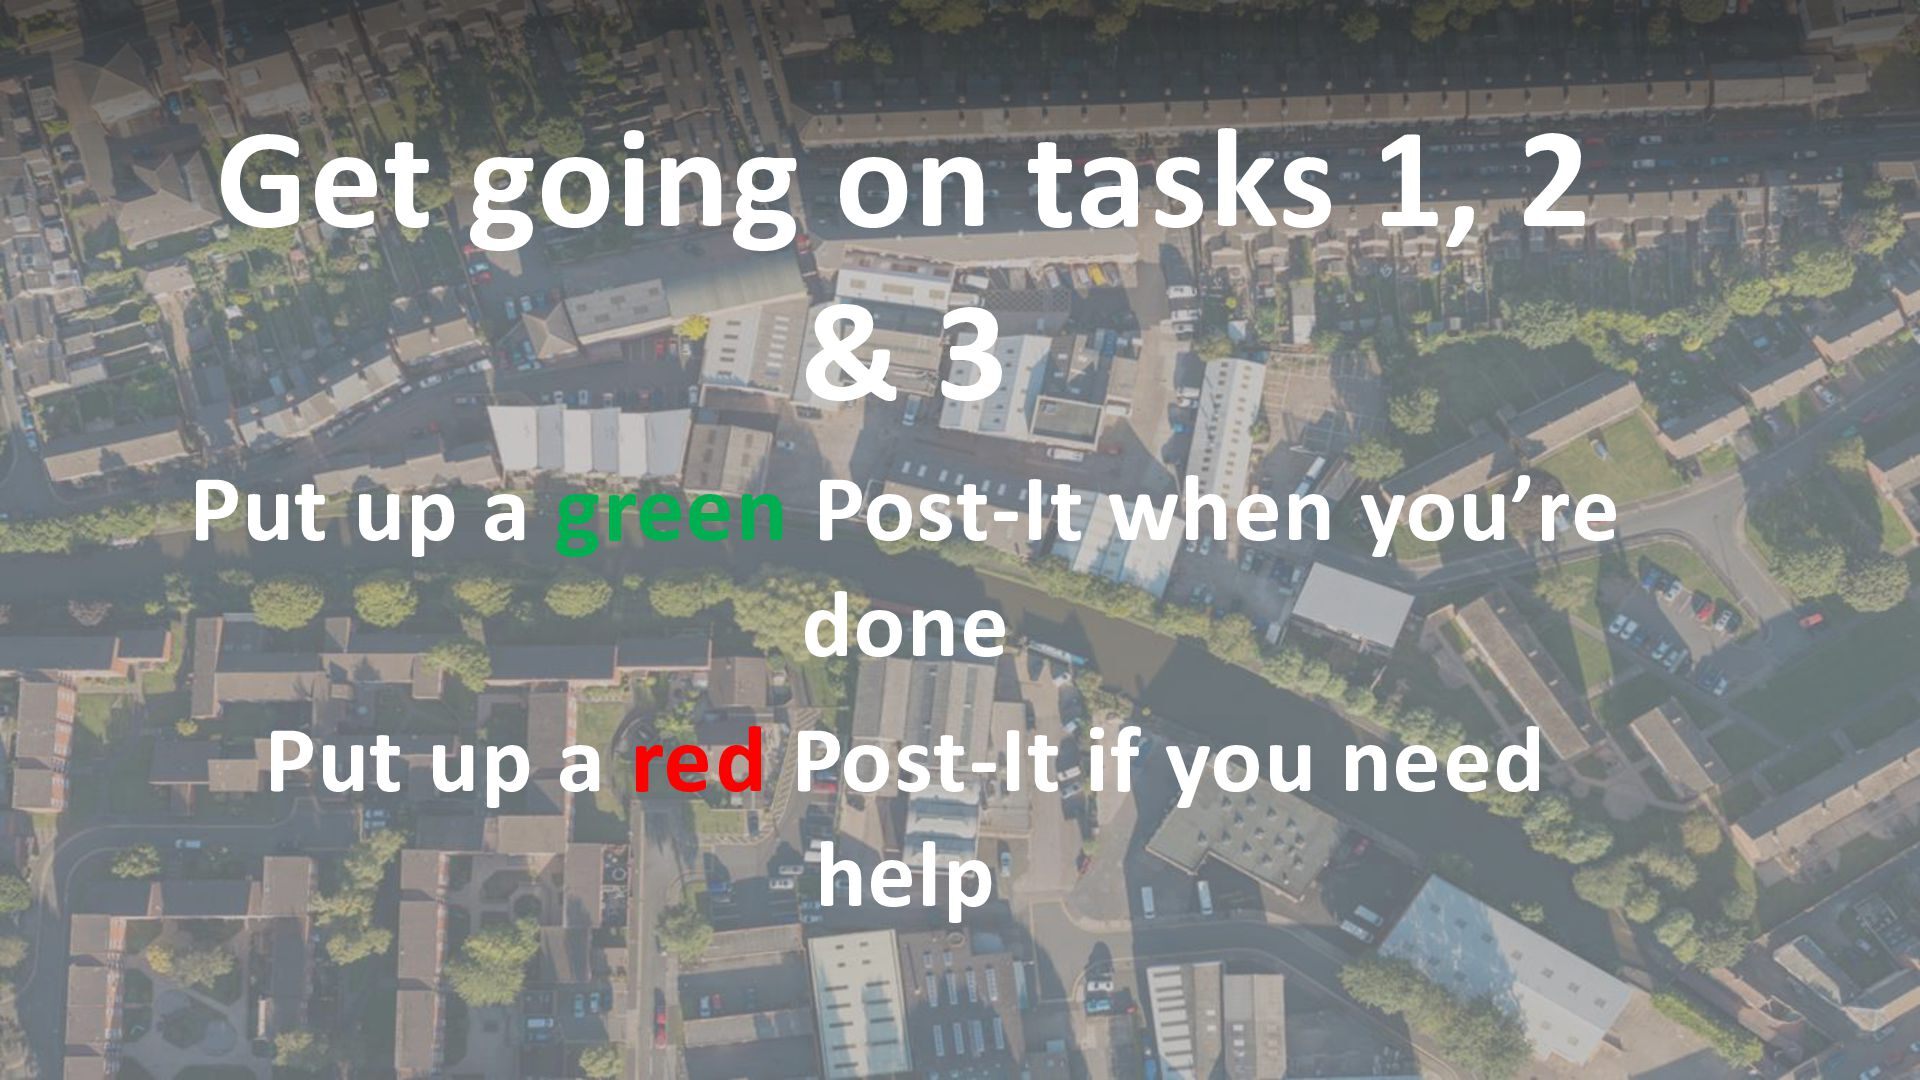
have hosted PostGIS and pg_tileserv for you! → Details in Markdown instructions in repo → Password at www.rtwilson.com/password.html Post It Notes: → A letter (A, B, C etc): use this at the start of any functions or tables you create → A red/pink one: stick this on top of your laptop if you need help, and one of us will come to you as soon as we can → A green one: stick this on top of your laptop if you’ve finished the tasks
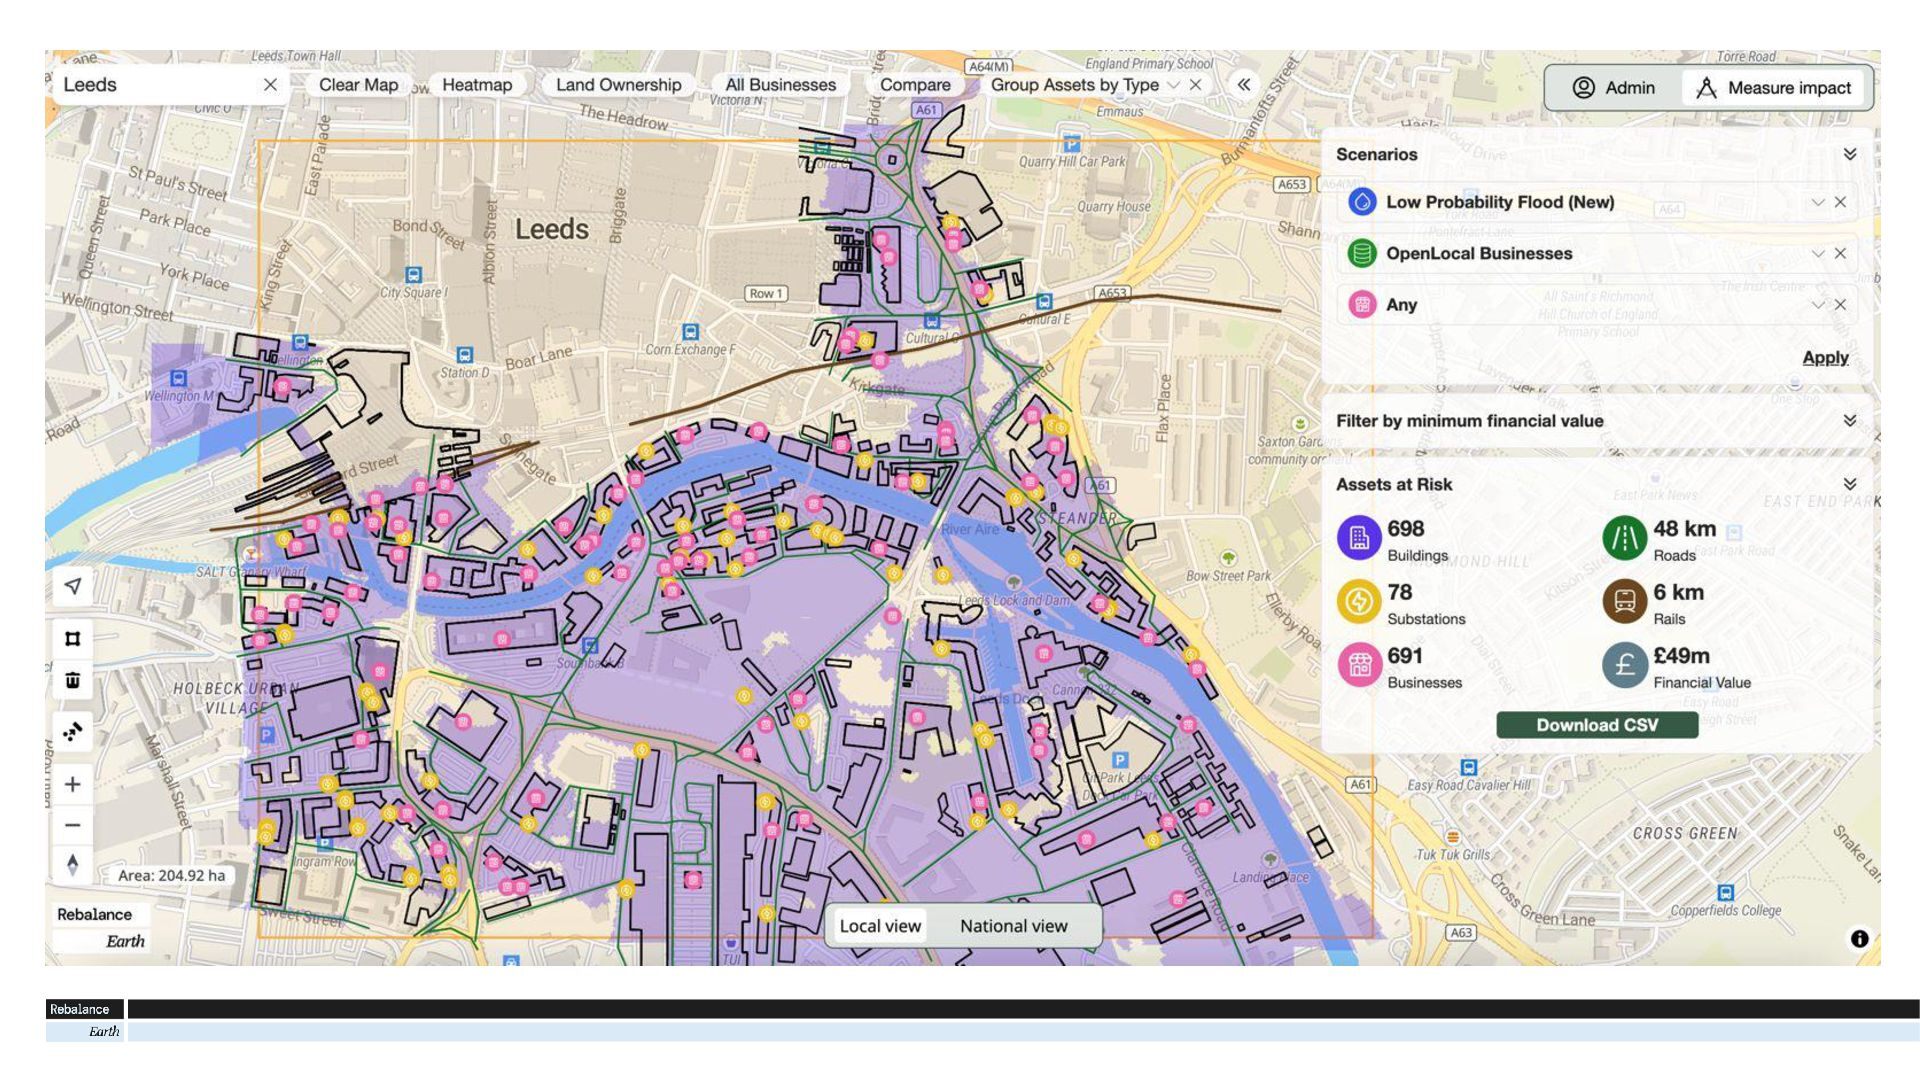
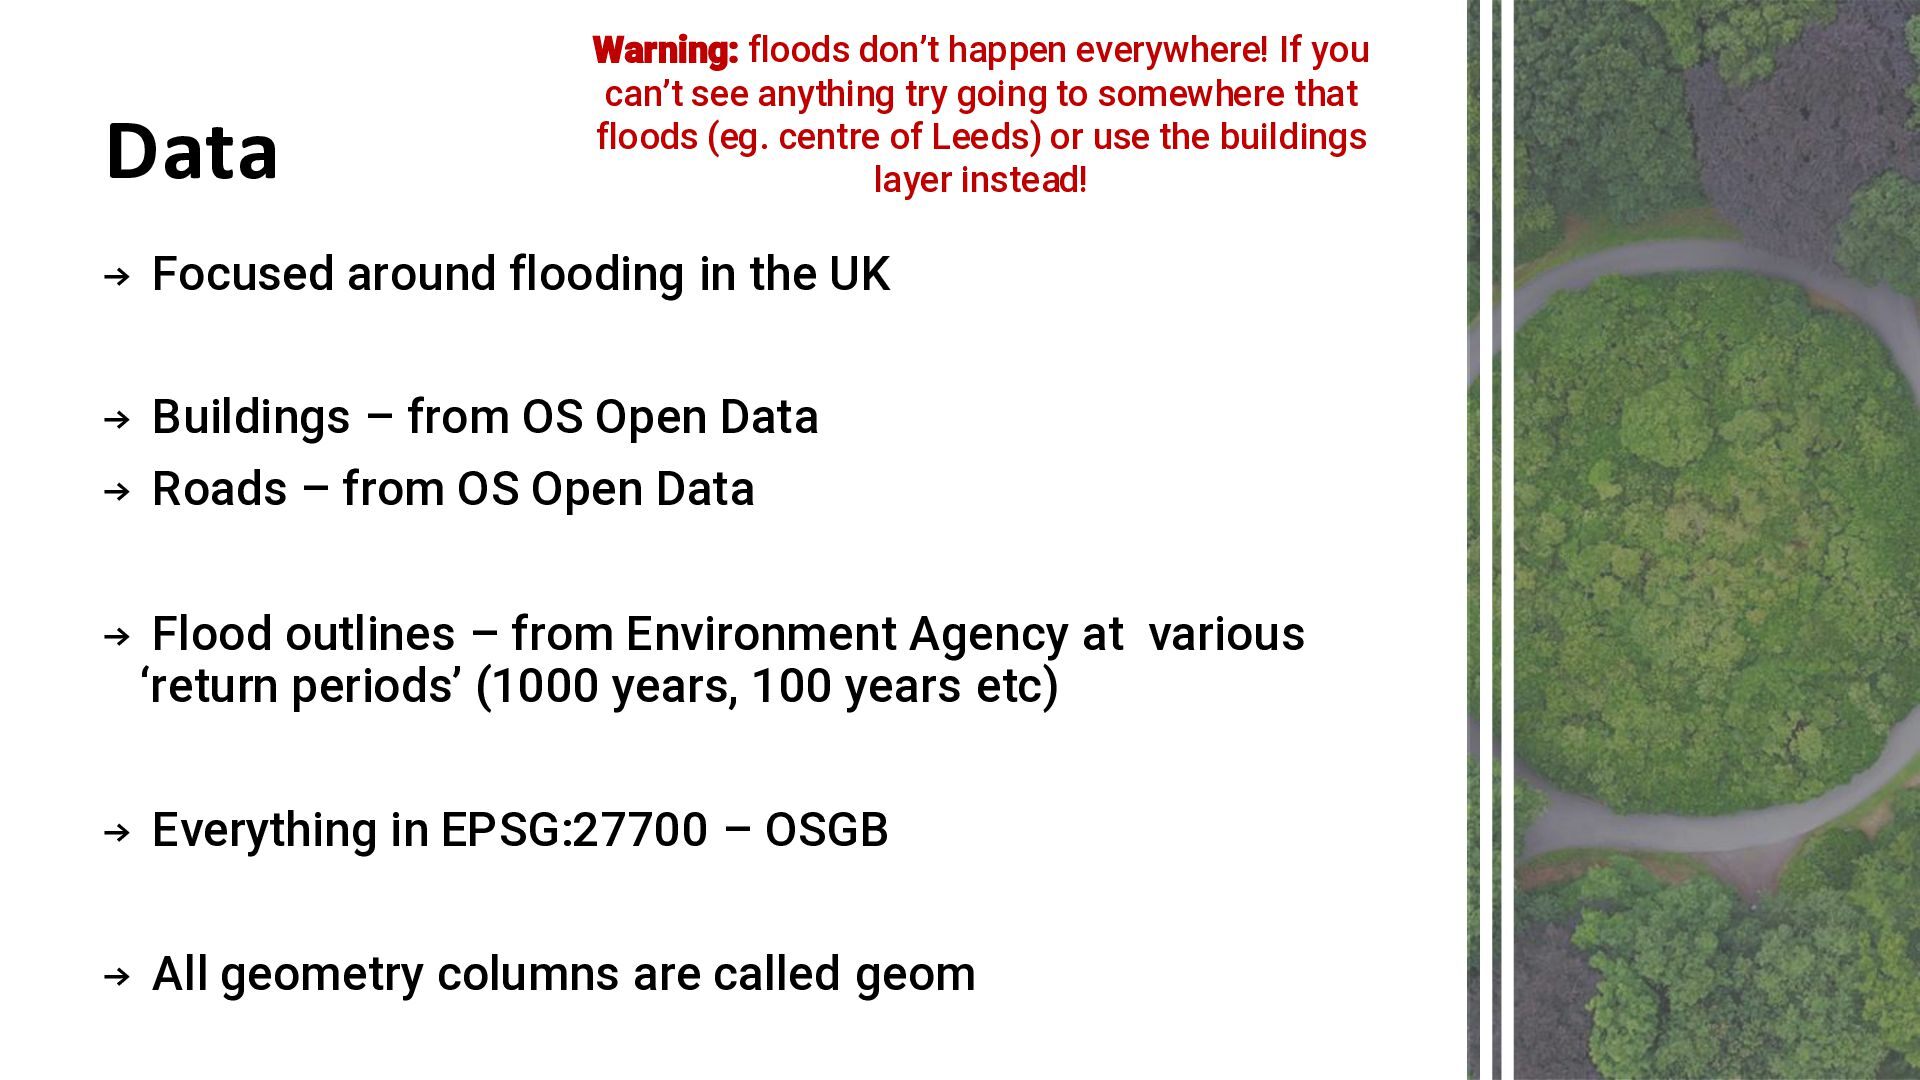
– from OS Open Data → Roads – from OS Open Data → Flood outlines – from Environment Agency at various ‘return periods’ (1000 years, 100 years etc) → Everything in EPSG:27700 – OSGB → All geometry columns are called geom Warning: floods don’t happen everywhere! If you can’t see anything try going to somewhere that floods (eg. centre of Leeds) or use the buildings layer instead!
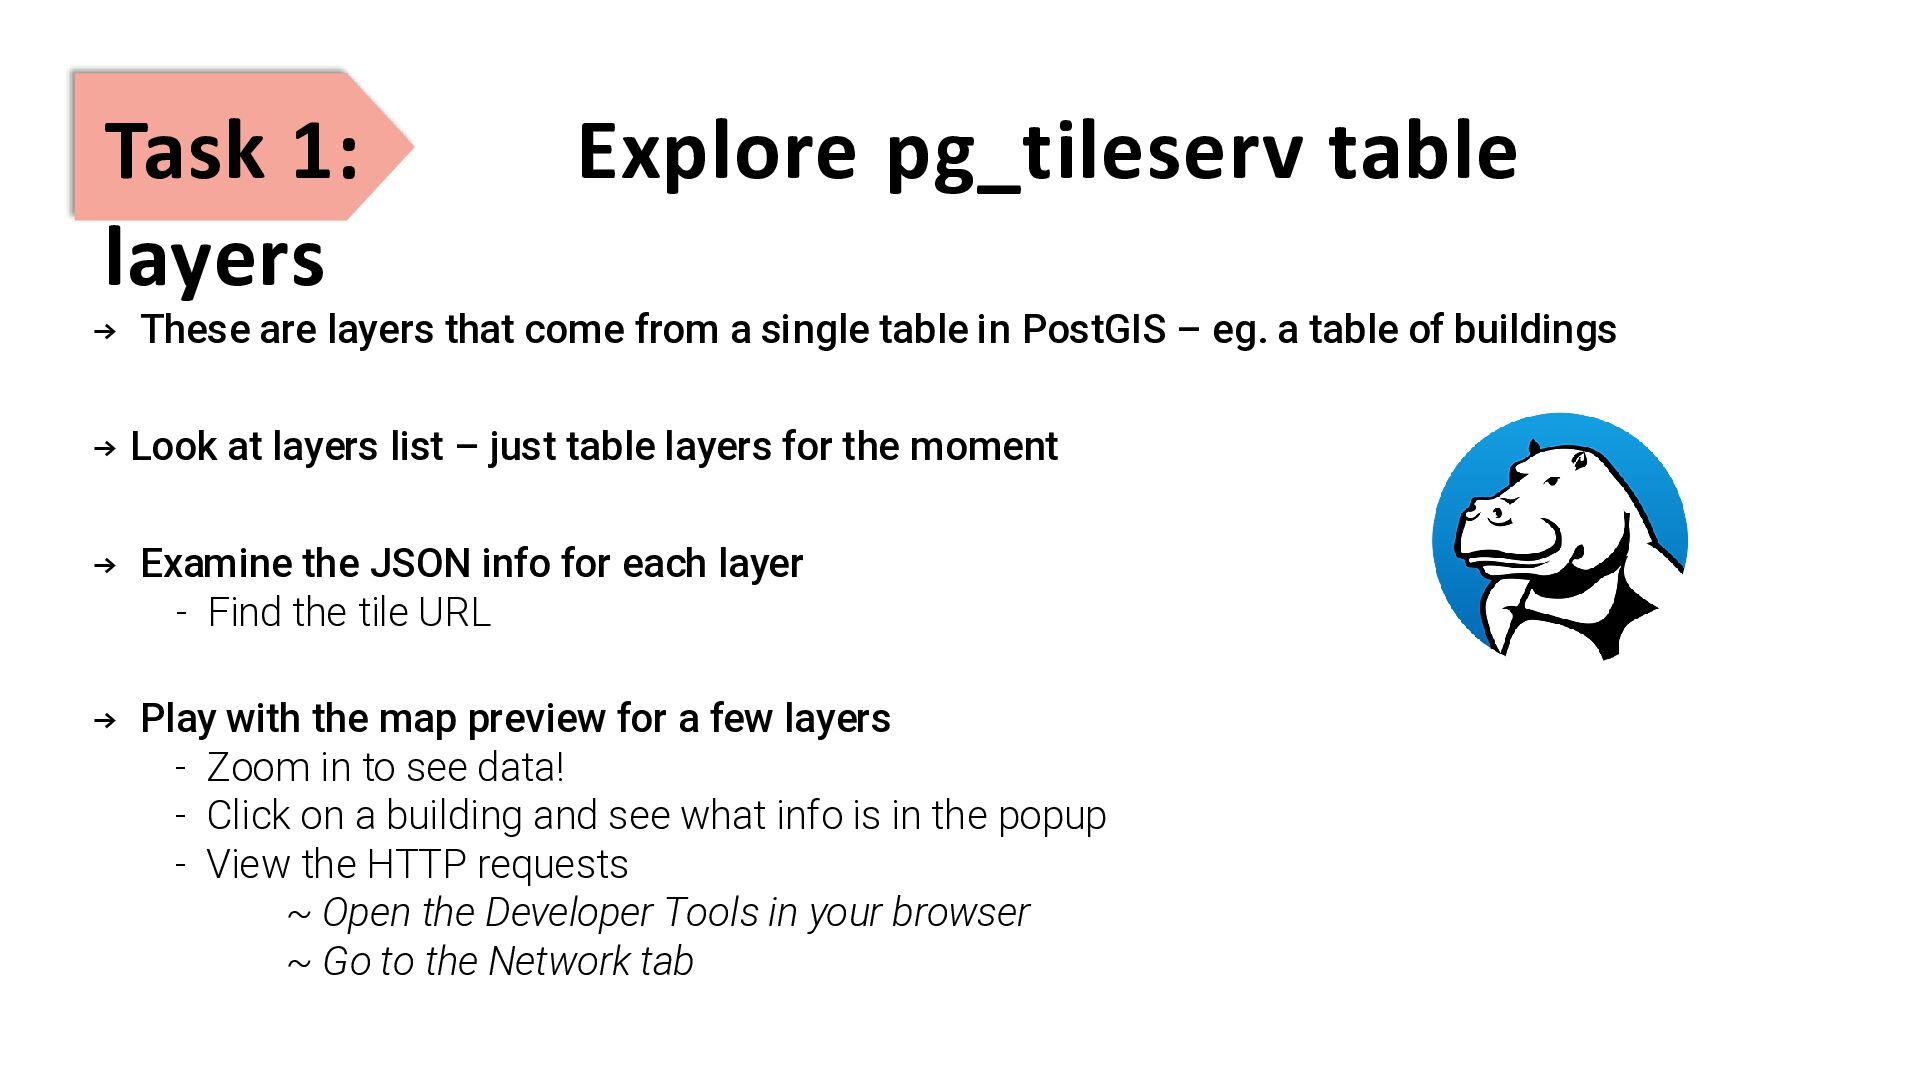
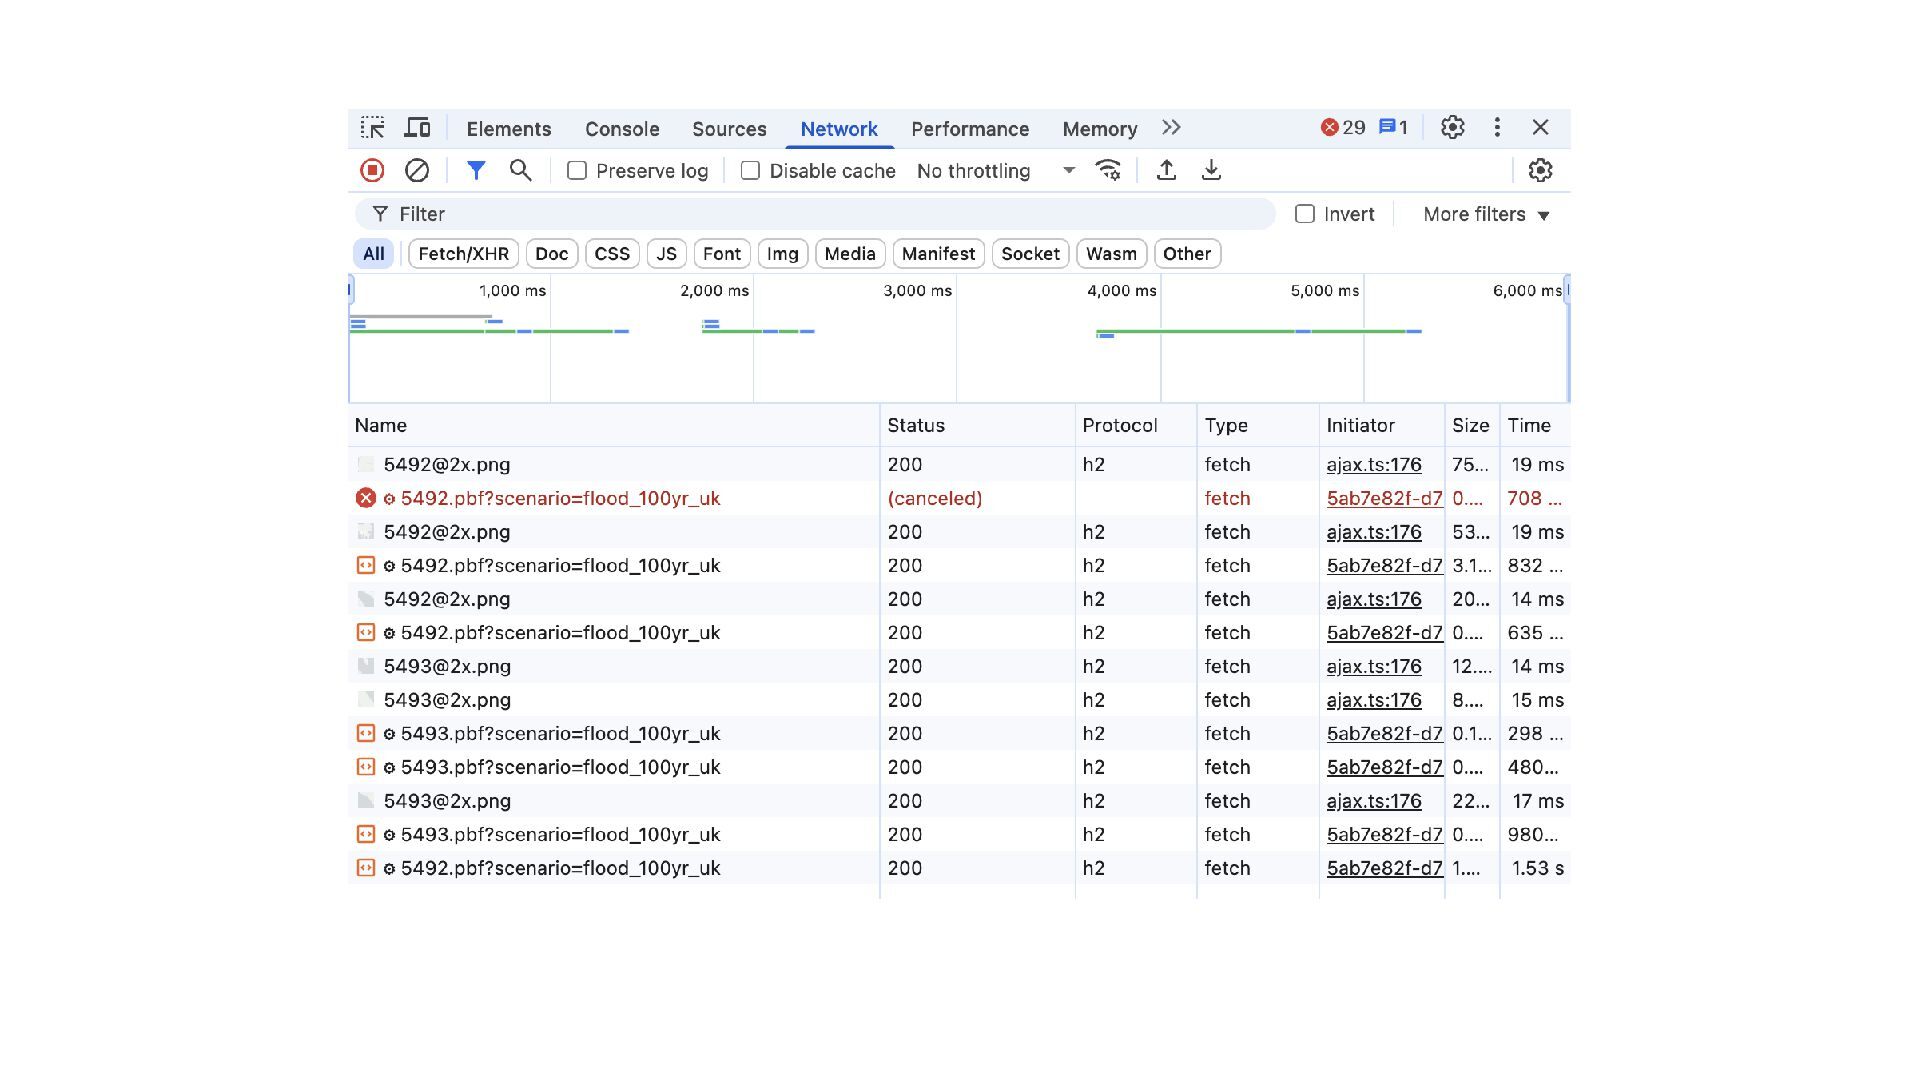
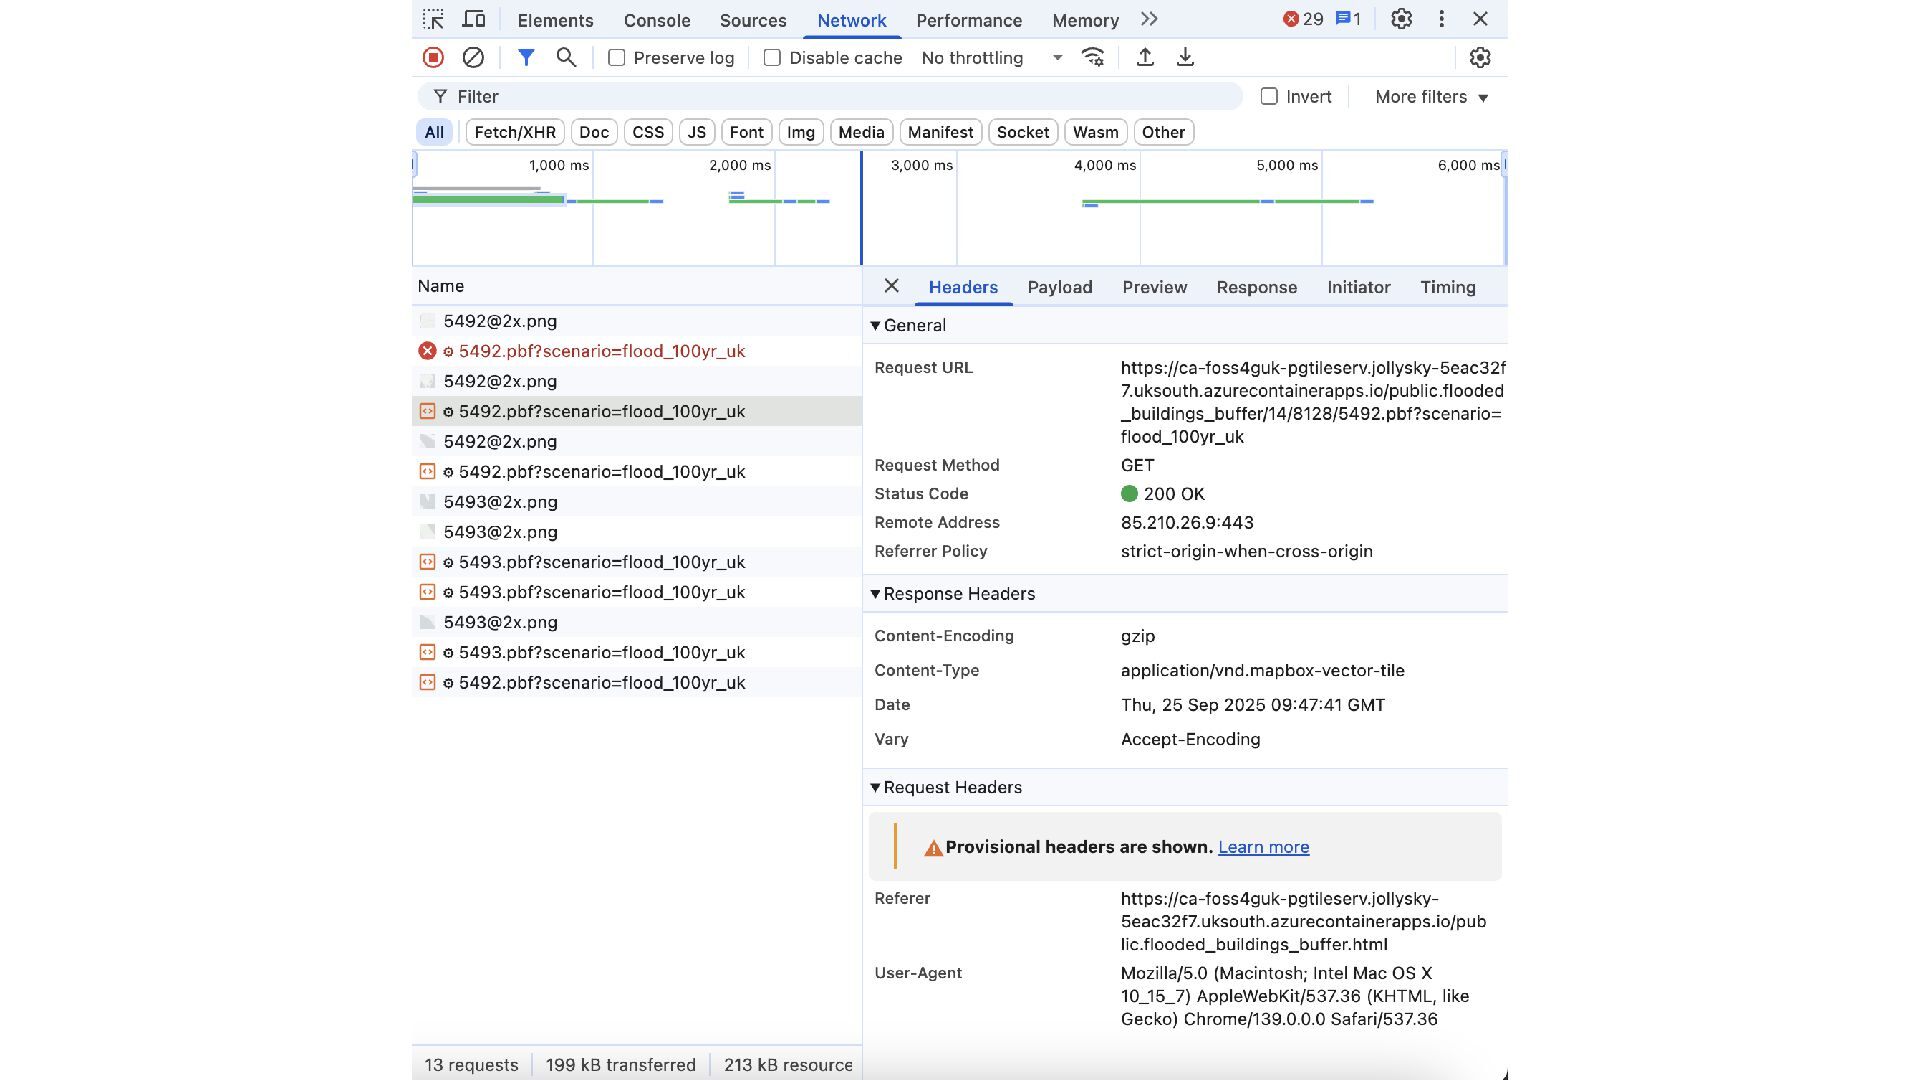
that come from a single table in PostGIS – eg. a table of buildings → Look at layers list – just table layers for the moment → Examine the JSON info for each layer - Find the tile URL → Play with the map preview for a few layers - Zoom in to see data! - Click on a building and see what info is in the popup - View the HTTP requests ~ Open the Developer Tools in your browser ~ Go to the Network tab
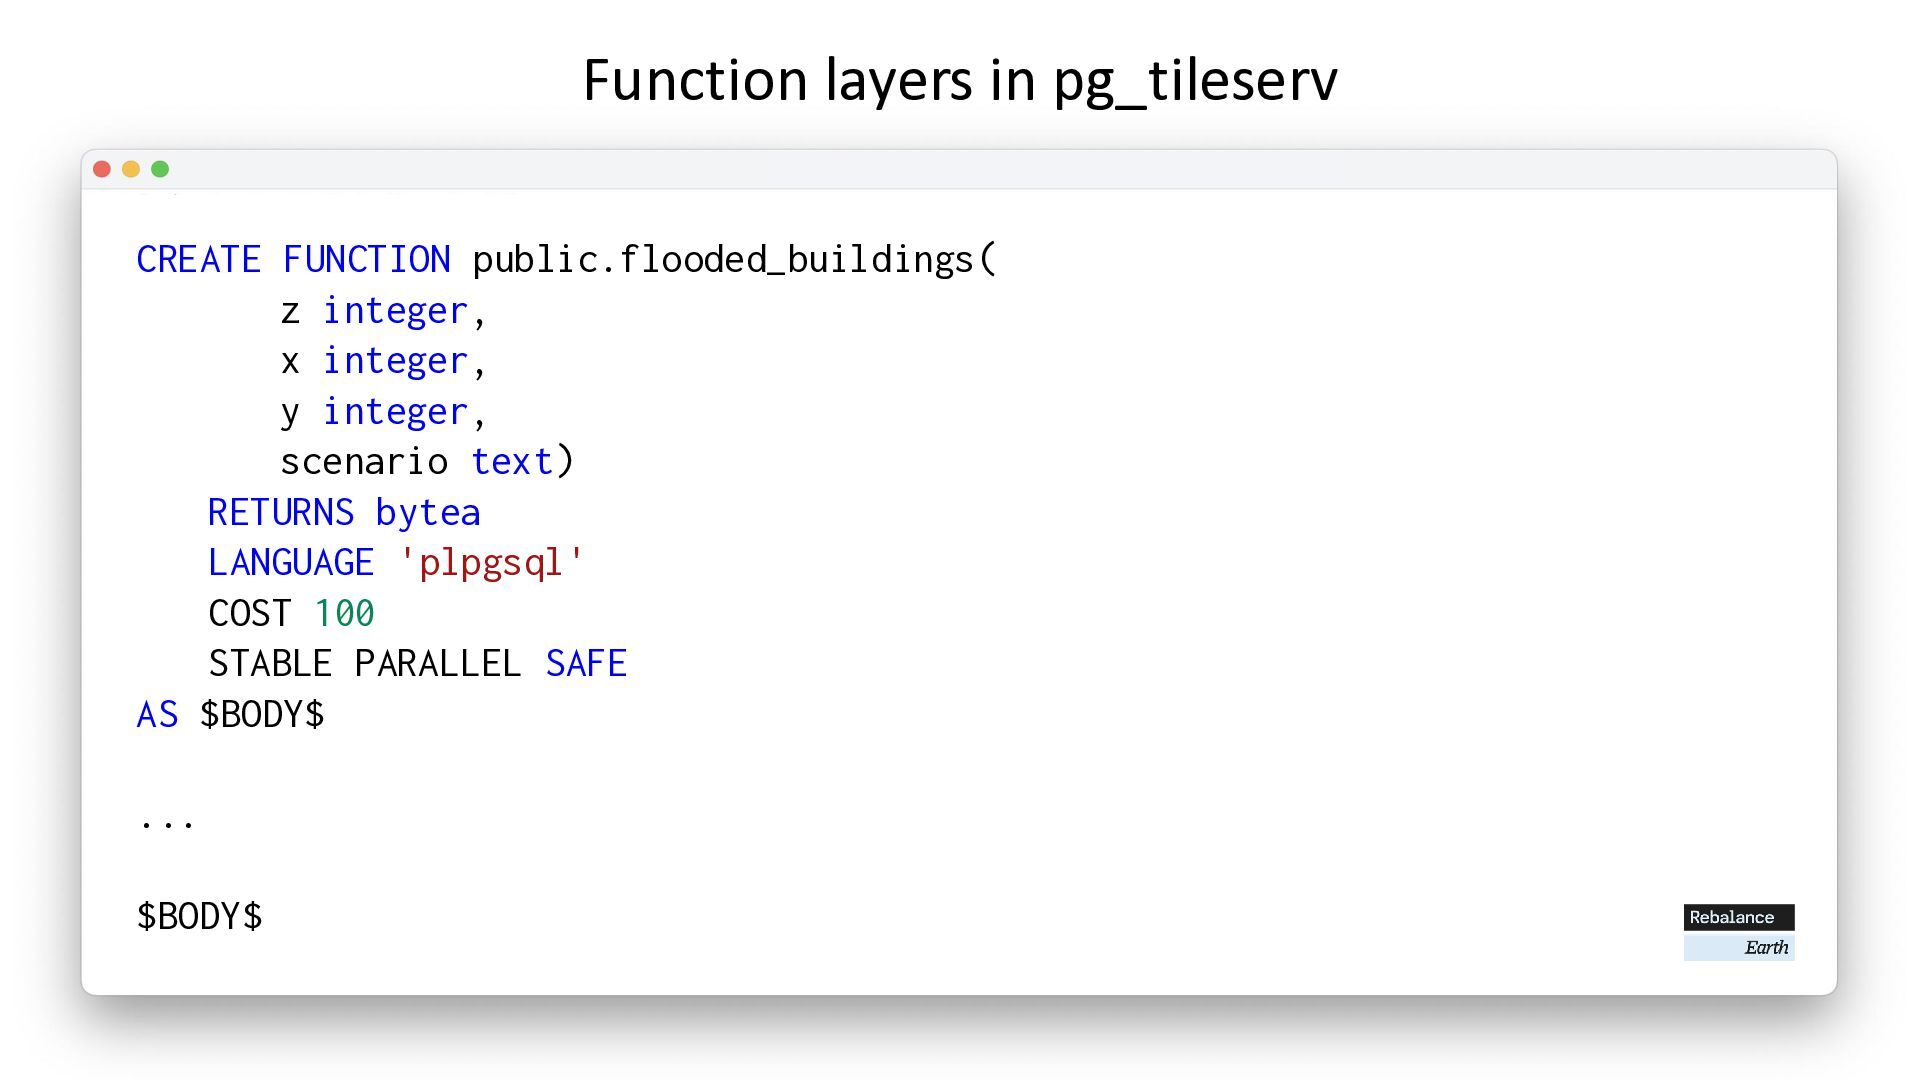
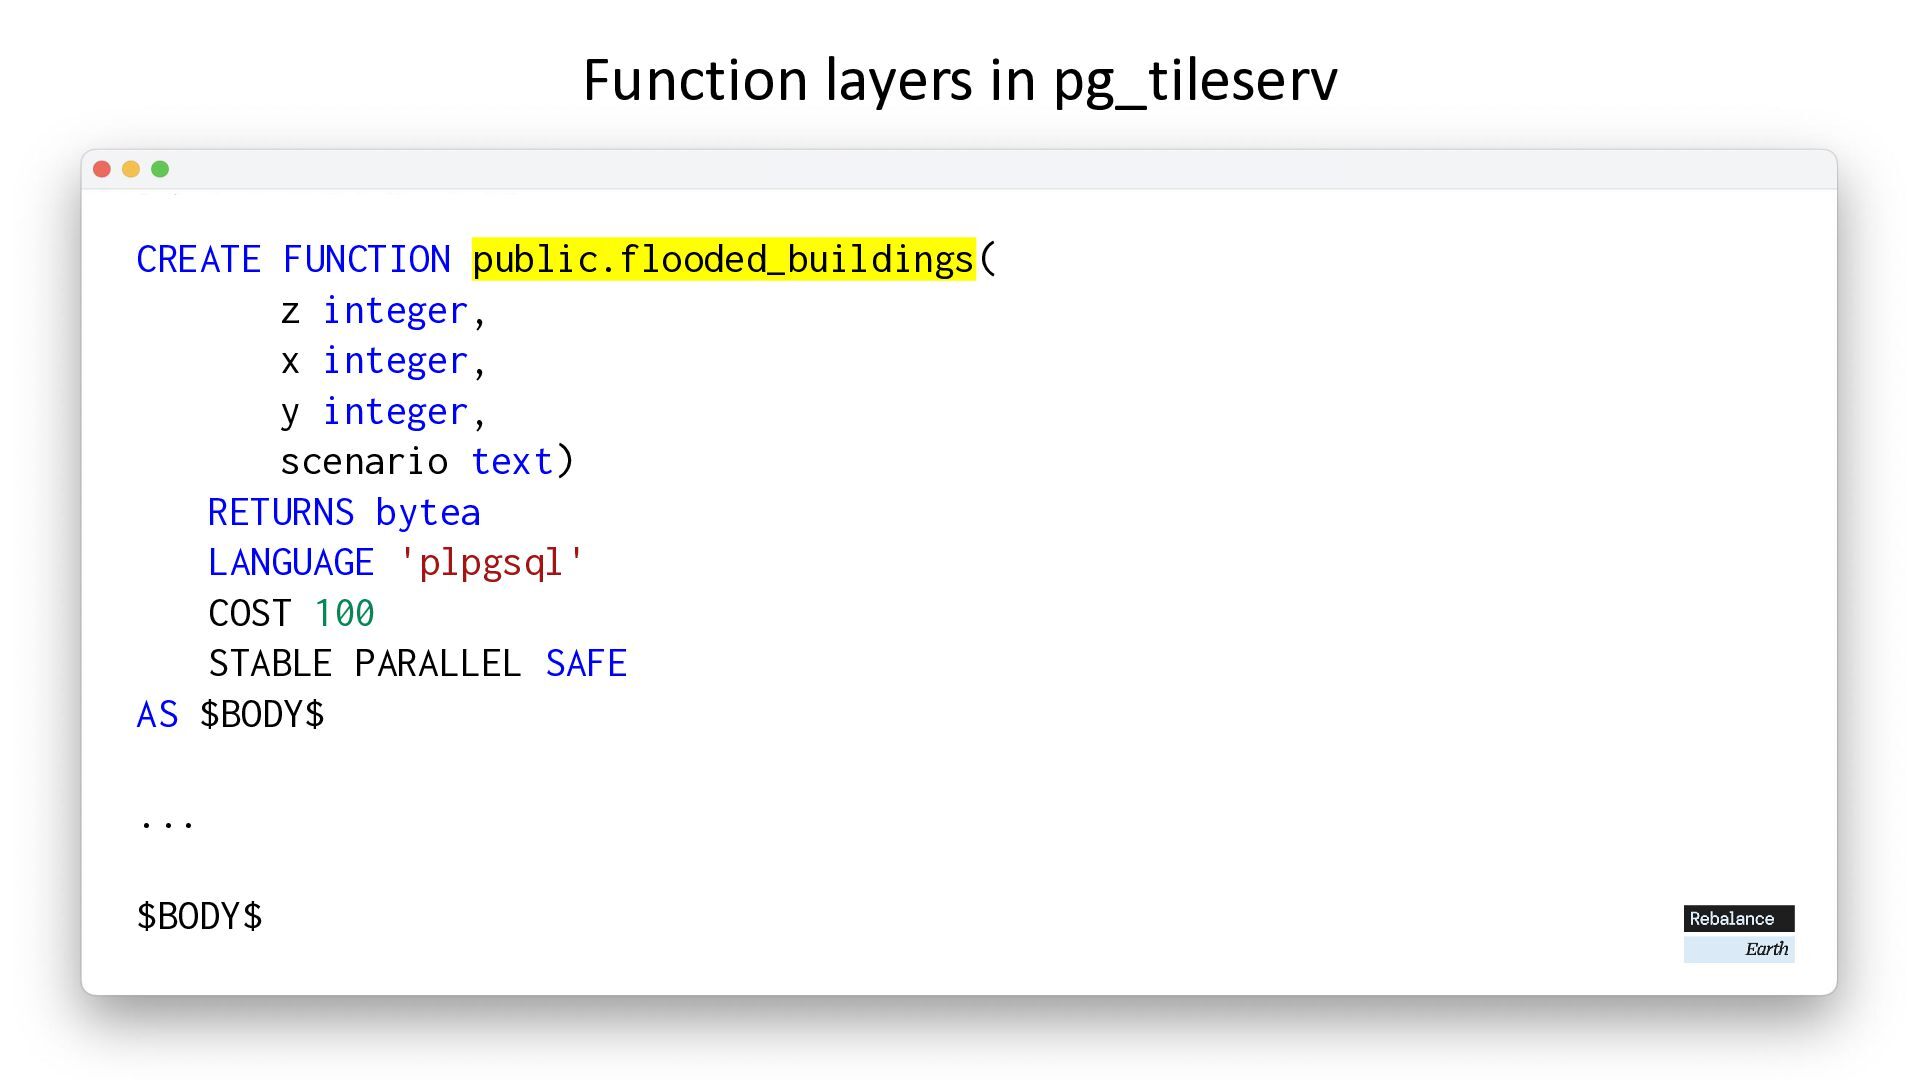
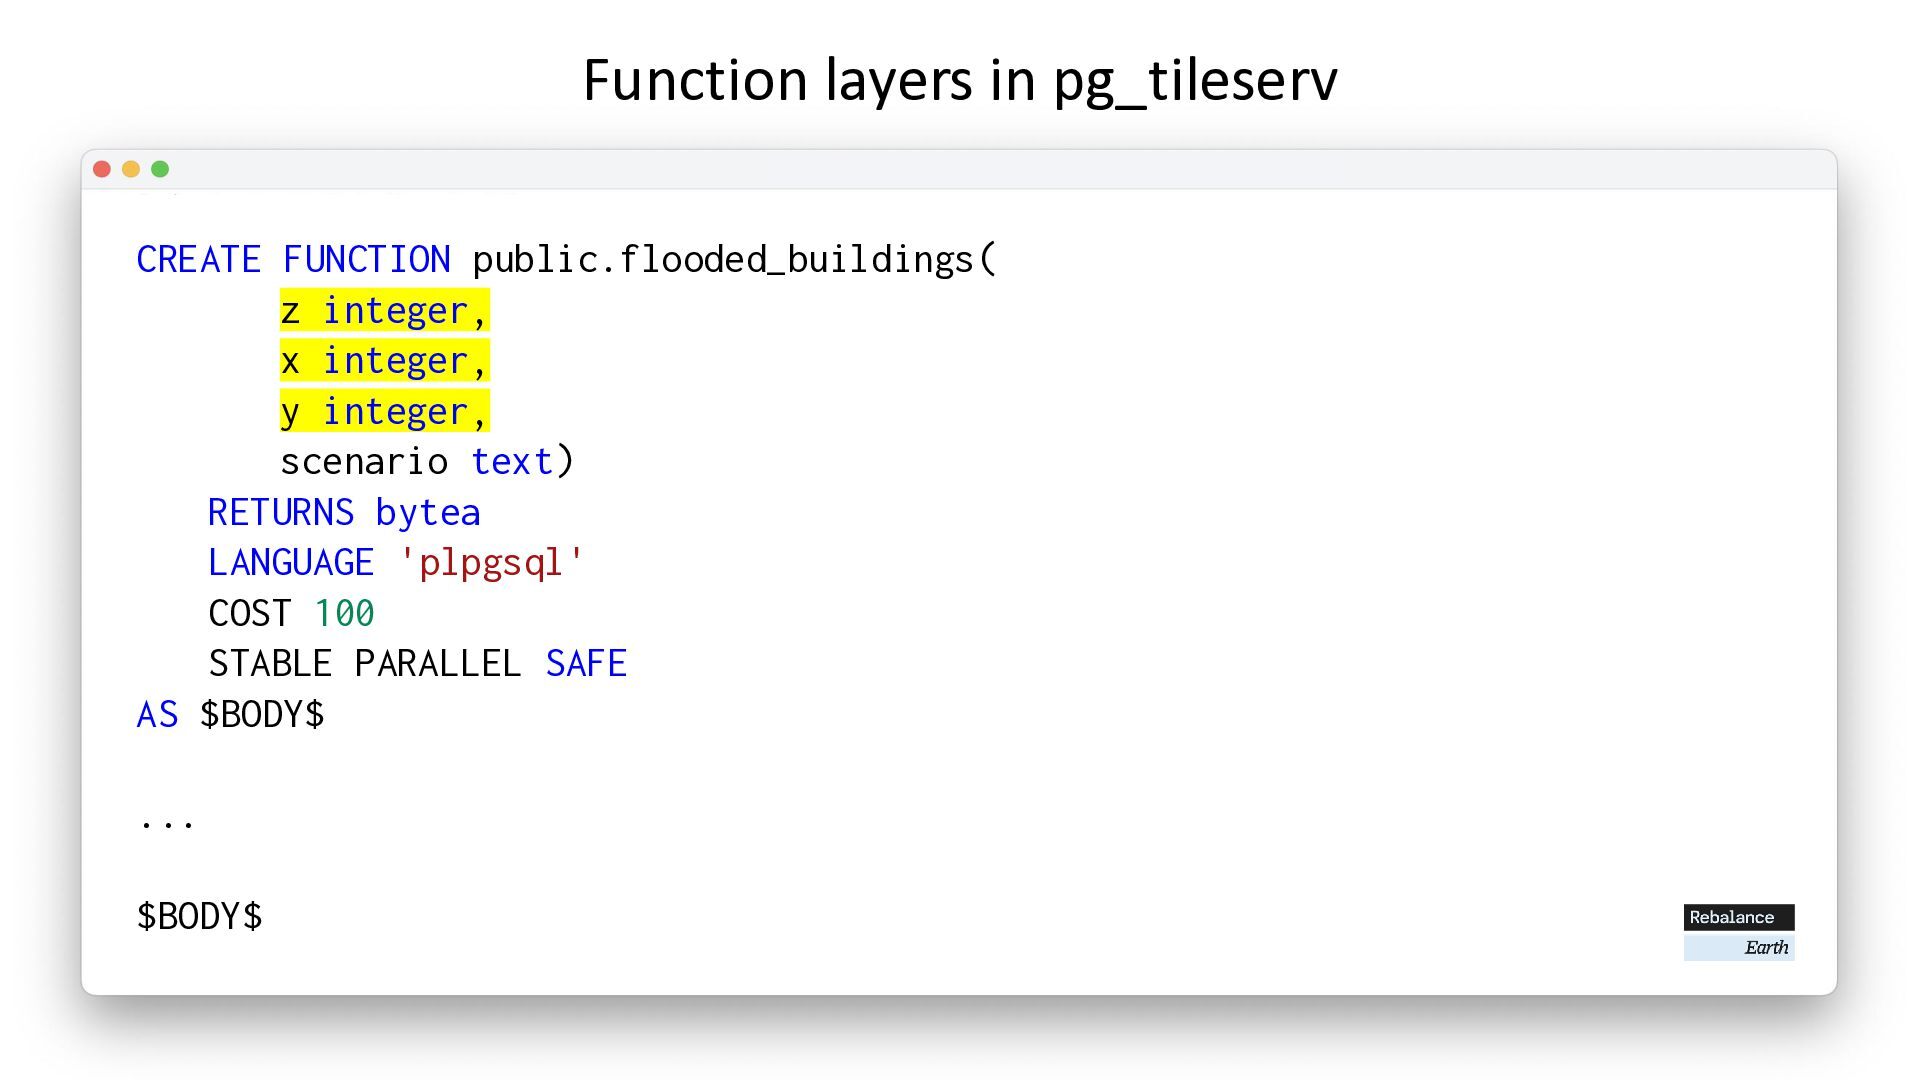
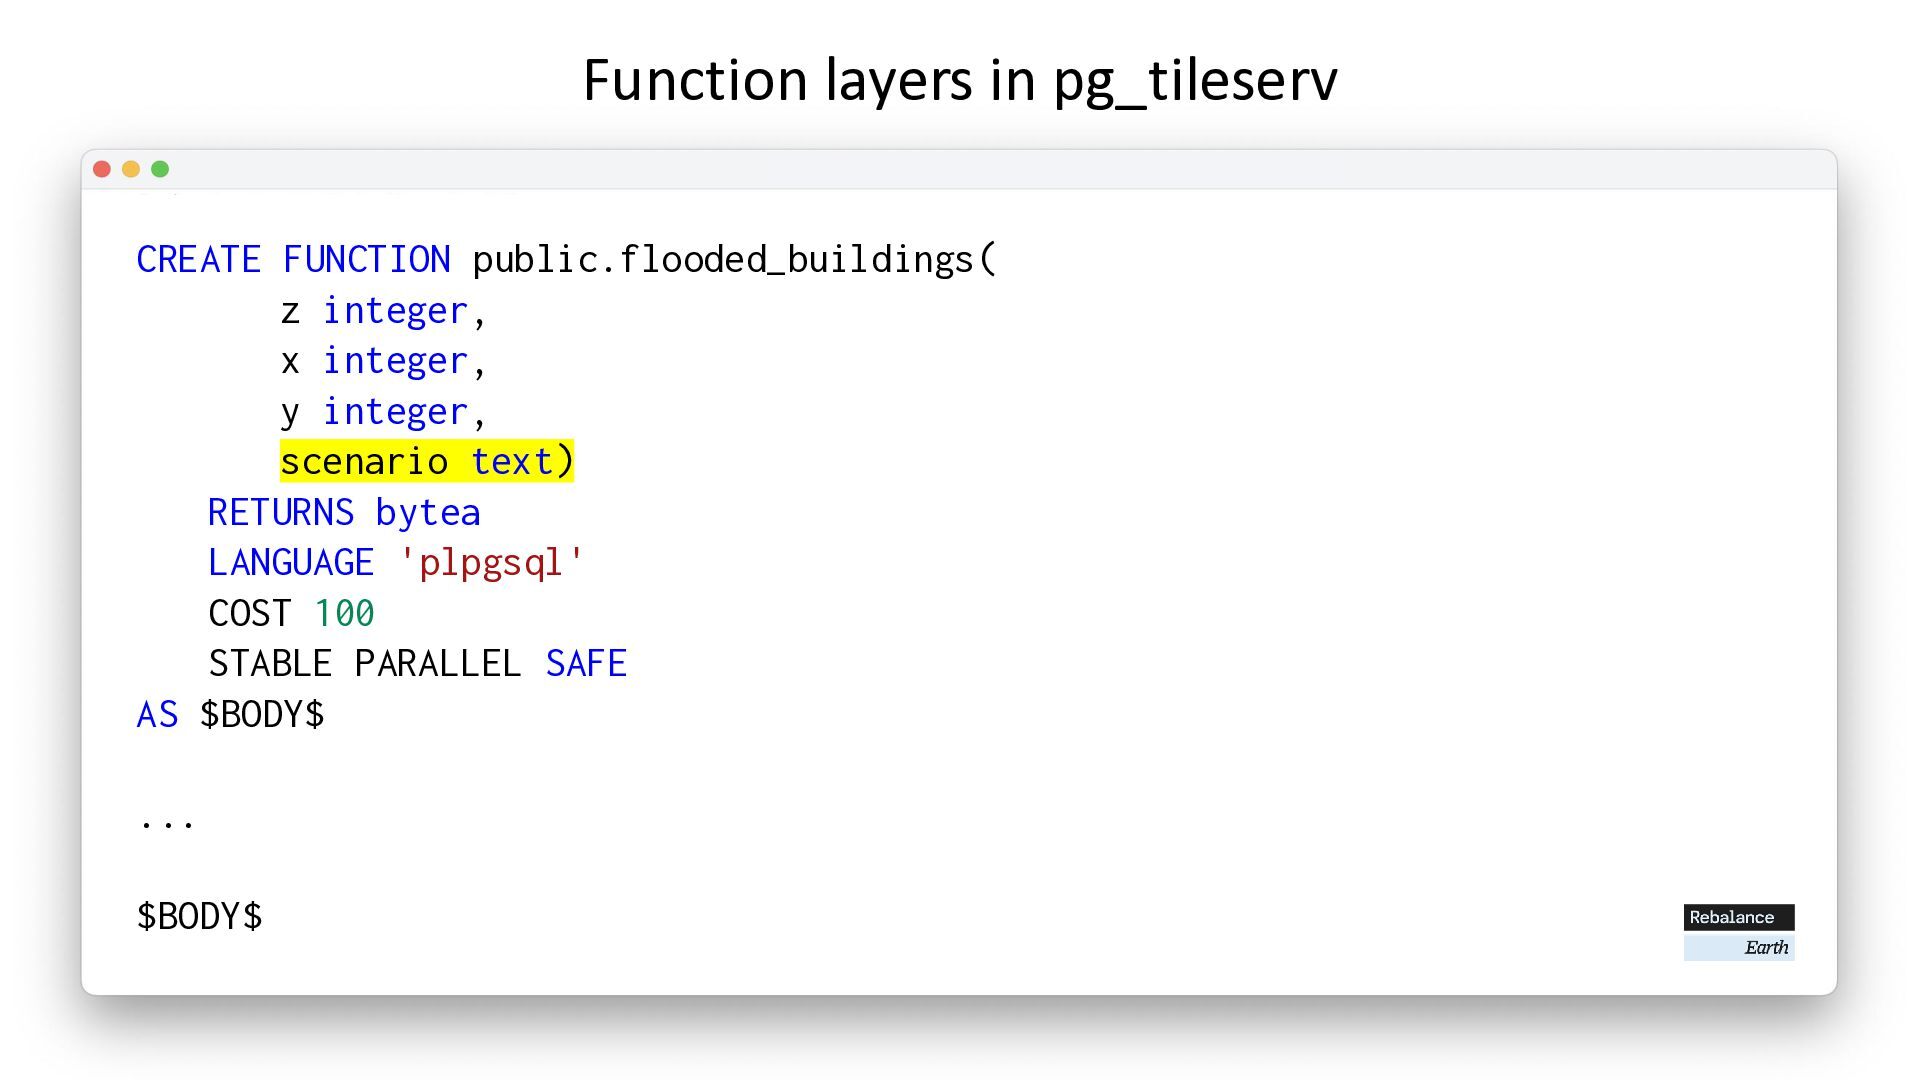
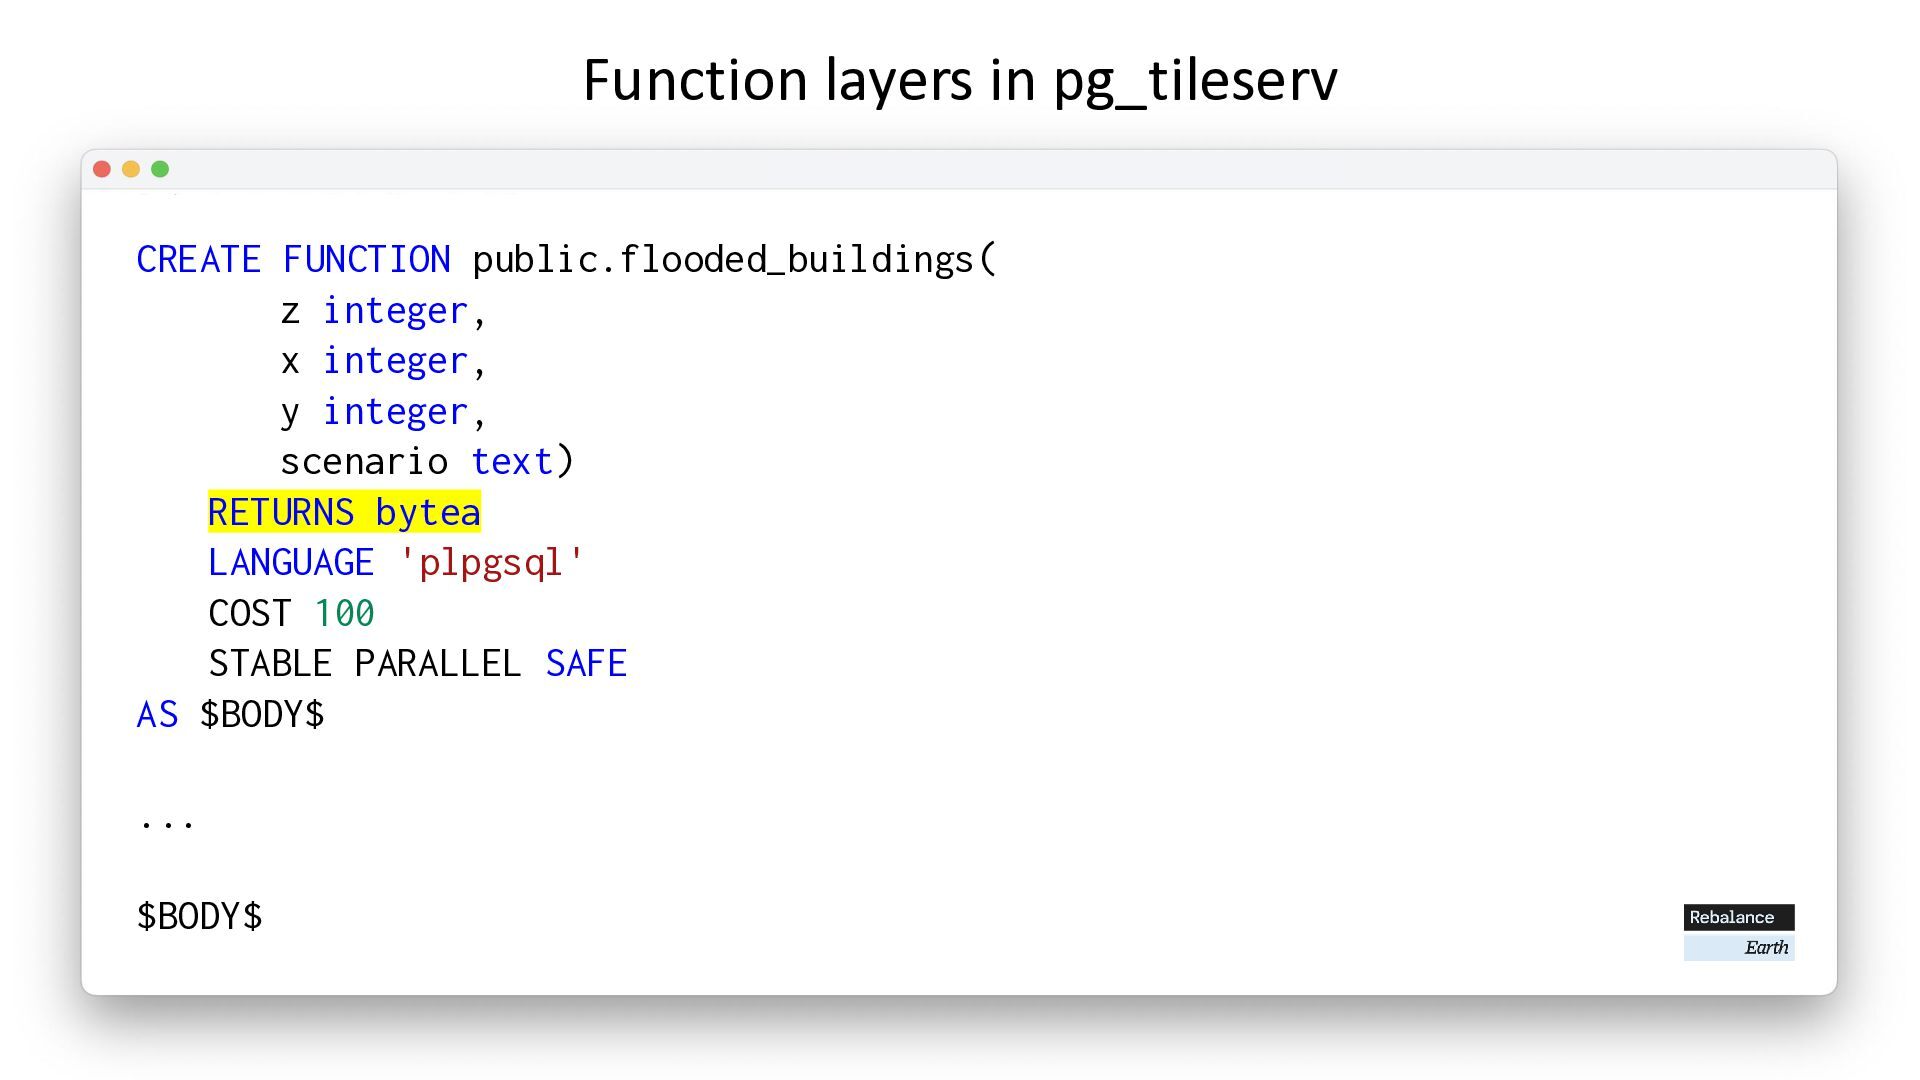
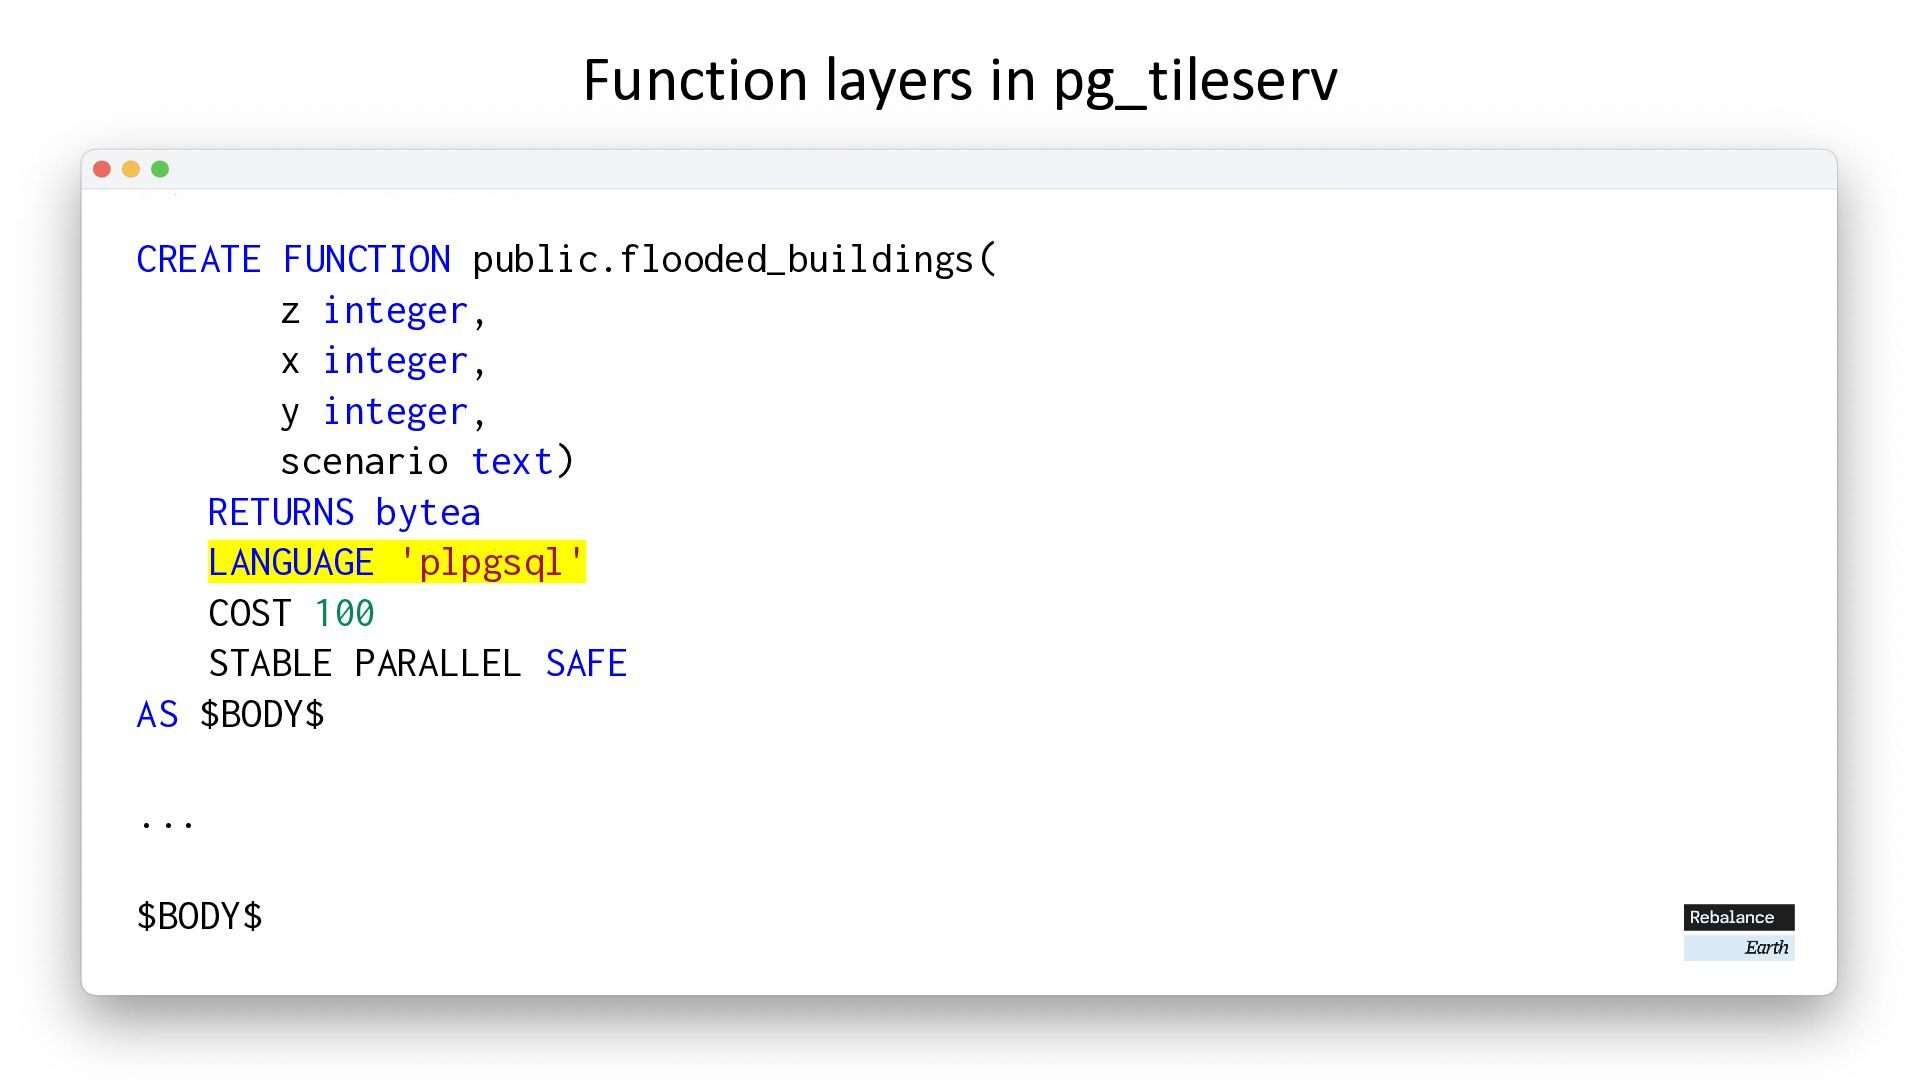
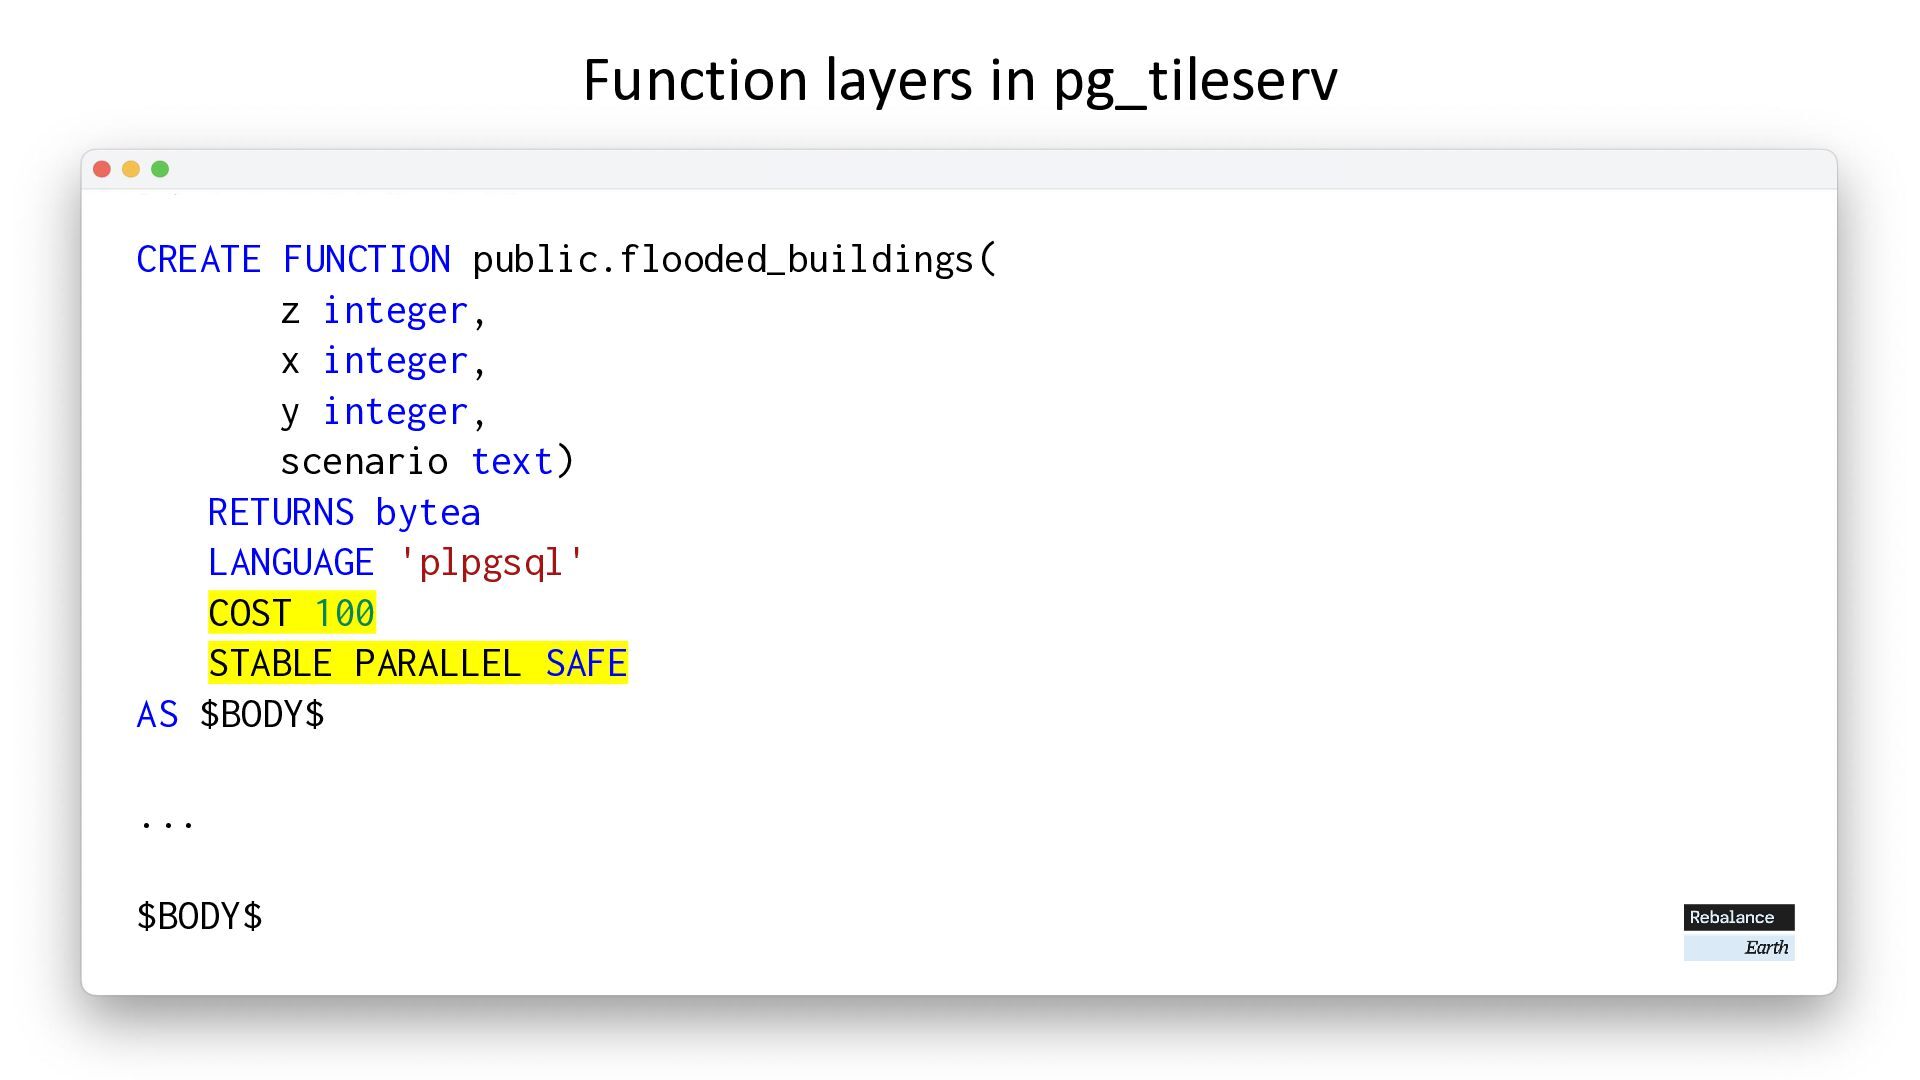
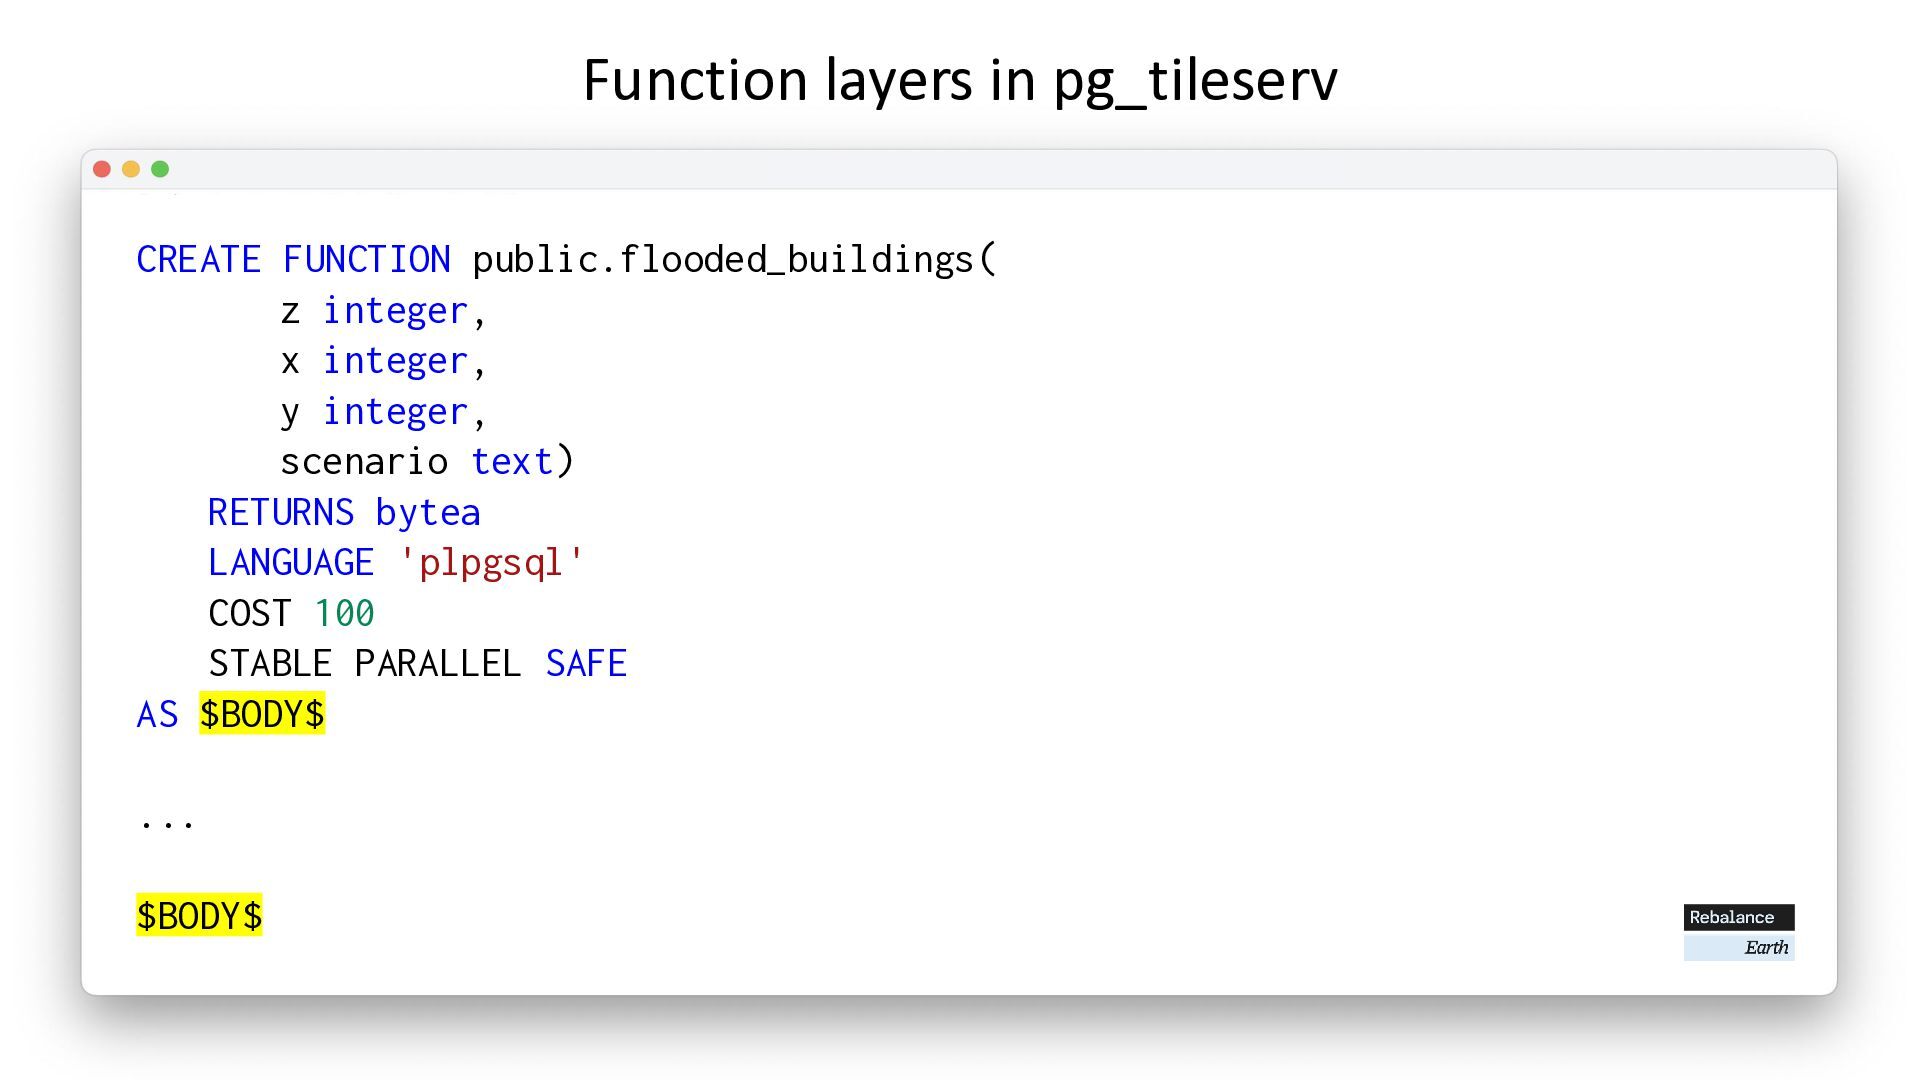
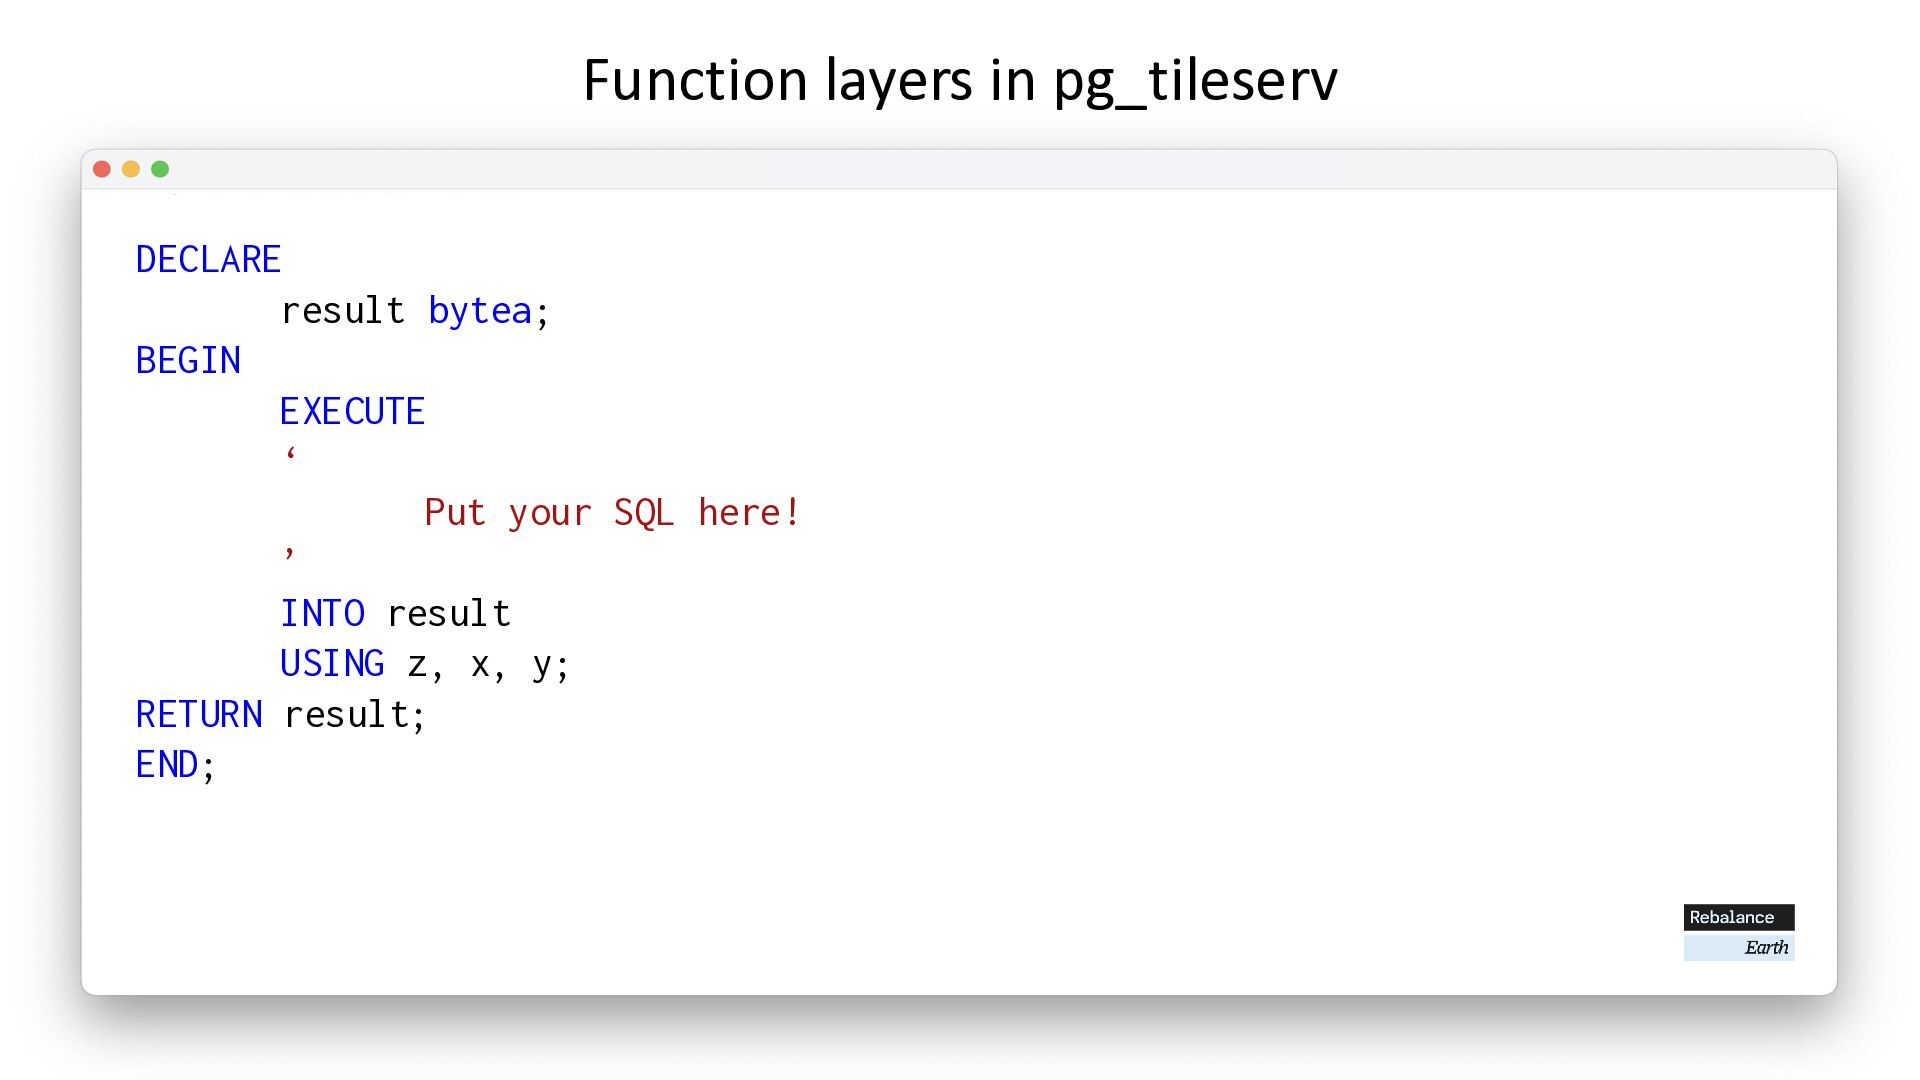
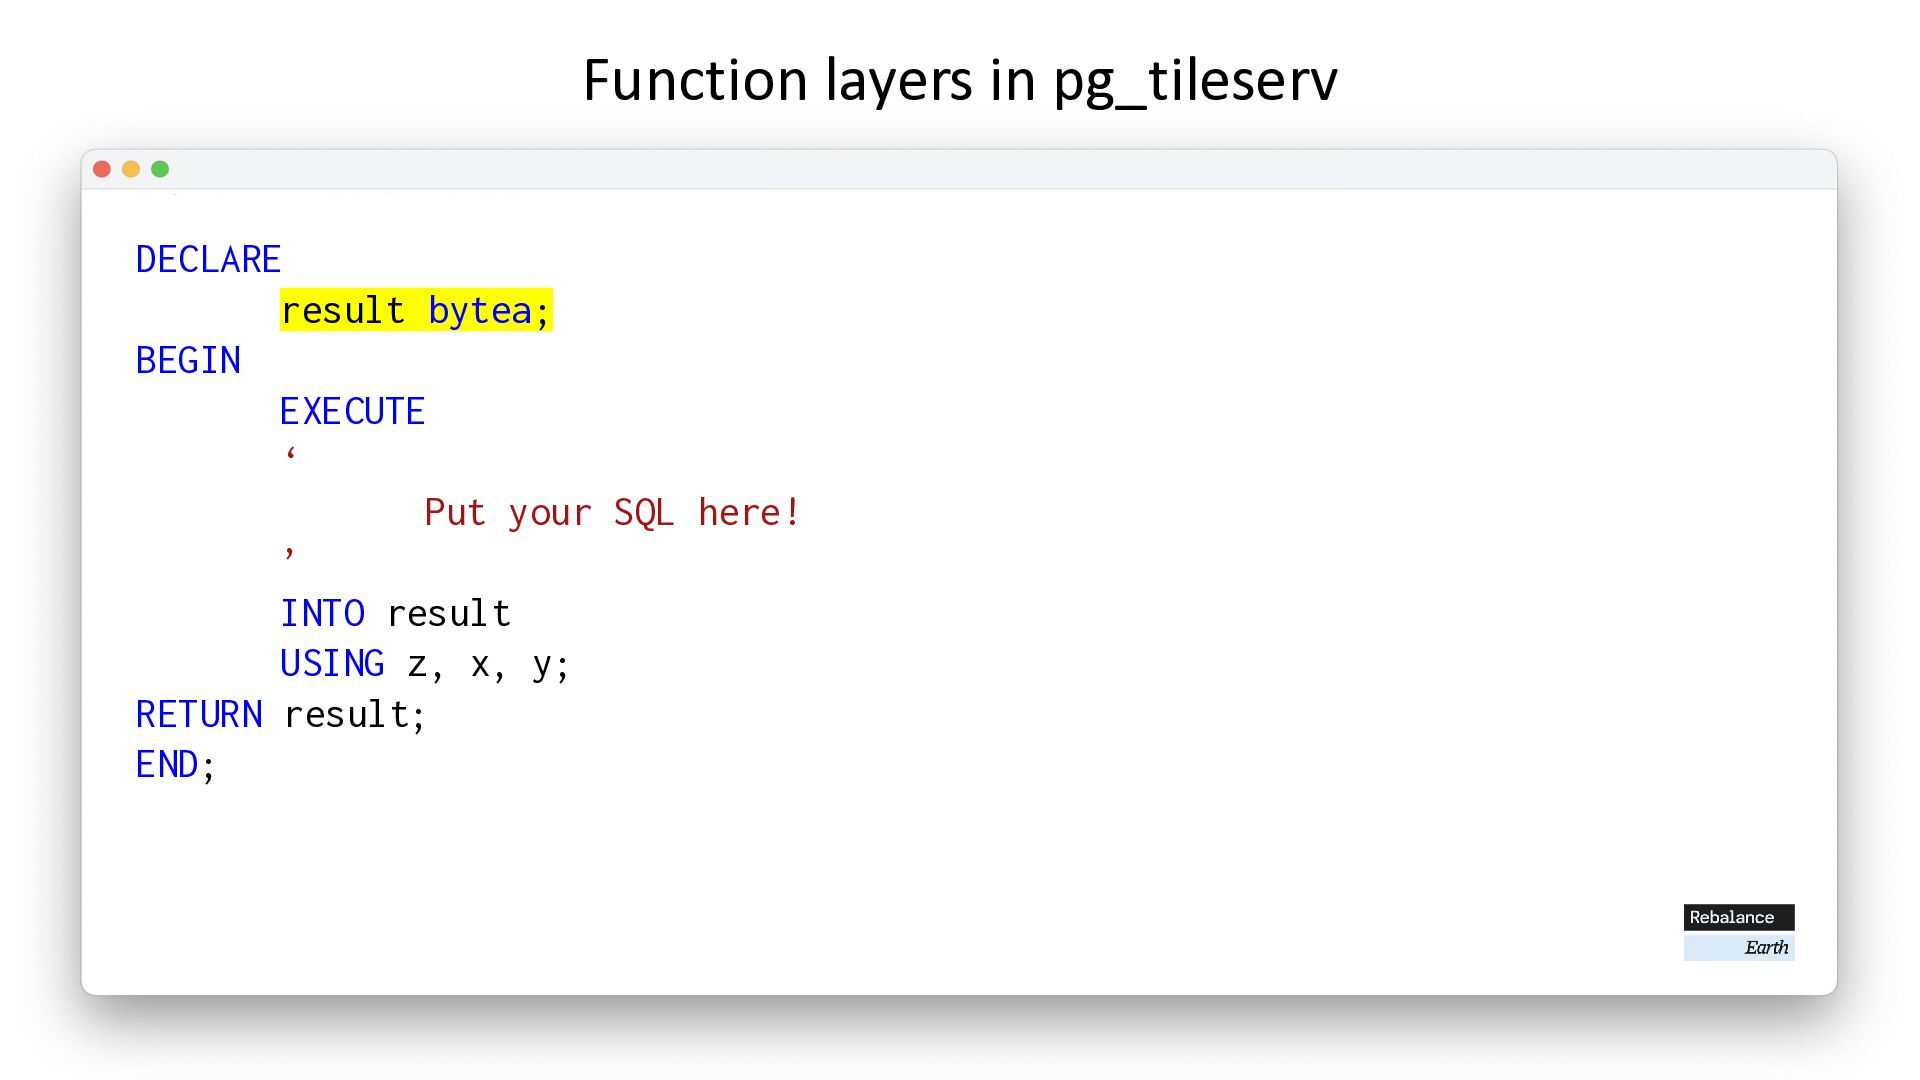
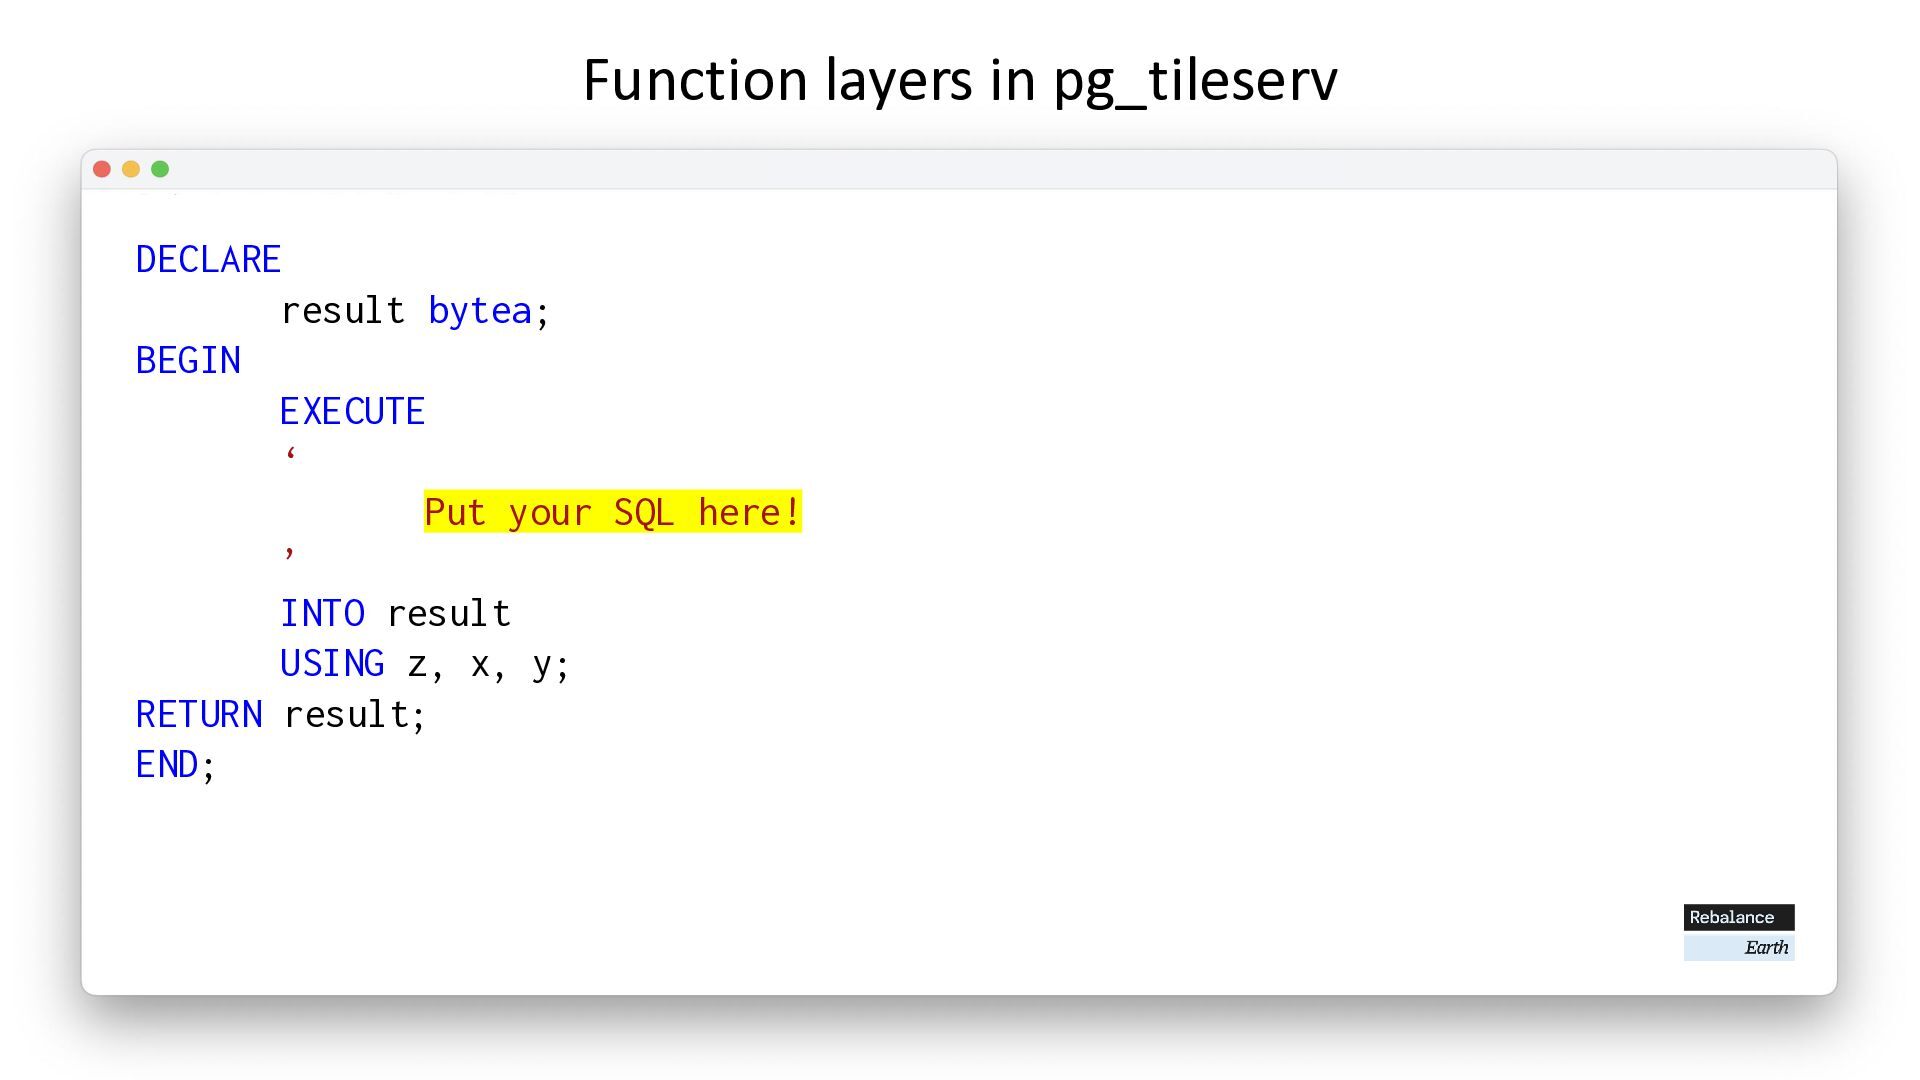
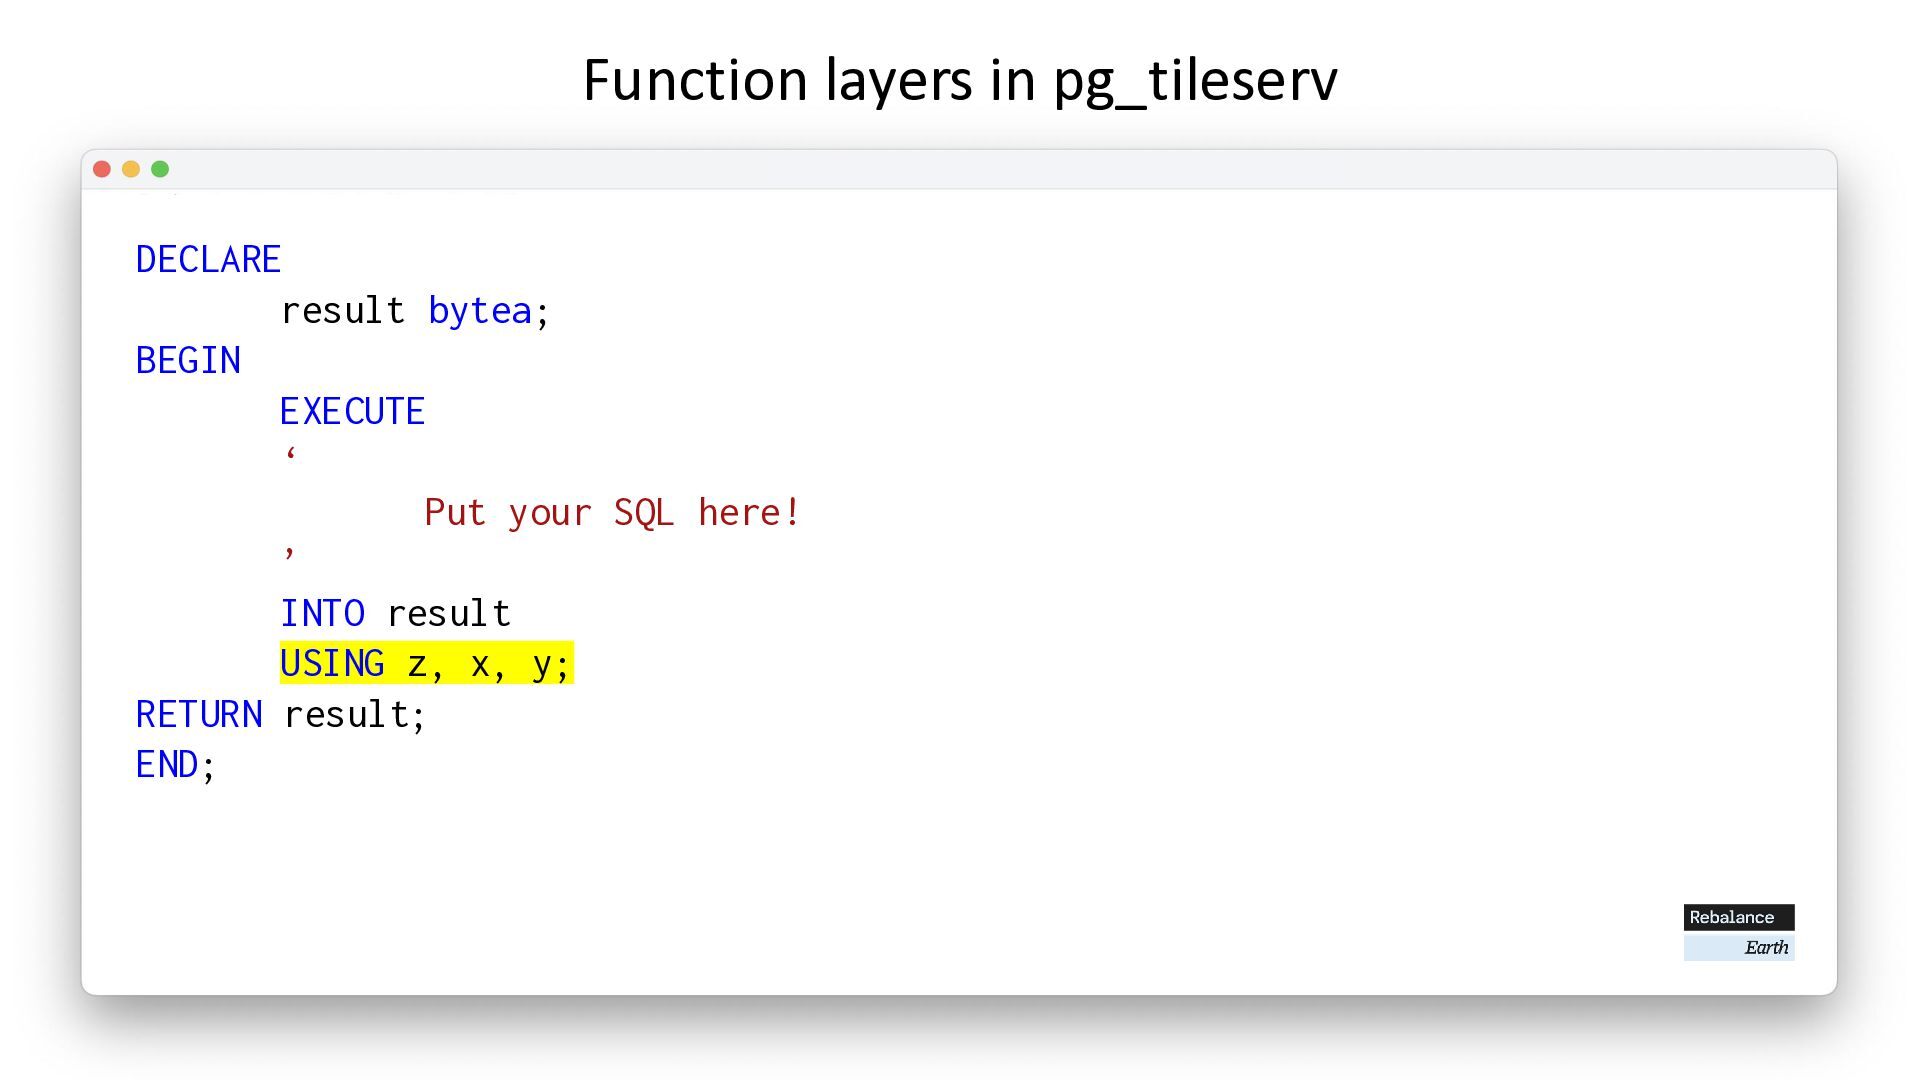
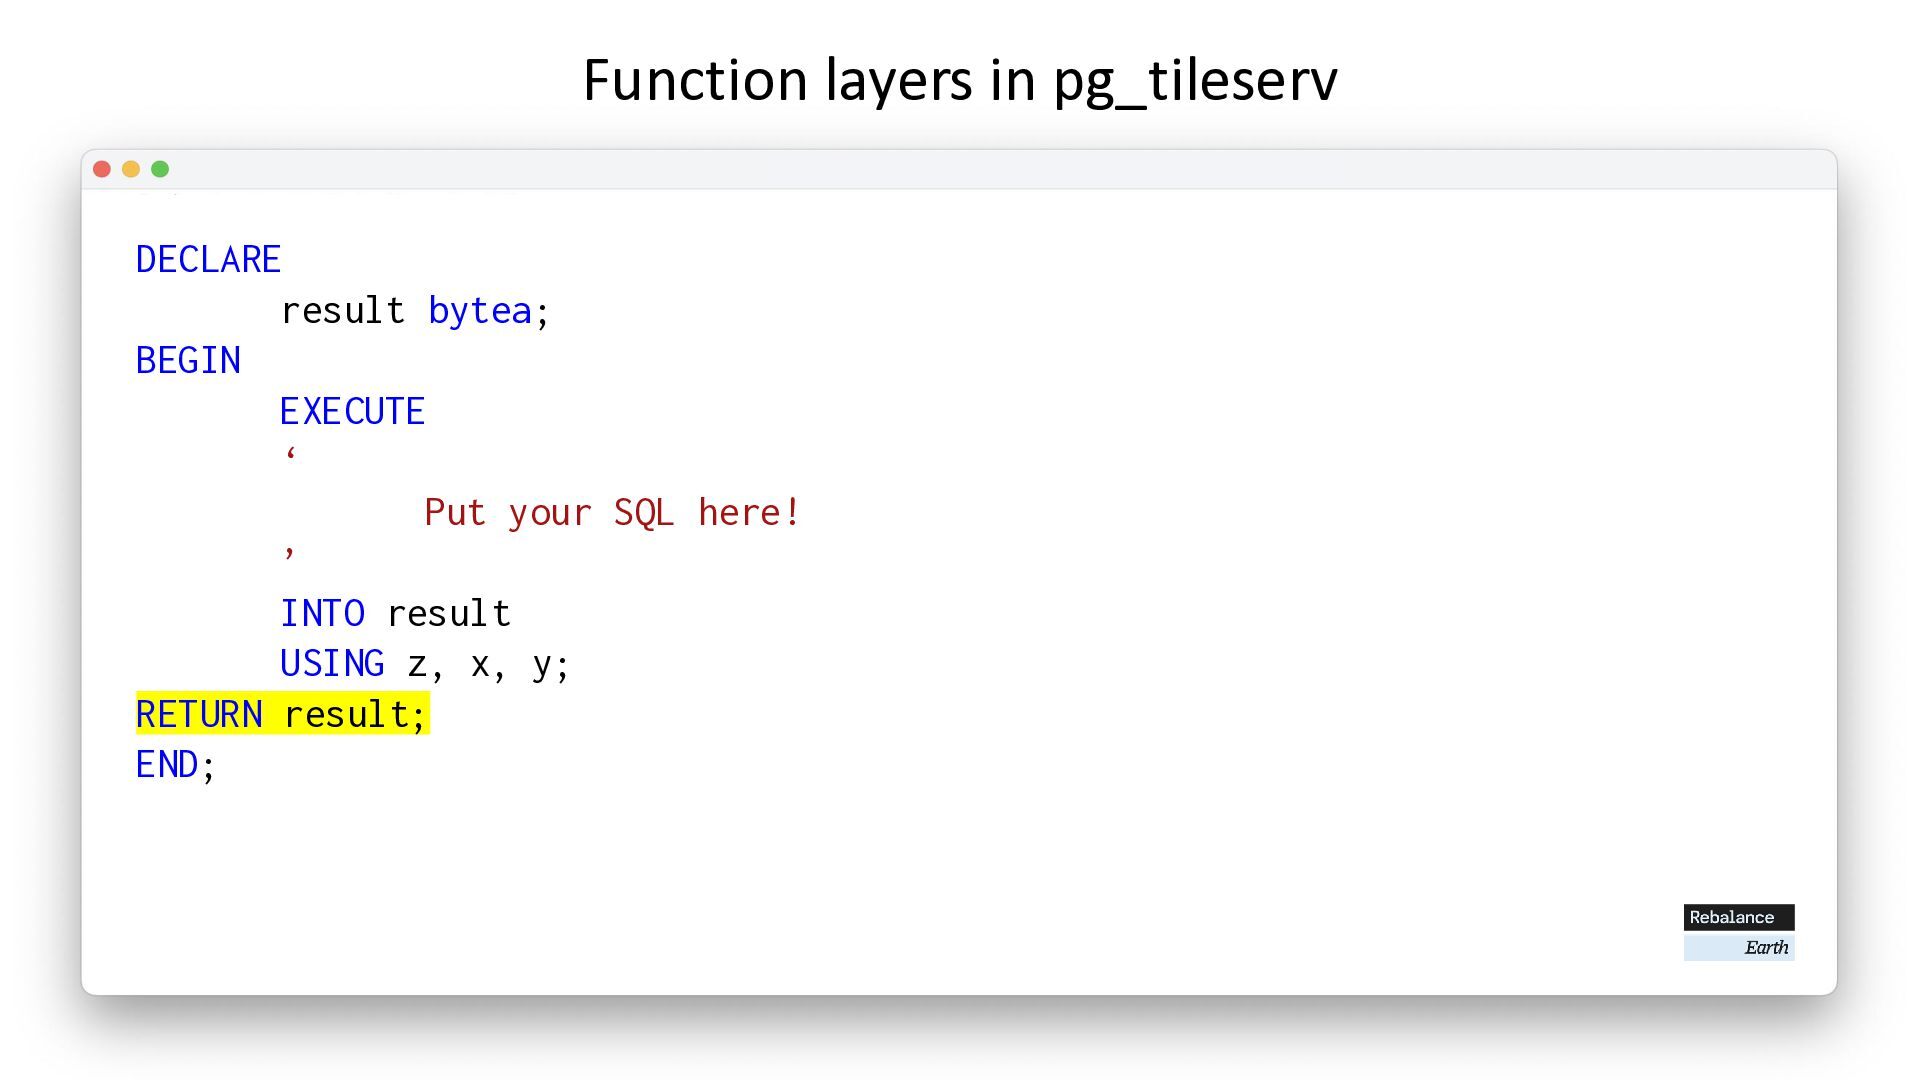
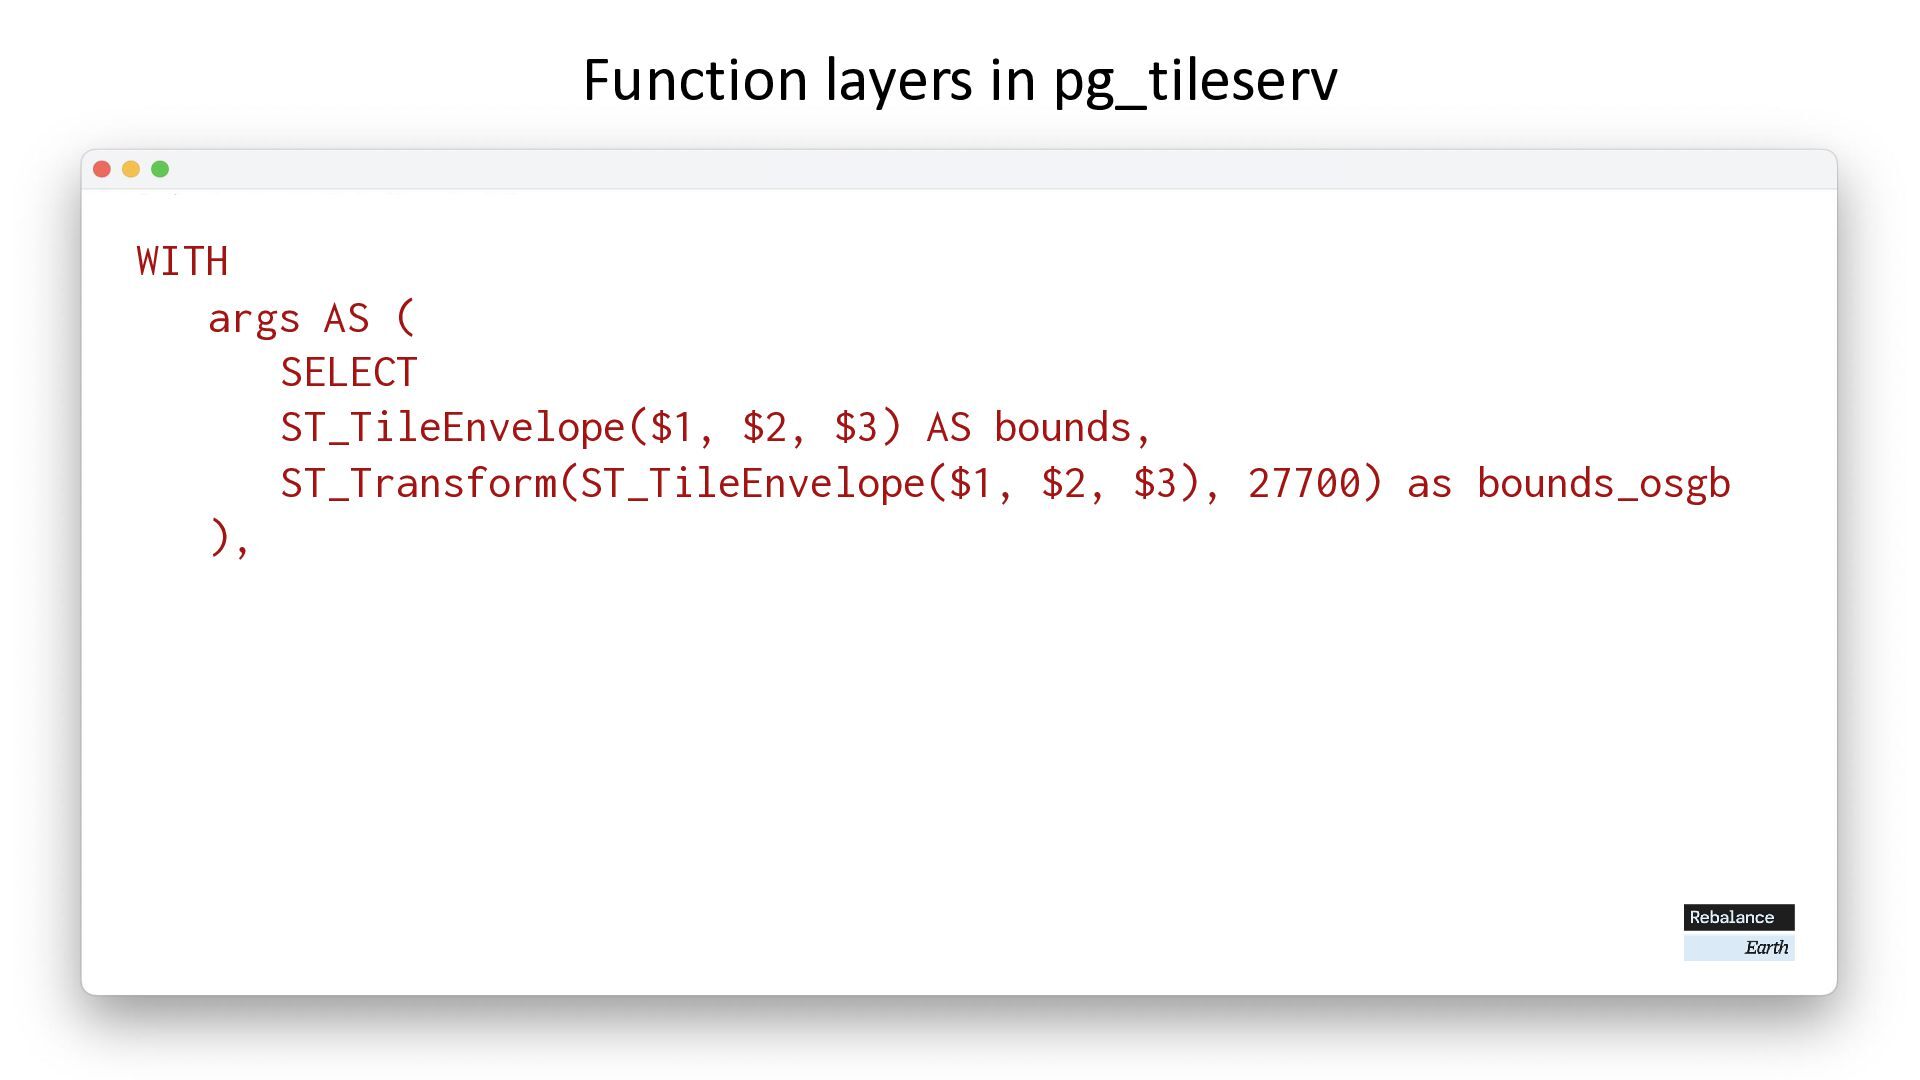
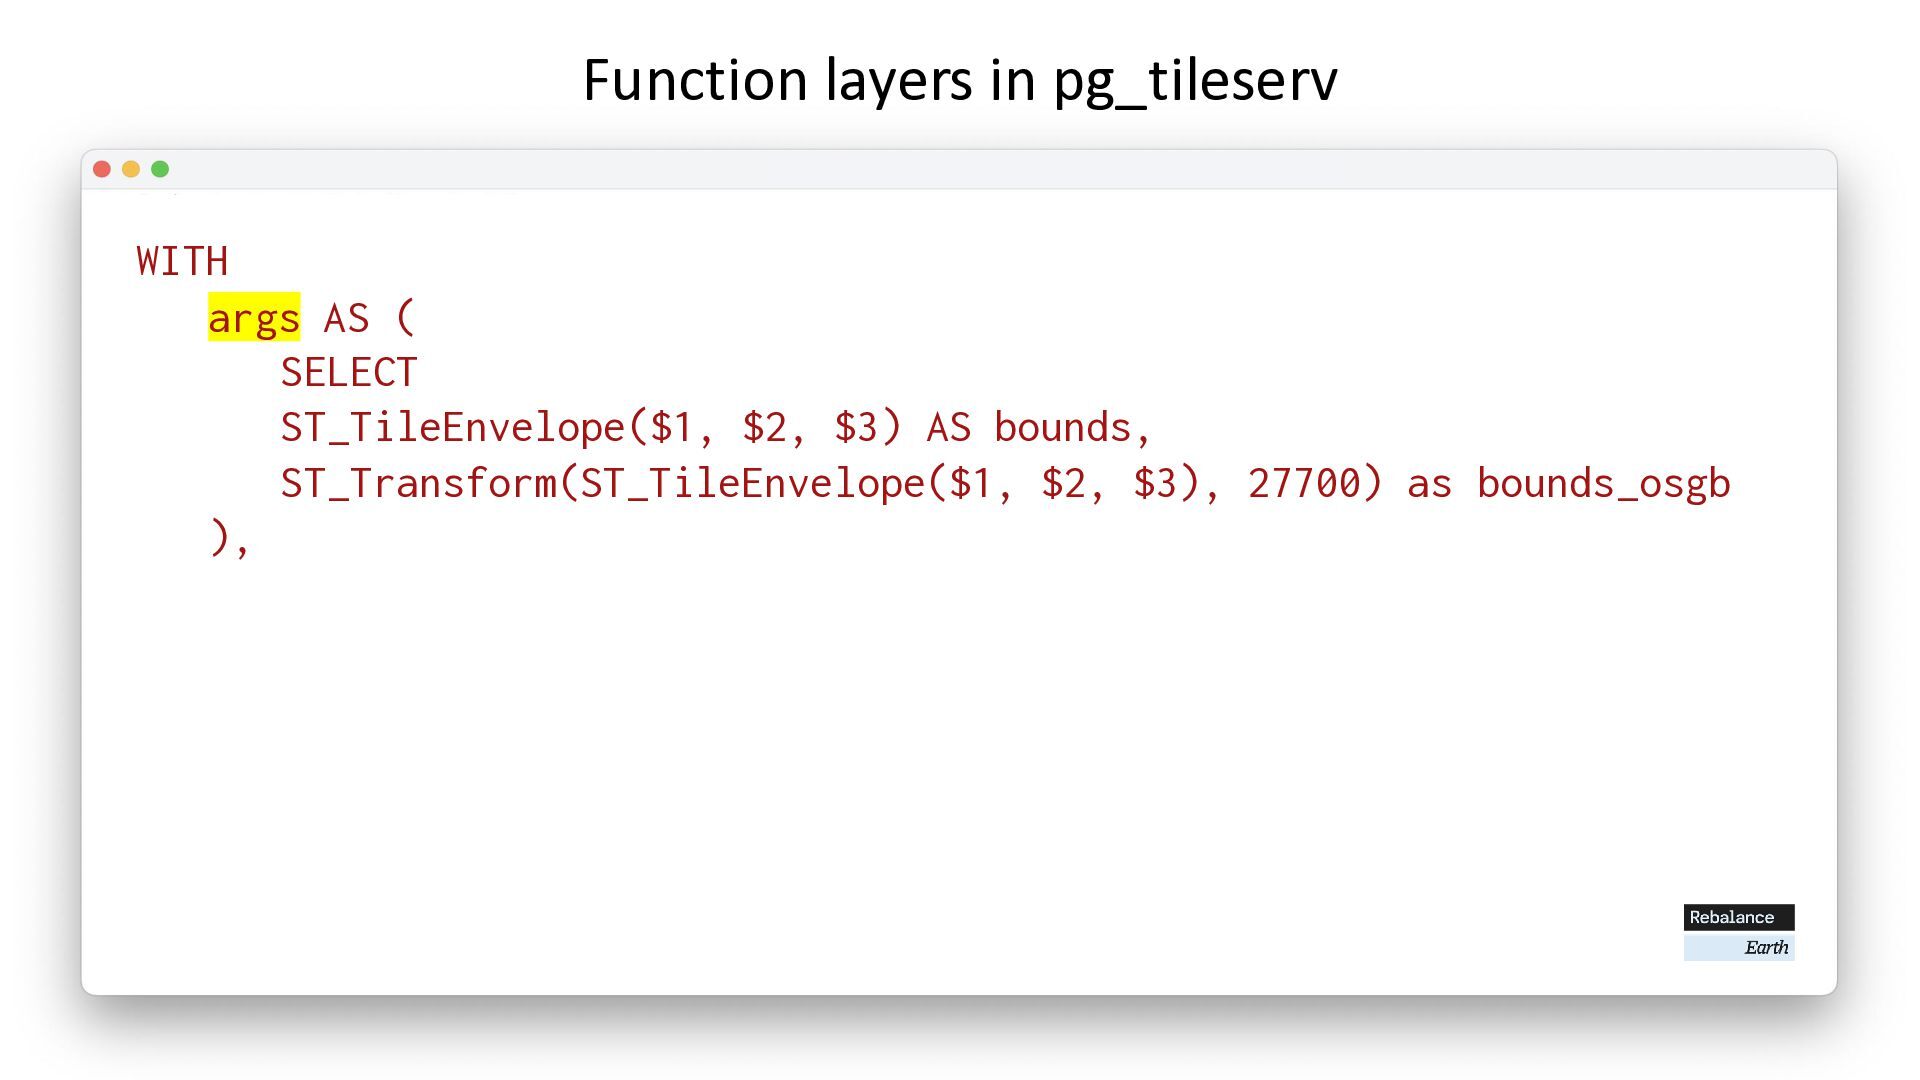
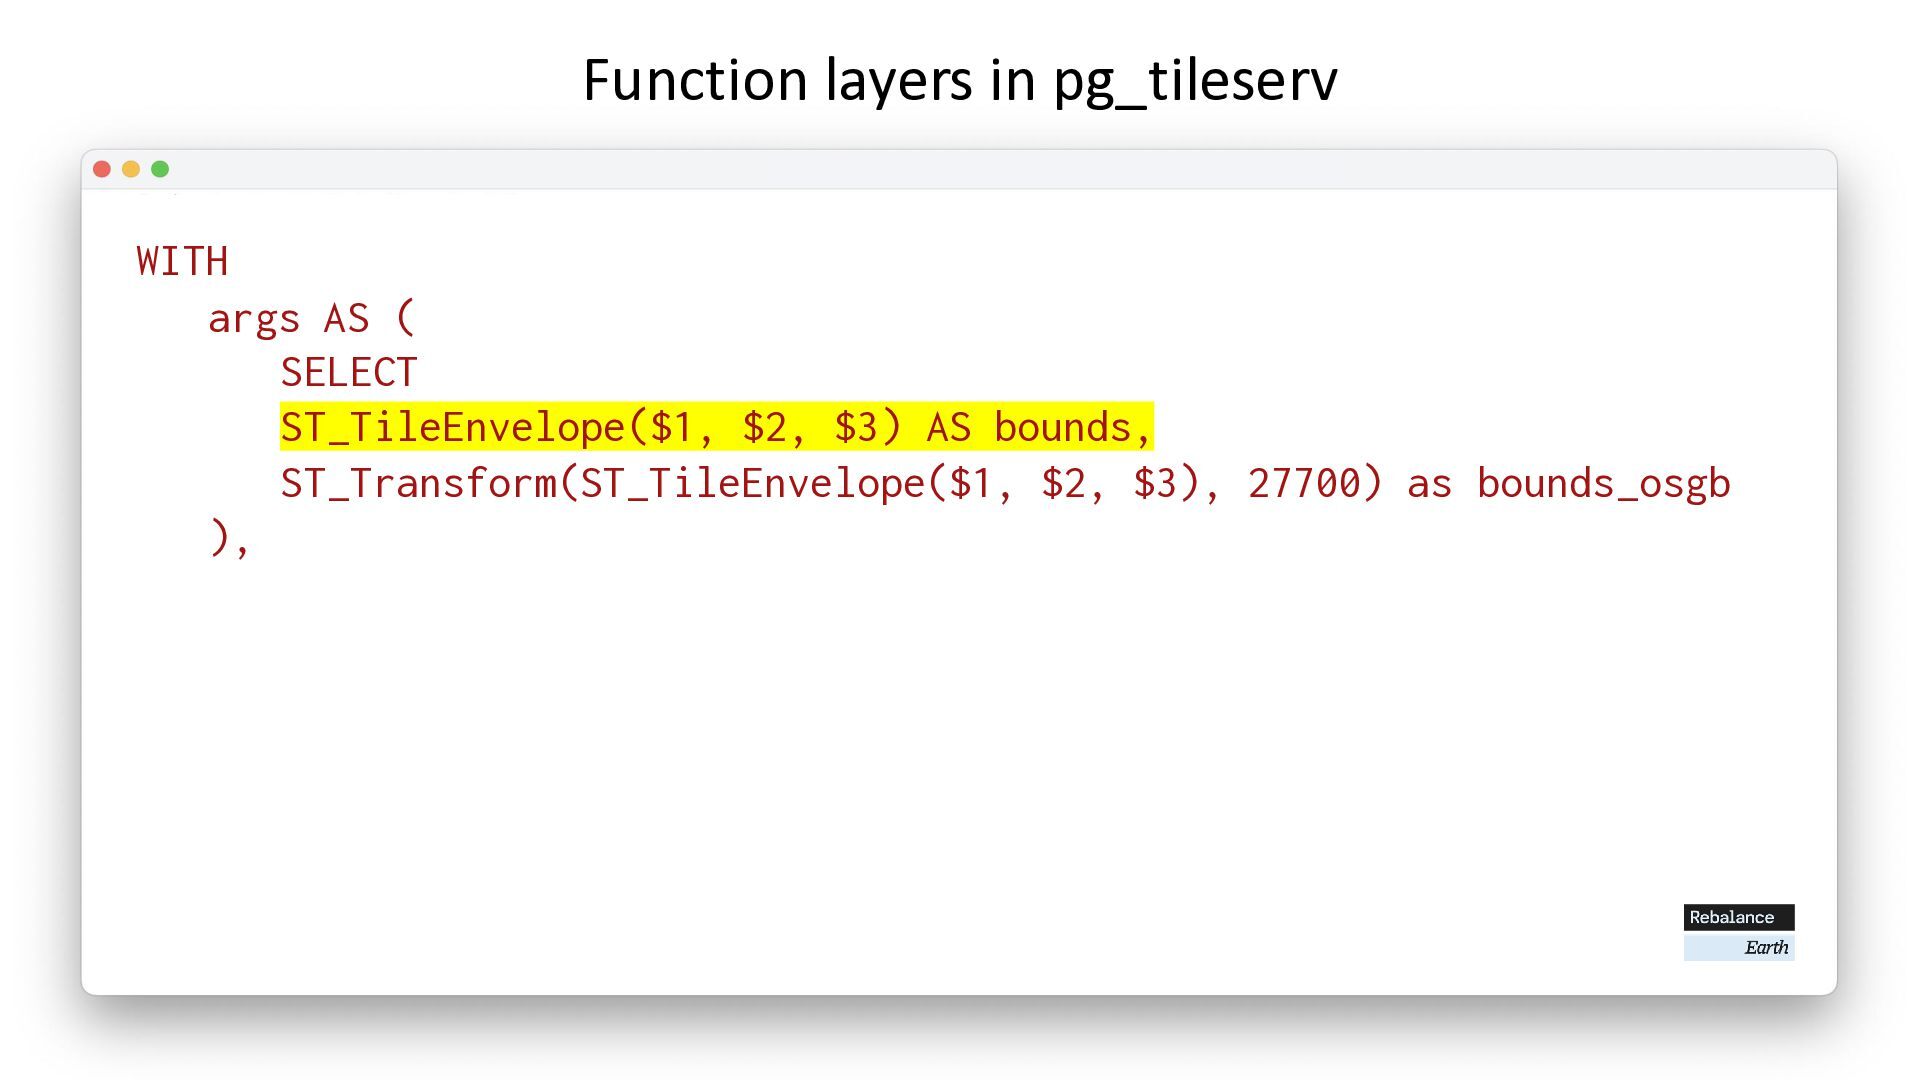
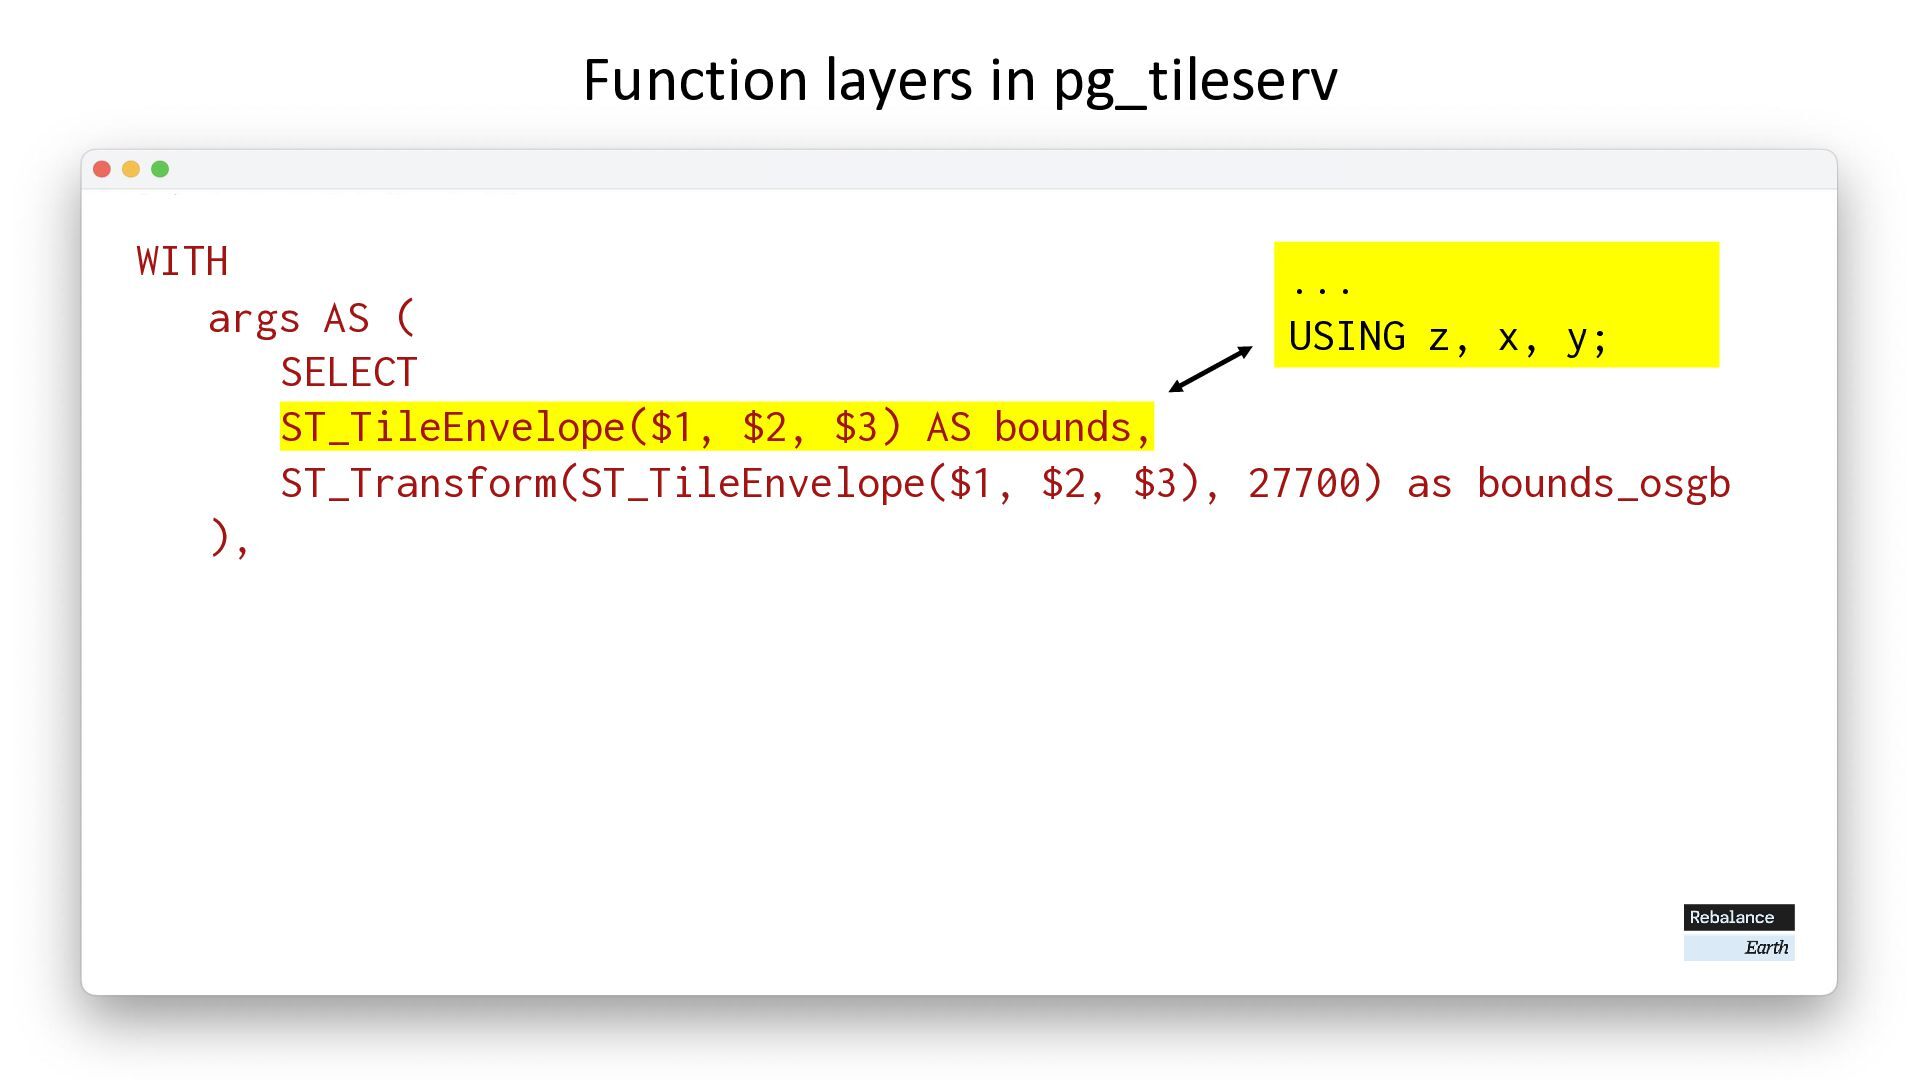
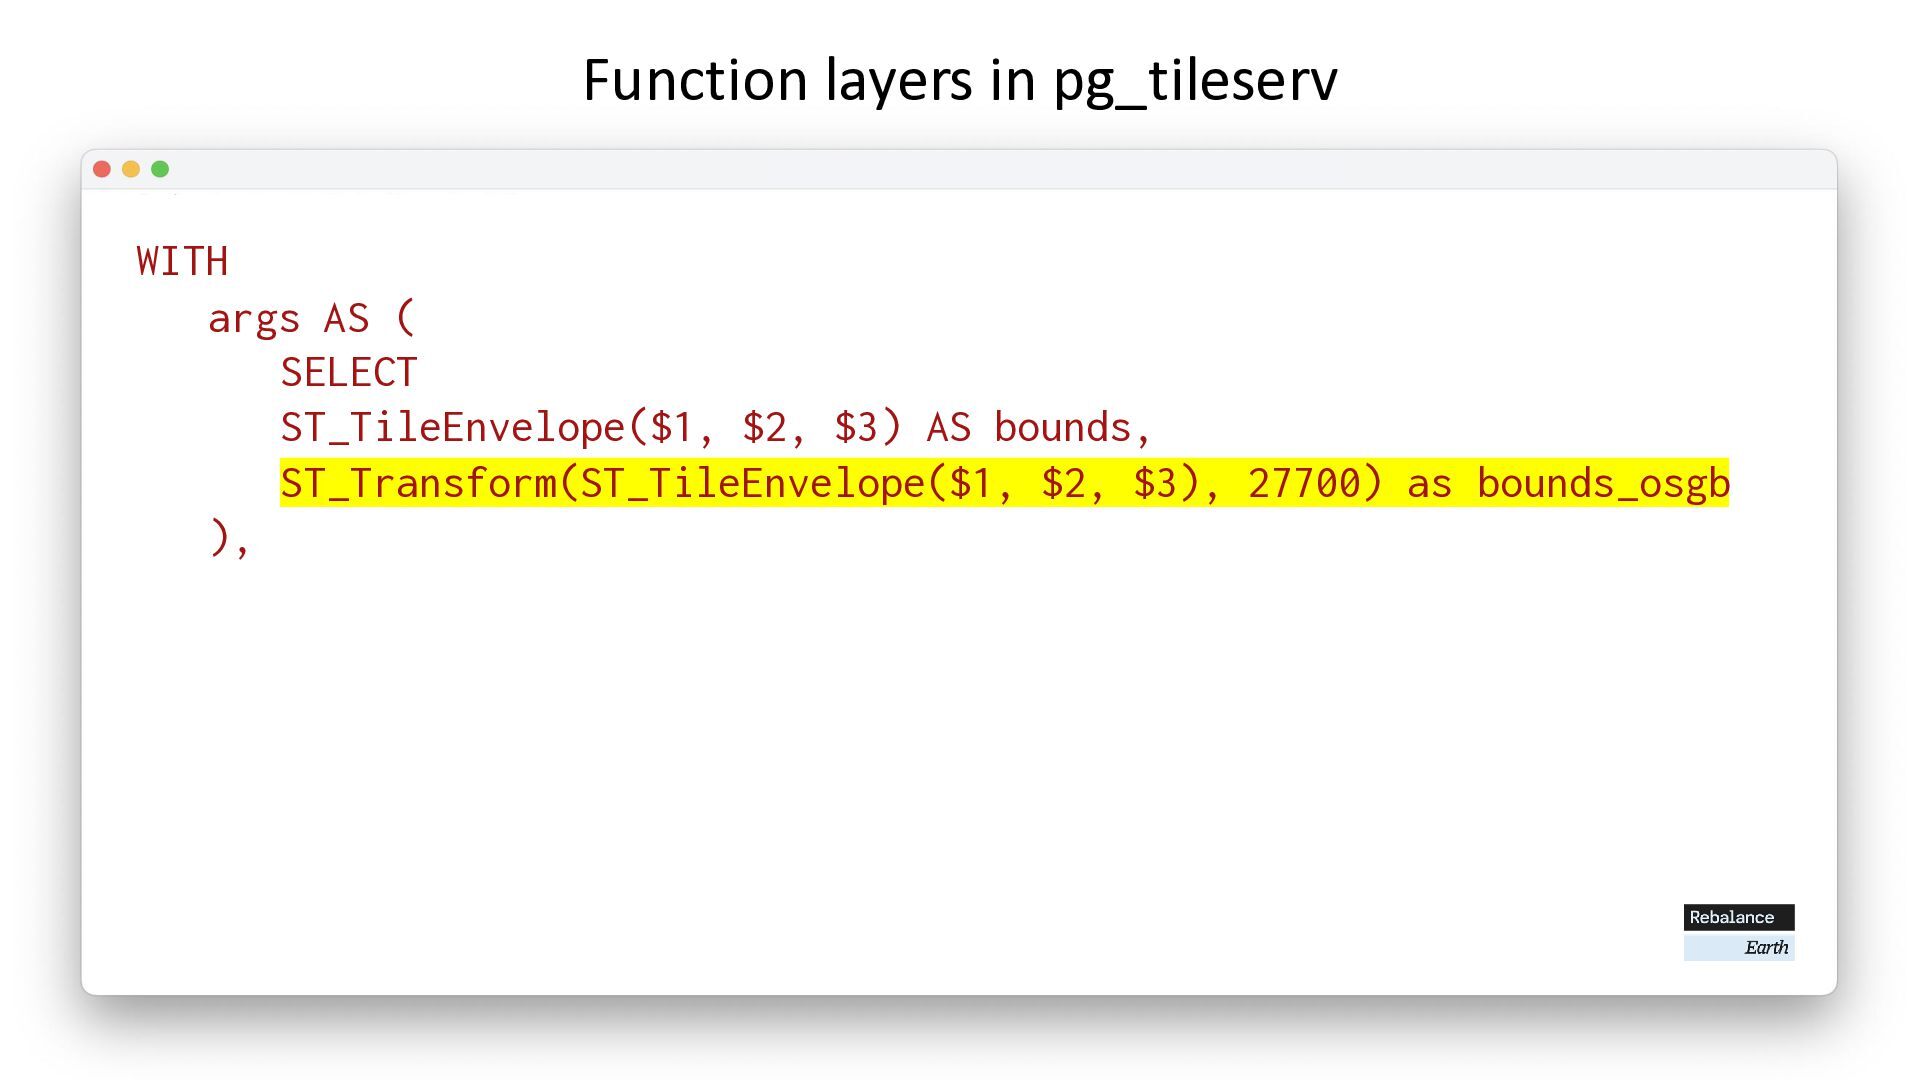
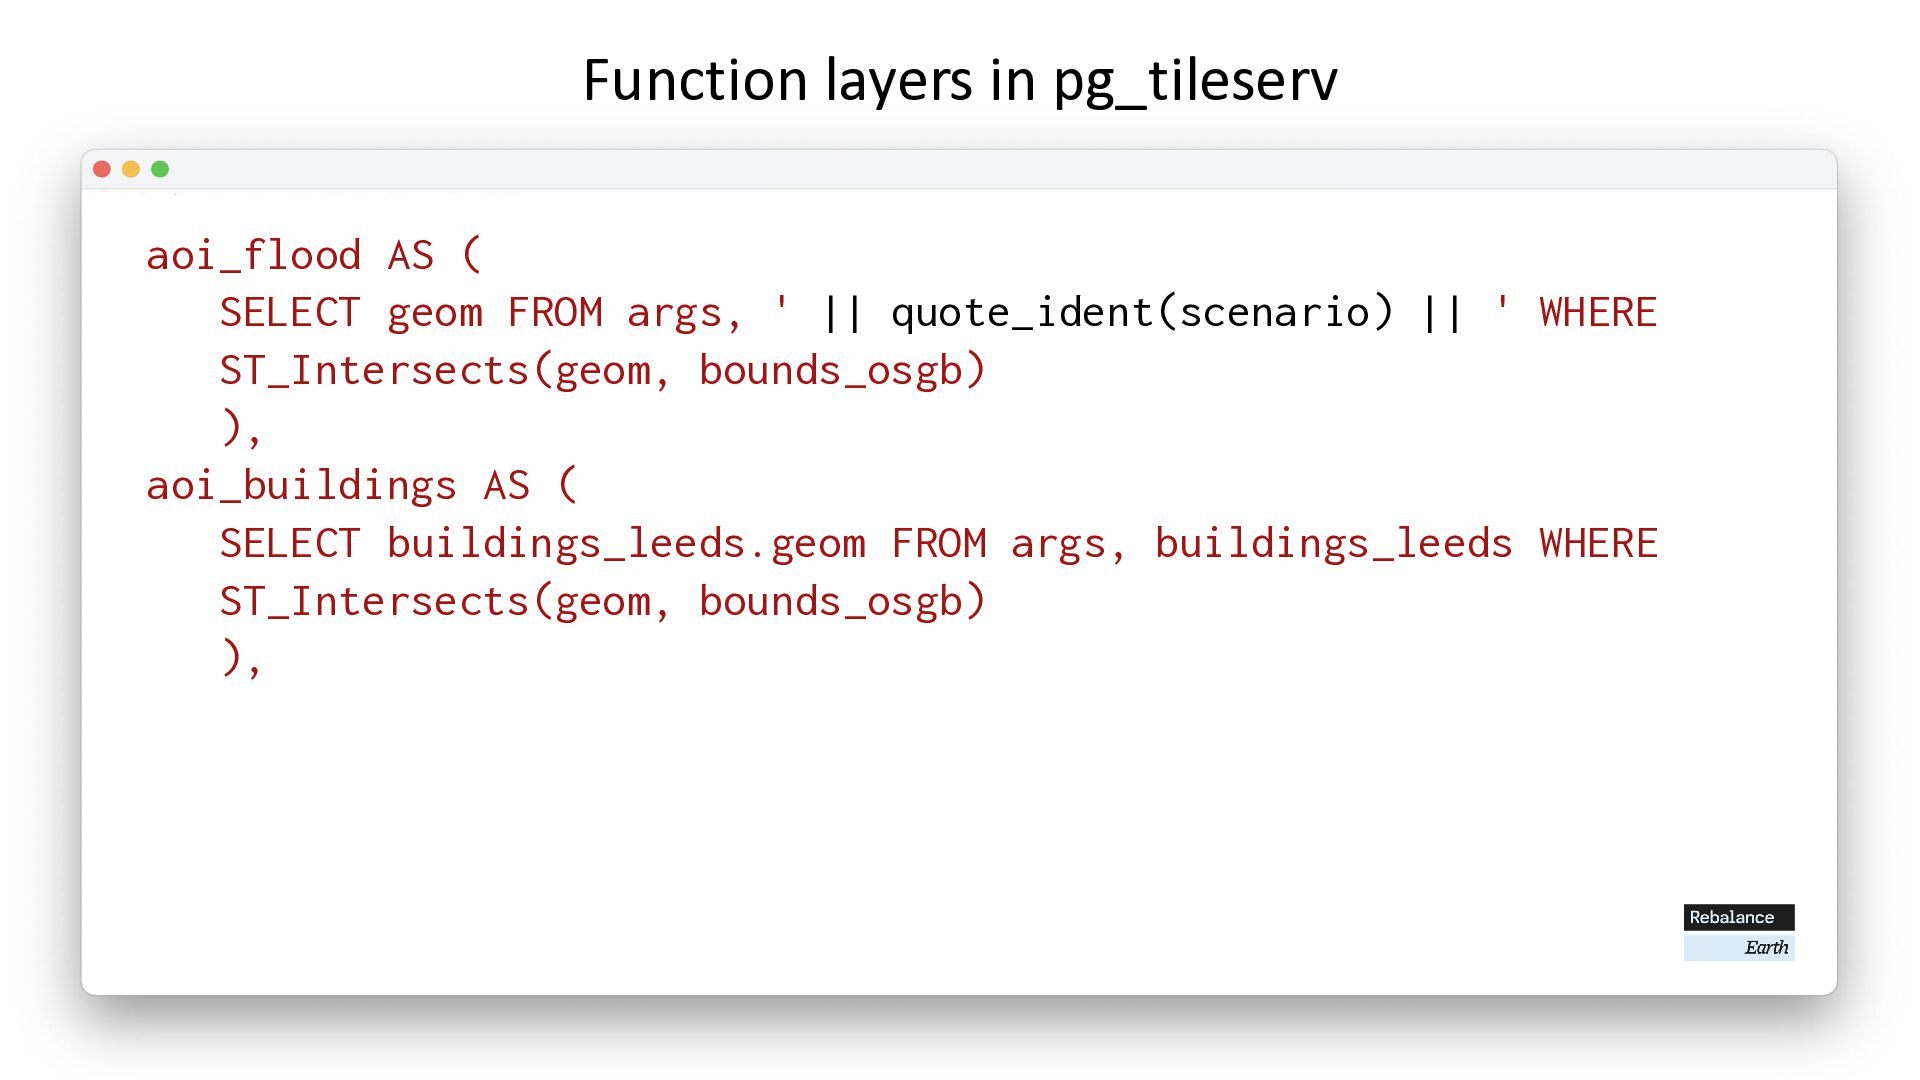
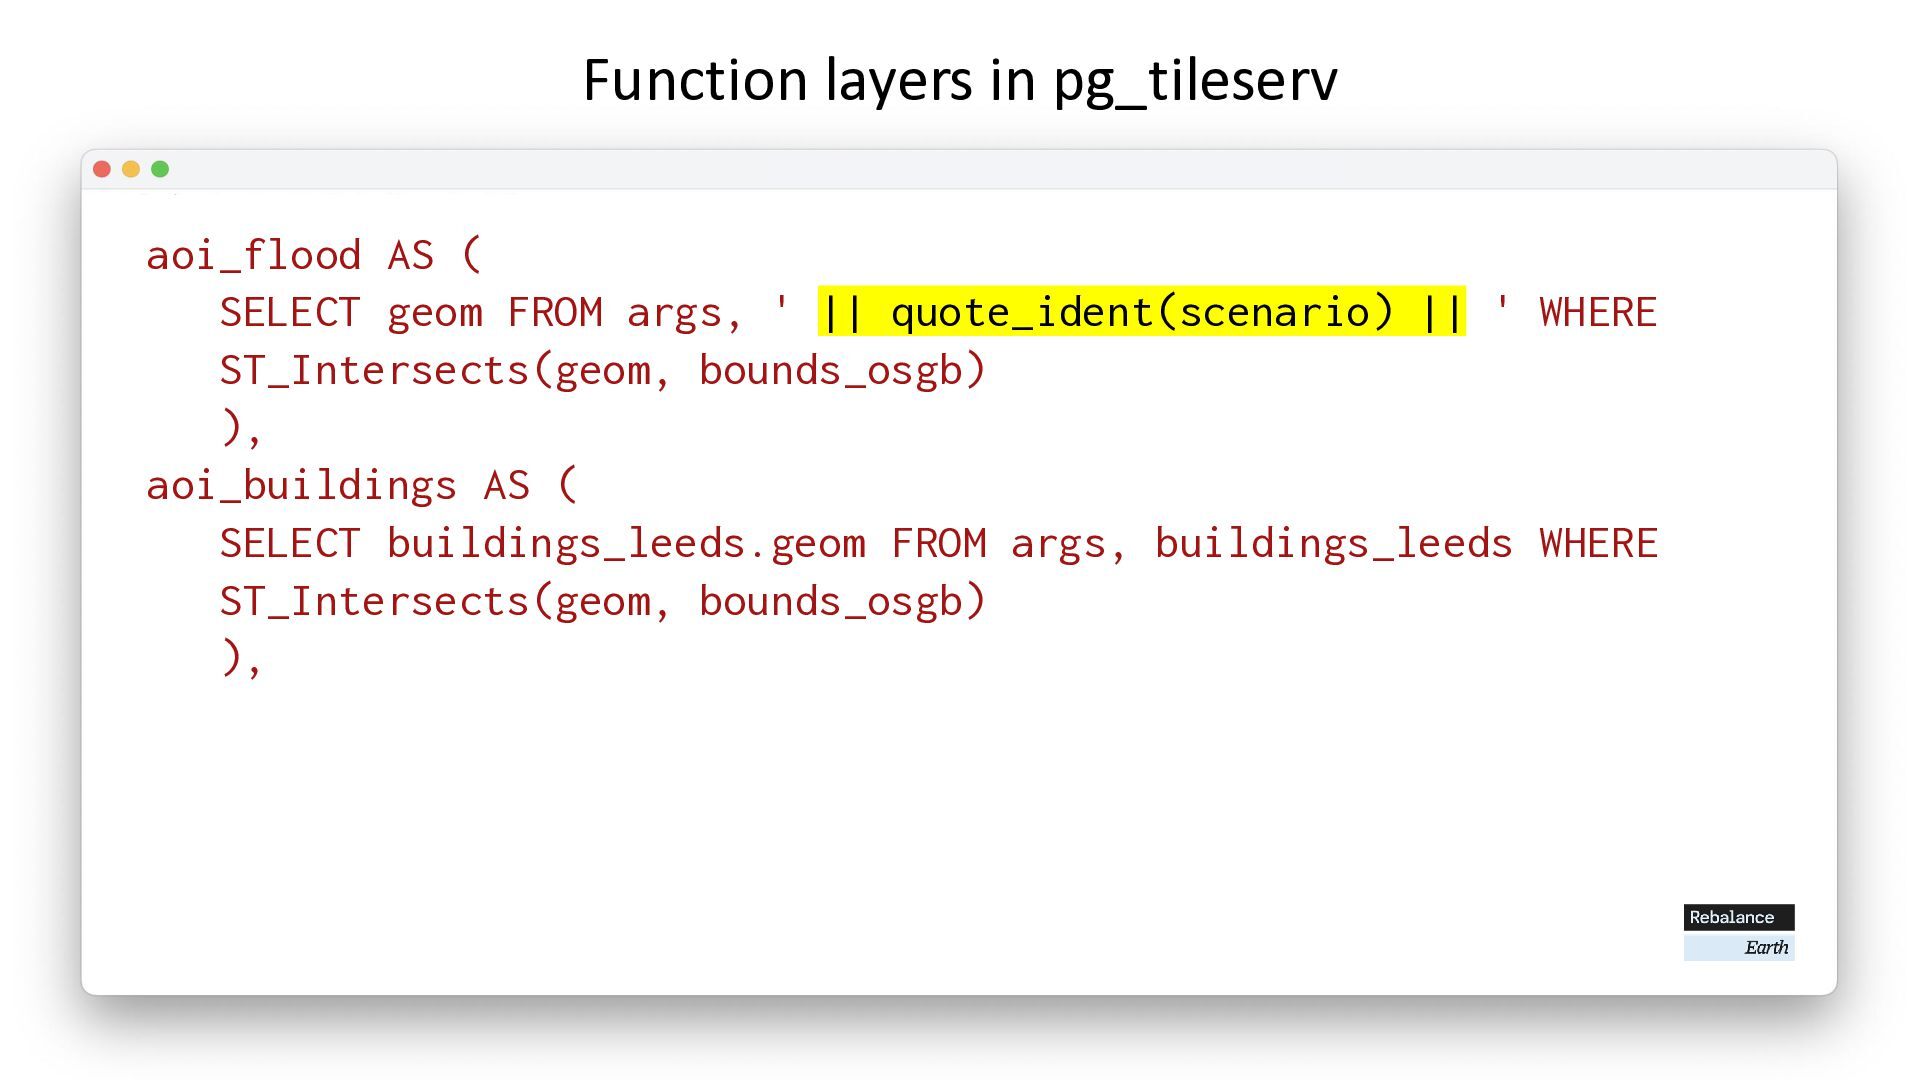
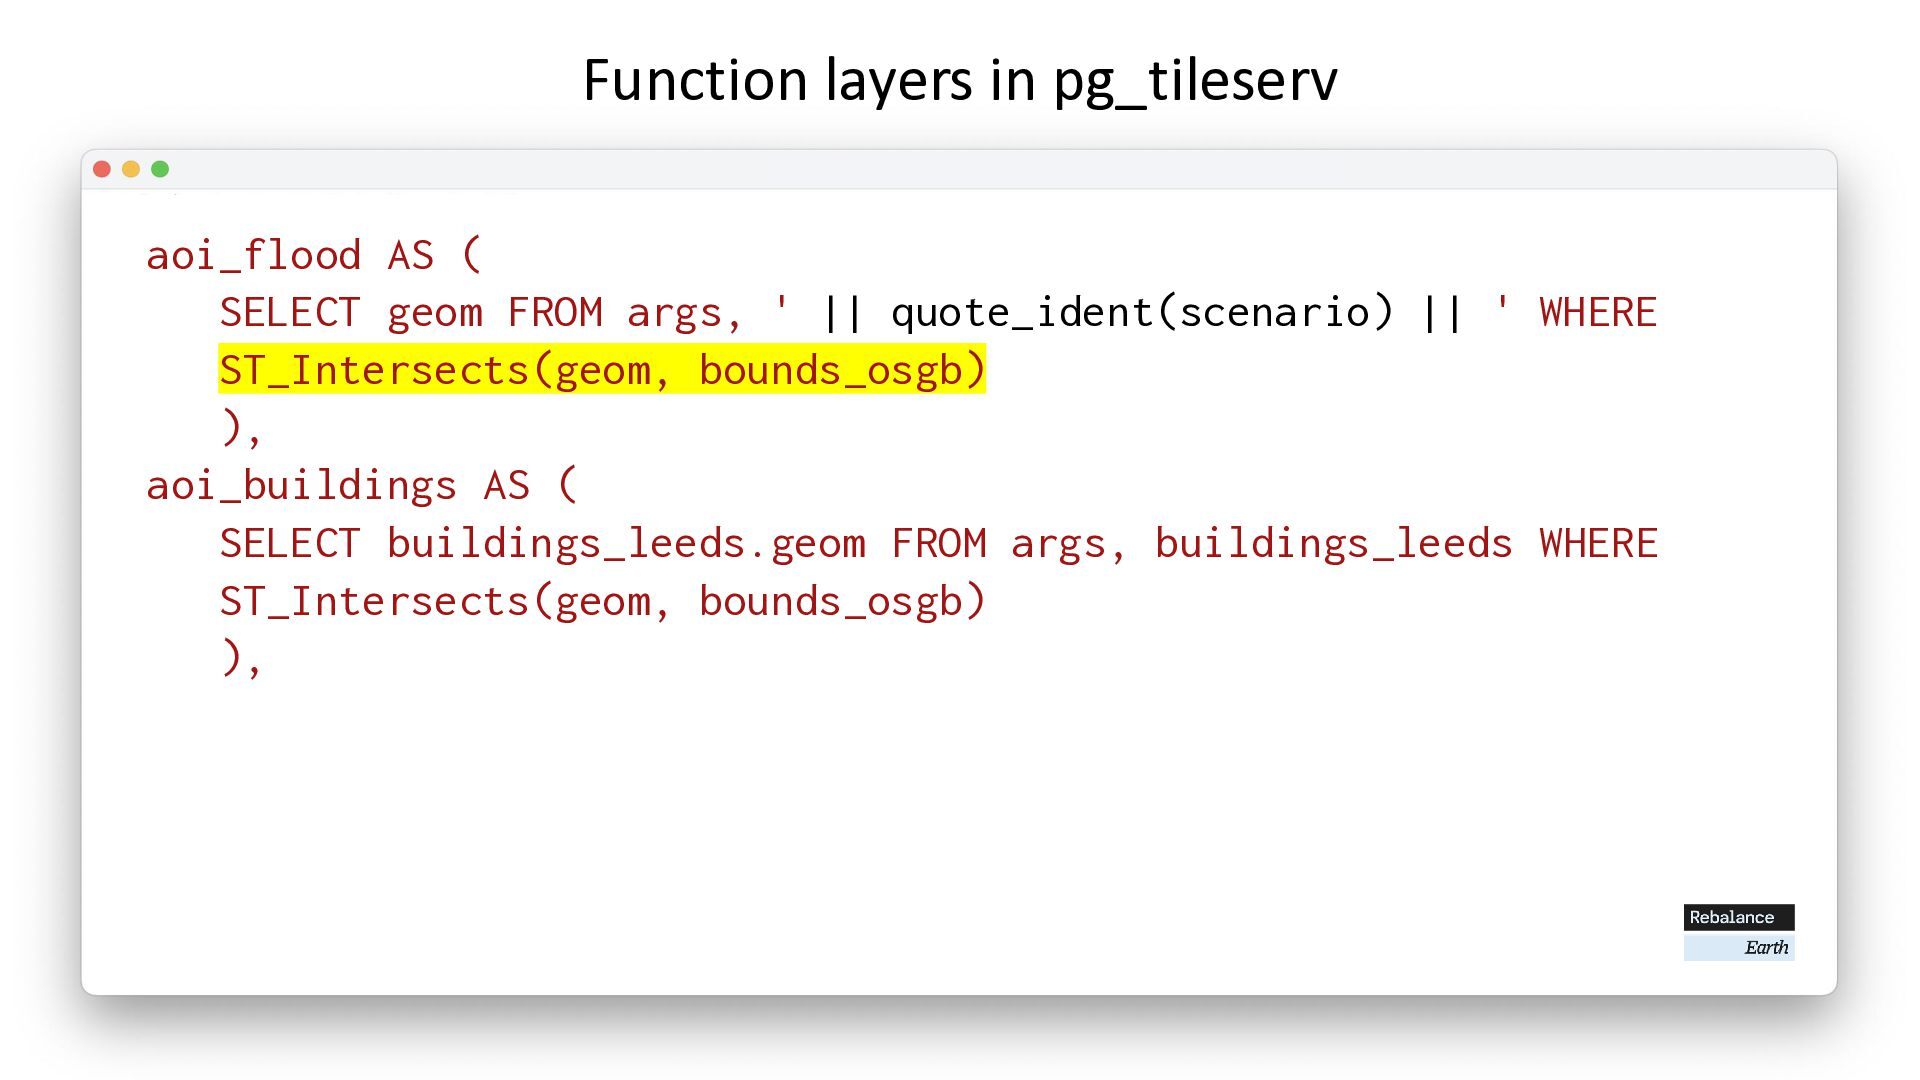
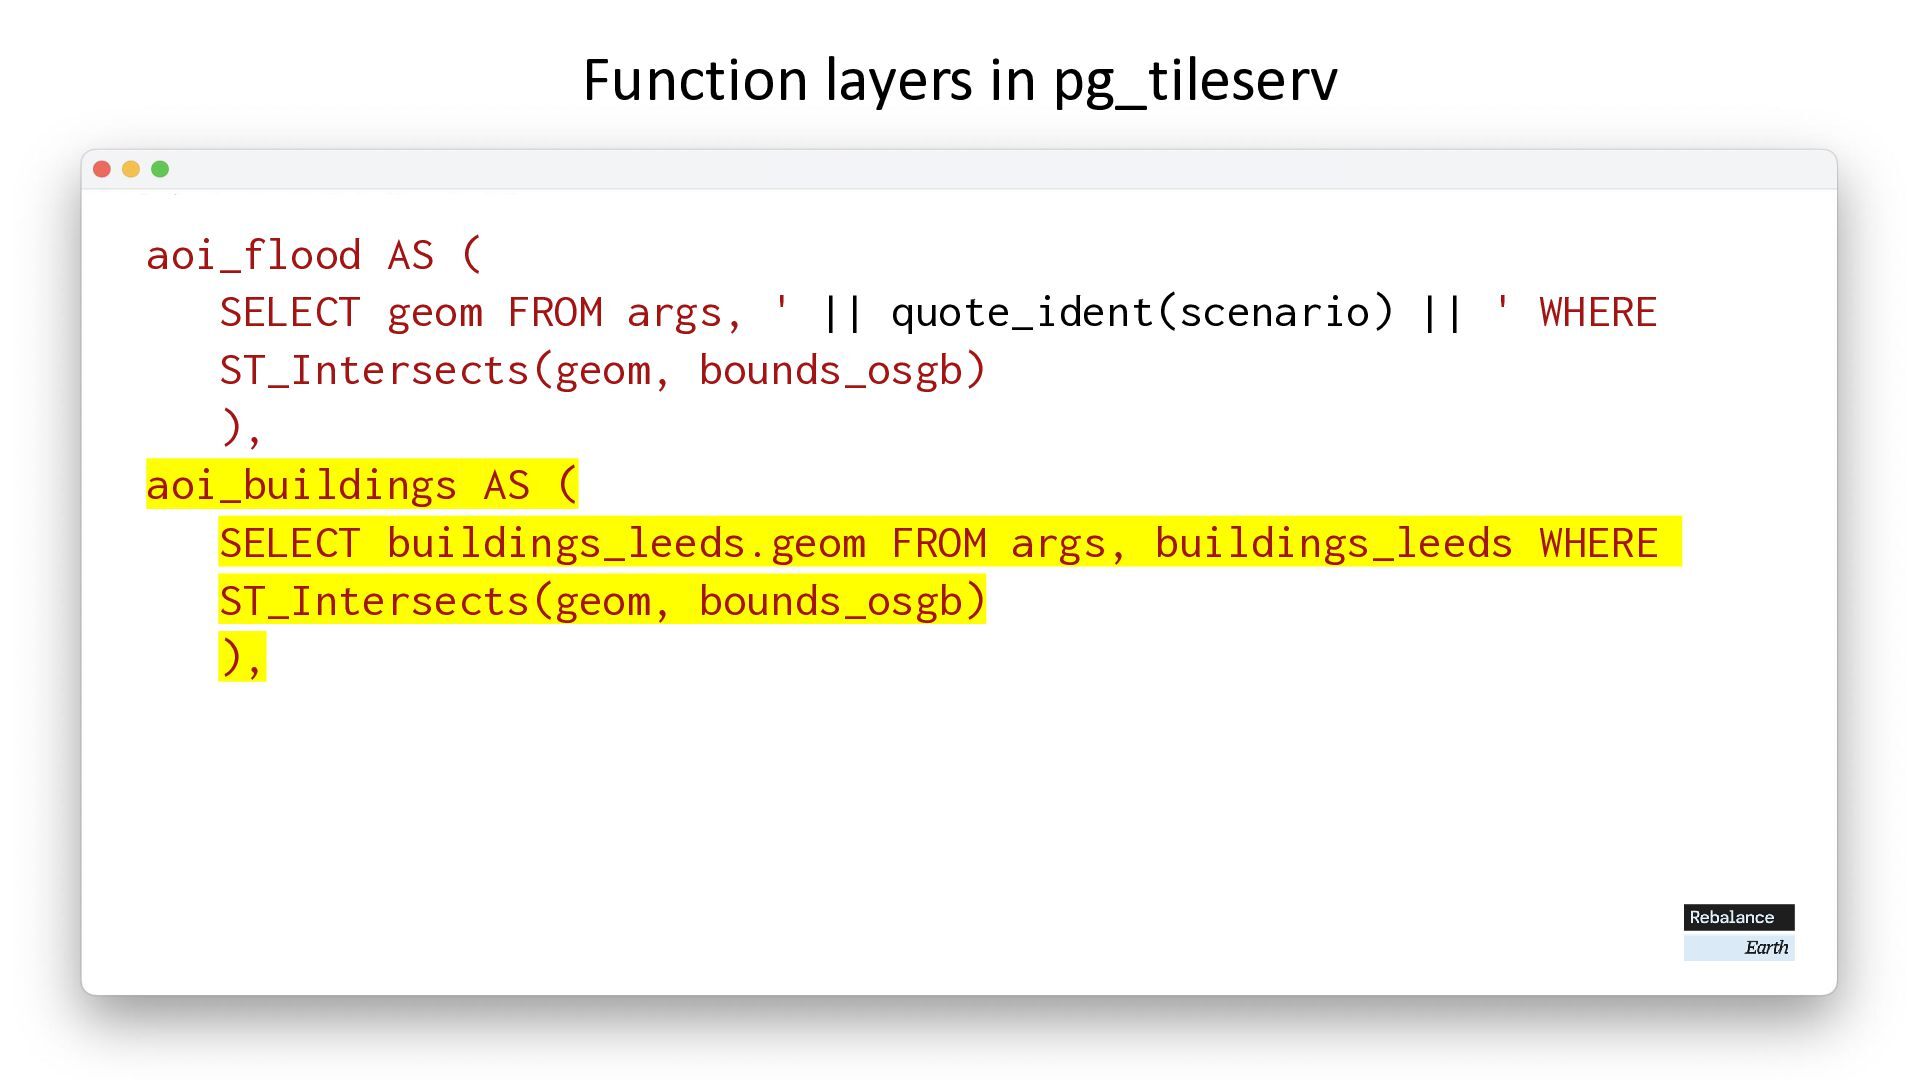
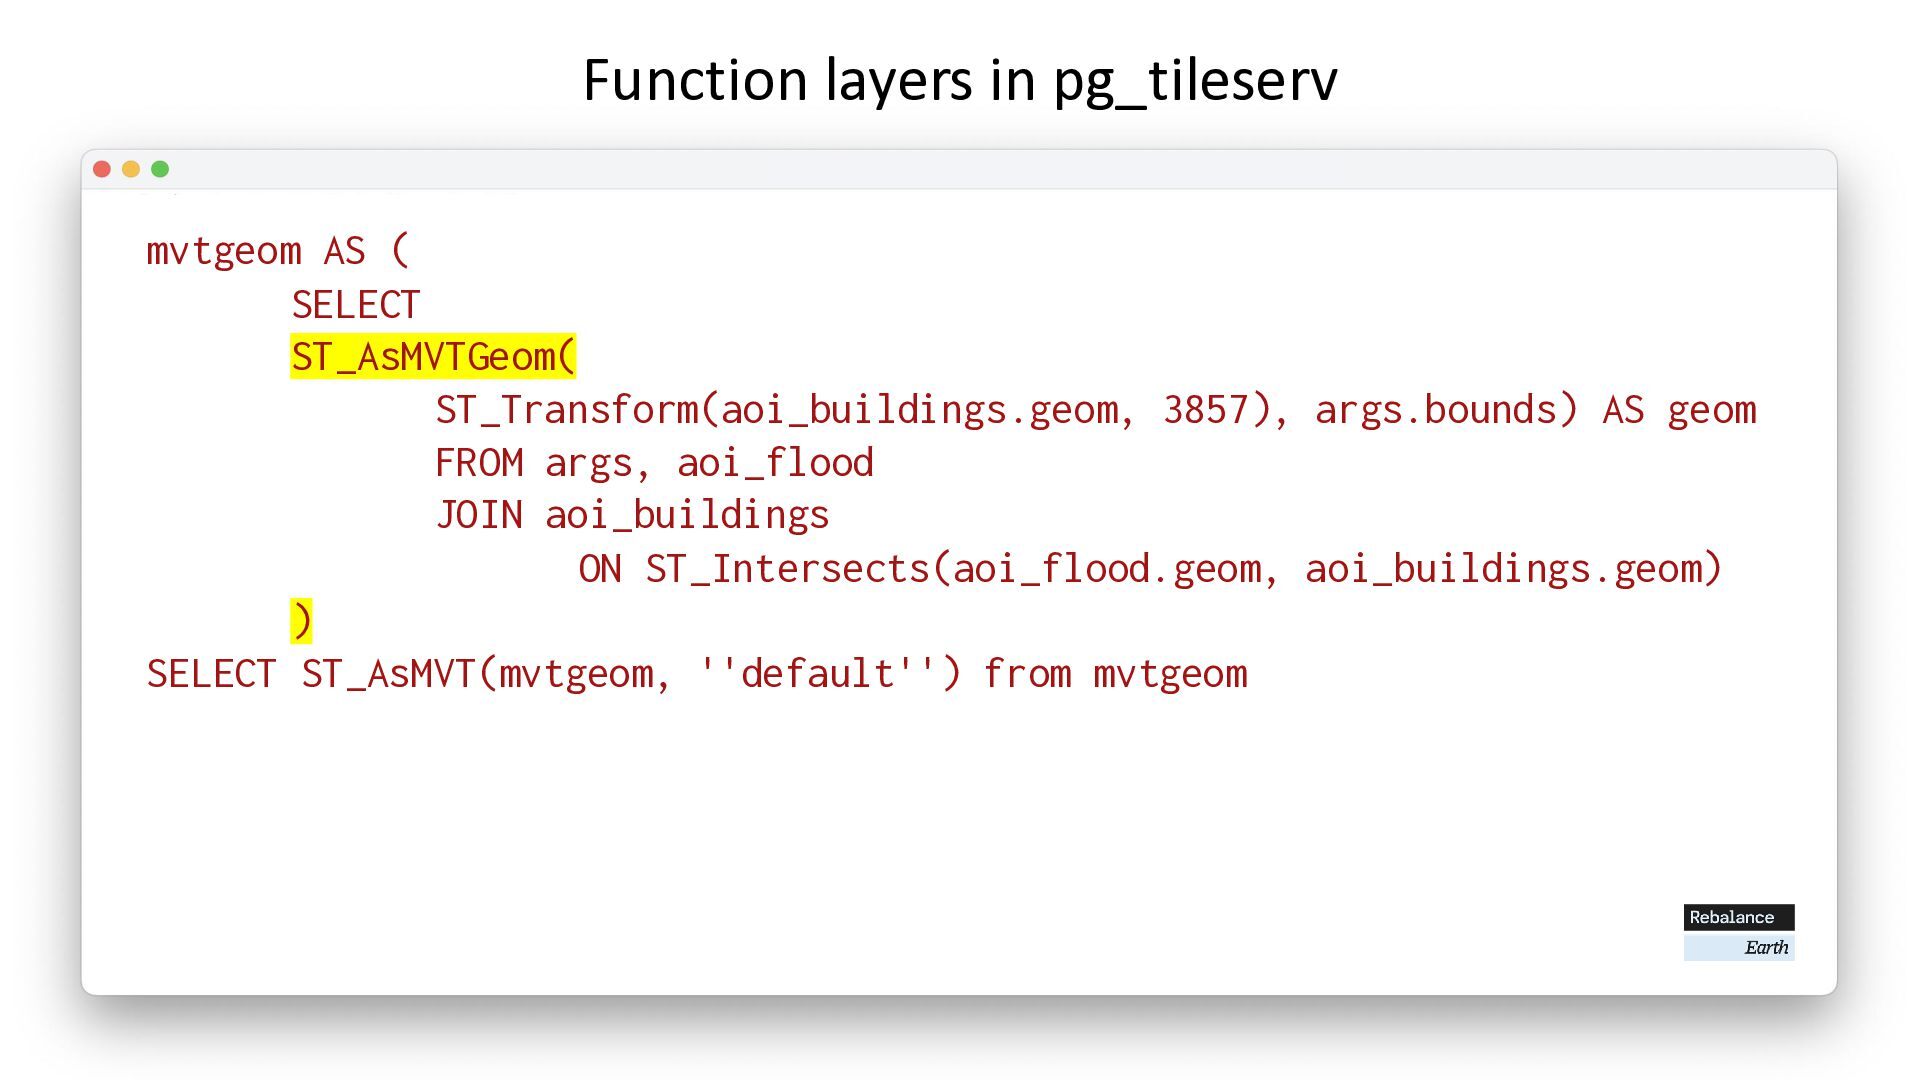
run a Postgres function that computes the data ‘on the fly’ → We need to define a function with specific parameters and returns MVT data from the function Function layers in pg_tileserv Bigger title
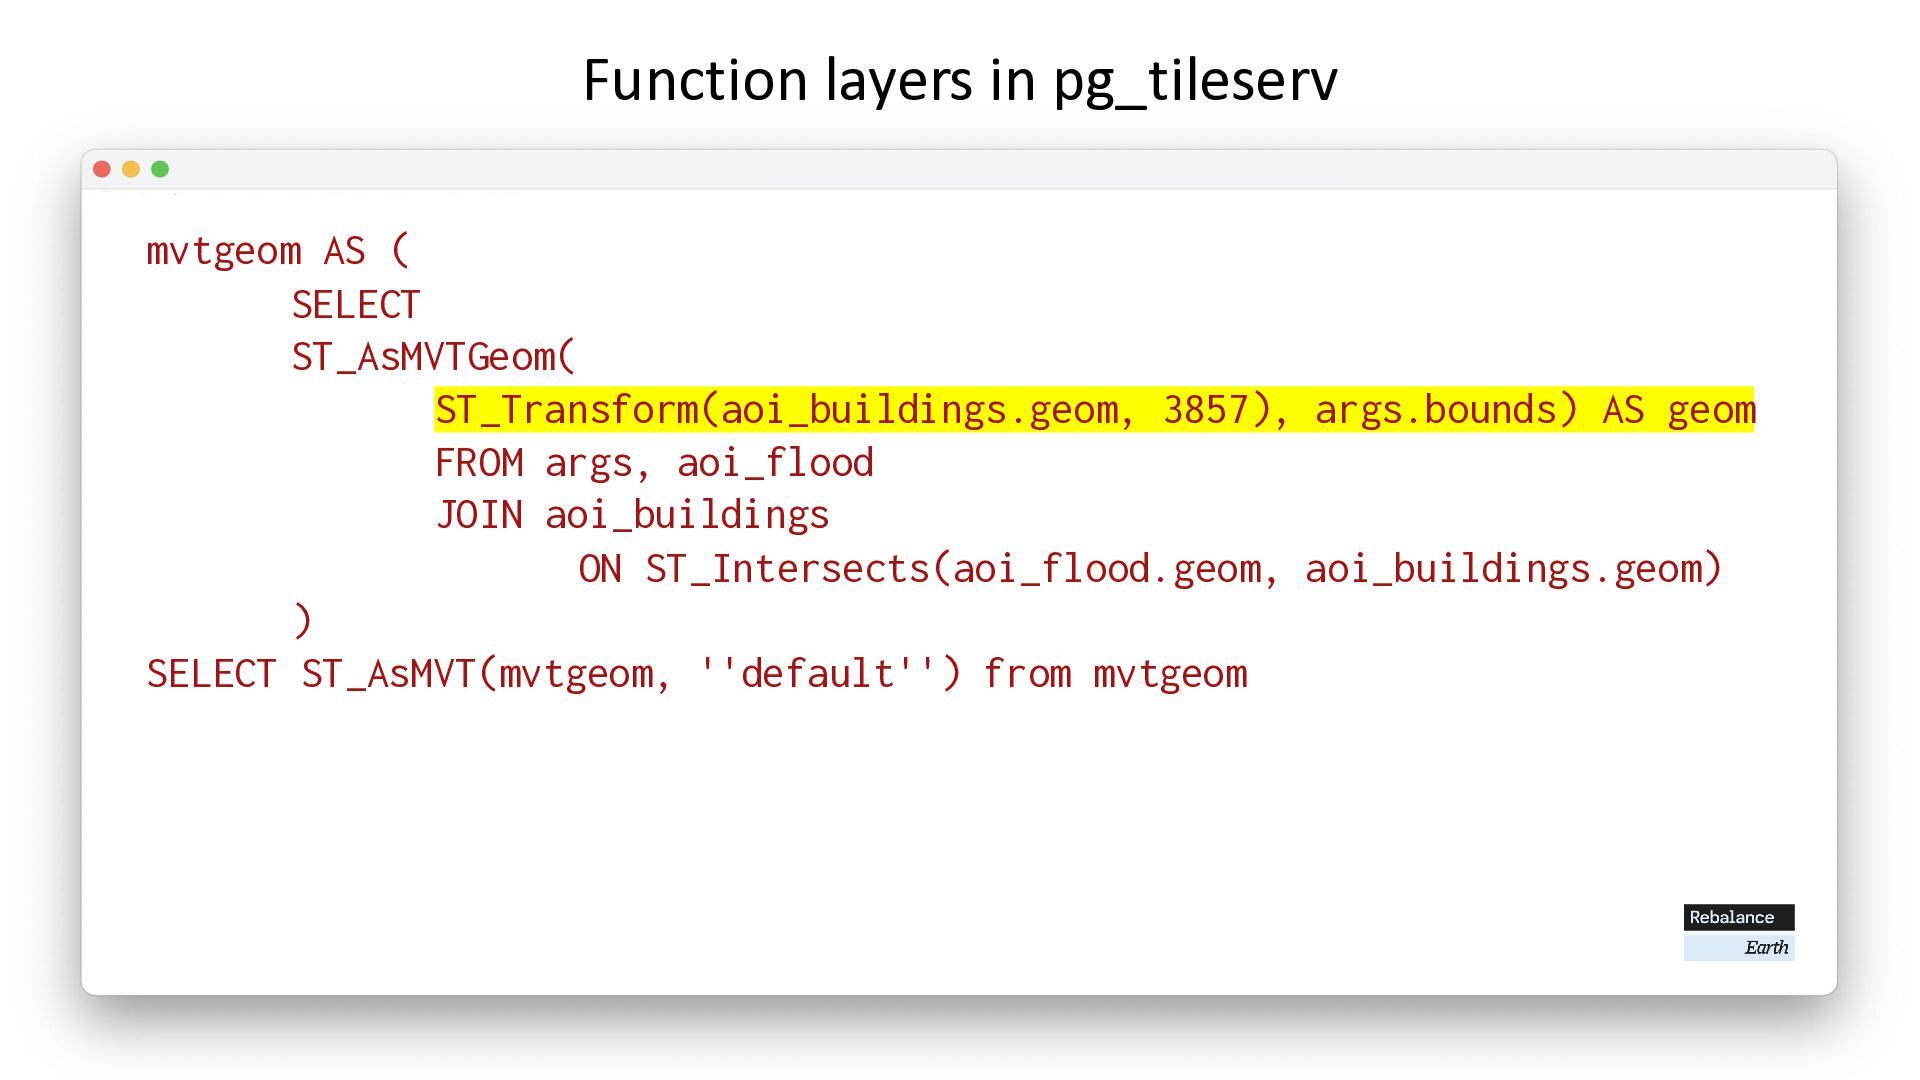
3857), args.bounds) AS geom FROM args, aoi_flood JOIN aoi_buildings ON ST_Intersects(aoi_flood.geom, aoi_buildings.geom) ) SELECT ST_AsMVT(mvtgeom, ''default'') from mvtgeom
3857), args.bounds) AS geom FROM args, aoi_flood JOIN aoi_buildings ON ST_Intersects(aoi_flood.geom, aoi_buildings.geom) ) SELECT ST_AsMVT(mvtgeom, ''default'') from mvtgeom
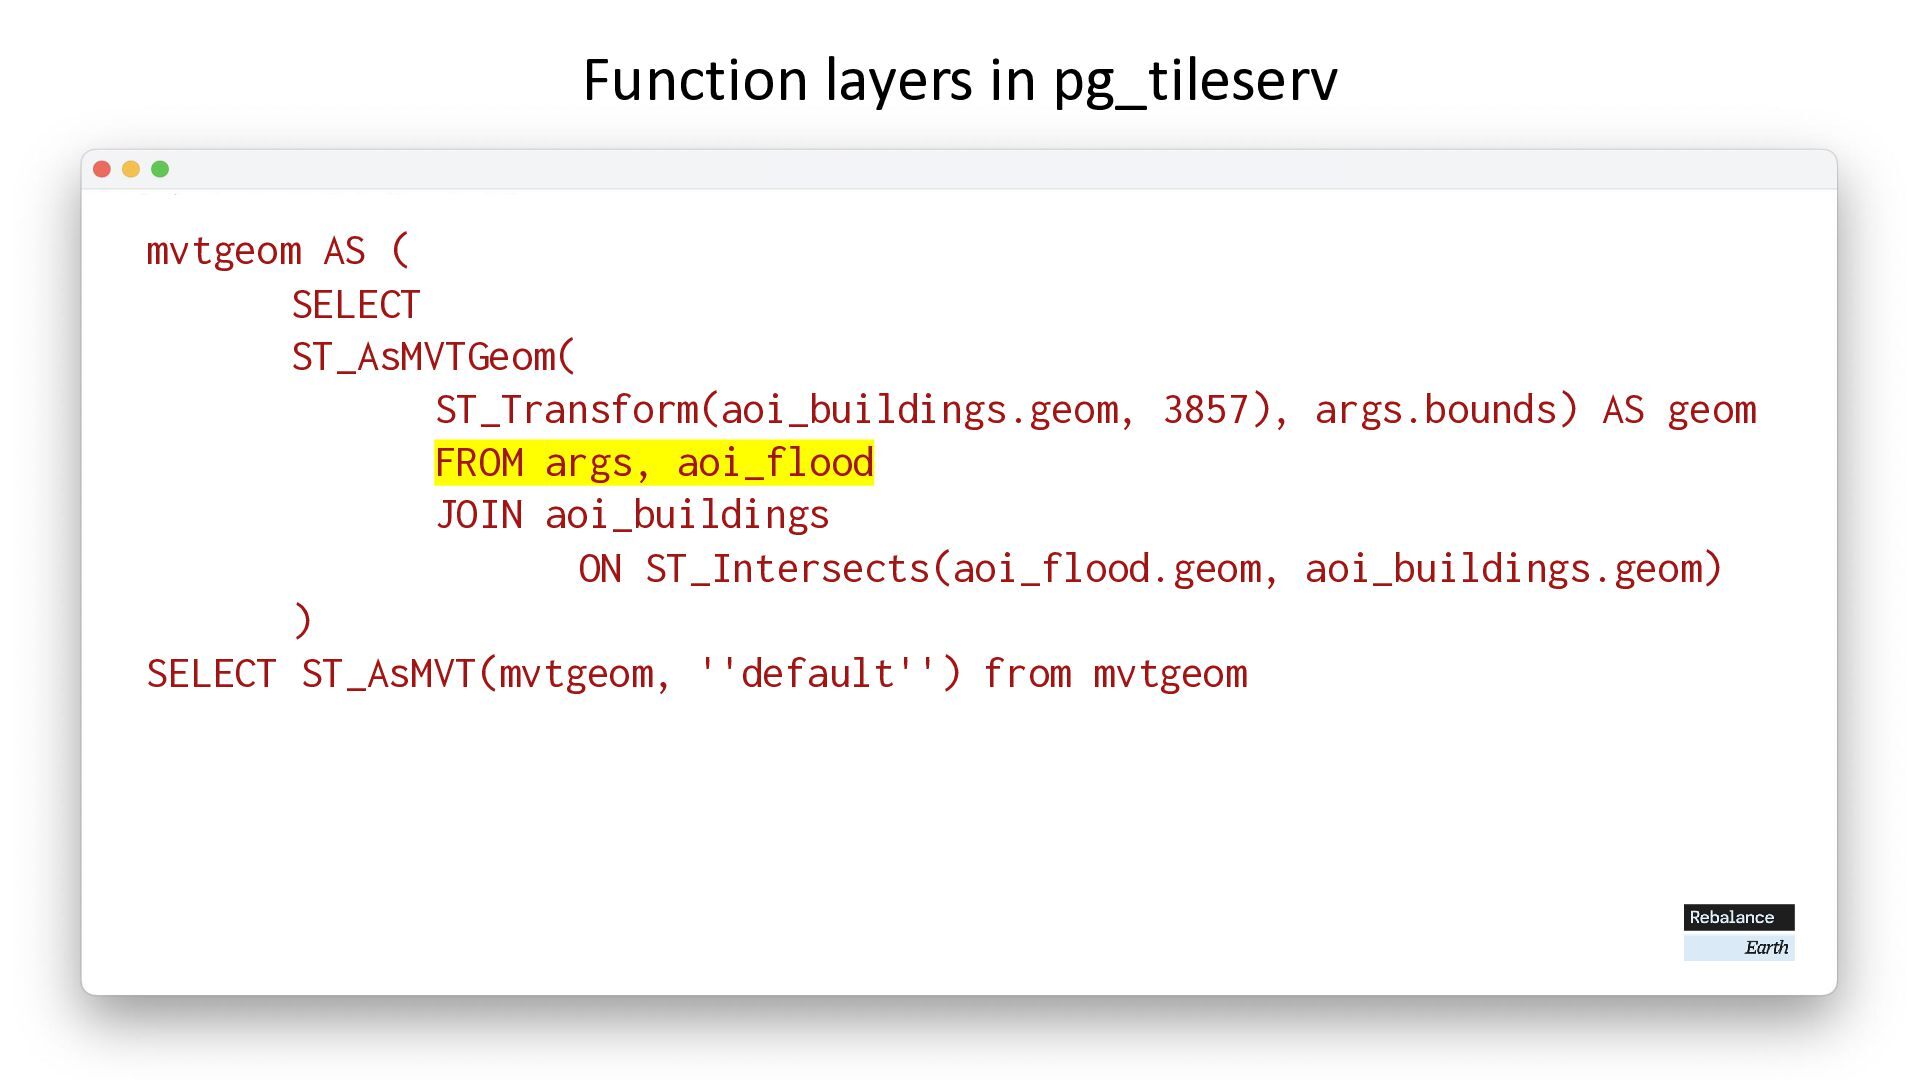
3857), args.bounds) AS geom FROM args, aoi_flood JOIN aoi_buildings ON ST_Intersects(aoi_flood.geom, aoi_buildings.geom) ) SELECT ST_AsMVT(mvtgeom, ''default'') from mvtgeom
3857), args.bounds) AS geom FROM args, aoi_flood JOIN aoi_buildings ON ST_Intersects(aoi_flood.geom, aoi_buildings.geom) ) SELECT ST_AsMVT(mvtgeom, ''default'') from mvtgeom
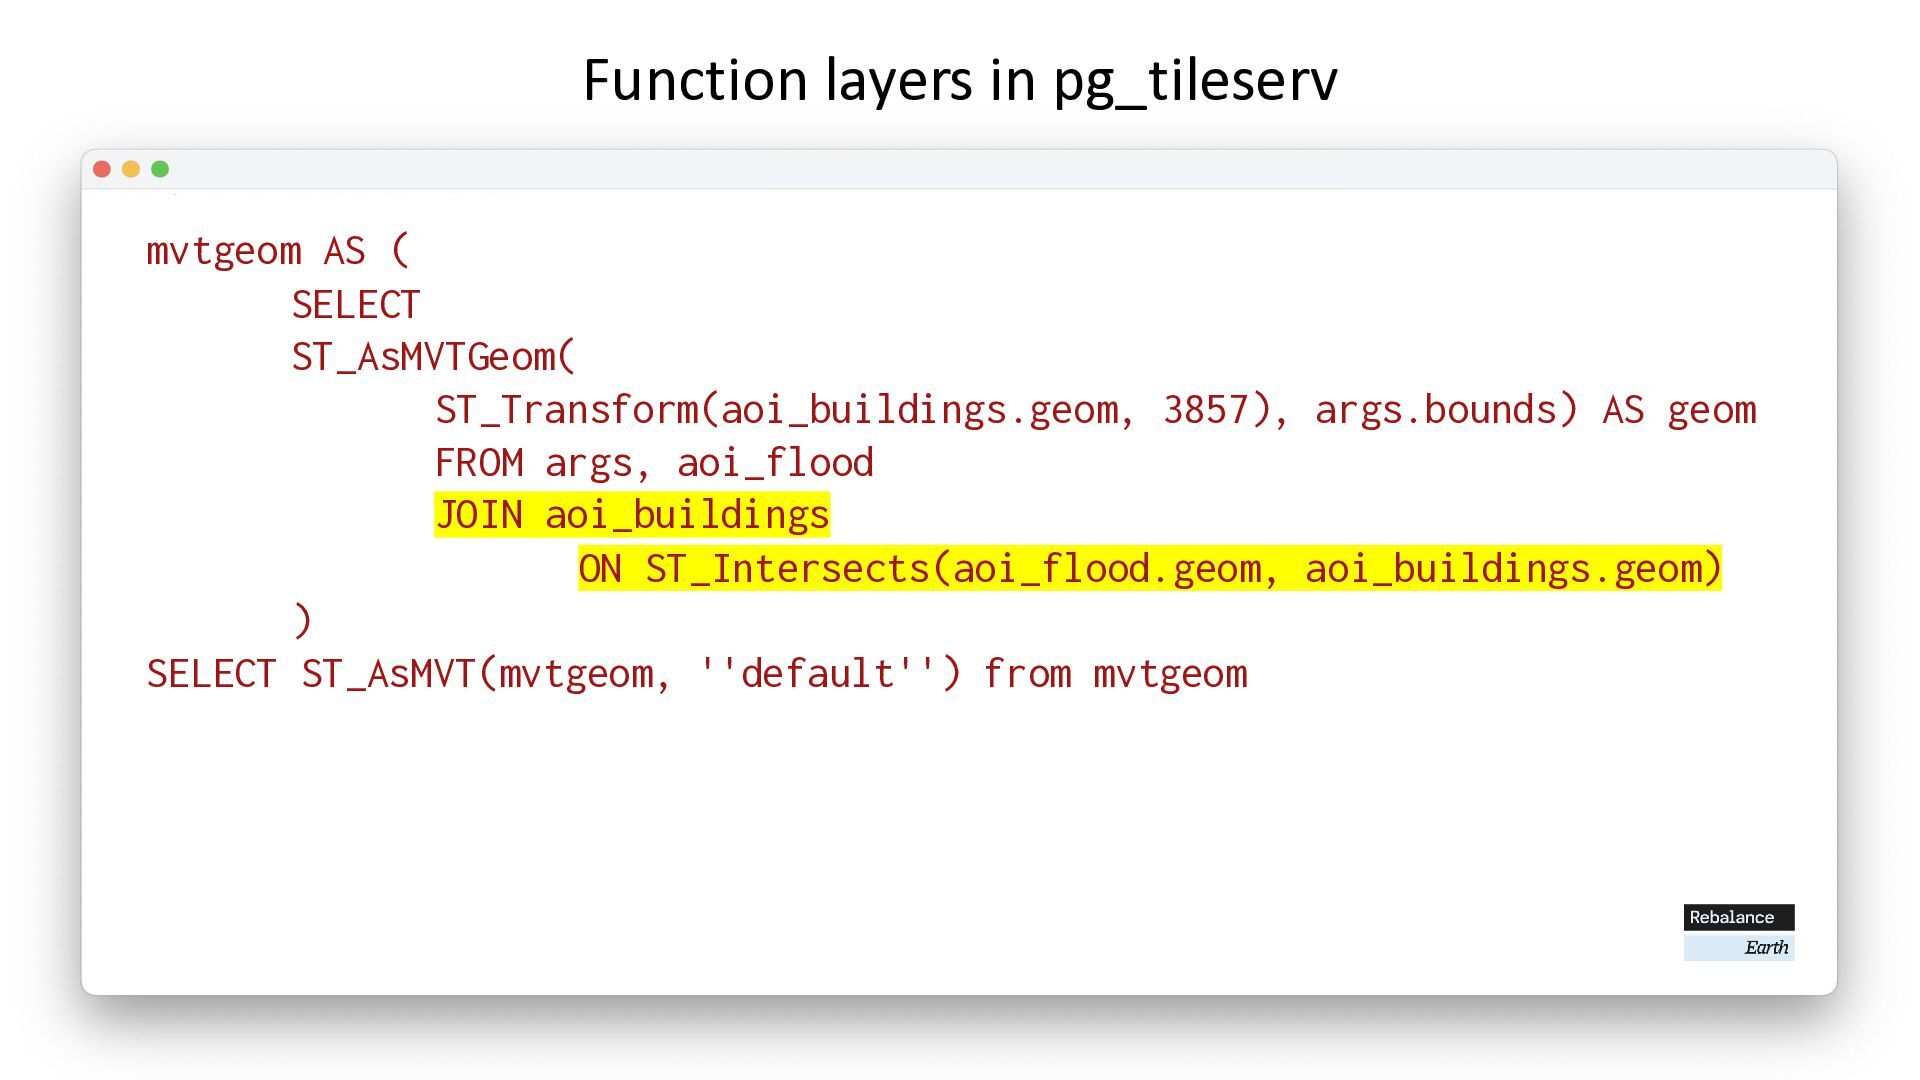
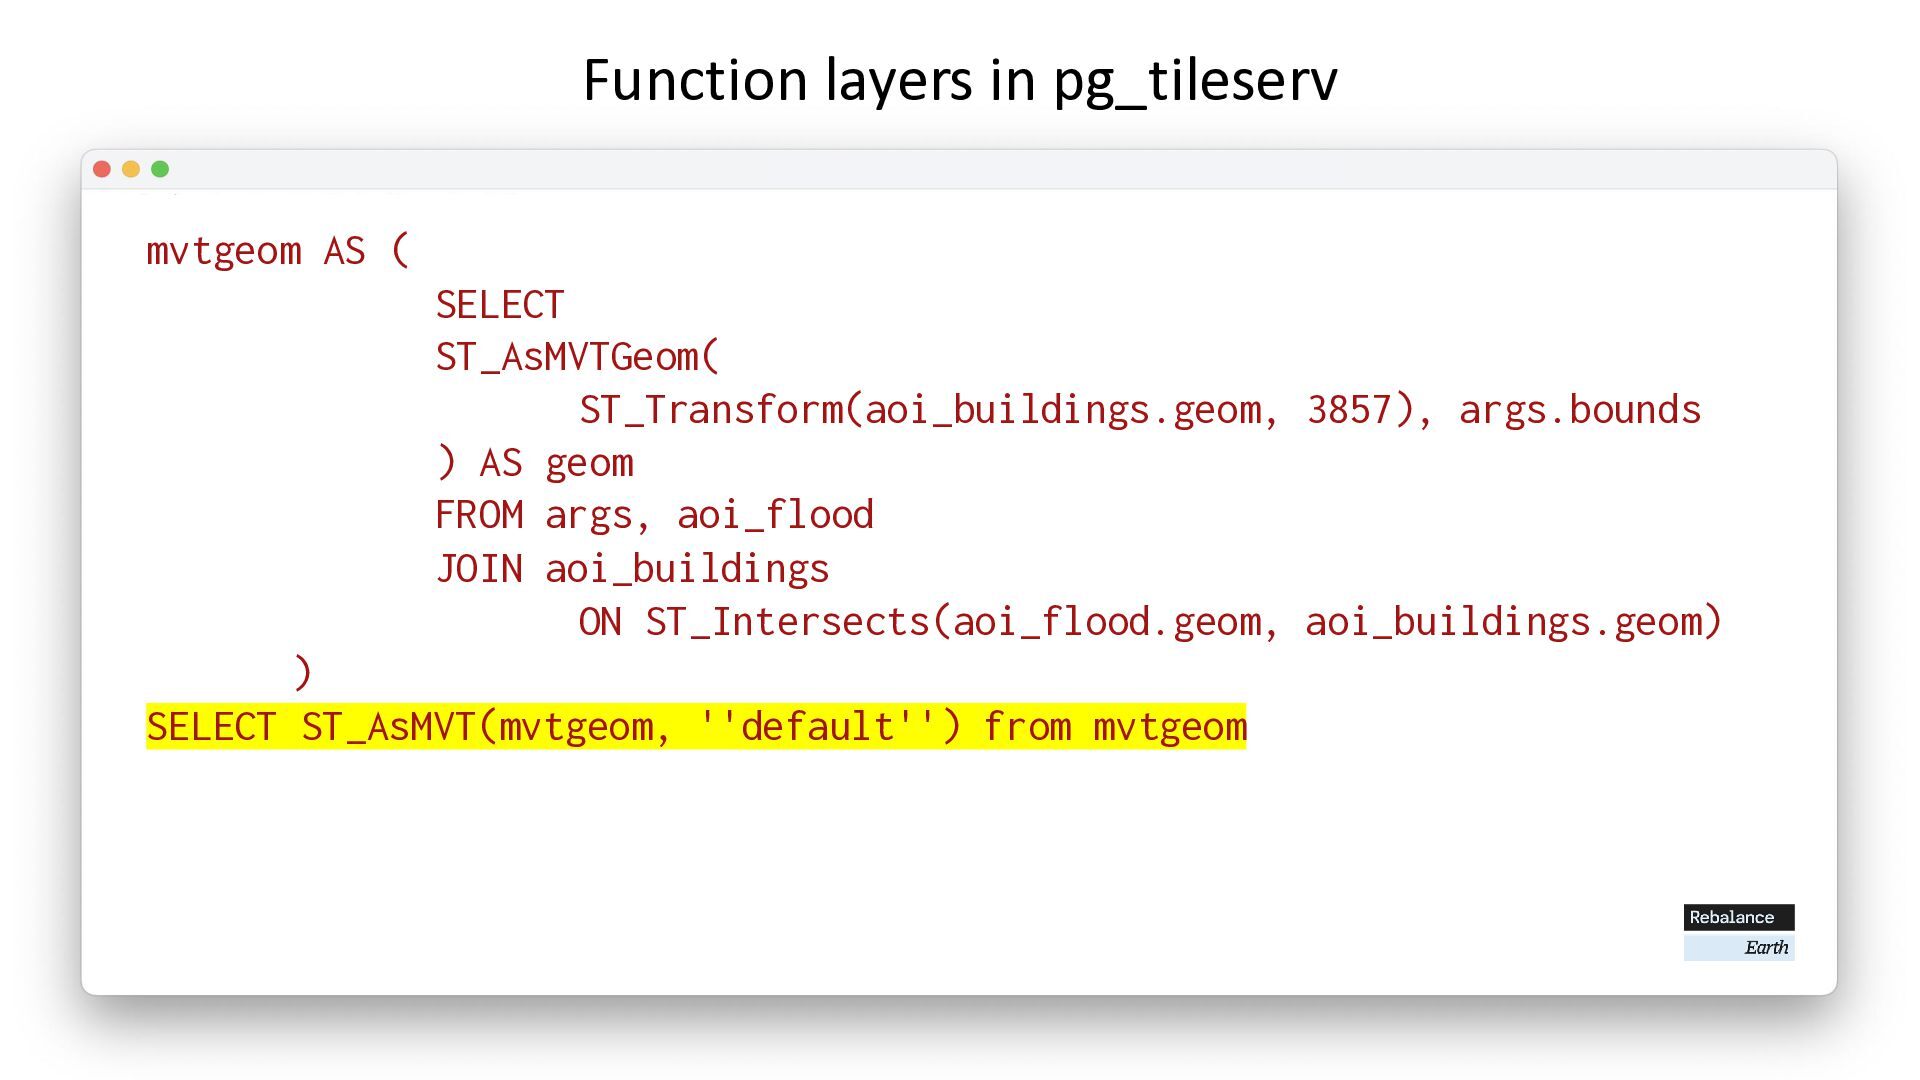
3857), args.bounds ) AS geom FROM args, aoi_flood JOIN aoi_buildings ON ST_Intersects(aoi_flood.geom, aoi_buildings.geom) ) SELECT ST_AsMVT(mvtgeom, ''default'') from mvtgeom
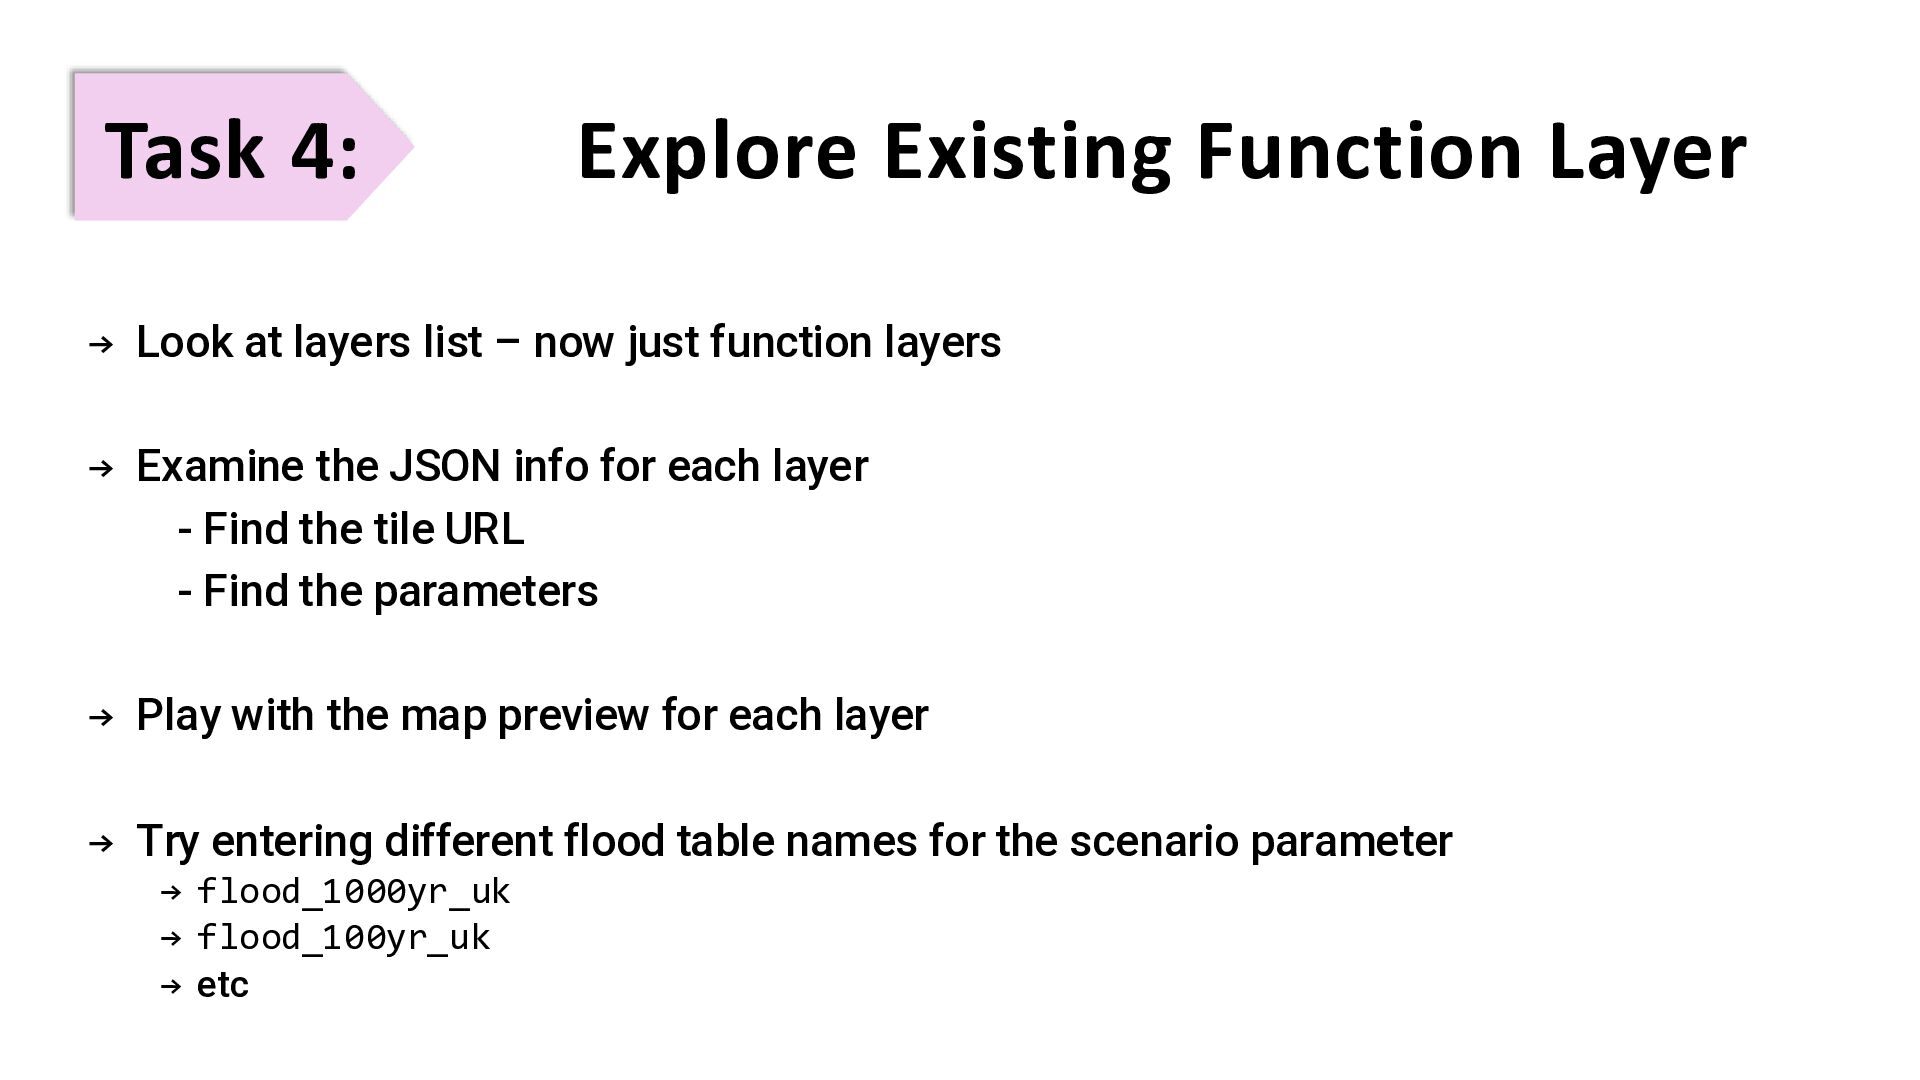
list – now just function layers → Examine the JSON info for each layer - Find the tile URL - Find the parameters → Play with the map preview for each layer → Try entering different flood table names for the scenario parameter → flood_1000yr_uk → flood_100yr_uk → etc
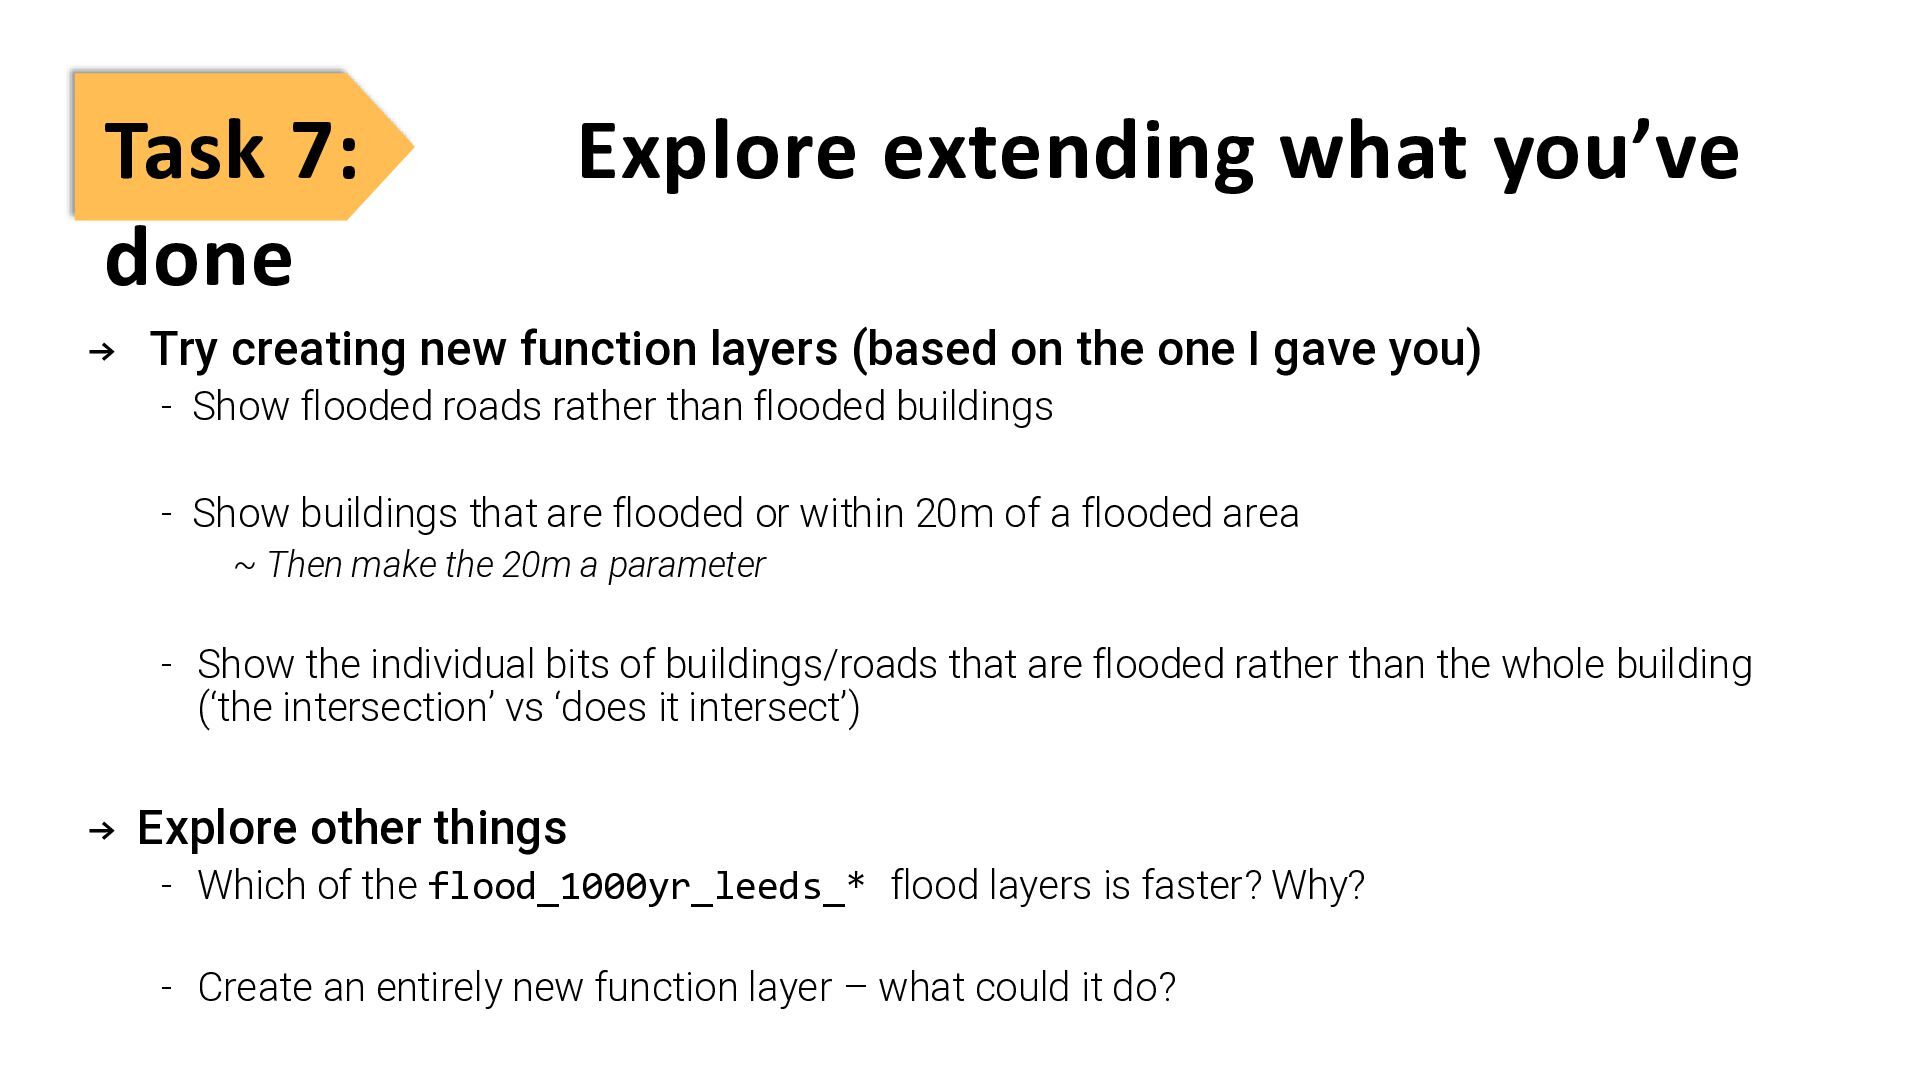
new function layers (based on the one I gave you) - Show flooded roads rather than flooded buildings - Show buildings that are flooded or within 20m of a flooded area ~ Then make the 20m a parameter - Show the individual bits of buildings/roads that are flooded rather than the whole building (‘the intersection’ vs ‘does it intersect’) → Explore other things - Which of the flood_1000yr_leeds_* flood layers is faster? Why? - Create an entirely new function layer – what could it do?
![Thank You Dr Robin Wilson | [email protected]](https://files.speakerdeck.com/presentations/317c70ff748d45f3810e5ce025ca9098/slide_60.jpg)