Upgrade to Pro
— share decks privately, control downloads, hide ads and more …
Speaker Deck
Features
Speaker Deck
PRO
Sign in
Sign up for free
Search
Search
dplyr 1.0.0 / Paris R-addicts
Search
Romain François
October 14, 2020
Technology
260
0
Share
Embed
Copy iframe code
Copy JS code
Copy link
Start on current slide
dplyr 1.0.0 / Paris R-addicts
Romain François
October 14, 2020
More Decks by Romain François
See All by Romain François
dplyr 1.0.0
romainfrancois
1
1.3k
dplyr episode 9, summarise() of the vctrs
romainfrancois
0
1k
dplyr episode 9: summarise() of the vctrs
romainfrancois
0
360
n() cool #dplyr things
romainfrancois
2
3k
dance
romainfrancois
0
300
rap and splice girls
romainfrancois
0
410
rap
romainfrancois
0
140
arrow + ergo
romainfrancois
0
390
ergo
romainfrancois
0
290
Other Decks in Technology
See All in Technology
探索・可視化・自動化を一本化 Amazon Quickでデータ活用スピードを上げる方法
koheiyoshikawa
0
230
書籍セキュアAPIについて
riiimparm
0
360
人依存からAIネイティブの体制へ:バックエンド開発の裏側【SORACOM Discovery 2026】
soracom
PRO
0
110
「待ち時間」の消滅と「自我消耗」の加速:生成AI時代のエンジニアを救うメンタル・リソース管理
poropinai1966
0
270
変更し続けられるシステムをどう保つか — AI時代のSSoTという設計原則
kawauso
1
1.4k
実践が先生だった— 新卒サーバーエンジニア1年目のリアル
mixi_engineers
PRO
0
170
データ活用研修 問いの発見と仮説構築【MIXI 26新卒技術研修】
mixi_engineers
PRO
1
500
データ活用研修 データマネジメント【MIXI 26新卒技術研修】
mixi_engineers
PRO
4
660
最高のシステムプロンプトを作るためにフィードバック機能を導入した話
alchemy1115
0
120
BigQuery を検索ソースとした AI Agent の作り方って 〇〇 通りあんねん
satohjohn
0
130
QA・ソフトウェアテスト研修【MIXI 26新卒技術研修】
mixi_engineers
PRO
3
1.5k
CloudWatchから始めるAWS監視
butadora
0
270
Featured
See All Featured
Reflections from 52 weeks, 52 projects
jeffersonlam
356
21k
The State of eCommerce SEO: How to Win in Today's Products SERPs - #SEOweek
aleyda
2
11k
Breaking role norms: Why Content Design is so much more than writing copy - Taylor Woolridge
uxyall
0
350
The Anti-SEO Checklist Checklist. Pubcon Cyber Week
ryanjones
0
190
The untapped power of vector embeddings
frankvandijk
2
1.8k
It's Worth the Effort
3n
188
29k
エンジニアに許された特別な時間の終わり
watany
108
250k
Making Projects Easy
brettharned
120
6.7k
Efficient Content Optimization with Google Search Console & Apps Script
katarinadahlin
PRO
1
740
Optimizing for Happiness
mojombo
378
71k
Paper Plane
katiecoart
PRO
2
52k
The Pragmatic Product Professional
lauravandoore
37
7.4k
Transcript
Rom ain François @rom ain_francois Raddicts 2020/10/14
1.0.0 Rom ain François @rom ain_francois Raddicts 2020/10/14 @allison_horst
tidyverse.org/articles
summarise() - Plusieurs lignes - Plusieurs colonnes - across() -
Gestion des "groupes"
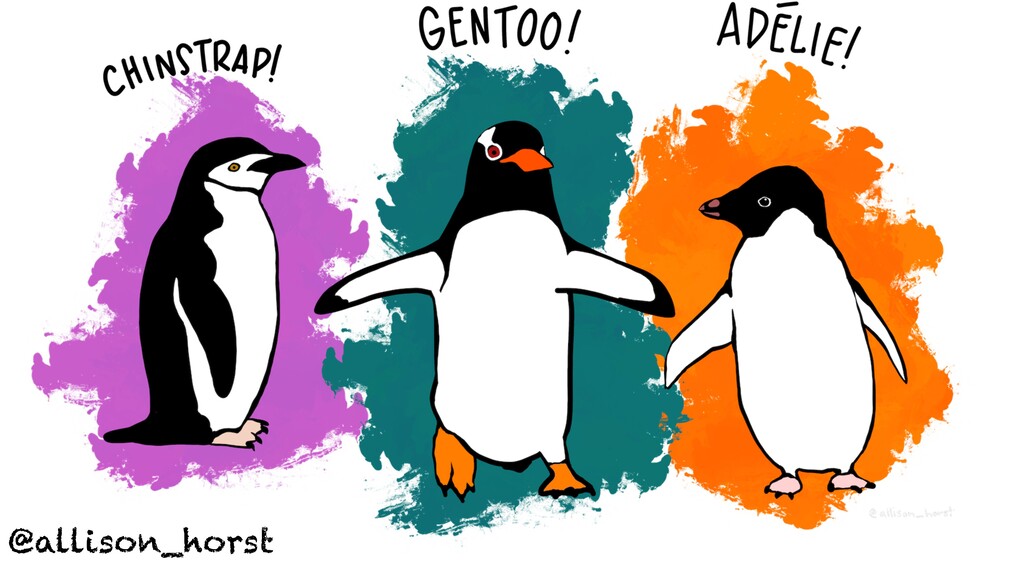
@allison_horst
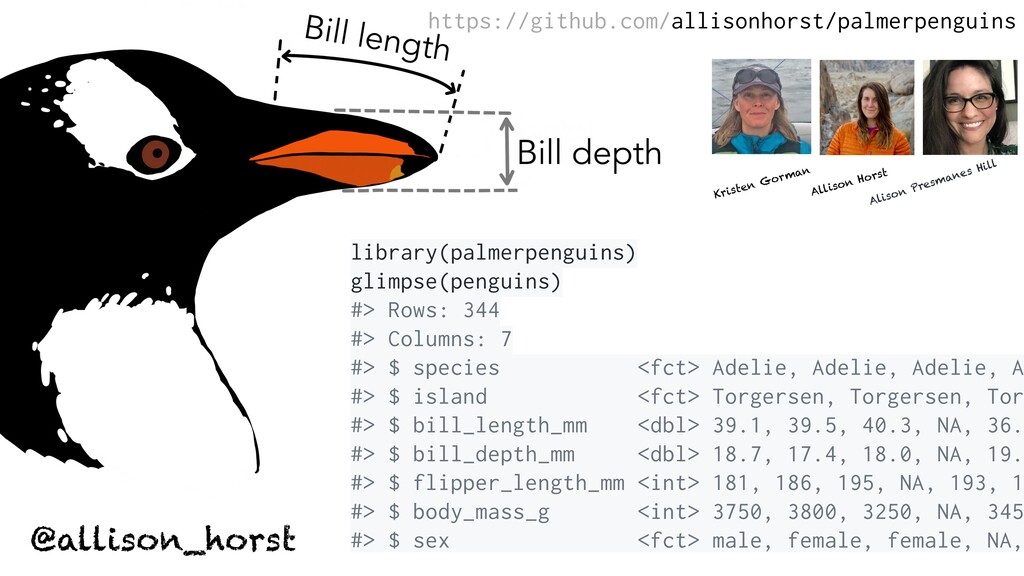
@allison_horst Kristen Gorman Allison Horst library(palmerpenguins) glimpse(penguins) #> Rows: 344
#> Columns: 7 #> $ species <fct> Adelie, Adelie, Adelie, A #> $ island <fct> Torgersen, Torgersen, Tor #> $ bill_length_mm <dbl> 39.1, 39.5, 40.3, NA, 36. #> $ bill_depth_mm <dbl> 18.7, 17.4, 18.0, NA, 19. #> $ flipper_length_mm <int> 181, 186, 195, NA, 193, 1 #> $ body_mass_g <int> 3750, 3800, 3250, NA, 345 #> $ sex <fct> male, female, female, NA, Alison Presmanes Hill https://github.com/allisonhorst/palmerpenguins
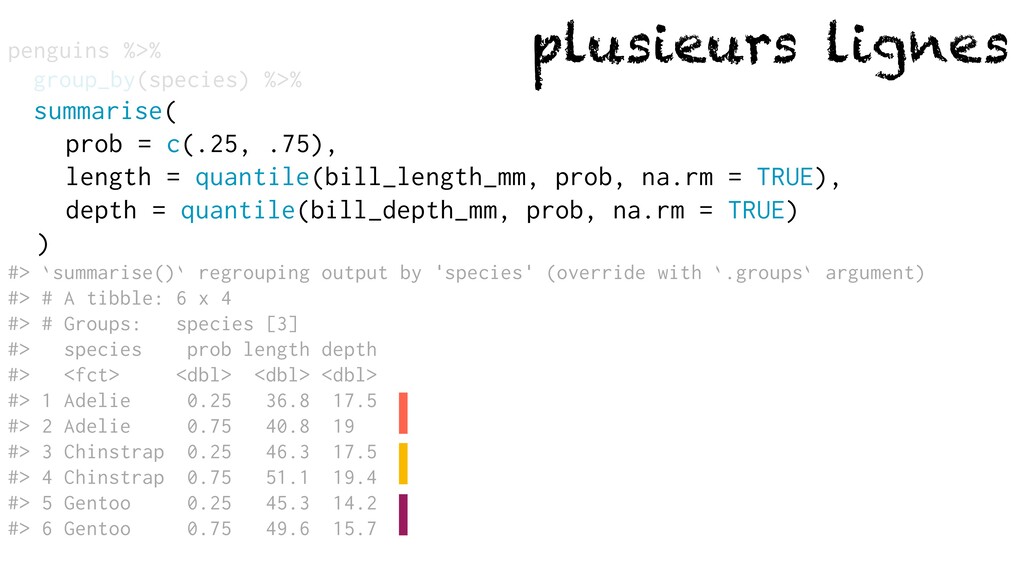
plusieurs lignes penguins %>% group_by(species) %>% summarise( prob = c(.25,
.75), length = quantile(bill_length_mm, prob, na.rm = TRUE), depth = quantile(bill_depth_mm, prob, na.rm = TRUE) ) #> `summarise()` regrouping output by 'species' (override with `.groups` argument) #> # A tibble: 6 x 4 #> # Groups: species [3] #> species prob length depth #> <fct> <dbl> <dbl> <dbl> #> 1 Adelie 0.25 36.8 17.5 #> 2 Adelie 0.75 40.8 19 #> 3 Chinstrap 0.25 46.3 17.5 #> 4 Chinstrap 0.75 51.1 19.4 #> 5 Gentoo 0.25 45.3 14.2 #> 6 Gentoo 0.75 49.6 15.7
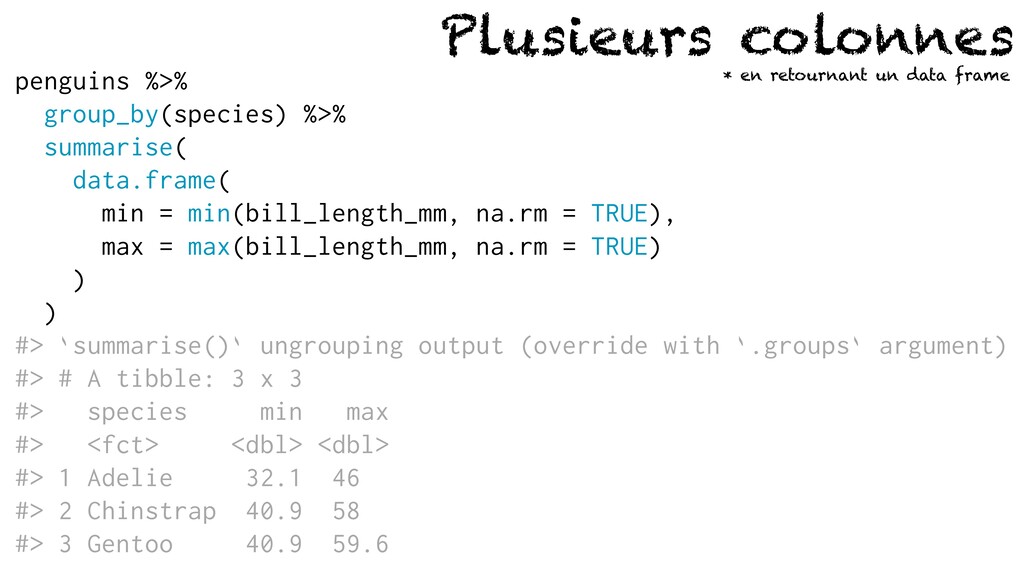
Plusieurs colonnes penguins %>% group_by(species) %>% summarise( data.frame( min =
min(bill_length_mm, na.rm = TRUE), max = max(bill_length_mm, na.rm = TRUE) ) ) #> `summarise()` ungrouping output (override with `.groups` argument) #> # A tibble: 3 x 3 #> species min max #> <fct> <dbl> <dbl> #> 1 Adelie 32.1 46 #> 2 Chinstrap 40.9 58 #> 3 Gentoo 40.9 59.6 * en retournant un data frame
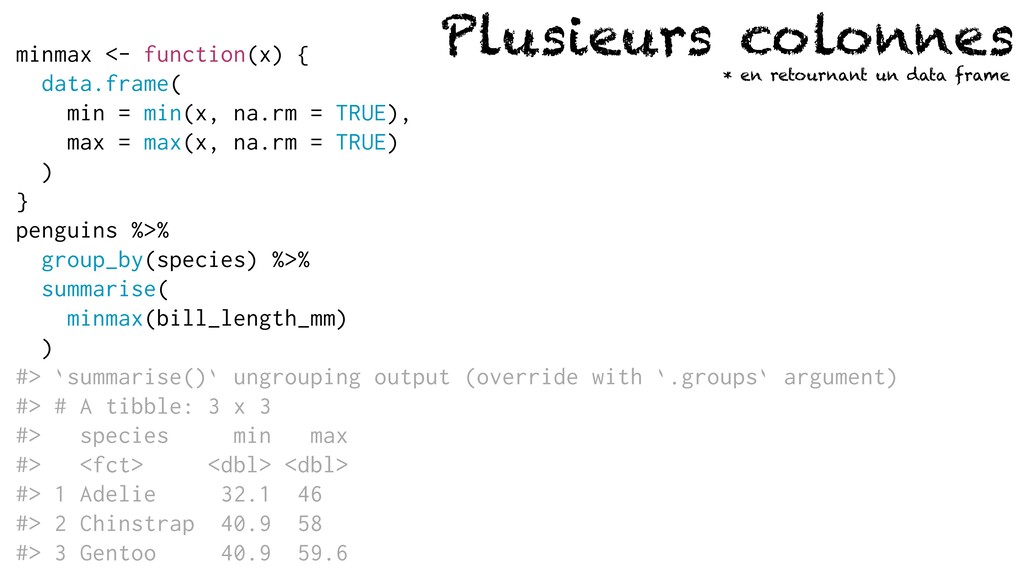
Plusieurs colonnes * en retournant un data frame minmax <-
function(x) { data.frame( min = min(x, na.rm = TRUE), max = max(x, na.rm = TRUE) ) } penguins %>% group_by(species) %>% summarise( minmax(bill_length_mm) ) #> `summarise()` ungrouping output (override with `.groups` argument) #> # A tibble: 3 x 3 #> species min max #> <fct> <dbl> <dbl> #> 1 Adelie 32.1 46 #> 2 Chinstrap 40.9 58 #> 3 Gentoo 40.9 59.6
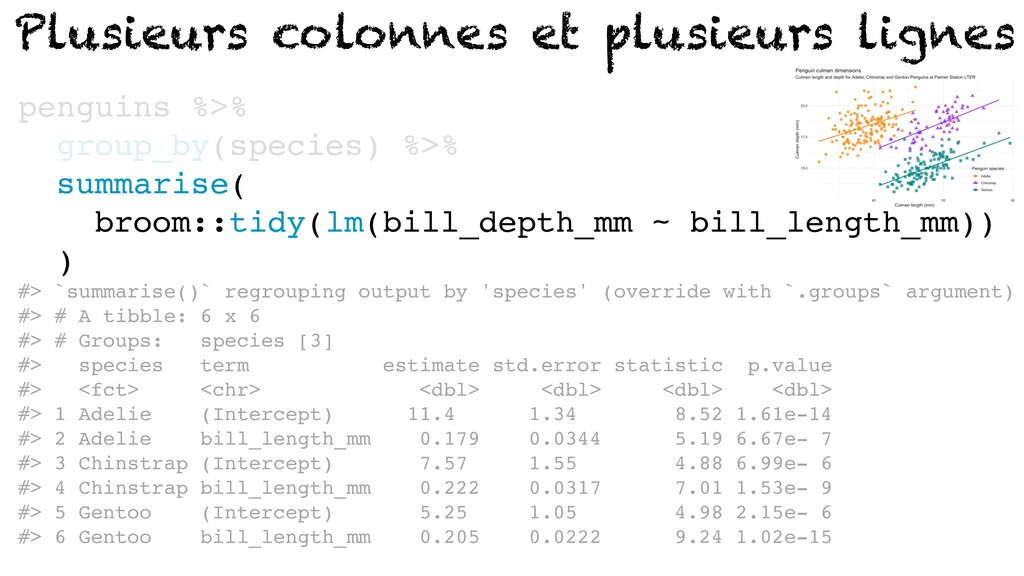
Plusieurs colonnes et plusieurs lignes penguins %>% group_by(species) %>% summarise(
broom::tidy(lm(bill_depth_mm ~ bill_length_mm)) ) #> `summarise()` regrouping output by 'species' (override with `.groups` argument) #> # A tibble: 6 x 6 #> # Groups: species [3] #> species term estimate std.error statistic p.value #> <fct> <chr> <dbl> <dbl> <dbl> <dbl> #> 1 Adelie (Intercept) 11.4 1.34 8.52 1.61e-14 #> 2 Adelie bill_length_mm 0.179 0.0344 5.19 6.67e- 7 #> 3 Chinstrap (Intercept) 7.57 1.55 4.88 6.99e- 6 #> 4 Chinstrap bill_length_mm 0.222 0.0317 7.01 1.53e- 9 #> 5 Gentoo (Intercept) 5.25 1.05 4.98 2.15e- 6 #> 6 Gentoo bill_length_mm 0.205 0.0222 9.24 1.02e-15
across()
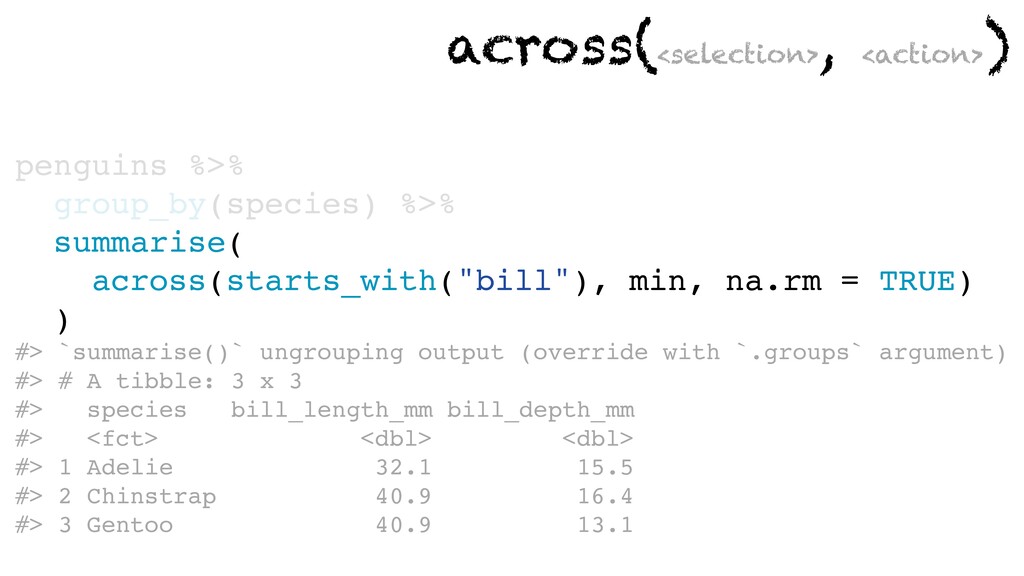
across(<selection> , <action> ) penguins %>% group_by(species) %>% summarise( across(starts_with("bill"),
min, na.rm = TRUE) ) #> `summarise()` ungrouping output (override with `.groups` argument) #> # A tibble: 3 x 3 #> species bill_length_mm bill_depth_mm #> <fct> <dbl> <dbl> #> 1 Adelie 32.1 15.5 #> 2 Chinstrap 40.9 16.4 #> 3 Gentoo 40.9 13.1
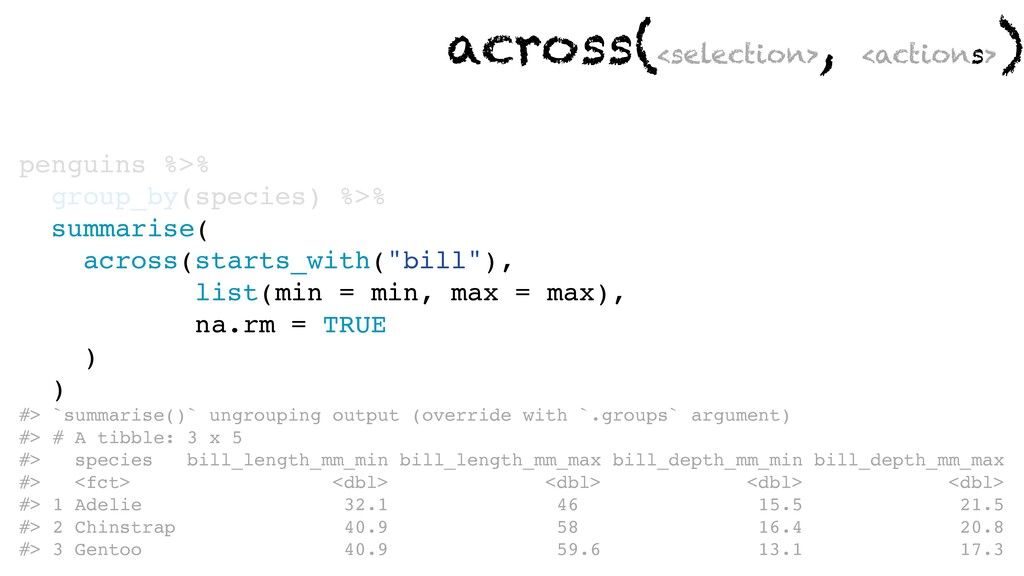
penguins %>% group_by(species) %>% summarise( across(starts_with("bill"), list(min = min, max
= max), na.rm = TRUE ) ) #> `summarise()` ungrouping output (override with `.groups` argument) #> # A tibble: 3 x 5 #> species bill_length_mm_min bill_length_mm_max bill_depth_mm_min bill_depth_mm_max #> <fct> <dbl> <dbl> <dbl> <dbl> #> 1 Adelie 32.1 46 15.5 21.5 #> 2 Chinstrap 40.9 58 16.4 20.8 #> 3 Gentoo 40.9 59.6 13.1 17.3 across(<selection> , <actions> )
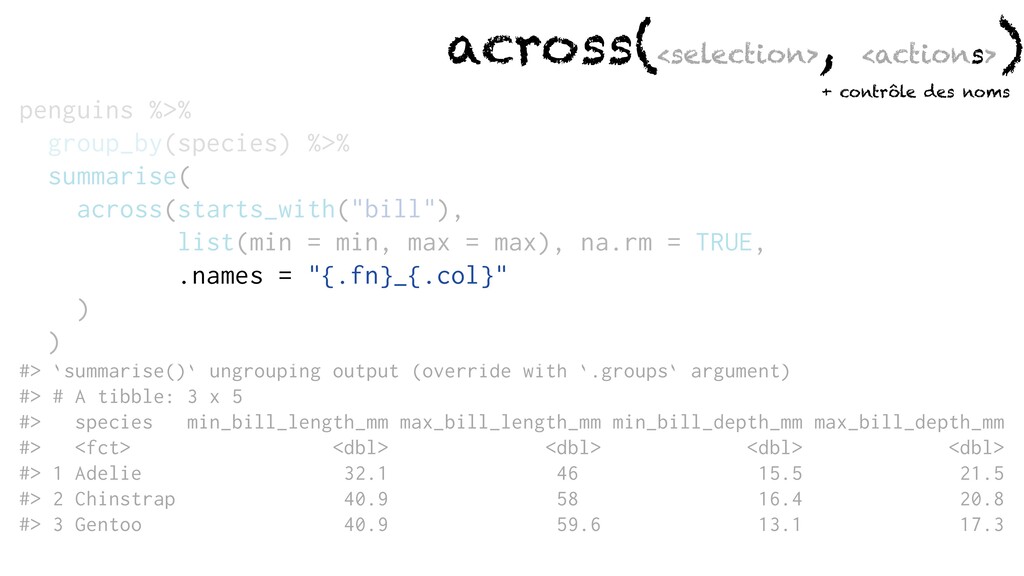
penguins %>% group_by(species) %>% summarise( across(starts_with("bill"), list(min = min, max
= max), na.rm = TRUE, .names = "{.fn}_{.col}" ) ) #> `summarise()` ungrouping output (override with `.groups` argument) #> # A tibble: 3 x 5 #> species min_bill_length_mm max_bill_length_mm min_bill_depth_mm max_bill_depth_mm #> <fct> <dbl> <dbl> <dbl> <dbl> #> 1 Adelie 32.1 46 15.5 21.5 #> 2 Chinstrap 40.9 58 16.4 20.8 #> 3 Gentoo 40.9 59.6 13.1 17.3 across(<selection> , <actions> ) + contrôle des noms
summarise(.groups = )
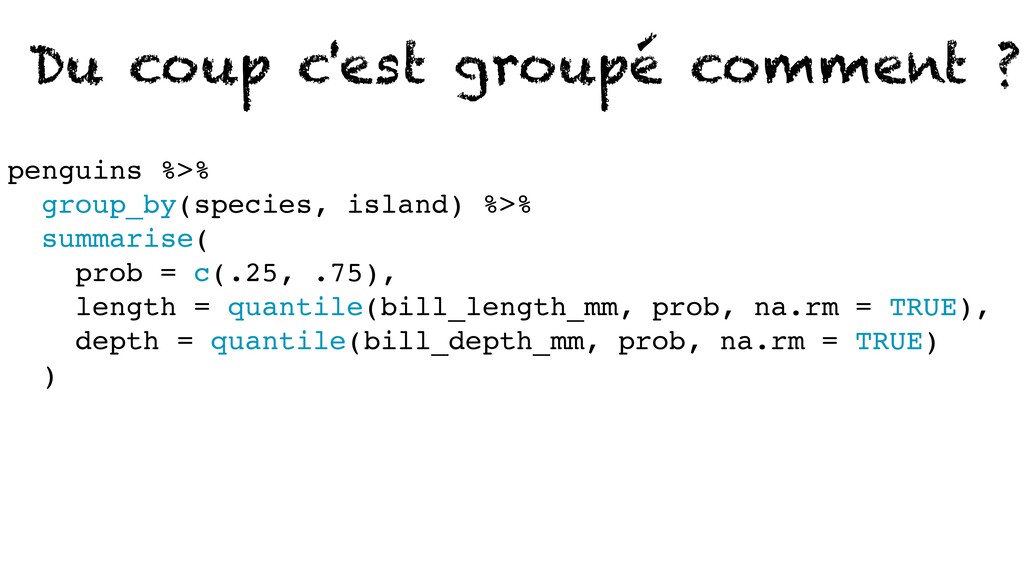
penguins %>% group_by(species, island) %>% summarise( prob = c(.25, .75),
length = quantile(bill_length_mm, prob, na.rm = TRUE), depth = quantile(bill_depth_mm, prob, na.rm = TRUE) ) Du coup c'est groupé comment ?
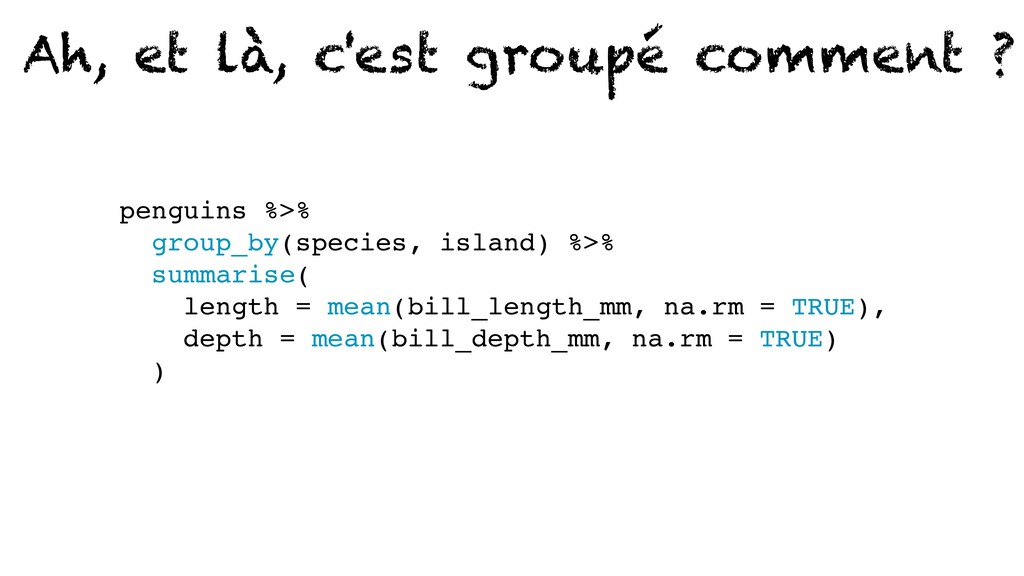
Ah, et là, c'est groupé comment ? penguins %>% group_by(species,
island) %>% summarise( length = mean(bill_length_mm, na.rm = TRUE), depth = mean(bill_depth_mm, na.rm = TRUE) )
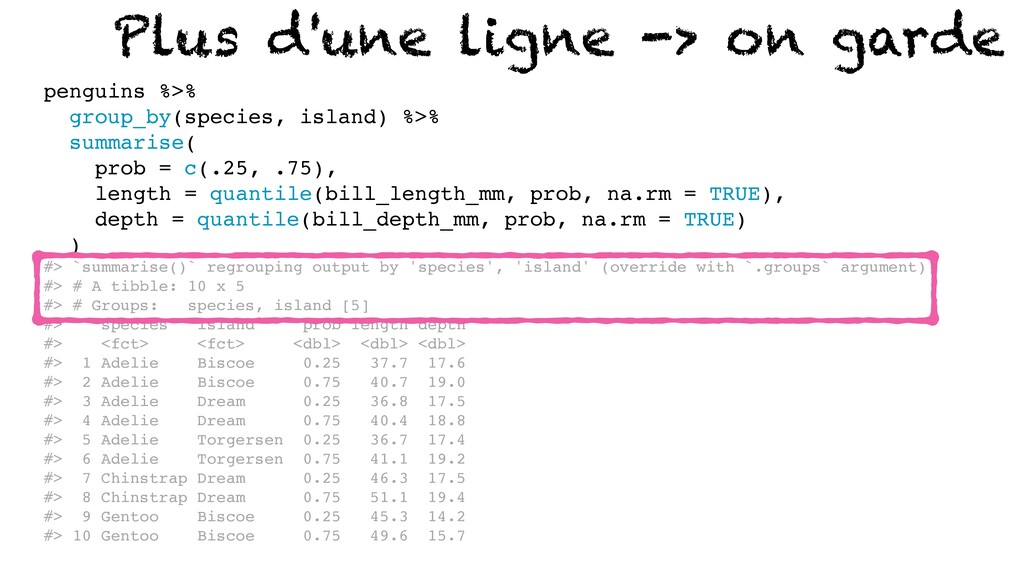
penguins %>% group_by(species, island) %>% summarise( prob = c(.25, .75),
length = quantile(bill_length_mm, prob, na.rm = TRUE), depth = quantile(bill_depth_mm, prob, na.rm = TRUE) ) #> `summarise()` regrouping output by 'species', 'island' (override with `.groups` argument) #> # A tibble: 10 x 5 #> # Groups: species, island [5] #> species island prob length depth #> <fct> <fct> <dbl> <dbl> <dbl> #> 1 Adelie Biscoe 0.25 37.7 17.6 #> 2 Adelie Biscoe 0.75 40.7 19.0 #> 3 Adelie Dream 0.25 36.8 17.5 #> 4 Adelie Dream 0.75 40.4 18.8 #> 5 Adelie Torgersen 0.25 36.7 17.4 #> 6 Adelie Torgersen 0.75 41.1 19.2 #> 7 Chinstrap Dream 0.25 46.3 17.5 #> 8 Chinstrap Dream 0.75 51.1 19.4 #> 9 Gentoo Biscoe 0.25 45.3 14.2 #> 10 Gentoo Biscoe 0.75 49.6 15.7 Plus d'une ligne -> on garde
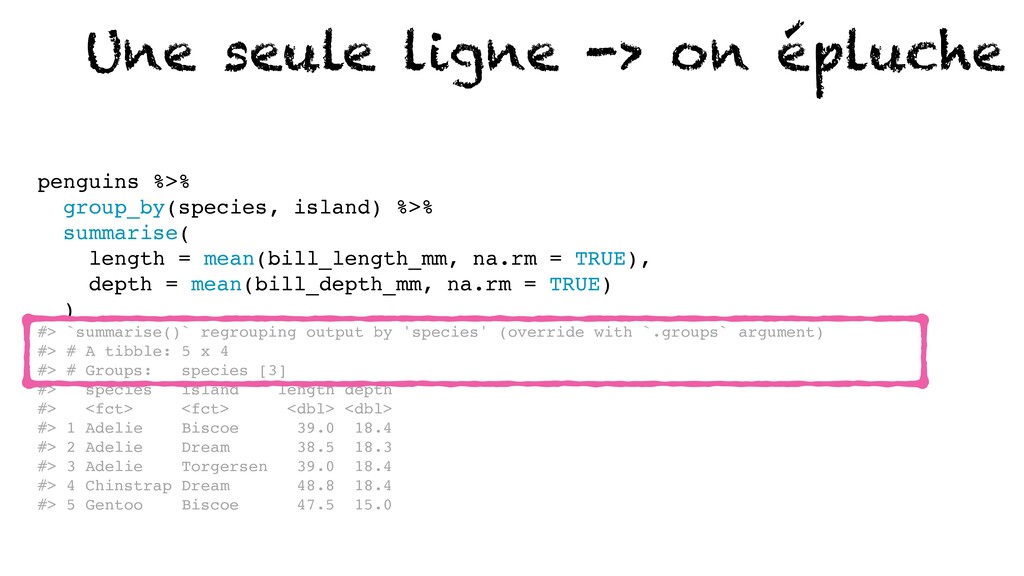
penguins %>% group_by(species, island) %>% summarise( length = mean(bill_length_mm, na.rm
= TRUE), depth = mean(bill_depth_mm, na.rm = TRUE) ) #> `summarise()` regrouping output by 'species' (override with `.groups` argument) #> # A tibble: 5 x 4 #> # Groups: species [3] #> species island length depth #> <fct> <fct> <dbl> <dbl> #> 1 Adelie Biscoe 39.0 18.4 #> 2 Adelie Dream 38.5 18.3 #> 3 Adelie Torgersen 39.0 18.4 #> 4 Chinstrap Dream 48.8 18.4 #> 5 Gentoo Biscoe 47.5 15.0 Une seule ligne -> on épluche
Mouais, mais c'est quoi ces messages ? ... et comment
je m'en débarrasse ?
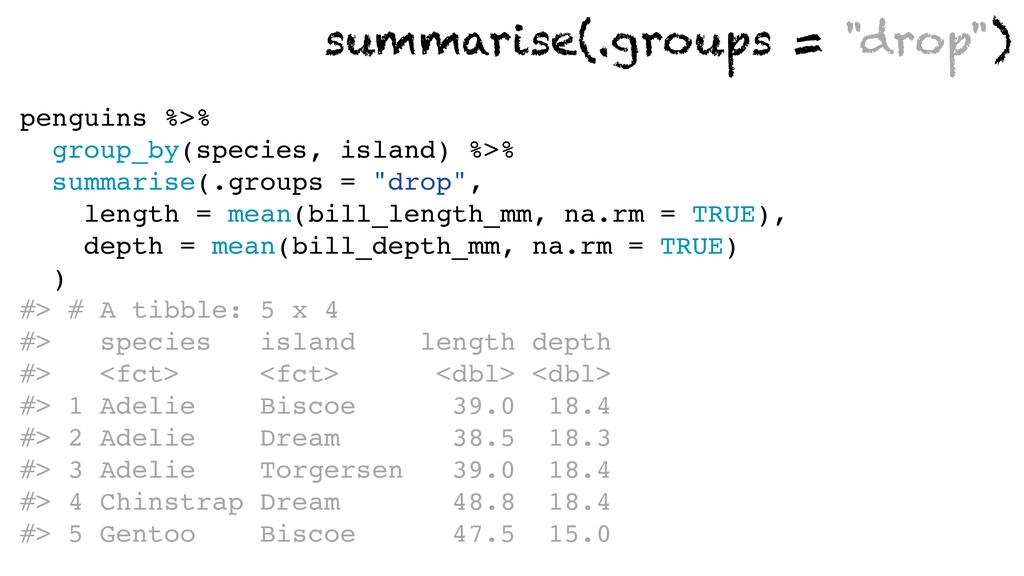
penguins %>% group_by(species, island) %>% summarise(.groups = "drop", length =
mean(bill_length_mm, na.rm = TRUE), depth = mean(bill_depth_mm, na.rm = TRUE) ) #> # A tibble: 5 x 4 #> species island length depth #> <fct> <fct> <dbl> <dbl> #> 1 Adelie Biscoe 39.0 18.4 #> 2 Adelie Dream 38.5 18.3 #> 3 Adelie Torgersen 39.0 18.4 #> 4 Chinstrap Dream 48.8 18.4 #> 5 Gentoo Biscoe 47.5 15.0 summarise(.groups = "drop")
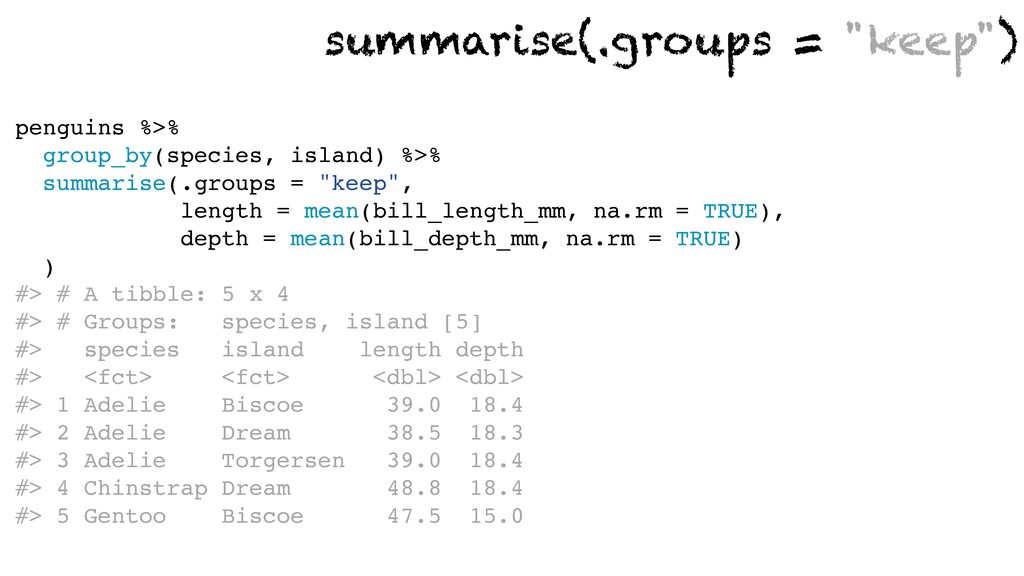
penguins %>% group_by(species, island) %>% summarise(.groups = "keep", length =
mean(bill_length_mm, na.rm = TRUE), depth = mean(bill_depth_mm, na.rm = TRUE) ) #> # A tibble: 5 x 4 #> # Groups: species, island [5] #> species island length depth #> <fct> <fct> <dbl> <dbl> #> 1 Adelie Biscoe 39.0 18.4 #> 2 Adelie Dream 38.5 18.3 #> 3 Adelie Torgersen 39.0 18.4 #> 4 Chinstrap Dream 48.8 18.4 #> 5 Gentoo Biscoe 47.5 15.0 summarise(.groups = "keep")
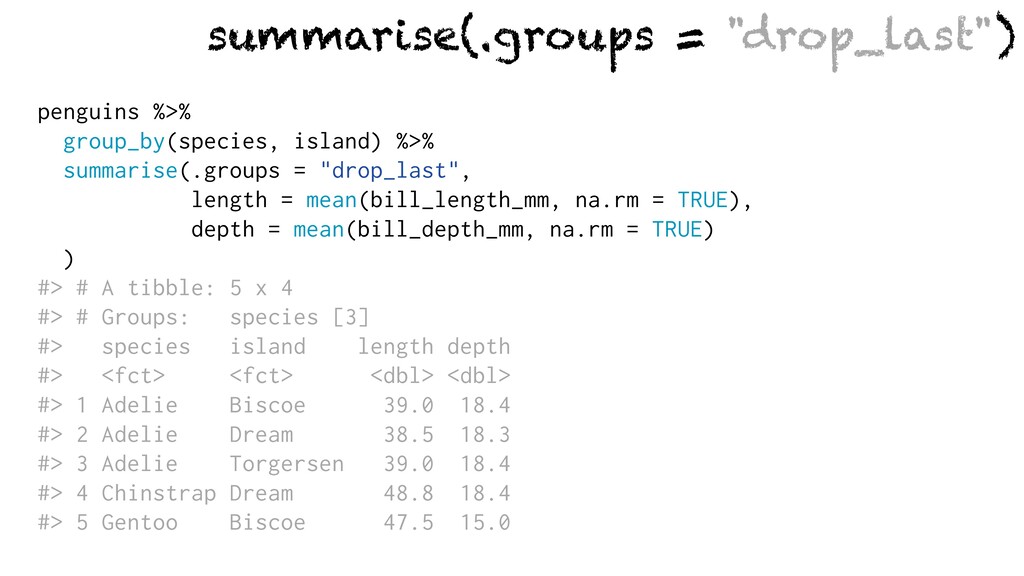
summarise(.groups = "drop_last") penguins %>% group_by(species, island) %>% summarise(.groups =
"drop_last", length = mean(bill_length_mm, na.rm = TRUE), depth = mean(bill_depth_mm, na.rm = TRUE) ) #> # A tibble: 5 x 4 #> # Groups: species [3] #> species island length depth #> <fct> <fct> <dbl> <dbl> #> 1 Adelie Biscoe 39.0 18.4 #> 2 Adelie Dream 38.5 18.3 #> 3 Adelie Torgersen 39.0 18.4 #> 4 Chinstrap Dream 48.8 18.4 #> 5 Gentoo Biscoe 47.5 15.0
1.0.0 Rom ain François @rom ain_francois Raddicts 2020/10/14 @allison_horst