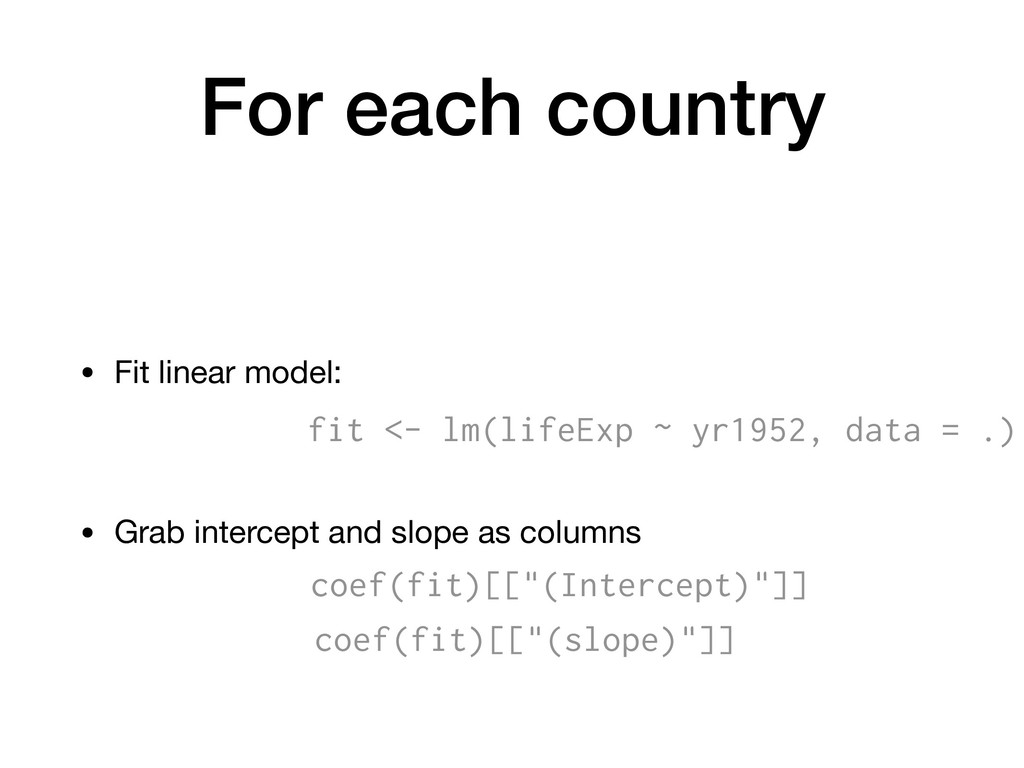
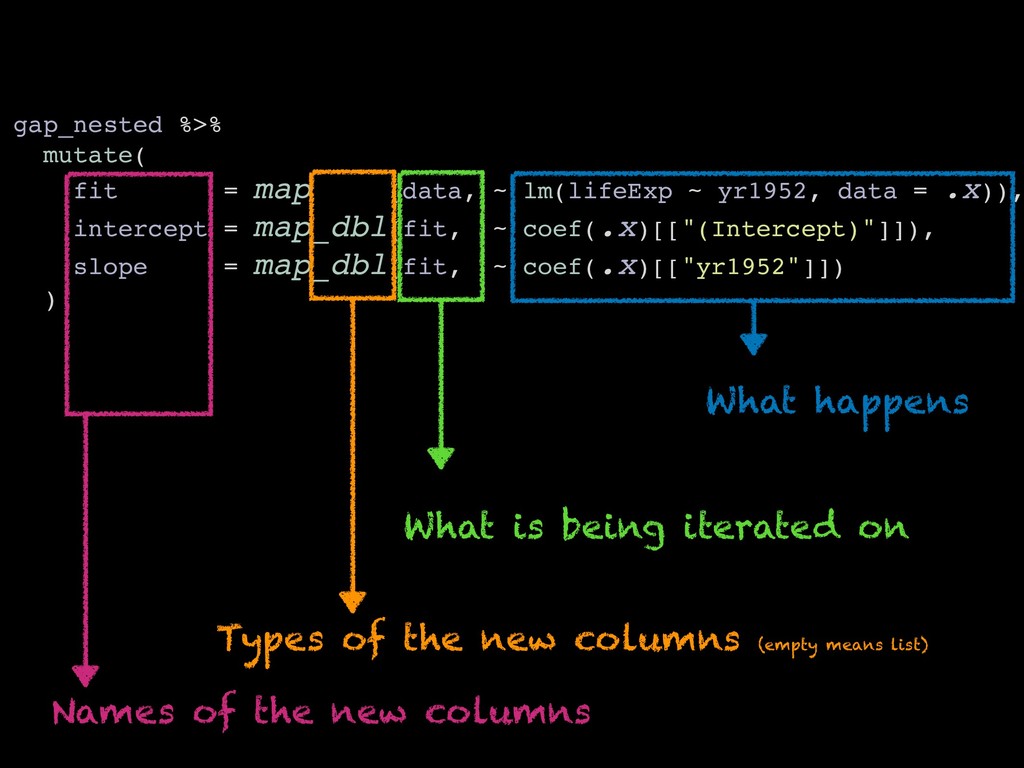
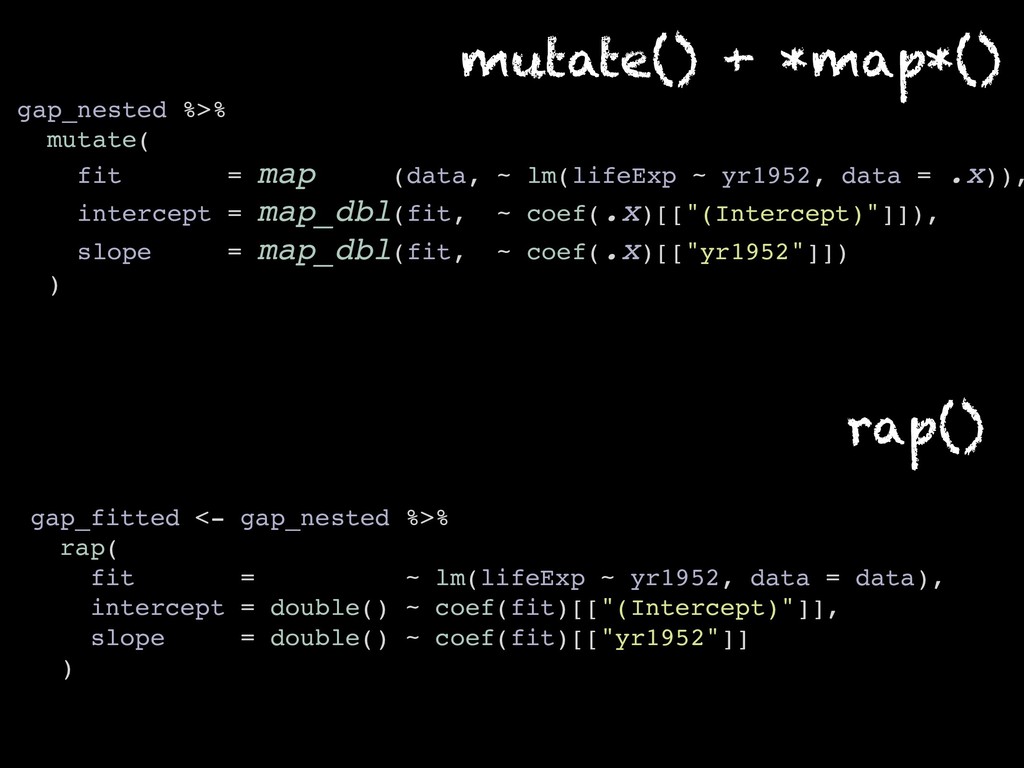
yr1952, data = .x)), intercept = map_dbl(fit, ~ coef(.x)[["(Intercept)"]]), slope = map_dbl(fit, ~ coef(.x)[["yr1952"]]) ) Names of the new columns Types of the new columns (empty means list) What happens What is being iterated on
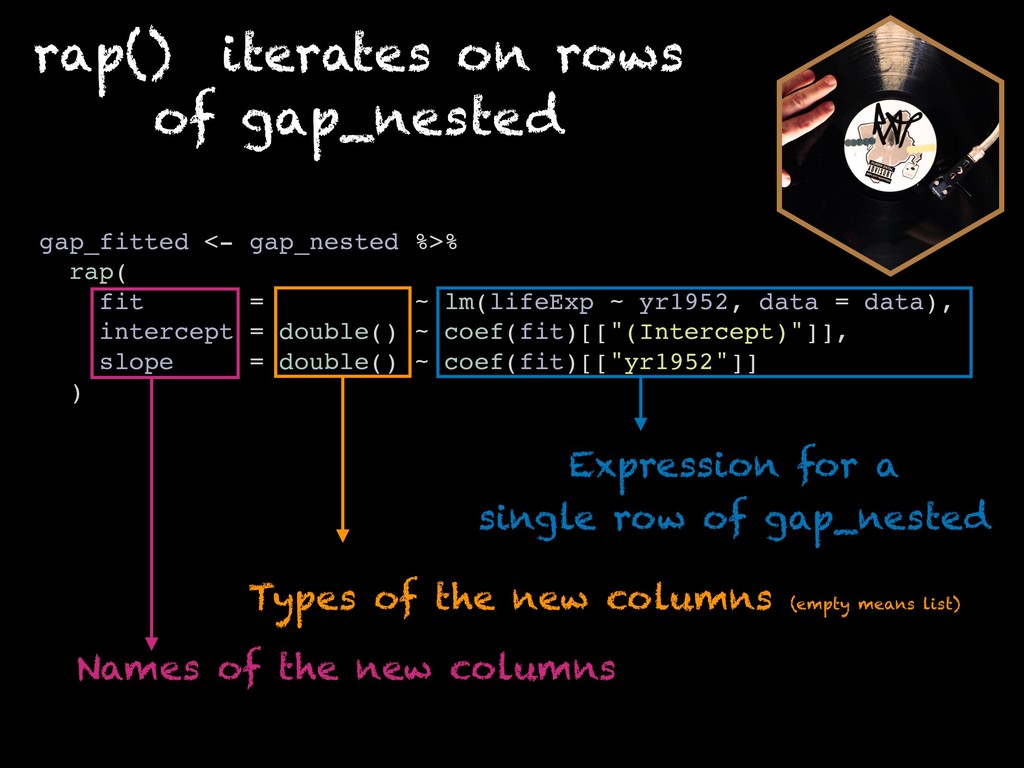
yr1952, data = data), intercept = double() ~ coef(fit)[["(Intercept)"]], slope = double() ~ coef(fit)[["yr1952"]] ) Names of the new columns Types of the new columns (empty means list) Expression for a single row of gap_nested rap() iterates on rows of gap_nested
![fit1 <- gap_fitted$fit[[1]] coef <- coef(fit1) coef #> (Intercept) yr1952](https://files.speakerdeck.com/presentations/d458a2e75d544c70a1a344b7bb3aec73/slide_19.jpg)