Upgrade to Pro
— share decks privately, control downloads, hide ads and more …
Speaker Deck
Features
Speaker Deck
PRO
Sign in
Sign up for free
Search
Search
n() cool #dplyr things
Search
Romain François
July 10, 2019
Science
3k
2
Share
Embed
Copy iframe code
Copy JS code
Copy link
Start on current slide
n() cool #dplyr things
Talk about group_*() functions and summarise_at() at useR! 2019, Toulouse.
Romain François
July 10, 2019
More Decks by Romain François
See All by Romain François
dplyr 1.0.0 / Paris R-addicts
romainfrancois
0
260
dplyr 1.0.0
romainfrancois
1
1.3k
dplyr episode 9, summarise() of the vctrs
romainfrancois
0
1k
dplyr episode 9: summarise() of the vctrs
romainfrancois
0
360
dance
romainfrancois
0
300
rap and splice girls
romainfrancois
0
410
rap
romainfrancois
0
140
arrow + ergo
romainfrancois
0
390
ergo
romainfrancois
0
290
Other Decks in Science
See All in Science
機械学習 - K近傍法 & 機械学習のお作法
trycycle
PRO
1
1.6k
データベース04: SQL (1/3) 単純質問 & 集約演算
trycycle
PRO
0
1.6k
水耕栽培を始める前に知っておきたい植物の科学
grow_design_lab
0
280
Massey Ratings for Match Outcome Prediction in Table Tennis: Evidence of Greater Stability than the ITTF World Ranking
konakalab
0
110
不動産業界における業界特化のデータ整備とAI活用 ─Vertical DataとVertical AI─
estie
1
830
AkarengaLT vol.40
hashimoto_kei
0
120
ダメな自分の育て方―性格タイプの「劣等機能」から理解するニガテ克服術
ppillc
0
240
摂理と合理の肉体改造 — AI時代の減量を支える観測・制御・継続
kiyoshi
0
1.4k
データベース05: SQL(2/3) 結合質問
trycycle
PRO
0
1.2k
やるべきときにMLをやる AIエージェント開発
fufufukakaka
2
1.5k
(2025) Balade en cyclotomie
mansuy
0
650
データベース11: 正規化(1/2) - 望ましくない関係スキーマ
trycycle
PRO
0
1.5k
Featured
See All Featured
The Psychology of Web Performance [Beyond Tellerrand 2023]
tammyeverts
49
3.5k
Building Better People: How to give real-time feedback that sticks.
wjessup
370
20k
エンジニアに許された特別な時間の終わり
watany
108
250k
Fantastic passwords and where to find them - at NoRuKo
philnash
52
3.8k
How GitHub (no longer) Works
holman
316
150k
WENDY [Excerpt]
tessaabrams
11
39k
Leo the Paperboy
mayatellez
8
1.9k
ReactJS: Keep Simple. Everything can be a component!
pedronauck
666
130k
Dominate Local Search Results - an insider guide to GBP, reviews, and Local SEO
greggifford
PRO
0
220
How People are Using Generative and Agentic AI to Supercharge Their Products, Projects, Services and Value Streams Today
helenjbeal
1
250
Rails Girls Zürich Keynote
gr2m
96
14k
Noah Learner - AI + Me: how we built a GSC Bulk Export data pipeline
techseoconnect
PRO
0
340
Transcript
n() cool #dplyr things @romain_francois #useR2019, Toulouse
group_hug() https://unsplash.com/photos/Cecb0_8Hx-o Split data in groups Apply something for each
group Combine
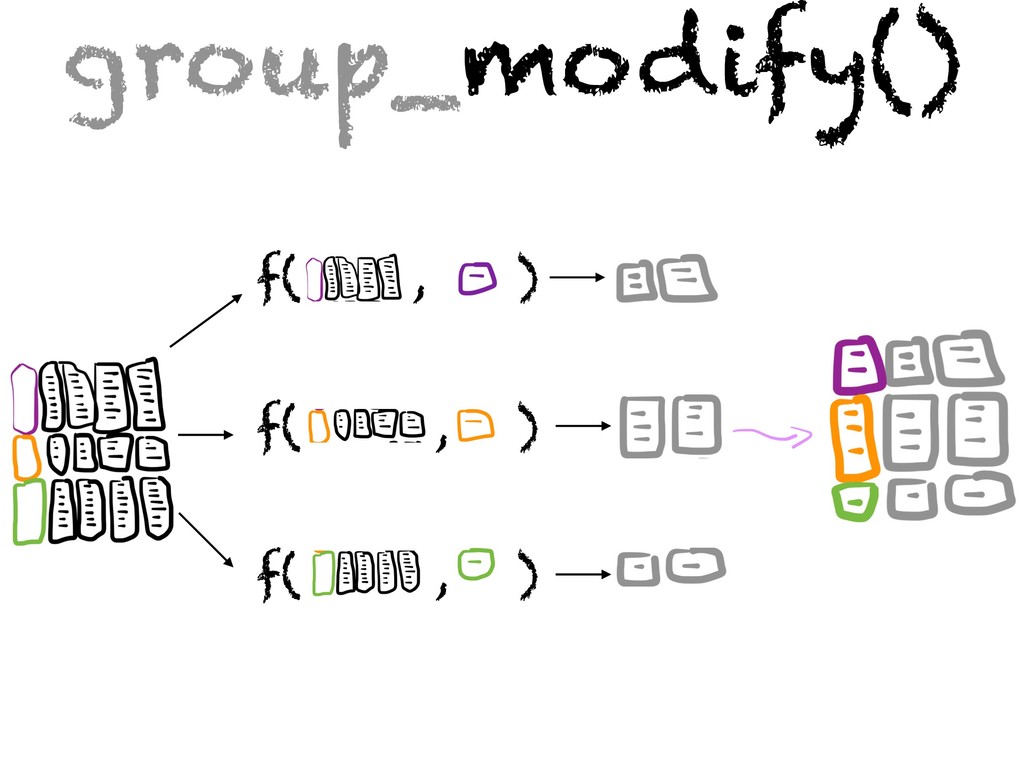
f( , ) f( , ) f( , ) group_modify()
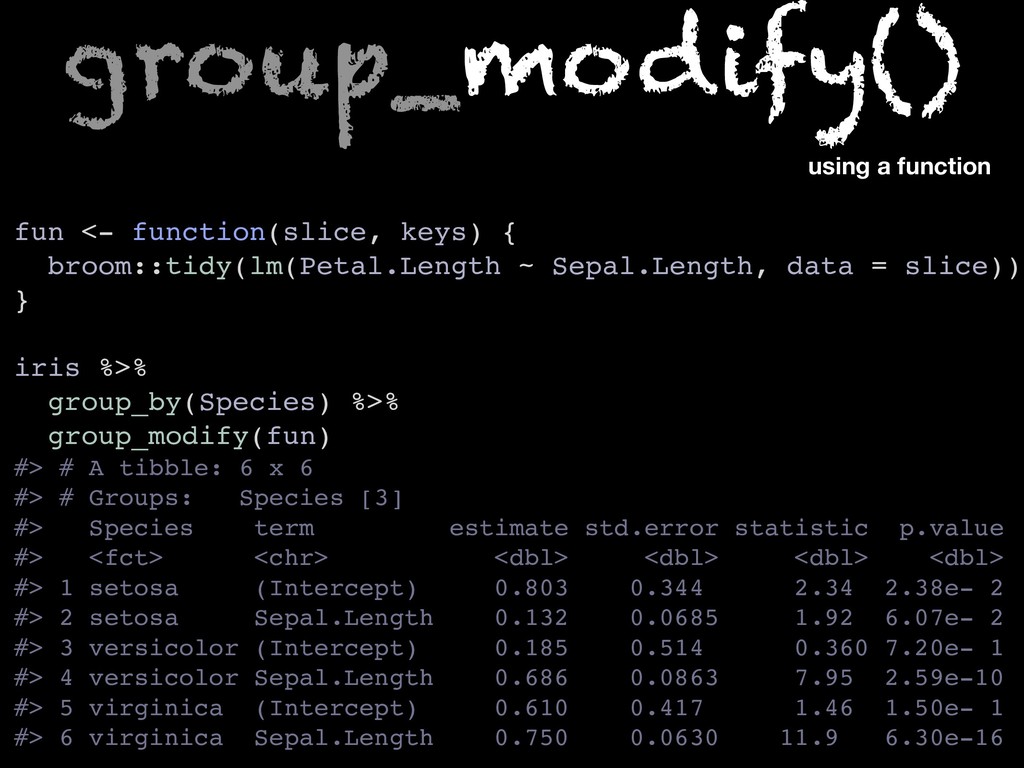
fun <- function(slice, keys) { broom::tidy(lm(Petal.Length ~ Sepal.Length, data =
slice)) } iris %>% group_by(Species) %>% group_modify(fun) #> # A tibble: 6 x 6 #> # Groups: Species [3] #> Species term estimate std.error statistic p.value #> <fct> <chr> <dbl> <dbl> <dbl> <dbl> #> 1 setosa (Intercept) 0.803 0.344 2.34 2.38e- 2 #> 2 setosa Sepal.Length 0.132 0.0685 1.92 6.07e- 2 #> 3 versicolor (Intercept) 0.185 0.514 0.360 7.20e- 1 #> 4 versicolor Sepal.Length 0.686 0.0863 7.95 2.59e-10 #> 5 virginica (Intercept) 0.610 0.417 1.46 1.50e- 1 #> 6 virginica Sepal.Length 0.750 0.0630 11.9 6.30e-16 using a function group_modify()
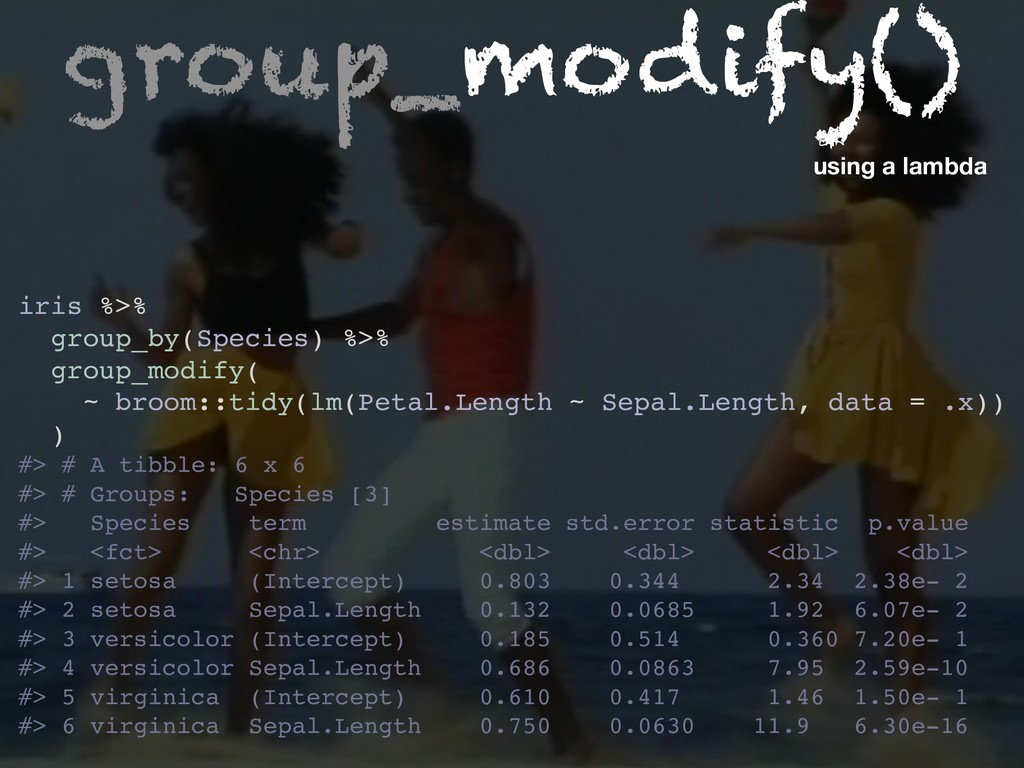
iris %>% group_by(Species) %>% group_modify( ~ broom::tidy(lm(Petal.Length ~ Sepal.Length, data
= .x)) ) #> # A tibble: 6 x 6 #> # Groups: Species [3] #> Species term estimate std.error statistic p.value #> <fct> <chr> <dbl> <dbl> <dbl> <dbl> #> 1 setosa (Intercept) 0.803 0.344 2.34 2.38e- 2 #> 2 setosa Sepal.Length 0.132 0.0685 1.92 6.07e- 2 #> 3 versicolor (Intercept) 0.185 0.514 0.360 7.20e- 1 #> 4 versicolor Sepal.Length 0.686 0.0863 7.95 2.59e-10 #> 5 virginica (Intercept) 0.610 0.417 1.46 1.50e- 1 #> 6 virginica Sepal.Length 0.750 0.0630 11.9 6.30e-16 using a lambda group_modify()
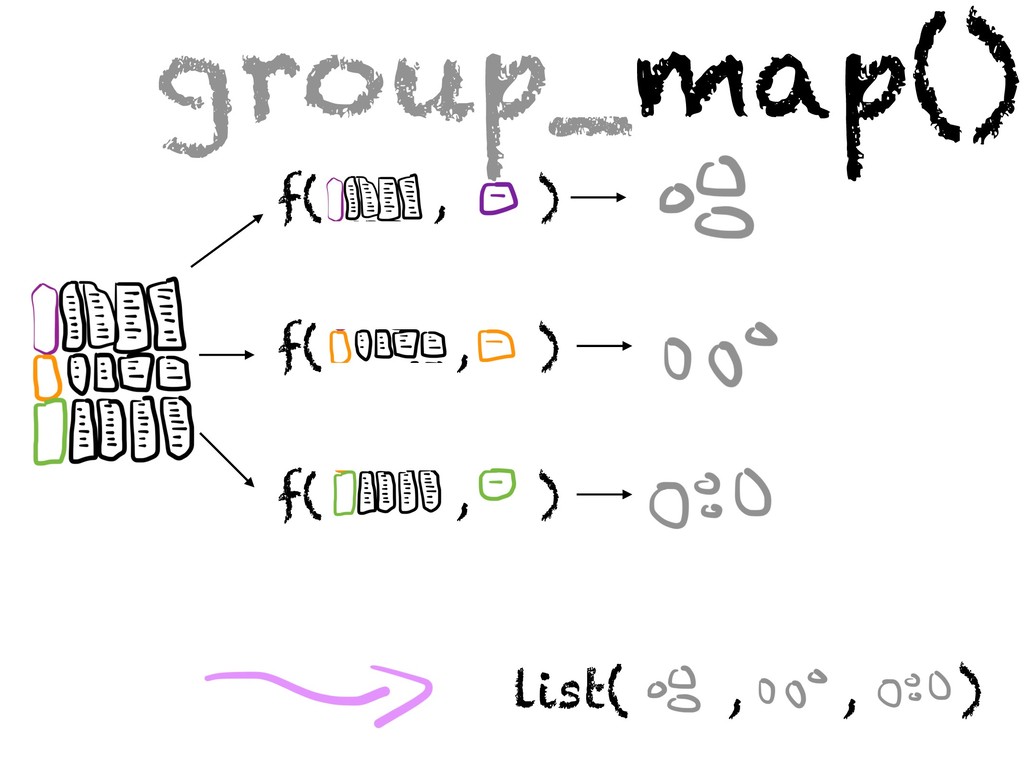
f( , ) f( , ) f( , ) group_map()
list( , , )
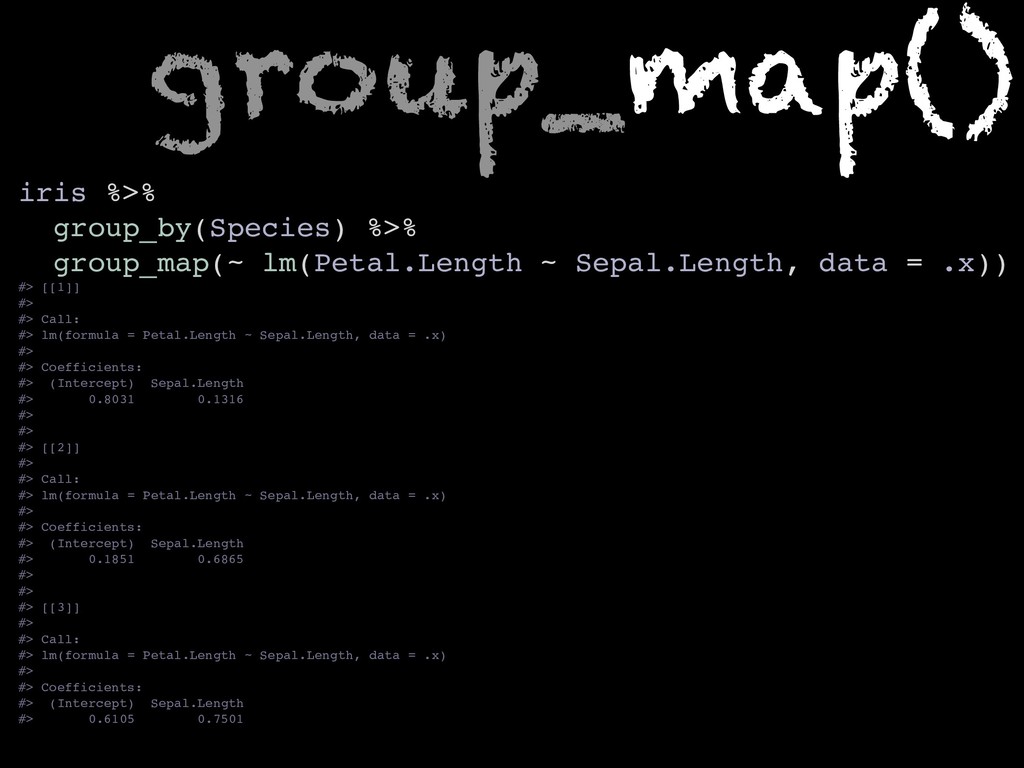
iris %>% group_by(Species) %>% group_map(~ lm(Petal.Length ~ Sepal.Length, data =
.x)) #> [[1]] #> #> Call: #> lm(formula = Petal.Length ~ Sepal.Length, data = .x) #> #> Coefficients: #> (Intercept) Sepal.Length #> 0.8031 0.1316 #> #> #> [[2]] #> #> Call: #> lm(formula = Petal.Length ~ Sepal.Length, data = .x) #> #> Coefficients: #> (Intercept) Sepal.Length #> 0.1851 0.6865 #> #> #> [[3]] #> #> Call: #> lm(formula = Petal.Length ~ Sepal.Length, data = .x) #> #> Coefficients: #> (Intercept) Sepal.Length #> 0.6105 0.7501 group_map()
iris %>% group_by(Species) %>% group_map(~ { broom::tidy(lm(Petal.Length ~ Sepal.Length, data
= .x)) %>% tibble::add_column(Species = .y$Species) }) %>% bind_rows() %>% group_by(Species) #> # A tibble: 6 x 6 #> # Groups: Species [3] #> term estimate std.error statistic p.value Species #> <chr> <dbl> <dbl> <dbl> <dbl> <fct> #> 1 (Intercept) 0.803 0.344 2.34 2.38e- 2 setosa #> 2 Sepal.Length 0.132 0.0685 1.92 6.07e- 2 setosa #> 3 (Intercept) 0.185 0.514 0.360 7.20e- 1 versicolor #> 4 Sepal.Length 0.686 0.0863 7.95 2.59e-10 versicolor #> 5 (Intercept) 0.610 0.417 1.46 1.50e- 1 virginica #> 6 Sepal.Length 0.750 0.0630 11.9 6.30e-16 virginica group_modify() diy ! with group_map()
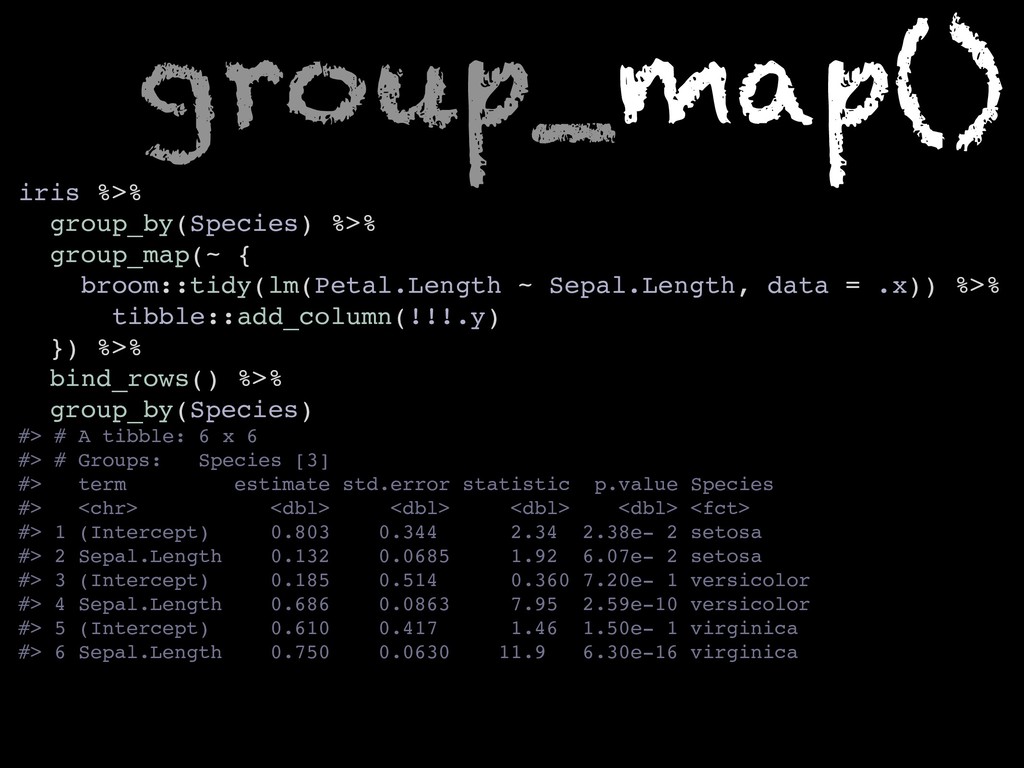
iris %>% group_by(Species) %>% group_map(~ { broom::tidy(lm(Petal.Length ~ Sepal.Length, data
= .x)) %>% tibble::add_column(!!!.y) }) %>% bind_rows() %>% group_by(Species) #> # A tibble: 6 x 6 #> # Groups: Species [3] #> term estimate std.error statistic p.value Species #> <chr> <dbl> <dbl> <dbl> <dbl> <fct> #> 1 (Intercept) 0.803 0.344 2.34 2.38e- 2 setosa #> 2 Sepal.Length 0.132 0.0685 1.92 6.07e- 2 setosa #> 3 (Intercept) 0.185 0.514 0.360 7.20e- 1 versicolor #> 4 Sepal.Length 0.686 0.0863 7.95 2.59e-10 versicolor #> 5 (Intercept) 0.610 0.417 1.46 1.50e- 1 virginica #> 6 Sepal.Length 0.750 0.0630 11.9 6.30e-16 virginica group_map()
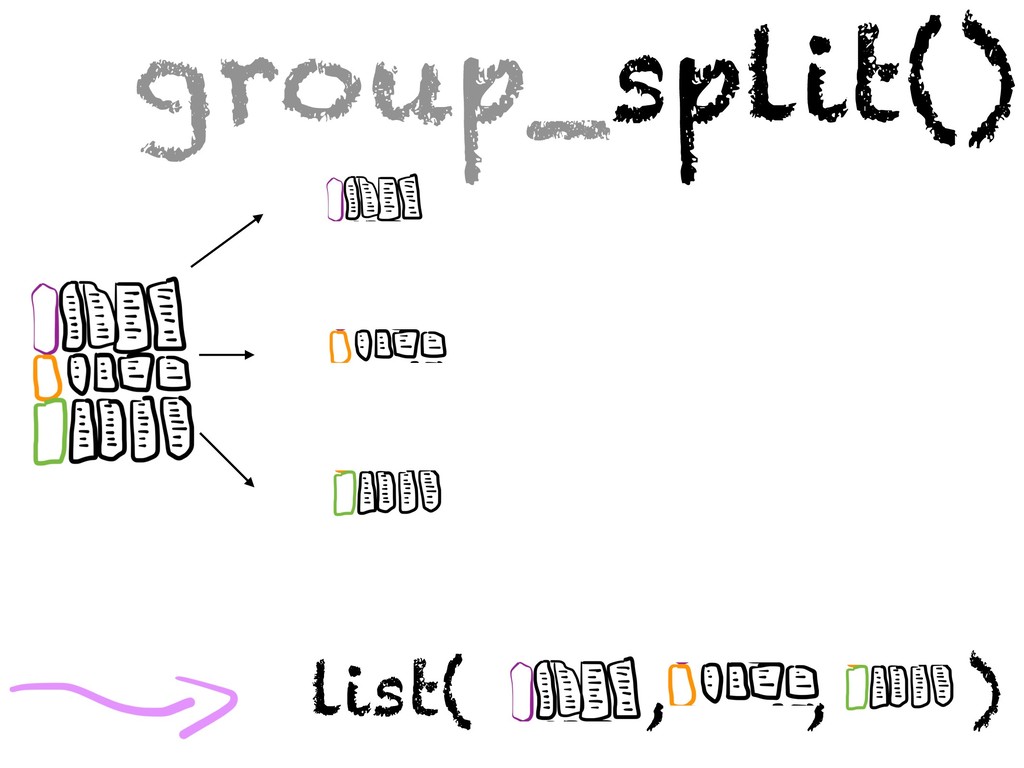
group_split() list( , , )
group_split() iris %>% group_by(Species) %>% group_split() #> [[1]] #> #
A tibble: 50 x 5 #> Sepal.Length Sepal.Width Petal.Length Petal.Width Species #> <dbl> <dbl> <dbl> <dbl> <fct> #> 1 5.1 3.5 1.4 0.2 setosa #> 2 4.9 3 1.4 0.2 setosa #> ... #> #> [[2]] #> # A tibble: 50 x 5 #> Sepal.Length Sepal.Width Petal.Length Petal.Width Species #> <dbl> <dbl> <dbl> <dbl> <fct> #> 1 7 3.2 4.7 1.4 versicolor #> 2 6.4 3.2 4.5 1.5 versicolor #> ... #> [[3]] #> # A tibble: 50 x 5 #> Sepal.Length Sepal.Width Petal.Length Petal.Width Species #> <dbl> <dbl> <dbl> <dbl> <fct> #> 1 6.3 3.3 6 2.5 virginica #> 2 5.8 2.7 5.1 1.9 virginica #> ... #> #> attr(,"ptype") #> # A tibble: 0 x 5 #> # … with 5 variables: Sepal.Length <dbl>, Sepal.Width <dbl>, #> # Petal.Length <dbl>, Petal.Width <dbl>, Species <fct>
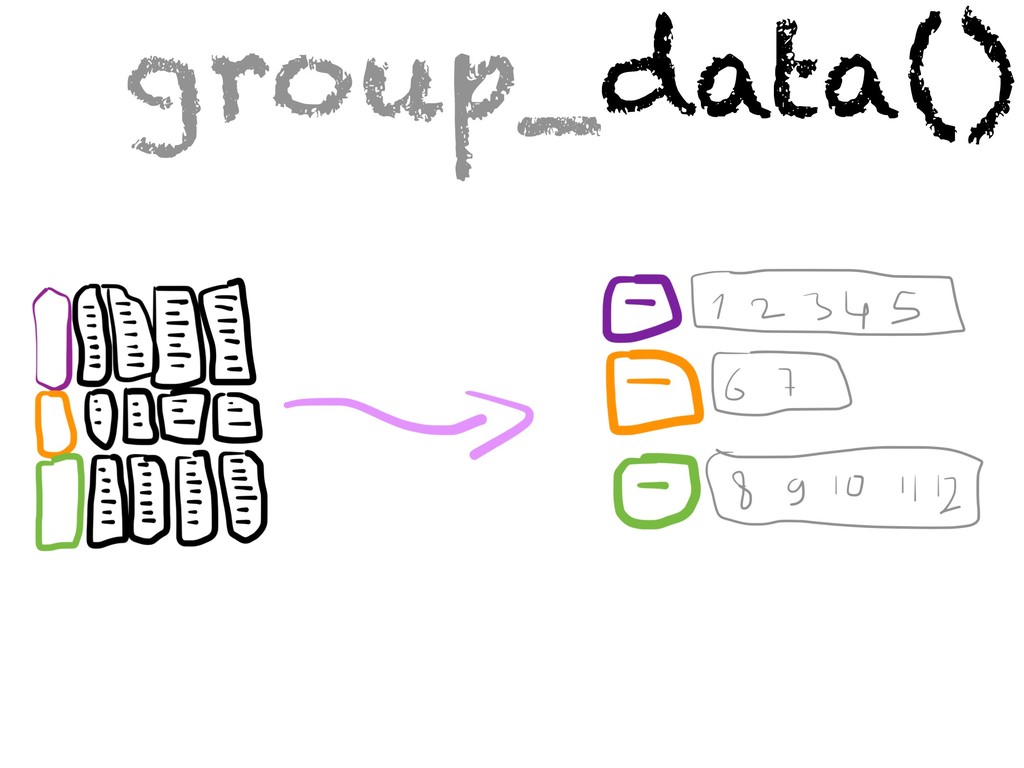
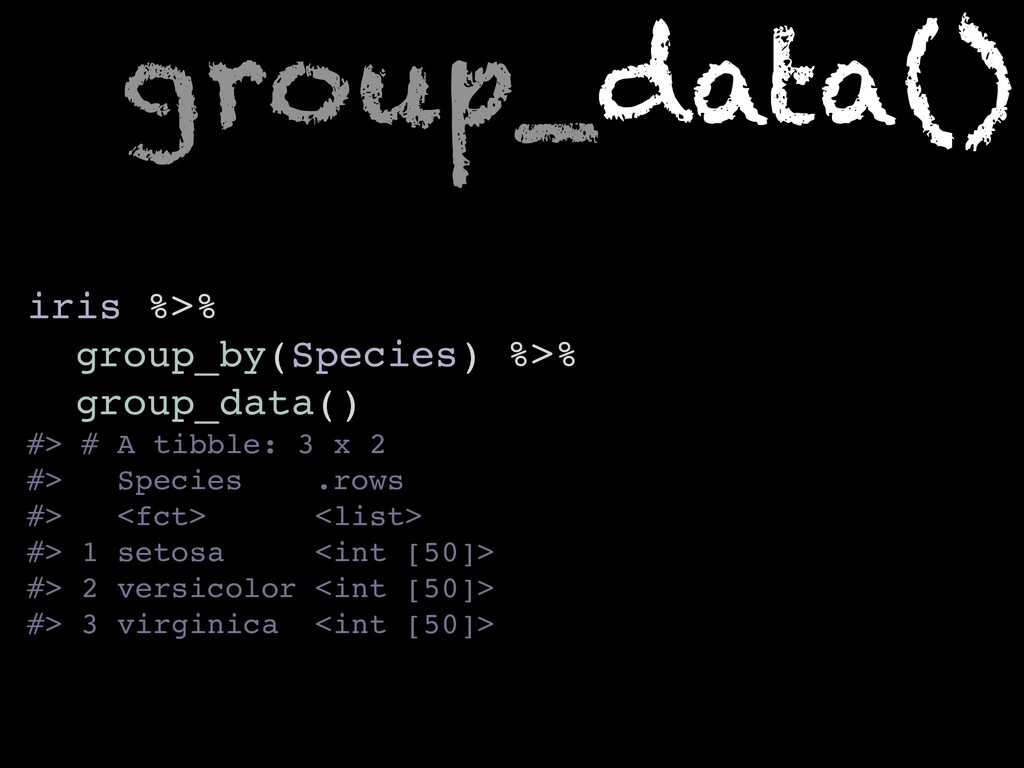
group_data()
group_data() iris %>% group_by(Species) %>% group_data() #> # A tibble:
3 x 2 #> Species .rows #> <fct> <list> #> 1 setosa <int [50]> #> 2 versicolor <int [50]> #> 3 virginica <int [50]>
group_keys()
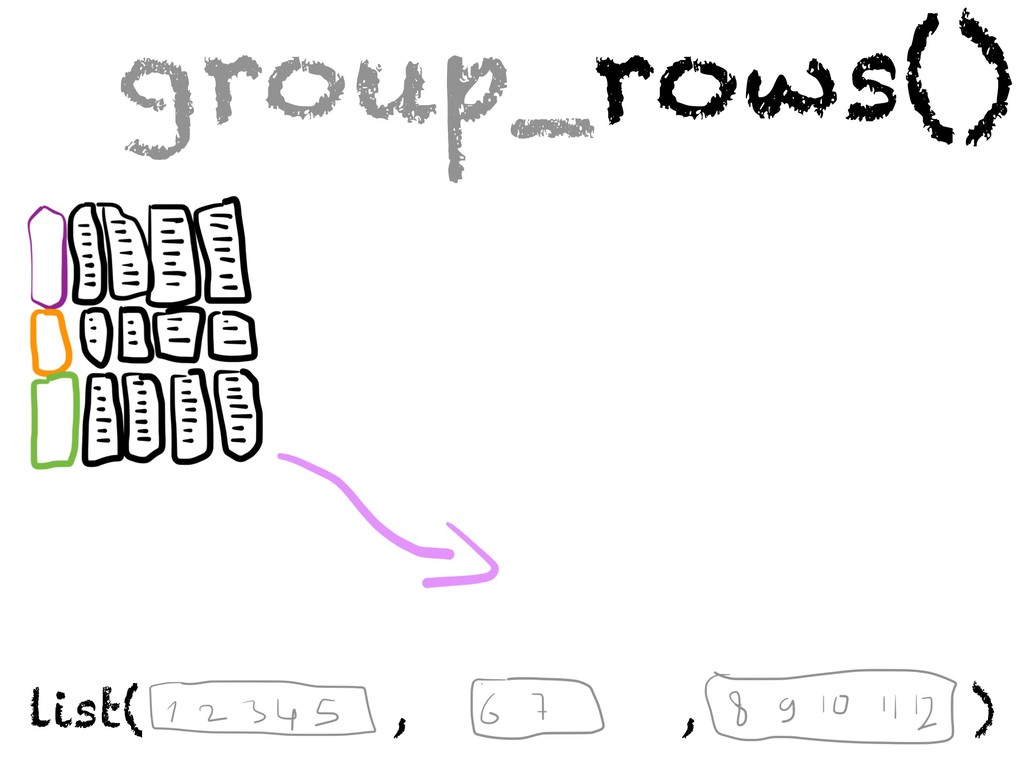
group_rows() list( , , )
group_keys() iris %>% group_by(Species) %>% group_keys() #> # A tibble:
3 x 1 #> Species #> <fct> #> 1 setosa #> 2 versicolor #> 3 virginica
group_rows() iris %>% group_by(Species) %>% group_rows() #> [[1]] #> [1]
1 2 3 4 5 6 7 8 9 10 11 12 13 14 15 16 17 18 19 20 21 22 23 #> [24] 24 25 26 27 28 29 30 31 32 33 34 35 36 37 38 39 40 41 42 43 44 45 46 #> [47] 47 48 49 50 #> #> [[2]] #> [1] 51 52 53 54 55 56 57 58 59 60 61 62 63 64 65 66 67 #> [18] 68 69 70 71 72 73 74 75 76 77 78 79 80 81 82 83 84 #> [35] 85 86 87 88 89 90 91 92 93 94 95 96 97 98 99 100 #> #> [[3]] #> [1] 101 102 103 104 105 106 107 108 109 110 111 112 113 114 115 116 117 #> [18] 118 119 120 121 122 123 124 125 126 127 128 129 130 131 132 133 134 #> [35] 135 136 137 138 139 140 141 142 143 144 145 146 147 148 149 150
colum n w ise https://unsplash.com/photos/DELDTYAjPrg Select colum ns, Act on
each
iris %>% group_by(Species) %>% summarise( Petal.Width = mean(Petal.Width), Petal.Length =
mean(Petal.Length), Sepal.Width = mean(Sepal.Width), Sepal.Length = mean(Sepal.Length) ) #> # A tibble: 3 x 5 #> Species Petal.Width Petal.Length Sepal.Width Sepal.Length #> <fct> <dbl> <dbl> <dbl> <dbl> #> 1 setosa 0.246 1.46 3.43 5.01 #> 2 versicolor 1.33 4.26 2.77 5.94 #> 3 virginica 2.03 5.55 2.97 6.59 action Selection
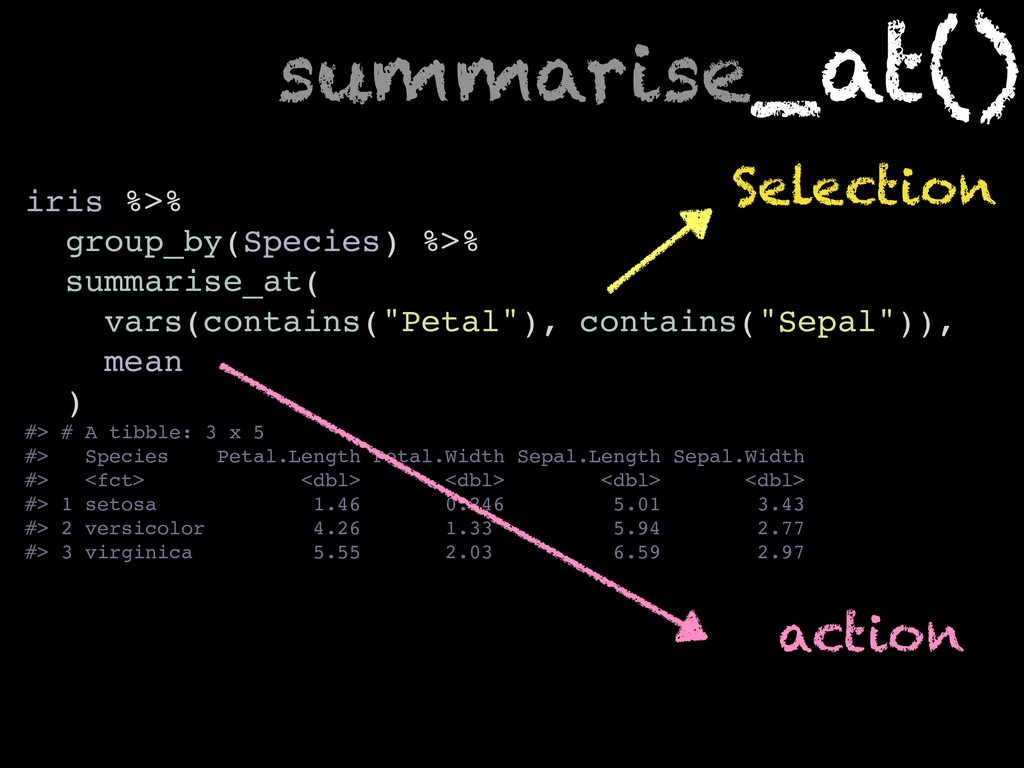
iris %>% group_by(Species) %>% summarise_at( vars(contains("Petal"), contains("Sepal")), mean ) #>
# A tibble: 3 x 5 #> Species Petal.Length Petal.Width Sepal.Length Sepal.Width #> <fct> <dbl> <dbl> <dbl> <dbl> #> 1 setosa 1.46 0.246 5.01 3.43 #> 2 versicolor 4.26 1.33 5.94 2.77 #> 3 virginica 5.55 2.03 6.59 2.97 action Selection summarise_at()
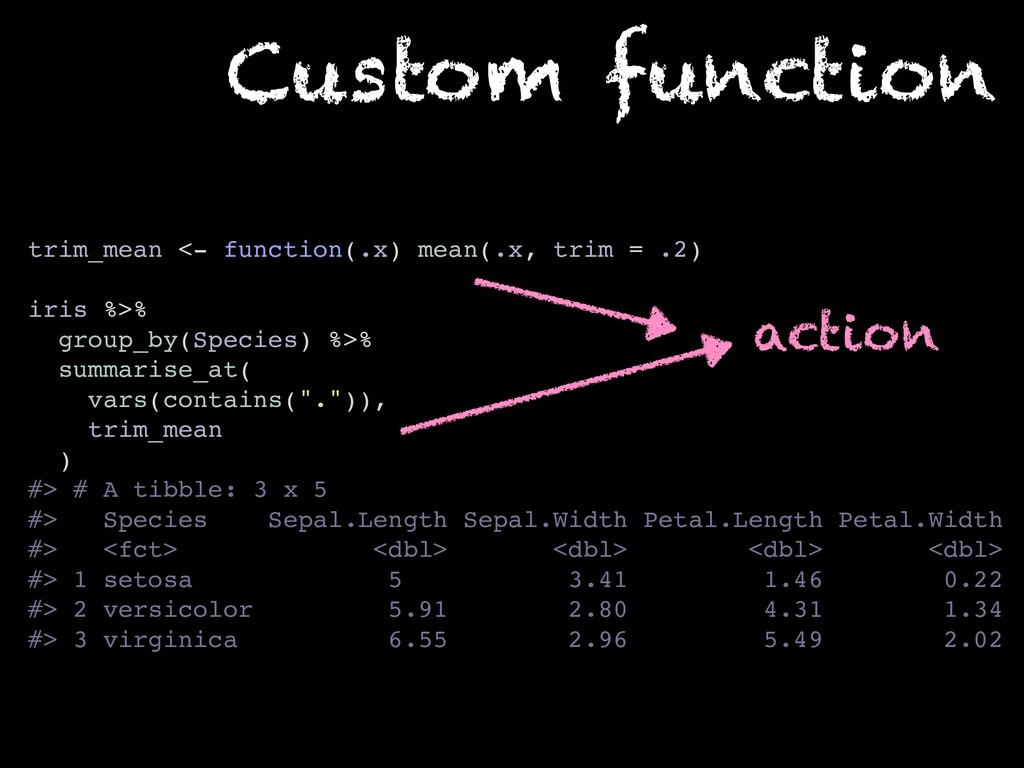
trim_mean <- function(.x) mean(.x, trim = .2) iris %>% group_by(Species)
%>% summarise_at( vars(contains(".")), trim_mean ) #> # A tibble: 3 x 5 #> Species Sepal.Length Sepal.Width Petal.Length Petal.Width #> <fct> <dbl> <dbl> <dbl> <dbl> #> 1 setosa 5 3.41 1.46 0.22 #> 2 versicolor 5.91 2.80 4.31 1.34 #> 3 virginica 6.55 2.96 5.49 2.02 action Custom function
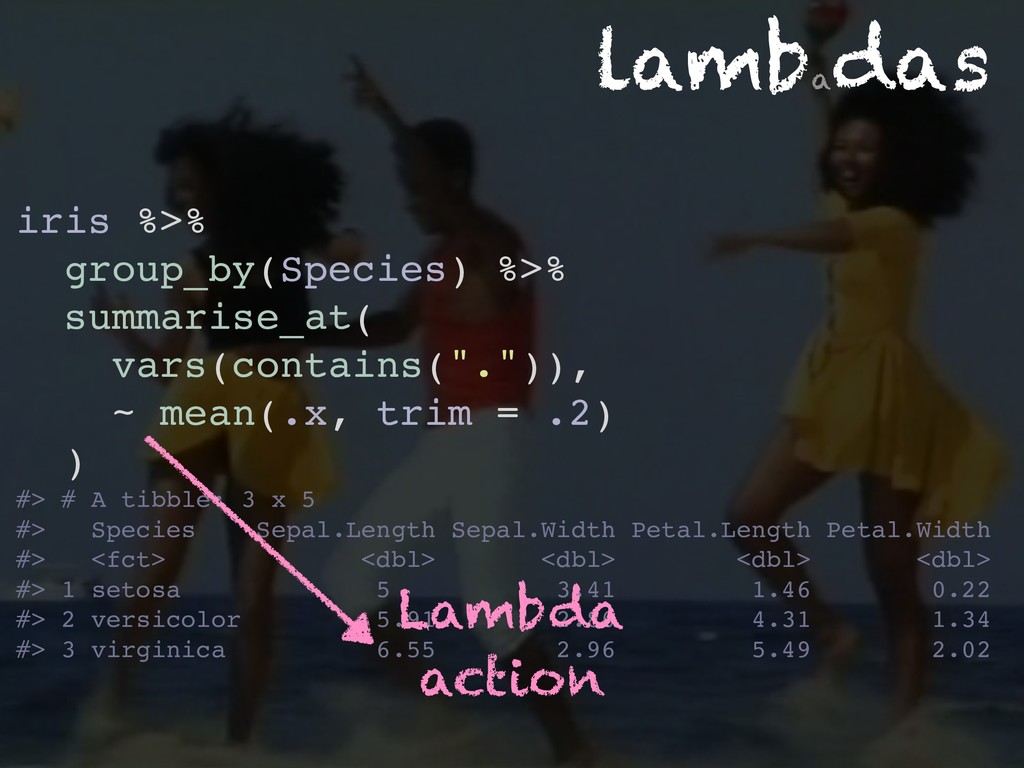
lamba das iris %>% group_by(Species) %>% summarise_at( vars(contains(".")), ~ mean(.x,
trim = .2) ) #> # A tibble: 3 x 5 #> Species Sepal.Length Sepal.Width Petal.Length Petal.Width #> <fct> <dbl> <dbl> <dbl> <dbl> #> 1 setosa 5 3.41 1.46 0.22 #> 2 versicolor 5.91 2.80 4.31 1.34 #> 3 virginica 6.55 2.96 5.49 2.02 Lambda action
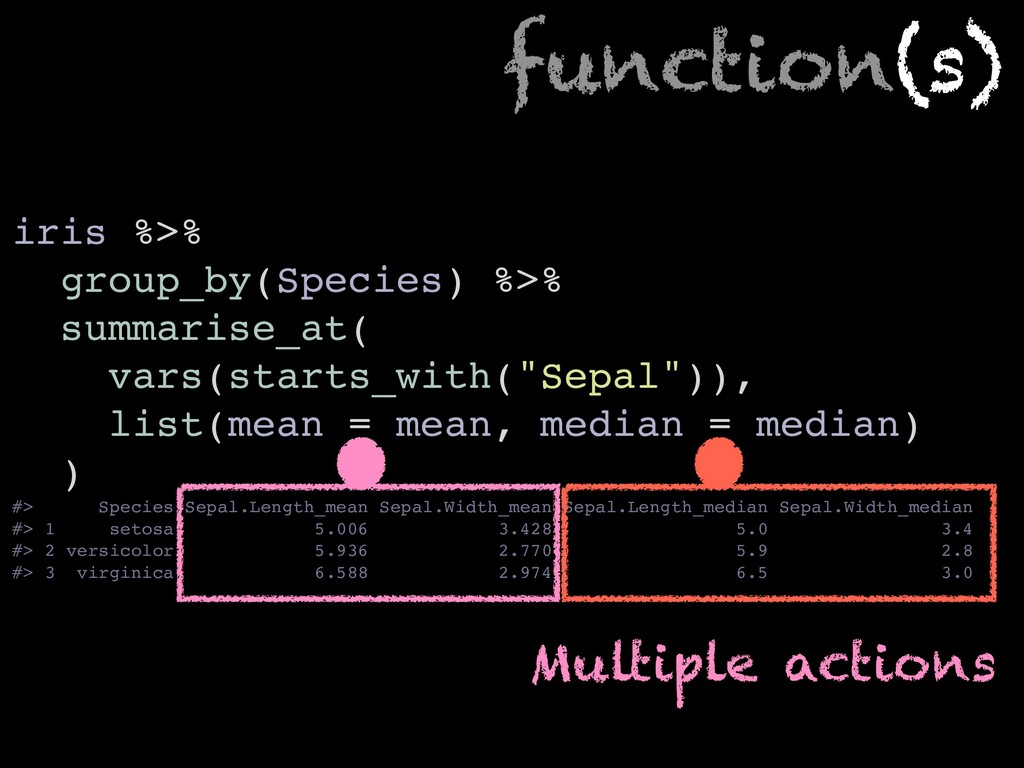
function(s) iris %>% group_by(Species) %>% summarise_at( vars(starts_with("Sepal")), list(mean = mean,
median = median) ) #> Species Sepal.Length_mean Sepal.Width_mean Sepal.Length_median Sepal.Width_median #> 1 setosa 5.006 3.428 5.0 3.4 #> 2 versicolor 5.936 2.770 5.9 2.8 #> 3 virginica 6.588 2.974 6.5 3.0 Multiple actions
function(s) + lambda(s) iris %>% group_by(Species) %>% summarise_at( vars(starts_with("Sepal")), list(
mean = ~ mean(.x, trim = .2), median = median ) ) #> Species Sepal.Length_mean Sepal.Width_mean Sepal.Length_median Sepal.Width_median #> 1 setosa 5.000000 3.410000 5.0 3.4 #> 2 versicolor 5.910000 2.796667 5.9 2.8 #> 3 virginica 6.546667 2.963333 6.5 3.0
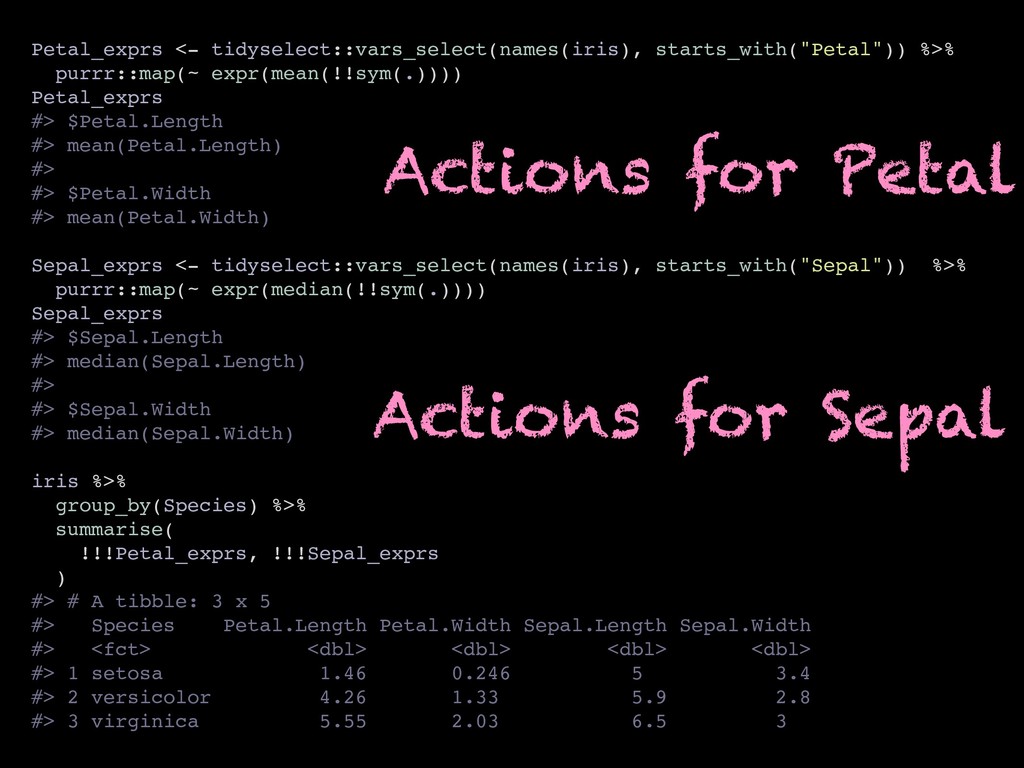
Actions for Petal Petal_exprs <- tidyselect::vars_select(names(iris), starts_with("Petal")) %>% purrr::map(~ expr(mean(!!sym(.))))
Petal_exprs #> $Petal.Length #> mean(Petal.Length) #> #> $Petal.Width #> mean(Petal.Width) Sepal_exprs <- tidyselect::vars_select(names(iris), starts_with("Sepal")) %>% purrr::map(~ expr(median(!!sym(.)))) Sepal_exprs #> $Sepal.Length #> median(Sepal.Length) #> #> $Sepal.Width #> median(Sepal.Width) iris %>% group_by(Species) %>% summarise( !!!Petal_exprs, !!!Sepal_exprs ) #> # A tibble: 3 x 5 #> Species Petal.Length Petal.Width Sepal.Length Sepal.Width #> <fct> <dbl> <dbl> <dbl> <dbl> #> 1 setosa 1.46 0.246 5 3.4 #> 2 versicolor 4.26 1.33 5.9 2.8 #> 3 virginica 5.55 2.03 6.5 3 Actions for Sepal
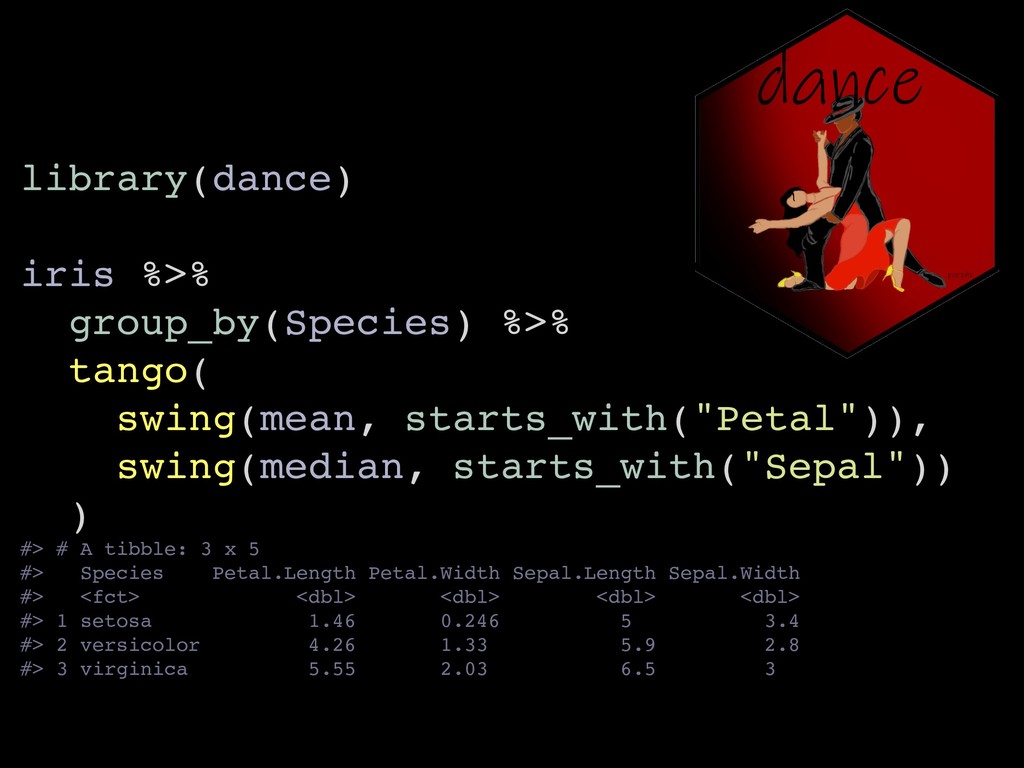
library(dance) iris %>% group_by(Species) %>% tango( swing(mean, starts_with("Petal")), swing(median, starts_with("Sepal"))
) #> # A tibble: 3 x 5 #> Species Petal.Length Petal.Width Sepal.Length Sepal.Width #> <fct> <dbl> <dbl> <dbl> <dbl> #> 1 setosa 1.46 0.246 5 3.4 #> 2 versicolor 4.26 1.33 5.9 2.8 #> 3 virginica 5.55 2.03 6.5 3
n() cool # dplyr things Rom ain François @romain_francois useR!
2019 - Toulouse - 2019/07/10
![group_split() iris %>% group_by(Species) %>% group_split() #> [[1]] #> #](https://files.speakerdeck.com/presentations/ec58d557fcd74c4391d70df139118c69/slide_10.jpg)
![group_rows() iris %>% group_by(Species) %>% group_rows() #> [[1]] #> [1]](https://files.speakerdeck.com/presentations/ec58d557fcd74c4391d70df139118c69/slide_16.jpg)