Upgrade to Pro
— share decks privately, control downloads, hide ads and more …
Speaker Deck
Features
Speaker Deck
PRO
Sign in
Sign up for free
Search
Search
dplyr episode 9, summarise() of the vctrs
Search
Romain François
November 04, 2019
Technology
1k
0
Share
Embed
Copy iframe code
Copy JS code
Copy link
Start on current slide
dplyr episode 9, summarise() of the vctrs
Romain François
November 04, 2019
More Decks by Romain François
See All by Romain François
dplyr 1.0.0 / Paris R-addicts
romainfrancois
0
260
dplyr 1.0.0
romainfrancois
1
1.3k
dplyr episode 9: summarise() of the vctrs
romainfrancois
0
360
n() cool #dplyr things
romainfrancois
2
3k
dance
romainfrancois
0
300
rap and splice girls
romainfrancois
0
410
rap
romainfrancois
0
140
arrow + ergo
romainfrancois
0
390
ergo
romainfrancois
0
290
Other Decks in Technology
See All in Technology
脱Jenkins、インターン生が挑んだCIツールGitHubActions移行
mixi_engineers
PRO
1
210
データと地図で読む 大井町の「かわるもの、かわらないもの」
yoshiyama_hana
0
500
実践が先生だった— 新卒サーバーエンジニア1年目のリアル
mixi_engineers
PRO
0
170
Webアプリ認証の全体像 / The Big Picture of Web App Authentication
kitano_yuichi
1
470
大 AI 時代におけるC# の事情 ~ぶっちゃけトークを交えながら~
nenonaninu
1
430
現場との対話から始める “作る前に問い直す”業務改善
mochico50
2
330
Azure Durable Functions で作った NL2SQL Agent の精度向上に取り組んだ話/aidevday2026
thara0402
0
110
書籍セキュアAPIについて
riiimparm
0
360
Webの技術とガジェットで子どもも大人も楽しめるワクワク体験を提供する / Qiita Tech Festa Day 2026
you
PRO
1
300
「休む」重要さ
smt7174
7
1.8k
StepFunctionsとGraphRAGを活用した暗黙知活用のためのRAG基盤
yakumo
0
180
DevOps Agentで運用判断をチーム資産にする ~Agent InstructionsとAgent Skillを継続的に育てる~
fujioka6789
0
150
Featured
See All Featured
Art, The Web, and Tiny UX
lynnandtonic
304
22k
The Anti-SEO Checklist Checklist. Pubcon Cyber Week
ryanjones
0
190
Fashionably flexible responsive web design (full day workshop)
malarkey
408
67k
The AI Search Optimization Roadmap by Aleyda Solis
aleyda
1
6k
brightonSEO & MeasureFest 2025 - Christian Goodrich - Winning strategies for Black Friday CRO & PPC
cargoodrich
3
760
How to Get Subject Matter Experts Bought In and Actively Contributing to SEO & PR Initiatives.
livdayseo
0
160
Accessibility Awareness
sabderemane
1
160
Facilitating Awesome Meetings
lara
57
7k
Applied NLP in the Age of Generative AI
inesmontani
PRO
4
2.4k
Creating an realtime collaboration tool: Agile Flush - .NET Oxford
marcduiker
35
2.5k
Money Talks: Using Revenue to Get Sh*t Done
nikkihalliwell
0
420
Connecting the Dots Between Site Speed, User Experience & Your Business [WebExpo 2025]
tammyeverts
11
980
Transcript
dplyr episode 9 The rise of the vctrs @romain_francois RLadies
Lyon 2019/11/04
dplyr episode 9 summarise() of the vctrs @romain_francois RLadies Lyon
2019/11/04
None
None
None
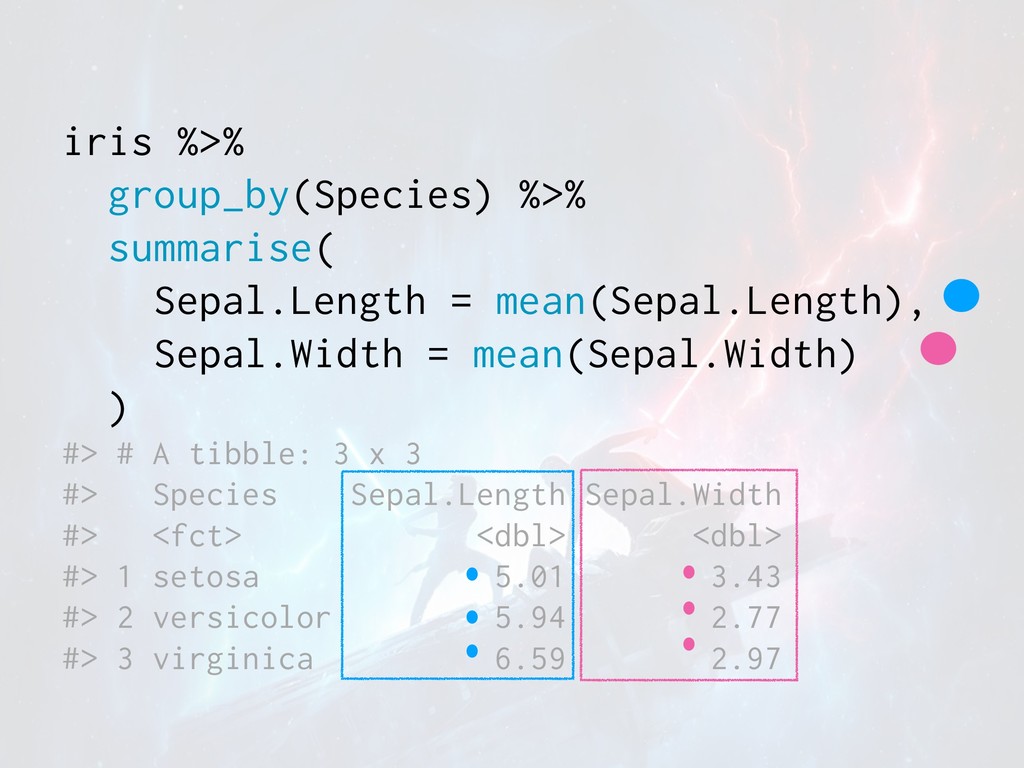
iris %>% group_by(Species) %>% summarise( Sepal.Length = mean(Sepal.Length), Sepal.Width =
mean(Sepal.Width) ) #> # A tibble: 3 x 3 #> Species Sepal.Length Sepal.Width #> <fct> <dbl> <dbl> #> 1 setosa 5.01 3.43 #> 2 versicolor 5.94 2.77 #> 3 virginica 6.59 2.97
packing The em pire packs back
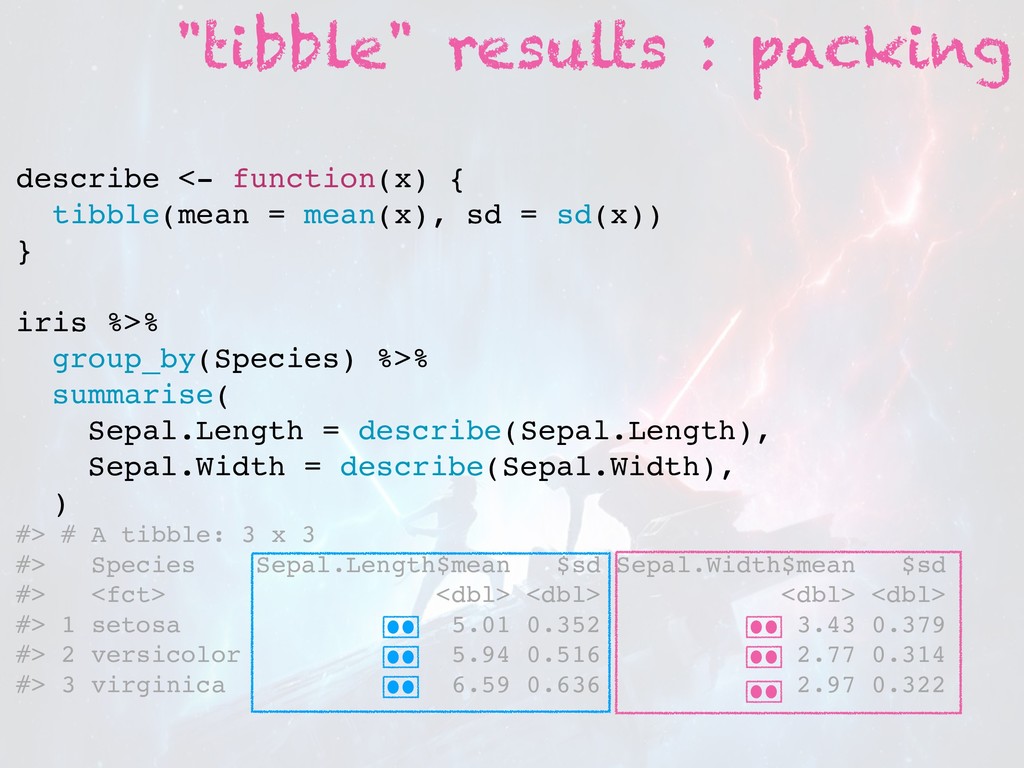
describe <- function(x) { tibble(mean = mean(x), sd = sd(x))
} iris %>% group_by(Species) %>% summarise( Sepal.Length = describe(Sepal.Length), Sepal.Width = describe(Sepal.Width), ) #> # A tibble: 3 x 3 #> Species Sepal.Length$mean $sd Sepal.Width$mean $sd #> <fct> <dbl> <dbl> <dbl> <dbl> #> 1 setosa 5.01 0.352 3.43 0.379 #> 2 versicolor 5.94 0.516 2.77 0.314 #> 3 virginica 6.59 0.636 2.97 0.322 "tibble" results : packing
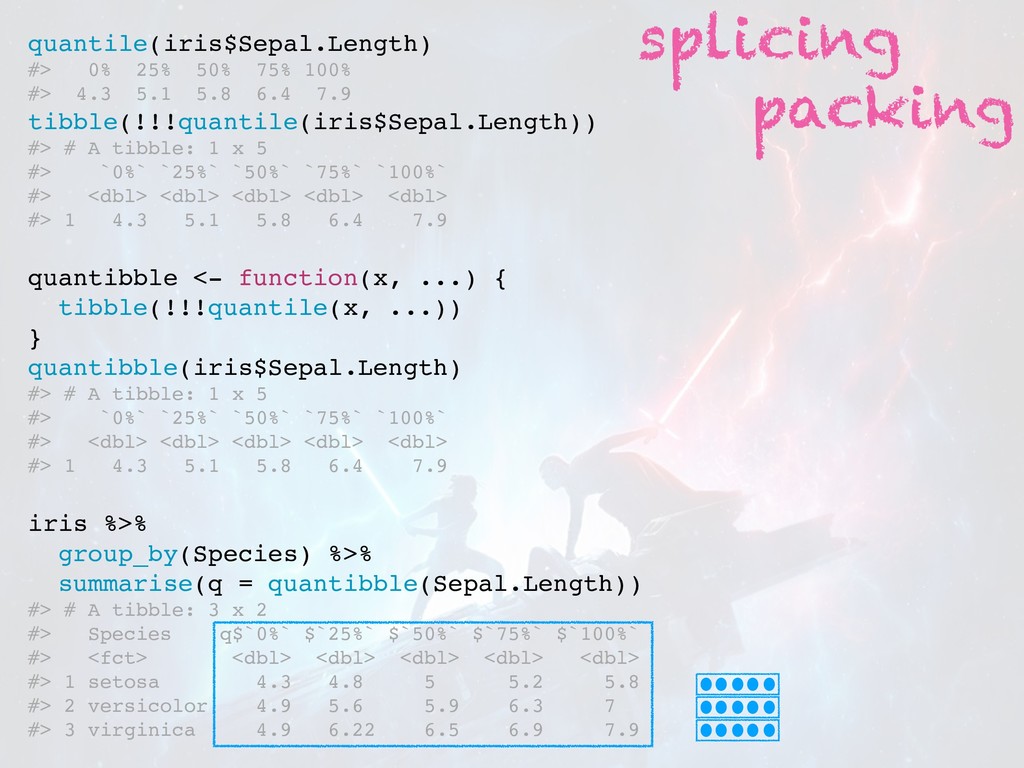
quantile(iris$Sepal.Length) #> 0% 25% 50% 75% 100% #> 4.3 5.1
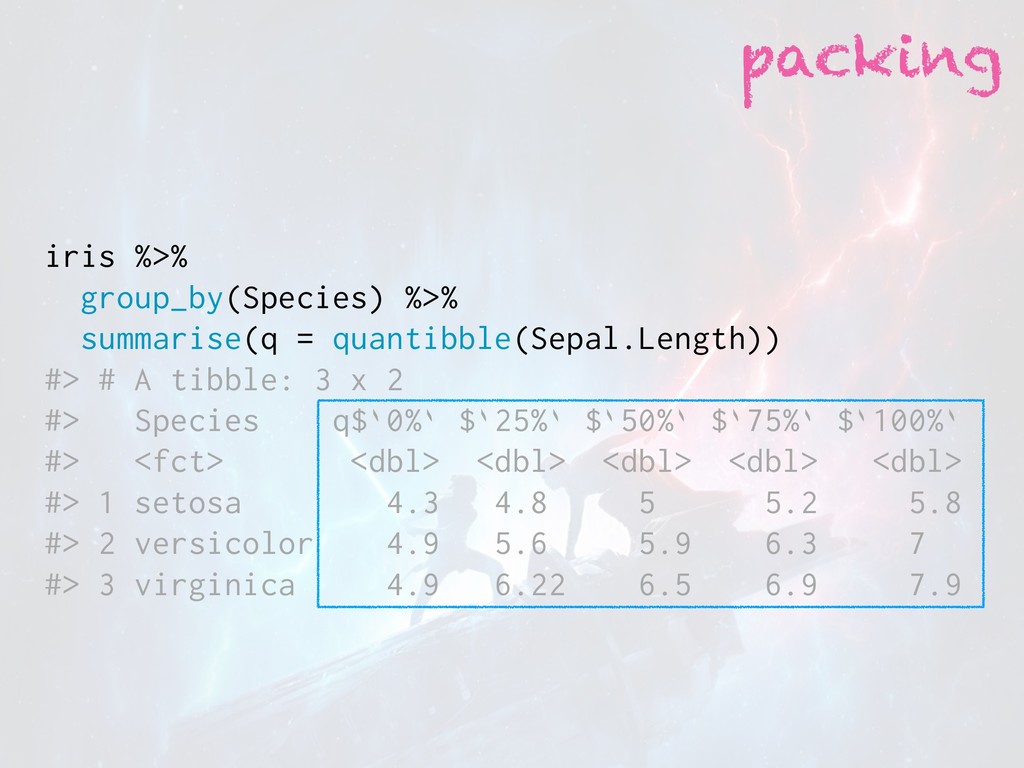
5.8 6.4 7.9 tibble(!!!quantile(iris$Sepal.Length)) #> # A tibble: 1 x 5 #> `0%` `25%` `50%` `75%` `100%` #> <dbl> <dbl> <dbl> <dbl> <dbl> #> 1 4.3 5.1 5.8 6.4 7.9 quantibble <- function(x, ...) { tibble(!!!quantile(x, ...)) } quantibble(iris$Sepal.Length) #> # A tibble: 1 x 5 #> `0%` `25%` `50%` `75%` `100%` #> <dbl> <dbl> <dbl> <dbl> <dbl> #> 1 4.3 5.1 5.8 6.4 7.9 iris %>% group_by(Species) %>% summarise(q = quantibble(Sepal.Length)) #> # A tibble: 3 x 2 #> Species q$`0%` $`25%` $`50%` $`75%` $`100%` #> <fct> <dbl> <dbl> <dbl> <dbl> <dbl> #> 1 setosa 4.3 4.8 5 5.2 5.8 #> 2 versicolor 4.9 5.6 5.9 6.3 7 #> 3 virginica 4.9 6.22 6.5 6.9 7.9 packing splicing
iris %>% group_by(Species) %>% summarise(q = quantibble(Sepal.Length)) #> # A
tibble: 3 x 2 #> Species q$`0%` $`25%` $`50%` $`75%` $`100%` #> <fct> <dbl> <dbl> <dbl> <dbl> <dbl> #> 1 setosa 4.3 4.8 5 5.2 5.8 #> 2 versicolor 4.9 5.6 5.9 6.3 7 #> 3 virginica 4.9 6.22 6.5 6.9 7.9 packing
auto splice Revenge of the splice auto splice Revenge of
the splice
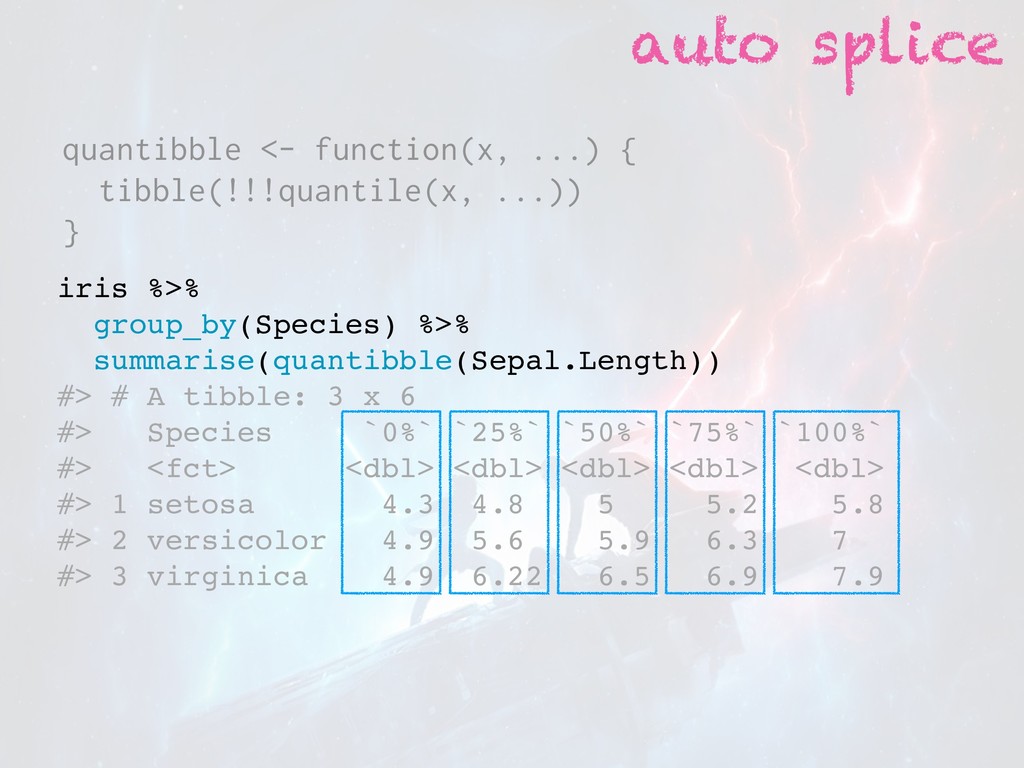
iris %>% group_by(Species) %>% summarise(quantibble(Sepal.Length)) #> # A tibble: 3
x 6 #> Species `0%` `25%` `50%` `75%` `100%` #> <fct> <dbl> <dbl> <dbl> <dbl> <dbl> #> 1 setosa 4.3 4.8 5 5.2 5.8 #> 2 versicolor 4.9 5.6 5.9 6.3 7 #> 3 virginica 4.9 6.22 6.5 6.9 7.9 quantibble <- function(x, ...) { tibble(!!!quantile(x, ...)) } auto splice
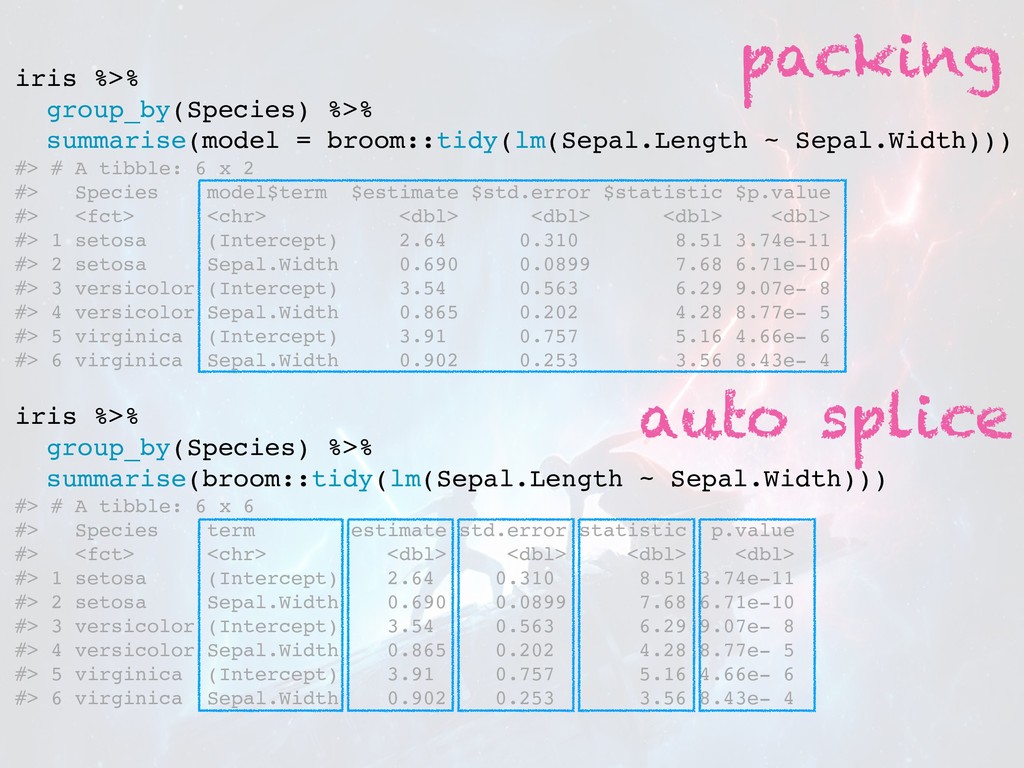
iris %>% group_by(Species) %>% summarise(model = broom::tidy(lm(Sepal.Length ~ Sepal.Width))) #>
# A tibble: 6 x 2 #> Species model$term $estimate $std.error $statistic $p.value #> <fct> <chr> <dbl> <dbl> <dbl> <dbl> #> 1 setosa (Intercept) 2.64 0.310 8.51 3.74e-11 #> 2 setosa Sepal.Width 0.690 0.0899 7.68 6.71e-10 #> 3 versicolor (Intercept) 3.54 0.563 6.29 9.07e- 8 #> 4 versicolor Sepal.Width 0.865 0.202 4.28 8.77e- 5 #> 5 virginica (Intercept) 3.91 0.757 5.16 4.66e- 6 #> 6 virginica Sepal.Width 0.902 0.253 3.56 8.43e- 4 iris %>% group_by(Species) %>% summarise(broom::tidy(lm(Sepal.Length ~ Sepal.Width))) #> # A tibble: 6 x 6 #> Species term estimate std.error statistic p.value #> <fct> <chr> <dbl> <dbl> <dbl> <dbl> #> 1 setosa (Intercept) 2.64 0.310 8.51 3.74e-11 #> 2 setosa Sepal.Width 0.690 0.0899 7.68 6.71e-10 #> 3 versicolor (Intercept) 3.54 0.563 6.29 9.07e- 8 #> 4 versicolor Sepal.Width 0.865 0.202 4.28 8.77e- 5 #> 5 virginica (Intercept) 3.91 0.757 5.16 4.66e- 6 #> 6 virginica Sepal.Width 0.902 0.253 3.56 8.43e- 4 packing auto splice
across() aw akens
summarise( across(<selection>, <function> ) )
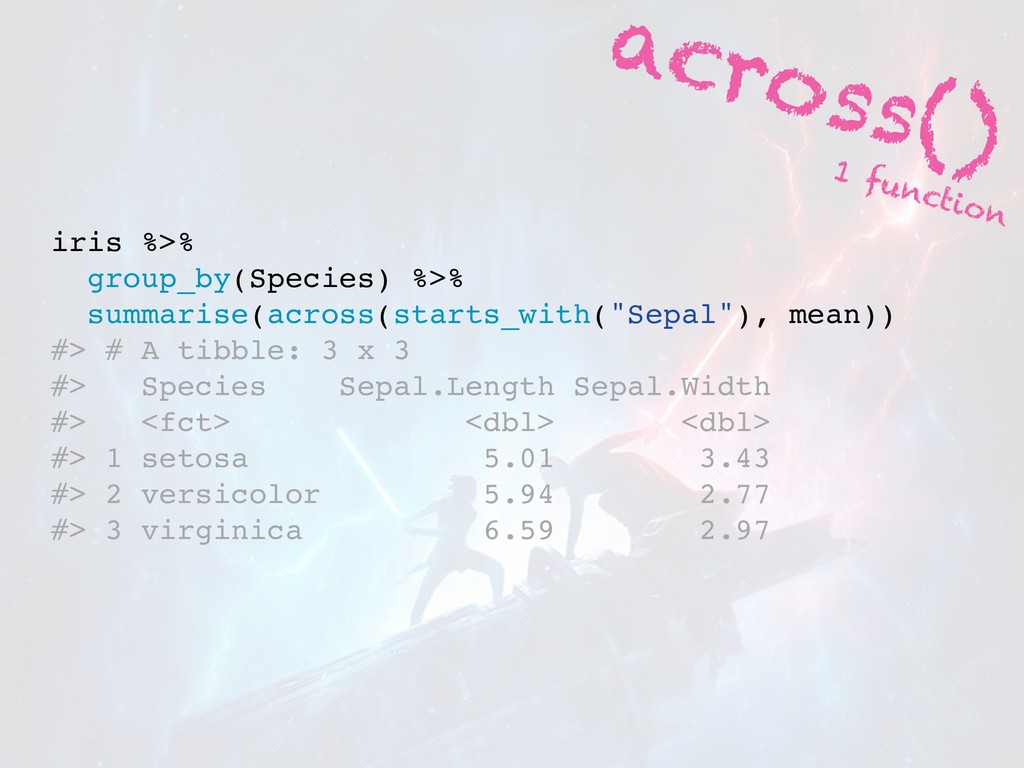
across() iris %>% group_by(Species) %>% summarise(across(starts_with("Sepal"), mean)) #> # A
tibble: 3 x 3 #> Species Sepal.Length Sepal.Width #> <fct> <dbl> <dbl> #> 1 setosa 5.01 3.43 #> 2 versicolor 5.94 2.77 #> 3 virginica 6.59 2.97 1 function
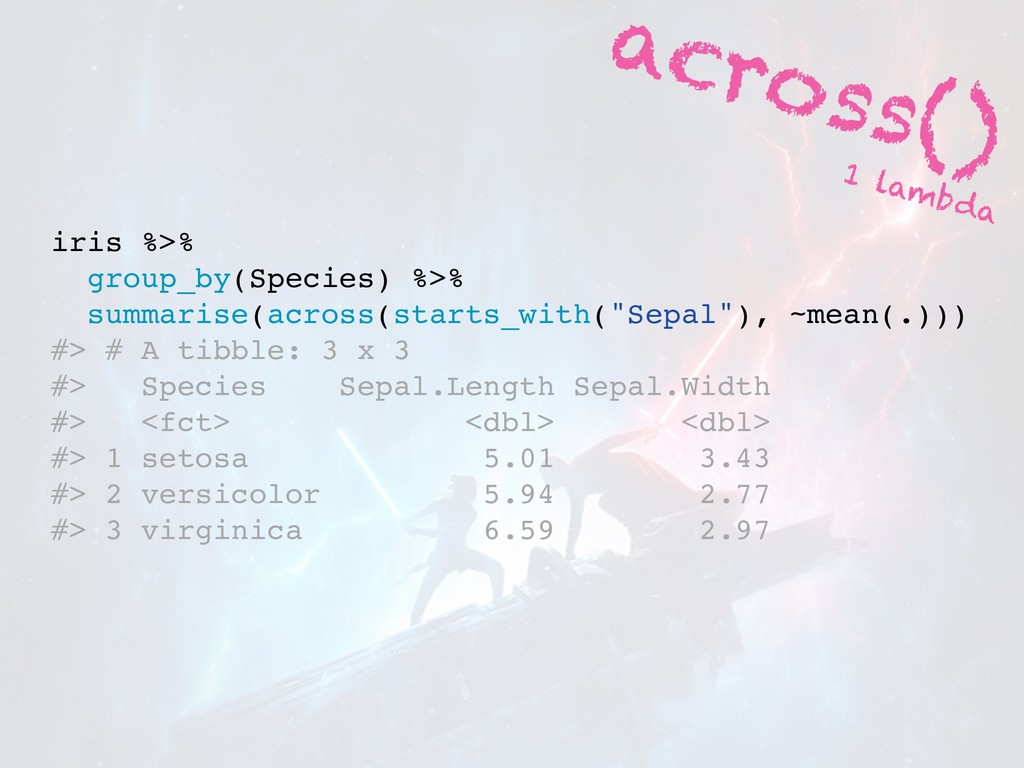
across() iris %>% group_by(Species) %>% summarise(across(starts_with("Sepal"), ~mean(.))) #> # A
tibble: 3 x 3 #> Species Sepal.Length Sepal.Width #> <fct> <dbl> <dbl> #> 1 setosa 5.01 3.43 #> 2 versicolor 5.94 2.77 #> 3 virginica 6.59 2.97 1 lambda
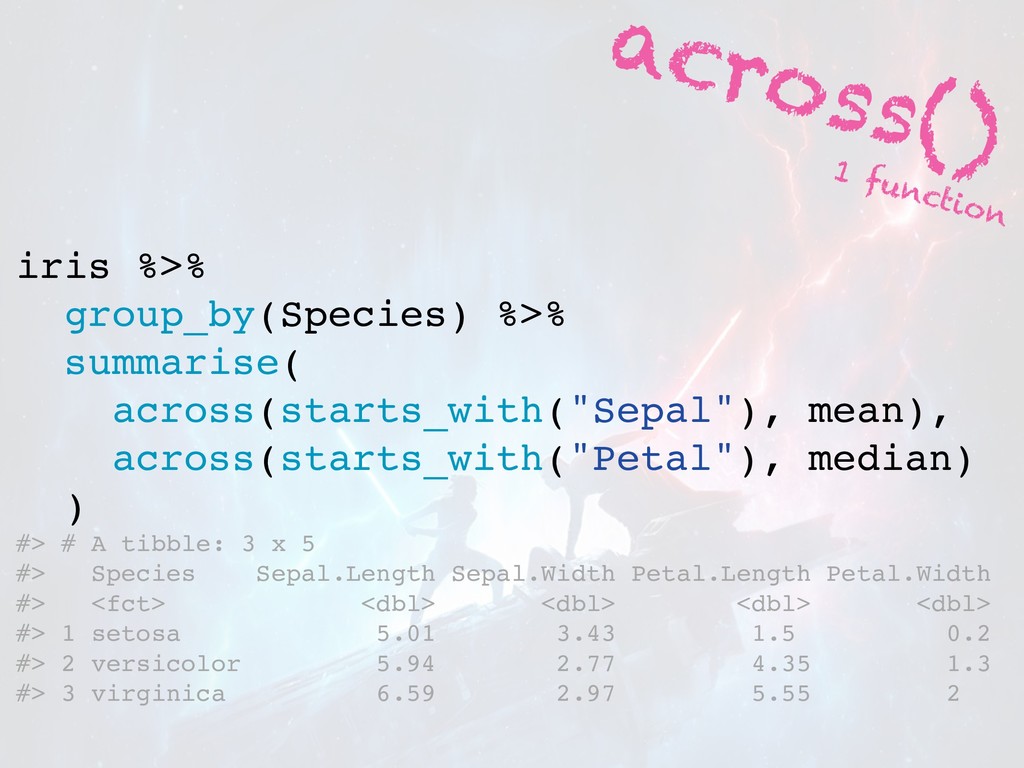
across() 1 function iris %>% group_by(Species) %>% summarise( across(starts_with("Sepal"), mean),
across(starts_with("Petal"), median) ) #> # A tibble: 3 x 5 #> Species Sepal.Length Sepal.Width Petal.Length Petal.Width #> <fct> <dbl> <dbl> <dbl> <dbl> #> 1 setosa 5.01 3.43 1.5 0.2 #> 2 versicolor 5.94 2.77 4.35 1.3 #> 3 virginica 6.59 2.97 5.55 2
summarise( across(<selection>, <list of fns> ) )
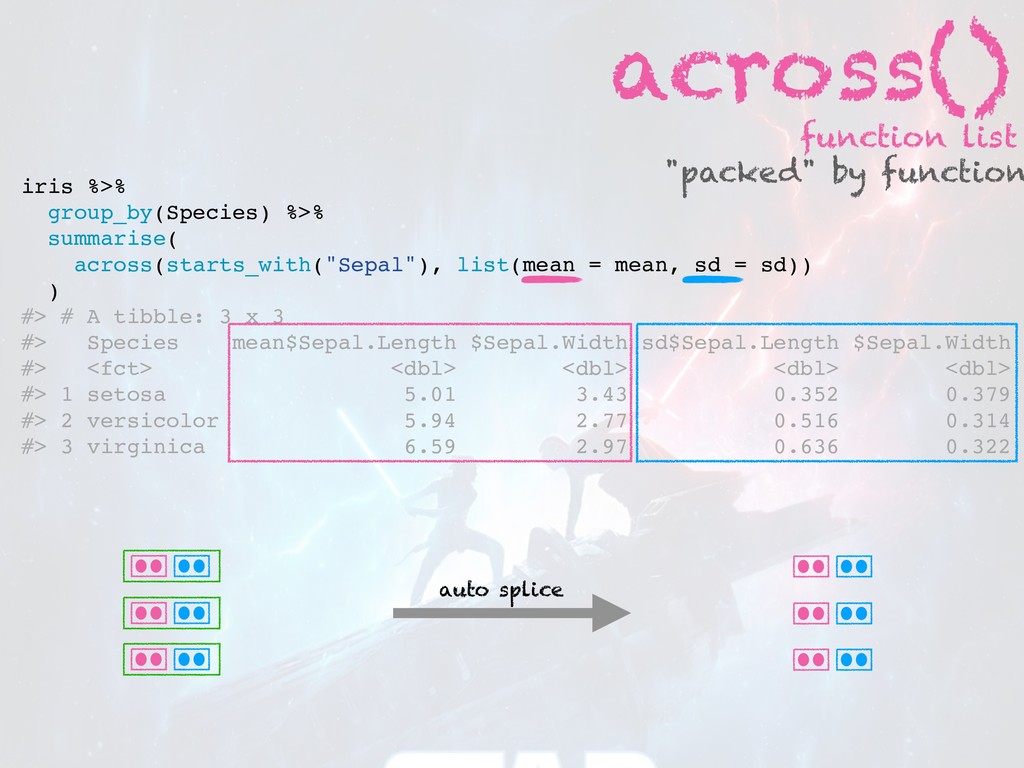
across() function list iris %>% group_by(Species) %>% summarise( across(starts_with("Sepal"), list(mean
= mean, sd = sd)) ) #> # A tibble: 3 x 3 #> Species mean$Sepal.Length $Sepal.Width sd$Sepal.Length $Sepal.Width #> <fct> <dbl> <dbl> <dbl> <dbl> #> 1 setosa 5.01 3.43 0.352 0.379 #> 2 versicolor 5.94 2.77 0.516 0.314 #> 3 virginica 6.59 2.97 0.636 0.322 "packed" by function auto splice
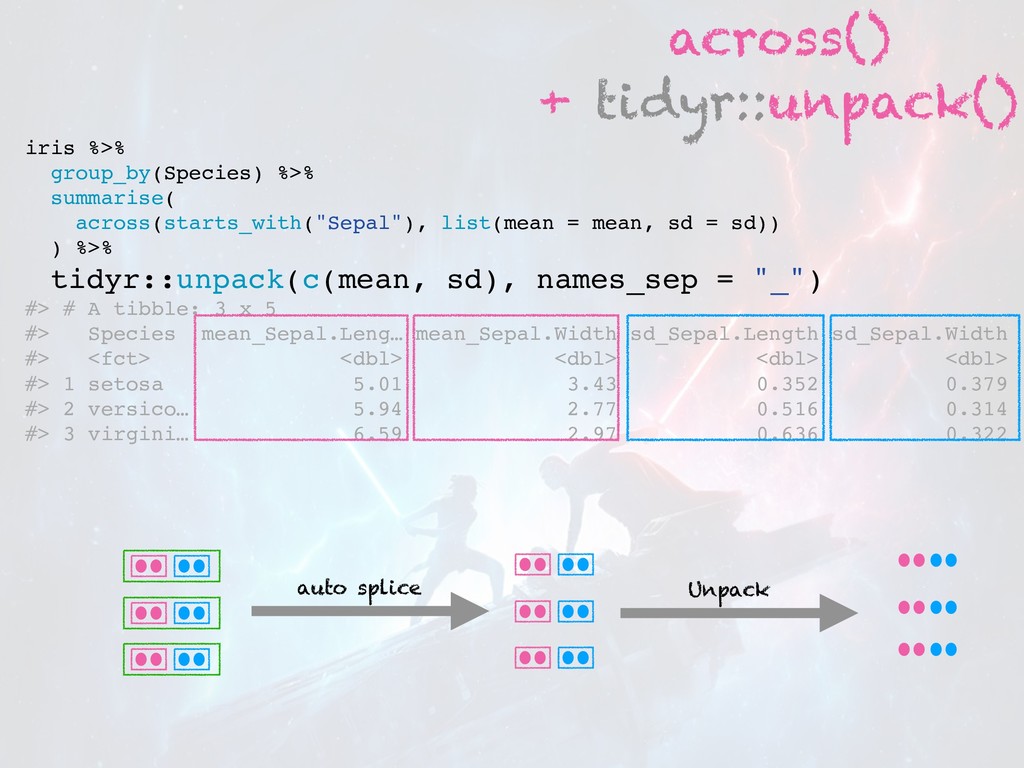
across() + tidyr::unpack() iris %>% group_by(Species) %>% summarise( across(starts_with("Sepal"), list(mean
= mean, sd = sd)) ) %>% tidyr::unpack(c(mean, sd), names_sep = "_") #> # A tibble: 3 x 5 #> Species mean_Sepal.Leng… mean_Sepal.Width sd_Sepal.Length sd_Sepal.Width #> <fct> <dbl> <dbl> <dbl> <dbl> #> 1 setosa 5.01 3.43 0.352 0.379 #> 2 versico… 5.94 2.77 0.516 0.314 #> 3 virgini… 6.59 2.97 0.636 0.322 auto splice Unpack
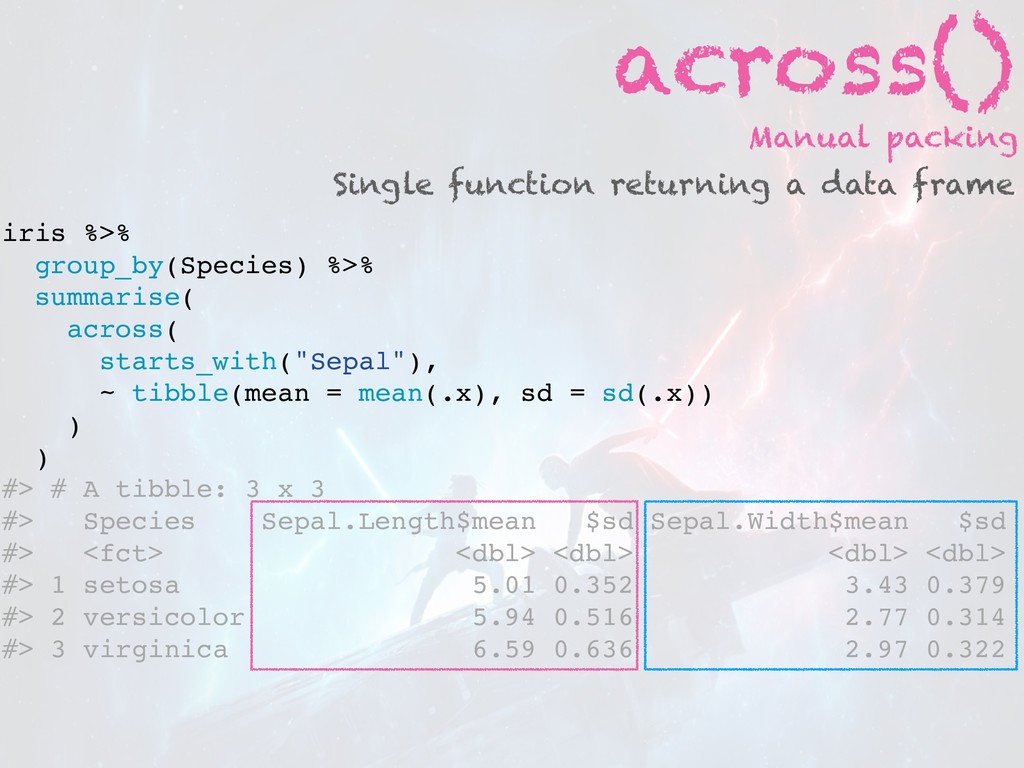
across() Manual packing iris %>% group_by(Species) %>% summarise( across( starts_with("Sepal"),
~ tibble(mean = mean(.x), sd = sd(.x)) ) ) #> # A tibble: 3 x 3 #> Species Sepal.Length$mean $sd Sepal.Width$mean $sd #> <fct> <dbl> <dbl> <dbl> <dbl> #> 1 setosa 5.01 0.352 3.43 0.379 #> 2 versicolor 5.94 0.516 2.77 0.314 #> 3 virginica 6.59 0.636 2.97 0.322 Single function returning a data frame
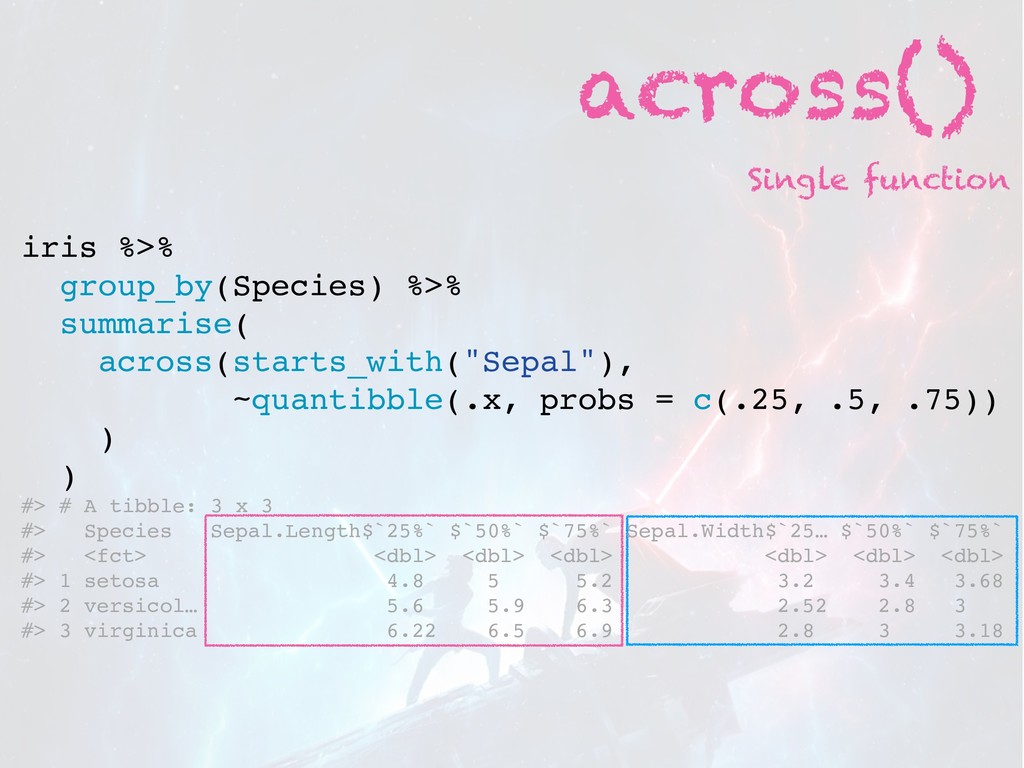
across() Single function iris %>% group_by(Species) %>% summarise( across(starts_with("Sepal"), ~quantibble(.x,
probs = c(.25, .5, .75)) ) ) #> # A tibble: 3 x 3 #> Species Sepal.Length$`25%` $`50%` $`75%` Sepal.Width$`25… $`50%` $`75%` #> <fct> <dbl> <dbl> <dbl> <dbl> <dbl> <dbl> #> 1 setosa 4.8 5 5.2 3.2 3.4 3.68 #> 2 versicol… 5.6 5.9 6.3 2.52 2.8 3 #> 3 virginica 6.22 6.5 6.9 2.8 3 3.18
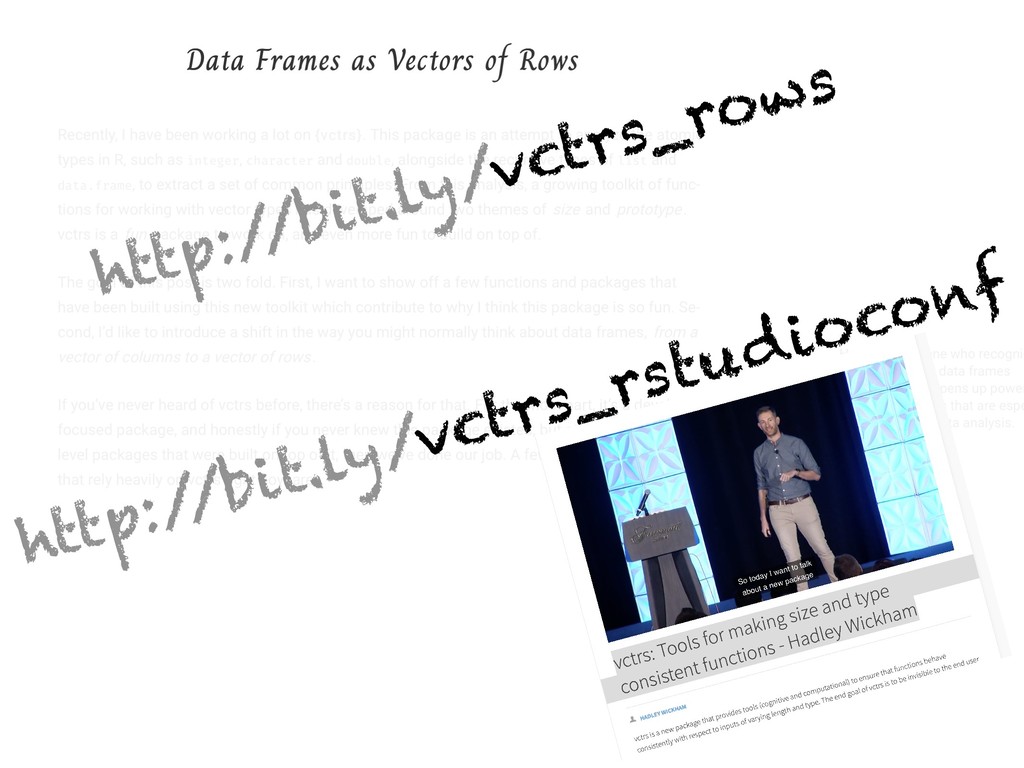
http:/ /bit.ly/vctrs_rows http:/ /bit.ly/vctrs_rstudioconf
Questions ?
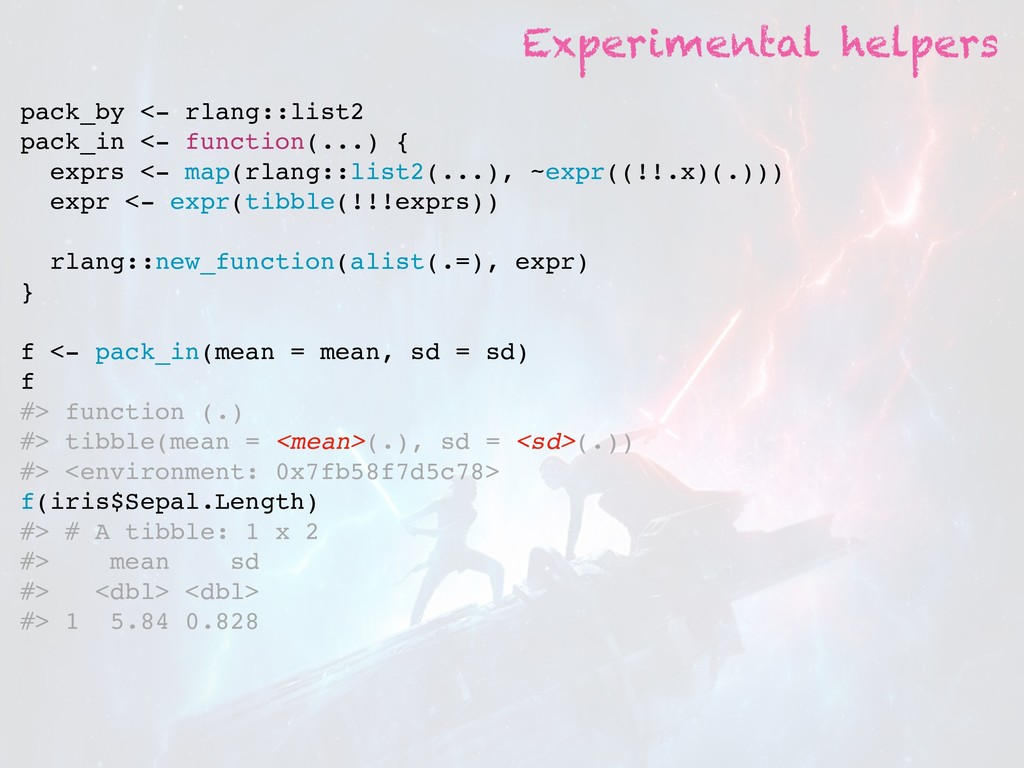
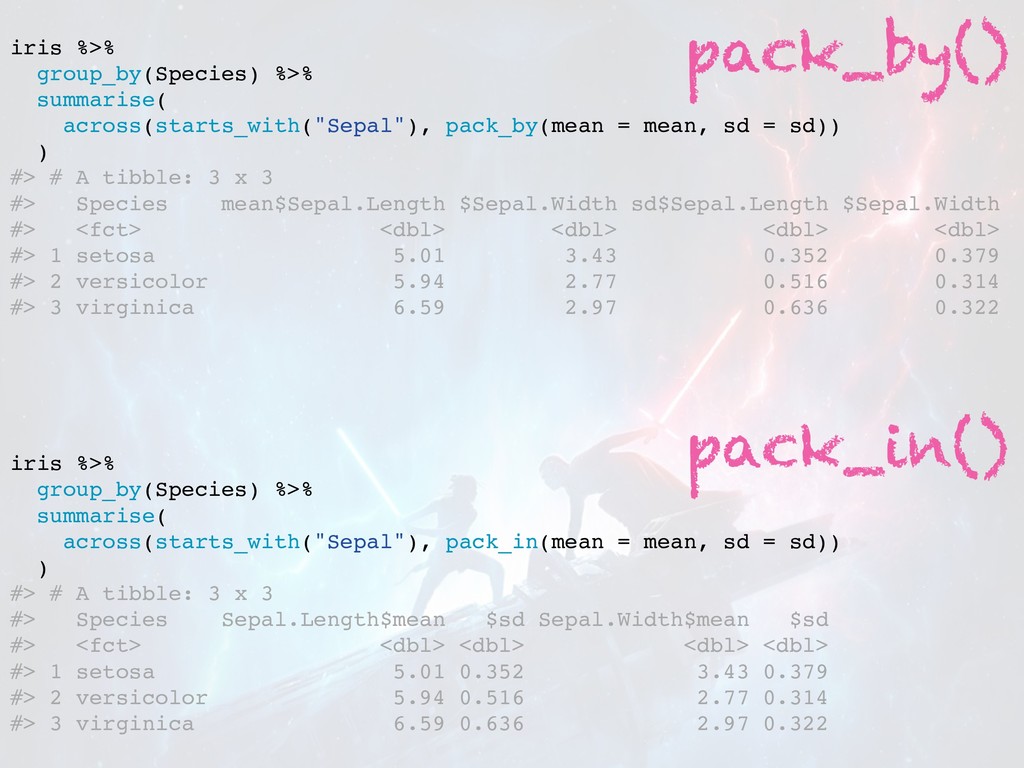
pack_by <- rlang::list2 pack_in <- function(...) { exprs <- map(rlang::list2(...),
~expr((!!.x)(.))) expr <- expr(tibble(!!!exprs)) rlang::new_function(alist(.=), expr) } f <- pack_in(mean = mean, sd = sd) f #> function (.) #> tibble(mean = <mean>(.), sd = <sd>(.)) #> <environment: 0x7fb58f7d5c78> f(iris$Sepal.Length) #> # A tibble: 1 x 2 #> mean sd #> <dbl> <dbl> #> 1 5.84 0.828 Experimental helpers
iris %>% group_by(Species) %>% summarise( across(starts_with("Sepal"), pack_by(mean = mean, sd
= sd)) ) #> # A tibble: 3 x 3 #> Species mean$Sepal.Length $Sepal.Width sd$Sepal.Length $Sepal.Width #> <fct> <dbl> <dbl> <dbl> <dbl> #> 1 setosa 5.01 3.43 0.352 0.379 #> 2 versicolor 5.94 2.77 0.516 0.314 #> 3 virginica 6.59 2.97 0.636 0.322 iris %>% group_by(Species) %>% summarise( across(starts_with("Sepal"), pack_in(mean = mean, sd = sd)) ) #> # A tibble: 3 x 3 #> Species Sepal.Length$mean $sd Sepal.Width$mean $sd #> <fct> <dbl> <dbl> <dbl> <dbl> #> 1 setosa 5.01 0.352 3.43 0.379 #> 2 versicolor 5.94 0.516 2.77 0.314 #> 3 virginica 6.59 0.636 2.97 0.322 pack_by() pack_in()