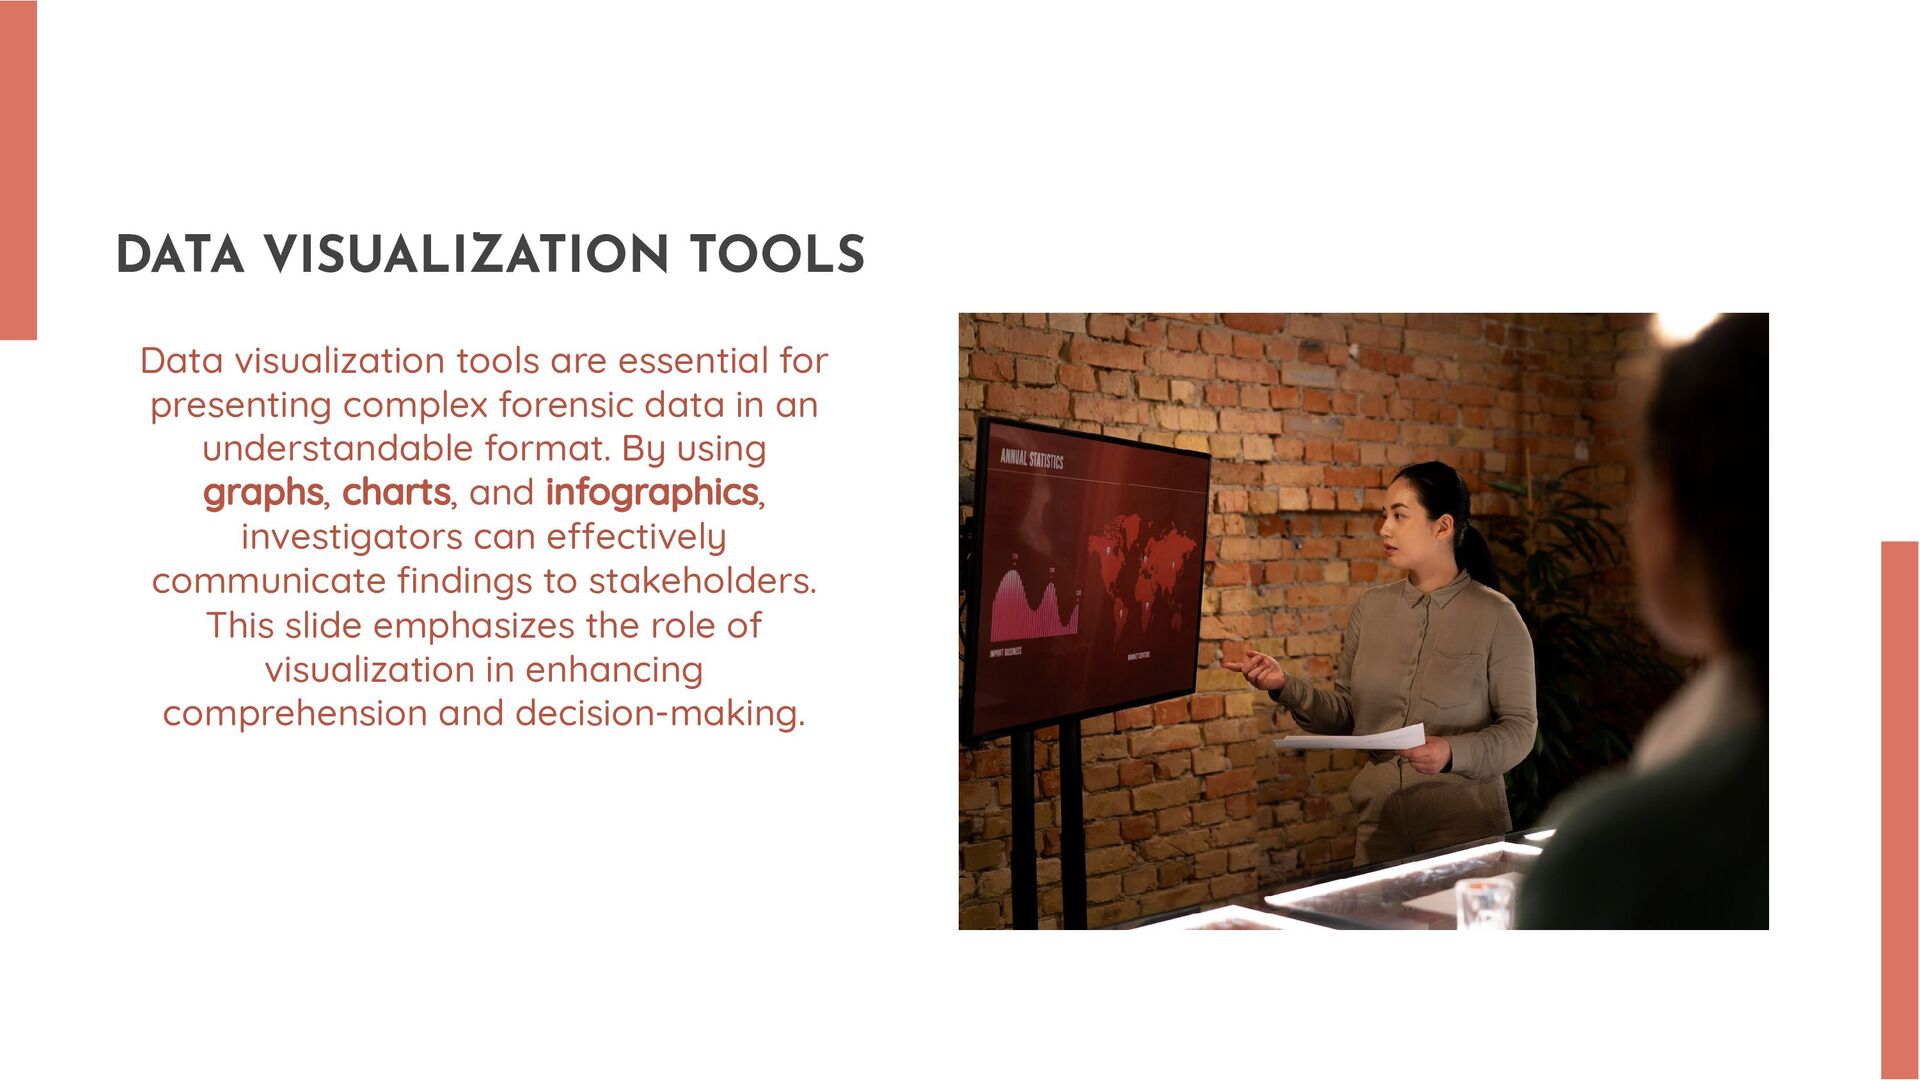
complex forensic data in an understandable format. By using graphs, charts, and infographics, investigators can e ectively communicate findings to stakeholders. This slide emphasizes the role of visualization in enhancing comprehension and decision-making.