Upgrade to Pro — share decks privately, control downloads, hide ads and more …

Graphic Presentation

Sargis
March 01, 2013

Graphic Presentation

by Willard C. Brinton
1939 year

Sargis

March 01, 2013
Tweet

Other Decks in Design

Transcript

  1. From the collection of the o Prepiger ^ JUibrary a

    t P San Francisco, California 2008
  2. /$

  3. M Dedicated IN HONOR of WILLIAM PLAYFAIR FIRST EXPONENT OF

    GRAPHIC CHARTS FOR GENERAL USE Born at Benvie, Scotland, 1 759 Died in London, England, 1823 DRAFTSMAN-ENGINEER With James Watt 1780 MANUFACTURER AUTHOR: THE COMMERCIAL AND POLITICAL ATLAS. 1st ed., 1786; 2nd ed., 1787; 3rd ed., 1801 TABLEAUX D'ARITHMETIQUE LINEAIRE DU COMMERCE, 1789 LINEAL ARITHMETIC, 1798 STATISTICAL BREVIARY, 1801 AN INQUIRY INTO THE PERMANENT CAUSES OF THE DECLINE AND FALL OF POWERFUL AND WEALTHY NATIONS. 1st ed, 1805; 2nd ed., 1807 STATISTICAL ACCOUNT OF THE UNITED STATES OF AMERICA By D. F. DONNANT. Translated From the French By WILLIAM PLAYFAIR. Chart and Preface Also By WILLIAM PLAYFAIR. 1805 A LETTER ON OUR AGRICULTURAL DISTRESSES, 1st ed., 1821; 2nd ed., 1822; 3rd ed., 1822 CAN THIS CONTINUE?, 1822 The above titles by William Playfair are all, thus far located, which contain graphic charts. The total number of books by William Playfair is perhaps one hundred.
  4. TOPICAL INDEX (1st Half) J ' Place rif^ht thumb on

    triangle, finders inside back cover. Spin pa^es to desired chapter. , 9-15 Preface — 1- 16-23 1. Introduction 25- 32 2. Graphic Narrative 33- 42 3. Tabulation 43- 52 4. Classification Charts 53- 58 5. Geneology and Genetics Charts 59- 67 6. Organization Charts 68-72 7. Relationship Charts 73- 80 8. Flow Charts 81- 91 9. Sector Charts 92- 97 10. 100% Bar Charts 98-105 11. Comparison of 100% Bar Charts 106-114 12. Multiple Bar Charts 115-120 13. Contrasting Bar Charts 121-131 14. Pictorial Unit Bar Charts 132-141 15. Comparison of Component Bar Charts 142-148 16. Bilateral Bar Charts 149-152 17. Area Bar Charts 1 53-1 60 18. General Use of Maps 1 61 -1 69 19. Guide and Route Maps 170-177 20. Relief and Aerial Maps 178-186 21. Crosshatched and Colored Maps 187-193 22. Dot and Pin Maps 194-199 23. Maps with Circles and Sector Charts 200-207 24. Maps with Bar Charts 208-210 25. Maps with Curve Charts 211-215 26. Maps with Symbols 216-230 27. Flow Maps 231-237 28. Contour Maps 238-242 29. Distorted Maps 243-246 30. Rating Charts (For 2nd Half of TOPICAL INDEX, See Page 247)
  5. MAGIC IN GRAPHS HERE is a magic in graphs. The

    profile of a curve reveals in "J "J a flash a whole situation —the life history of an epidemic, a Mfelp^nic, or an era of prosperity. The curve informs the mind, awakens the imagination, convinces. Graphs carry the message home. A universal language, graphs convey information directly to the mind. Without complexity there is imaged to the eye a magnitude to be remembered. Words have wings, but graphs interpret. Graphs are pure quantity, stripped of verbal sham, reduced to dimension, vivid, unescapable. Graphs are all inclusive. No fact is too slight or too great to plot to a scale suited to the eye. Graphs may record the path of an ion or the orbit of the sun, the rise of a civilization, or the accelera- tion of a bullet, the climate of a century or the varying pressure of a heart beat, the growth of a business, or the nerve reactions of a child. The graphic art depicts magnitudes to the eye. It does more. It compels the seeing of relations. We may portray by simple graphic methods whole masses of intricate routine, the organization of an enterprise, or the plan of a campaign. Graphs serve as storm signals for the manager, statesman, engineer; as potent narratives for the actuary, statist, naturalist; and as forceful engines of research for science, technology and industry. They display results. They disclose new facts and laws. They reveal discov- eries as the bud unfolds the flower. The graphic language is modern. We are learning its alphabet. That it will develop a lexicon and a literature marvelous for its vividness and the variety of application is inevitable. Graphs are dynamic, dramatic. They may epitomize an epoch, each dot a fact, each slope an event, each curve a history. Wher- ever there are data to record, inferences to draw, or facts to tell, graphs furnish the unrivalled means whose power we are just be- ginning to realize and to apply. HENRY D. HUBBARD National Bureau of Standards Washington, D. C.
  6. GRAPHIC PRESENTATION By WILLARD COPE BRINTON, S. B. Consulting Engineer

    Member, American Society of Mechanical Engineers; Organizer and Chair- man, Joint Committee on Standards for Graphic Presentation, Formed 1914 Through Am.Soc.M.E., as Sponsor. Fellow, American Statistical Associa- tion; Vice President, 1919. Author Graphic Methods for Presenting Facta, 1914, McGraw-Hill Book Company, Inc. ^VWx^. Q,, \\^^ BRINTON ASSOCIATES New York City 1939
  7. This book was planned with the hope of inspiring more

    and better factual presentation. If proper credits are given, any rea- sonable portion of this book may be quoted without further consent. However, to copy any materials here credited to others, care must be exercised to secure permission from the original sources. Copyright, Brinton Associates, 1939 First Edition Also by Willard C. Brinton GRAPHIC METHODS FOR PRESENTING FACTS. 1914 Published by McGraw-Hill Book Company, Inc. New York City Printed in the United States of America
  8. TABLE OF CONTENTS When a chapter name or number is

    given as a reference, turn to the Topical Index, either on Page 1 or Page 247, and spin pages to the desired chapter. Chapter Page Preface 9 1. Introduction 16 Brief History of Development of Graphic Methods. 2. Graphic Narrative 25 Early Drawings. Picture Comparisons. Sequence Pictures. Pro- cedure Charts. Sports Stories. Basic English. 3. Tabulation 33 Tallying. Methods of Tabulating. Graphic Tabulation. Machine Tabulation. 4. Classification Charts 43 Use of Arrows and Brackets in Classification. Time-Period Clas- sification. Block Classification. 5. Genealogy and Genetics Charts 53 Standard Symbols. Trait-Tracing Charts. Family Tree. Pedigree Charts. Genealogical Chart Sheets. Other Uses for Genealogy Charts. 6. Organization Charts 59 Geographical Divisions. Government and Business Organization. Functional Charts. 7. Relationship Charts 68 Interrelations. 8. Flow Charts 73 Source and Distribution Chart. Traffic Chart. Activity Chart. Cost-Accounting Chart. Cosmograph. 9. Sector Charts 81 Area and Angle Comparisons. Subdivided Sector Charts. Cumu- lative Charts. Charts Showing Assets and Liabilities. 10. 100% Bar Charts 92 Single Bars. Bar Chart Stamp. Percentage Distributions. Cumulative Charts. 11. Comparison of 100% Bar Charts 98 Groups of Bars. Distribution and Percentage Comparisons. 12. Multiple Bar Charts 106 Value Comparisons. Bars on an Illustration.
  9. GRAPHIC PRESENTATION Chapter P««e 13. Contrasting Bar Charts 115 Variation

    in Shadings. Crosshatchings, and Colors. Optical Illusion. 14. Pictorial Unit Bar Charts 121 Rows of Figures. Visual Captions. 15. Comparison of Component Bar Charts 132 Divided Bars Comparing Values. Comparison of 100% Bars and Component Bar Charts. Stair Charts. 16. Bilateral Bar Charts 142 Profit and Loss Data. Deviations from Normal. 17. Area Bar Charts 149 Area Comparisons. 100% Square. 18. General Use of Maps 153 Source of Maps. Base Maps. Map Projection. Borgia Map. Orange-Peel Map. 19. Guide and Route Maps 161 Proposed Routes. Transmission Lines. Maps Showing Sourcfe of Materials. Geographic Organization Charts. Comparisons of Geographic Areas. Pictorial Maps. 20. Relief and Aerial Maps 170 Oldest Known Map. Bird's-Eye View Maps. Diagram Maps. Statistical Relief Maps. Block Diagrams. Azimuthal Projection. 21. Crosshatched and Colored Maps 178 Comparison of Ben Day Shadings and Colors. Sampling Maps. Density Maps. Mechanical Intensity Shading Map. 22. Dot and Pin Maps 187 Map Marking Devices. Slave Maps. Bell System Map. 23. Maps With Circles and Sector Charts 194 Scales for Areas of Circles. Census Data. Distribution. Migration. 24. Maps With Bar Charts 200 Traffic Charts. Historical Maps. Map from New York World's Fair, 1939. 25. Maps With Curve Charts 208 Moving Averages. Precipitation. 26. Maps With Symbols 211 Quantitative and Qualitati«ve Data. Pictorial Units. 27. Flow Maps 216 Flow of Goods. TrafRc Maps. Weather Maps. Hurricane Maps. Traffic Time.-Zones Map. Chart by M. Minard. 28. Contour Maps 231 Topographic Maps. Weather Maps. Before and After Comparisons. 29. Distorted Maps 238 Rectangular Maps. Population.
  10. TABLE OF CONTENTS Chapter Page 30. Rating Charts 243 Tabulation

    Form. Mental Development. Safety Records. 31. Chronology Charts 248 Time Analysis and Time Studies. Chart for Assigning Vacations. 32. Progress Charts 256 Time Studies. Material Control Board. Production Progress Chart. Gantt Charts. 33. Curve Charts 263 One Curve on a Grid. Visual Captions. Historical Labels. Stair Charts. Deviation from Normal. 34. Comparison With Two Curves 275 Cumulative Curves. Causal Relationships. High-Low Curves. Lag. 35. Comparisons With Curves 286 Progressive Average and Moving Average Curves. Normal Trend. 36. Component Parts Shown by Curves 294 Component Parts in Curve Form. Percentage Charts. Band Charts. Use of Brackets. 37. Index Numbers Shown by Curves 301 Comparison of Index Charts with Numerical Value Charts. Mul- tiple Axis Graph. 38. Frequency Charts 310 Frequency Distribution. Bell-Curve Chart. Distribution in a Circle. Optical Illusion. 39. Correlation Charts 320 Relationships Between Variables. Scatter Charts. Standard Deviation. Break-Even Charts. 40. Ogive and Lorenz Charts 331 Probability Paper Charts. 41. Ratio Charts 339 Comparison of Ratio and Arithmetic Scale. Key for Selecting Ratio Scale. Method of Ruling Ratio Paper. Index Numbers Curves. Cumulative Curves. 42. Three-Dimensional Methods 354 Models. Perspective Drawings. Photographs. Isometric Block Diagram. Isometric Protractor. Trilinear Chart. 43. Composite Charts 360 Methods of Combining Various Types of Charts. 44. Suggestions for Making a Chart 367 Helpful Techniques. Sources of Materials. Methods of Lettering. Ink Colors. Crayons. Colored Papers. 45. Standards for Time Series Charts 381 Abstracts from Time Series Charts. A Manual of Design and Construction, 1938, Prepared by Committee on Standards for Graphic Presentation, under Procedure of American Statistical
  11. GRAPHIC PRESENTATION Chapter Page Association, with the American Society of

    Mechanical Engineers as Sponsor Body. 46. The Camera and Its Use 397 Photographic Effects. Color Photography. Photomontage. 47. Lantern Slides 405 Projectors. Slides. Screens. Suggestions for Placing Charts on Slides. Microfilm. 48. Preparation of Illustrations 410 Types of Illustrations. Preparation of Copy. Reproduction Media for Art Work. Handling Photographs. Shading Mediums and Shading Films. Halftone Screen Tints. Colors Used in This Book. 49. Color and Its Use 423 Discussion of Hue, Value, Chroma. Color Top. How Colors Appear to the Color Blind. 50. Methods of Reproducing 429 Gelatine Process Duplicating Machines. Blue Prints. Photostats. Mimeograph Process. Fluid Process Duplicator. Lithoprints. Multilith. 51. Methods of Printing 435 Relief, Planographic, and Intaglio Printing. Typesetting. Type Sizes and Styles. Photoengraving, Electrotyping, and Line Plates. Proofreaders' Marks. 52. Selection of Paper 443 Types of Paper. Considerations in the Selection of Paper. Bulk- ink Table. 53. Binding Techniques 449 Types of Binding. Binding Specifications. Imposition. 54. Graphic Charts in Advertising 454 Various Types of Graphic Charts in Advertising Material. 55. Quantitative Cartoons 464 Various Types of Graphic Charts in Cartoons. 56. Quantitative Posters 475 Various Types of Charts in Poster Form. Magazine Covers. 57. Displays and Exhibits 486 Mechanical Exhibits. Scale Models. Display Fixtures. Turn- tables. New York World's Fair Exhibits. 58. Dioramas 494 Dioramas in Process of Construction. Dissolving Diorama Exhibit. New York World's Fair Exhibits. 59. Graphic Charts in Conference Rooms 497 Board Rooms. Use of Projectors in Conference Rooms. 60. Glossary 501 Graphic Methods Vocabulary. Index 506
  12. PREFACE TWENTY-FIVE years have passed since the publication of Graphic

    Methods for Presenting Facts in 1914. The continuing demand for Graphic Methods without revisions in a quarter century now incites curiosity as to the causes of that demand. So many excellent works relating to graphic charts or containing chapters on graphic presentation have appeared since 1914 that I had felt the field well covered without another book from me. This, in spite of the fact that I have published nothing regarding activities of my own relating to the 1914-1918 World War period. Probably the feverish demand for prompt and reliable data during war times did more to stimulate the use of graphic chart technique than anything that has happened since 1920. Without realizing what was happening as the war flared, I found myself advising the executives of large corporations, gov- ernment departments, etc. World trade was disorganized, and the uncertainty of material supply required quick anal- ysis of all available data. For instance, in 1916, a New York silk manufacturer and I went to China and back again on the same steamer to determine the feasi- bility of building a new plant in Shang- hai to employ five thousand. For one of my age at that time, it was a great privilege to have the oppor- tunity to develop some theories and put them in practice day by day with experienced executives whose decisions were so vital in those hectic war years. Establishing, in a Broadway office building, control methods for quicker "tum-arounds" of eighty-five ships chartered by the Belgian Relief Commis- sion had little relation to strategy in the president's office of a steel company with twenty thousand employees in Pittsburgh, or scheduling, at New Haven, Connecticut, two thousand tool makers scattered in shops throughout New England to assist in producing the light Browning machine gun by a company already working twenty-two thousand employees at the New Haven plant. During that period "Z" chart methods and unit card curve records were ^^^^ v/ay/zz^yy? Signature of William Piayfair from a Letter to Thomas Jefferson Dated March 20, 1791
  13. 10 I" GRAPHIC PRESENTATION developed for use in fields much

    more specialized than would be of interest here. Also short map pins with spherical heads were created and placed on a quantity production basis. Through all the research of the World War period, the need was constantly evident for standardization so that graphic charts could be made and interpreted without possibility of misunderstanding. For general use, graphic charts must be simple. It is not, however, always easy to determine what is the utmost simplicity. Much depends on the method of approach. A semi-logarithmic chart may not be puzzling if you call it a ratio chart and make no mention of mathematics. Since the close of the World War, other activi- ties have crowded into the background my in- terest in graphic charts and human reactions to them. It was impossible, however, to resist tearing from magazines and newspapers thousands of examples of particularly interesting or especially erratic graphic charts. These were added to ex- amples which had come, in what Hollywood would call "fan mail," from readers of Graphic Methods. As recently as twenty months ago there was still no expectation of my ever writing an- other book on the sub- ject. Although I had been in Los Angeles many times and had passed the Huntington Library on John Playfair, the Brother of William Playfair numerous occasions, I in his Inquiry, 1805, William Playfair stated that his had never found time to brother taught him "that whatever can be ex- visit it Then after pressed in numbers, may be expressed by lines." ,, / . . , J To the "best and most affectionate of brothers," months of mtensive study ,,,.„. ™ , . William Playfair owed "the invention of these Charts." ill
  14. I" PREFACE of some problems in Los Angeles in which

    graphic presentation had proved particularly effective in crystallizing opinion on a complex situation. I visited the Huntington Library on the last day before starting North and East. While observing some unusually fine types of early bookbinding and the repairs made to the bindings on some of the Library's most precious volumes, it occurred to me to ask the Librarian, Dr. Leslie Bliss, what books the library had by William Playfair, to whom this book is dedicated. In a few minutes there was brought to us the only one they had listed under William Playfair: STATISTICAL ACCOUNT OF THE UNITED STATES OF AMERICA by D. F. DoNNANT • Translated from the French by William Playfair With an Addition on the Trade to America, For the Use of Commercial Men, By the Sanie. • London 1805 As we looked through this book, I exclaimed to Dr. Bliss, "Here is the earliest example of a sector chart," and then noticed beneath the one illustra- tion the inscription, "This Newly invented Method is intended to shew the Proportions between the divisions in a Striking Manner." See Page 81. I was also much struck by the fact that the subject matter of the book referred to industry, commerce, and finance in the United States, that the preface by William Playfair mentioned conversations between himself and Thomas Jefferson, that the book was inscribed to Jefferson, and that twenty- five copies had been sent to him. When I wrote Graphic Methods in 1914. I had never heard of William Playfair. Two years later a friend in Pittsburgh sent me a marked catalogue of a London bookseller listing a book Lineal Arithmetic, 1798, by William 11 ill
  15. 12 GRAPHIC PRESENTATION Playfair. Out of curiosity. I wrote asking

    that the book be reserved and that a price quotation be sent. A few weeks later, upon returning from out of the city, I was astonished to find the EngHsh book seller's bill for ten shillings, six pence. Elsewhere in my accumulated mail was the book itself. On the title page the publisher's price is printed, "Price 10s. 6d." Neither the New York Public Library nor the Library of Congress had this book. Each of these libraries has since photostatted my volume for inclusion with the few examples of other Playfair works which they own. About 1916, I had various photostats made from these Playfair books, but had never followed up clues on Playfair, the man. The Playfair search has widened since the chance inquiry made at the Huntington Library a year ago. Questions still continue. With all that Playfair did to show the effectiveness of graphic chart methods from his first book, published in 1786 at the age of twenty-seven, till his death in 1823, why have not graphic charts become more thoroughly established as a universal language? Another interest was aroused as to the part which engineers have played in the development of the graphic lan- guage, since I noted in California that William Playfair was apprenticed in Scotland as a machinist and later became a draftsman for James Watt before writing on a wide variety of subjects. There are about 100 titles by Playfair on record. The story of William Playfair, still developing, may yet have large gaps. Location of those writings relating to graphic charts, however, appears to be fairly well completed. This book is another contribution from the engineering profession, although written for general use rather than the technical field, on much the same general ideas as expressed in Graphic Methods in 1914. The 1914 book was written largely to disclose some of the fallacies that occur when graphic charts are used loosely without the basis of accuracy essentially associated with the work of people with an engineering background. Until the last decade or so, the use of graphic charts seemed to be progress- ing sanely and fairly rapidly with no more guidance than resulted from the extremely brief preliminary report of the Joint Committee on Standards for Graphic Presentation, published in 1915. In recent years, some weeds seem to have sprung up to retard the growth of the more cultivated graphics which had been developing strongly with numerous offshoots since the World War stimulus. As in a garden where there is sometimes the policy of deciding in the early stages which are weeds and which are plants that will be productive, it has not been easy to find a method for defining good graphic charts as compared with poor or downright obnoxious charts. What is believed to be a satisfactory method was found in the old story of the blind men who reported on the characteristics of an elephant. Good graphic presentation should be susceptible to only one interpretation. Recently even official government documents have been using a type of graphics which found its first major use in European countries having a low
  16. PREFACE 13 percentage of literacy. When the same European methods

    have been pushed on a commerciaHzed basis in America, little attempt has been made to follow existing American standards or trends toward the development of an ultimate universal language. The tendency has been to use stock symbols over and over again because they are cheaper to reproduce than special drawings designed for each particular problem of presentation. The first part of this book up through page 366 deals with "How to Read a Chart." The section from page 366 to page 452 treating the subject "How to Make a Chart," is necessarily condensed, and gives suggestions rather than detailed instructions. The illustrations in this book have been selected from the standpoint of interesting subject matter as well as to show representative types of graphic AND All h^ere in the ivrong! Good Presentafion Should Be Susceptible to Only One interpretation It was six men of Indostan The Fourth (knee) "Is very like a tree!" To learning much inclined, Who went to see the Elephant (Though all of them were blind.) That each by observation Might satisfy his mind. The Fifth (ear) "Is mighty like a fan!" The Sixth (tail) "Is very like a rope!" The First (side) "Is very like a wall!" The Second (tusk) "Is very like a spear!" The Third (trunk) "Is very like a snake!" And so these men of Indostan Disputed loud and long, Each in his own opinion Exceeding stiff and strong Though each was partly in the right. And all were in the wrong! From John Godfrey Saxr. "The Blind Men and the Elephant". CIrvrr Slnrin nl Many Natir>n> R^-ndrred in Rhime. 1865.
  17. 14 I" GRAPHIC PRESENTATION charts. Words are carefully studied before

    they are qualified for admittance in a dictionary. No one knows how many distinct types of graphic charts are already in established use. Beneath the majority of the illustrations included here, there is a notation of "SCALE" to indicate the percentage reproduction of the original. In judg- ing the effectiveness of any presentation it should be clearly kept in mind that, as here reduced, the illustration can not be as effective as in the size originally published. Also in the process of photographing, particularly in those charts taken from newsprint paper, the illustration is less clear. Half- tones which here appear too black have been photographed from previously printed halftones rather than from original photographs. If the subject matter of any illustration is of special interest to the user of this book, a reading glass may be used to enlarge the detail. Because a frame around the chart may be interpreted falsely as a zero line, or base line, the liberty has been taken to remove frames from many illustra- tions. Changes have also been made in lettering or other details, when neces- sary, for reproduction in reduced sizes. It should be clearly understood that this book would not have been feasible except for the photo offset process of reproduction and color printing. The use of color has been a gamble—many of the charts here shown in color were originally black and white. It was impossible to foresee results obtained from hundreds of lay-outs sent to the printer. Changes may seem obvious in the final printed form. Designs at the top and bottom of color pages may appear incongruous with some of the color combinations in the body of the page. Varied color designs were inserted with the thought that the user of this book might gain from our experiments and select certain effects appropriate for his own par- ticular problem. In order to test whether color is worth while in graphic presentation, color has here been literally splashed on. In folding printed sheets for sewing into bookbinders' signatures, every other pair of pages evolve from one side of the printed sheet of paper. Thus, if color is printed on only one side, a reader finds color on every other pair of pages in the book. In this way it is possible for the reader of this book to judge the effect of color on the varied types of charts shown in the 60 chapters simply by turning the pages two at a time. It is believed the evidence is conclusive that to get maximum results in graphic presentation the question is not "Can one afford to use color?" but "Can one afford to omit color.?" This book Graphic Presentation results from the work of many people. It would not have been possible except for the charts produced by the indi- viduals and organizations to whom credit is given under many of the 676 illustrations. The illustrations were selected from thousands of clippings
  18. PREFACE which I could not resist saving during the 25

    years that have elapsed since publication of Graphic Methods for Presenting Facts in 1914. The chapter on selection of paper was prepared by Mr. W. B. Gibson, of the Mead Sales Corporation, in consultation with officers of various trade associations. My wife, Laura M. Brinton, did practically all the work in preparation of Chapter 46, "The Camera and Its Use"; Chapter 47, "Lantern Slides," and Chapter 49, "Color and Its Use." Miss Audrey W. Zeigler, of Newburgh. New York, made all the drawings used as the headings of chap- ters. Mr. R. R. Lutz, of the National Industrial Conference Board, made valuable suggestions in the early stages of planning the book, particularly regarding the possibilities for the use of color. Mr. Roy S. McElwee, and numerous others read manuscript and contributed suggestions as the book progressed. In planning the printing, many helpful ideas were given by Mr. Edward N. Mayer, Jr., of Gray Photo Offset Corporation. The cooperation of the entire staff of that organization is appreciated. Personally I regret that frequent absences from the city have prevented that close contact which I should have preferred to give to such fascinating subject matter. Methods of graphic presentation and new types of charts will continue to evolve through processes of human ingenuity as need arises. There is need for classification and comparison of types noting the advantage of each type and making all types available for general use internationally. Nomenclature alone is deserving of careful attention far beyond the range of any one indi- vidual. In the discussion of these matters in Washington, D. C, during the past year the Honorable Kent E. Keller, member of the House of Representatives from Illinois, and Chairman of the House Committee on the Library of Con- gress, has been of great assistance in exploring the possibilities. Mr. Keller's unusual range of knowledge and experience in education, medicine, law, engineering, publishing, and mining, coupled with residence in Europe and Mexico, served in determining potentialities for not only a central file of graphic charts by types, but also a comprehensive file of graphic material arranged for quick reference and classified according to subject matter. William Playfair, from his first book in 1786 throughout his writings to his death in 1823, mentioned the possibility that a graphic language could be an international language assisting in better relations between nations of different tongues. As this is written, with international conditions throughout the world unsettled and getting worse, there seems more than ever before a need for such a common graphic language as William Playfair envisioned. WILLARD COPE BRINTON. New York City Sept. 6, 1939 15
  19. 1 16 Chapter 1 INTRODUCTION Wh hy have graphic methods

    been so tardy in developing? Three things in combination are necessary before visual methods of presentation can be adequately used. 1. Accurate factual data readily available. 2. Competent drafting talent to chart the data on a standard- ized basis. 3. Equipment and organization for reproducing the charted data at a cost not too high compared to the printed word. Until mankind developed reasonably cheap paper, there was no convenient method for preserving quantitative data. The study "One hundred rumors are not comparable to one look." An Old Chinese Inscription of statistical records and the developing of policies from facts had to wait until records gradually accumulated. The making of paper and the preserving of records developed rapidly after the invention of loose-type printing about 1450. At the time William Playfair wrote his first book on graphics in 1786, the word "statistics" had not come into general use. The word itself is derived from "state." The state first had to keep records of tax rolls, collections, and various government activities. Playfair lamented the inadequacy of historical data in a number of his writings; for instance, in Commercial and Political Atlas of 1801: "Had our ancestors represented the gradual increase of their com- merce and expenditures, if it had not been an object of utility, it would
  20. INTRODUCTION 17 at least have been one of curiosity; but

    had records, written in this sort of shape [plotted curves] and speaking a language that all the world understands, existed at this day, of the commerce and revenue of ancient nations, what a real acquisition would it not have been to our stock of knowledge! In place of which, a few detached facts are col- lected and brought forward as the only criterion from which we can judge of the manners and wealth of the ancient world. "It is not only of importance that this species of information should be handed down, but also that it should go down in such a form and manner as that any person might, even though a native of another country, understand the nature of the business delineated. ". . . If we could have a copy of the custom-house books of Carth- age or Tyre for a hundred years, what value might not be set on them! These charts [Playfair's] will be for future nations the same thing that the ancient records we so much desire would be for us now. . . ." If we search into the past for factual data, we naturally think of libraries. If we could now examine the libraries as they existed at intervals of one hundred years, say one, two, three or four cen- turies back, what would we find? Probably very little factual Courtesy of American Chicle Company—Makers of Dentyne Gum The First Agricultural Report
  21. 18 GRAPHIC PRESENTATION information. Even books in our grandfathers' attics,

    if classified, would be short on factual material and long on abstruse discussion of theories, most of which were of a religious nature or perhaps vaguely astronomic or otherwise theoretical considerations of the universe. The development of printing and the gradual cheapening of paper resulted in people of Europe and this country being exposed not to pictures but to more and more words, words not only from the printed page but from ministers of the gospel who, being of the educated class and able to read, obtained their inspiration from the printed material which came to them. Let us consider bookmaking in the early days from the stand- point of cost. There would seem to be little reason why illustra- tions should not be generally used. Books were made from wooden blocks even before the use of movable metal type. Illuminated manuscripts and early books of similar pattern used illustrative methods which today we would think prohibitive from the cost standpoint. Labor must have been relatively cheap, especially in monasteries or other religious institutions which in those days pro- duced so much of the literary output. Probably there was nothing whatever to prevent the development of illuminated graph charts long before the days of William Playfair except lack of reliable factual data from which to make the charts. People of those days must have found out, just as we find out so often now, that if we start to chart our facts, we are frequently stopped by the startling insufficiency of the data, the annoyance that the data may have a single gap in its continuity, or that the data have not been kept on a uniform basis over the period of time under consideration. Organization of data on a rectangular field would appear to be so obvious that it might have been done fairly early by scholars in different countries, if they had had much data to study. The printed page with its lines of words proceeding from left to right is in itself a coordinate field, the lay-out of which required careful thought from those who produced the illuminated manuscripts or books which are so fascinating to us now. Descartes in 1637 pub- lished his works on geometry which firmly established the method of rectangular coordinates when used for mathematical formulas. Those who are interested in the history of graphic presentation will find the sequences well brought out in a paper of one hundred and thirty- five pages by H. Gray Funkhouser, published in Osiris, Volume Three, Part One, 1937, available through the Carnegie Institution of Washington, D. C. Funkhouser dates the use of the coordinate field to astronomers and surveyors as far back as 140
  22. :fBWK?!W5r.« INTRODUCTION 19 B.C. when points in the earth's surface

    were located by means of their longitudes and latitudes. Oresme in 1350 in his Tractitus de Latitudinibus Formarum endeavored to represent graphically how an empirical curve might behave. As Funkhouser states, "If a pioneering contemporary had collected some data and presented Oresme with some facts to work on, we might have had statistical graphs four hundred years before Playfair." Leonardo da Vinci antedated Descartes 77 years. Leonardo's genius in the natural sciences and as an engineer was so far in advance of his time that it would seem that he might have been familiar with rectangular coordinates. Recent examinations of his notebooks, though not very con- clusive, seem to indicate that in his experiments regarding gravitation, his records of the velocity of fall- ing bodies were analyzed on a rectangular coordinate basis. See Volume M, Verso 40, Manuscripts of the Institute of France. He used horizontal distances to express time and vertical distances to show the space covered by falling balls when two were dropped together or one following the other. Leon- ardo, however, left no group to carry on his engineering works, which were little understood by his immediate contemporaries and successors. The American Statistical Association, formed in 1839, now cele- brating its one hundredth anniversary, is the earliest specialized scientific organization in this country. The American Philosophical Society, organized by Benjamin Franklin in Philadelphia, was, of course, earlier but its activities cover such a wide field as to put it in a different class. The American Society of Civil Engineers founded in 1876, was followed by the American Society of Mechanical Engineers in 1880 and then by numerous other en- gineering and scientific societies. The presentation of their papers in edited transactions has resulted in rapid advance in varied chart techniques. In spite of all that Playfair pointed out a century and a half ago, and the interest shown by a few college instructors during recent years, there is still insignificant use of graphic presentation Early Work on Books Was Done Monasteries
  23. GRAPHIC PRESENTATION methods in the field of education. Educators themselves

    do rela- tively little to analyze the methods for transmitting facts and ideas. At present most educators are graphically illiterate. An educator, or person with a message to give is referred to as : lecturer, speaker, orator, preacher, narrator, reciter, etc. These words generally imply the conveyance of a message through the ear without reference to the eye. Until the cinema was equipped with sound there was a move to use the word "optience" instead of "audience." Although the moving picture now combines perception through both the eye and the ear, the messages generally conveyed today by the motion picture are descriptive rather than quantitative. The moving pic- ture projector has not thus far been a great influence for intro- ducing the type of graphic presentation indicated in this book. Lantern slides, and more recently, slide films, have been important factors. There are interesting possibilities if educational institutions would seriously study the methods for presenting ideas and facts, and then, as their instructors qualified in the new technique, designate each by the term "Presentor." In a similar way, a student might be called a "Perceivor." Each of these terms implies re- •iiSf'45 H. Gray Punkhouser. "A Note on a Tenth Century Graph." OSIRIS. Vol. I. 1936. A Tenth Century Graph That Forms a Part of a Manuscript Discovered by Sigmund Sunther in 1877 According to the article by Dr. Funkhouscr, from which this illustration was taken, the graph was meant to represent a plot of the inclinations of the planetary orbits as a function of the time.
  24. INTRODUCTION 21 sponsibility for results. These terms are not limited

    in their scope to the field of education. Anyone planning a conference, conven- tion, committee, discussion, assembly, council, etc., might do well to consider the method for presenting the subject matter. How many of these meetings today are just talk? If each participant would consider himself as a Presentor of data or ideas that he is especially qualified to contribute to the group, there would be less misunderstanding and more conclusive action. We are still expressing ourselves in meetings by the traditional methods the old patriarchs used to pass on the folklore of the tribe —by word of mouth. While the newspaper, the movie and the radio are being used to present descriptive material to secure public approval, quantitative presentations are relatively rare in publicity campaigns. The introduction of quantitative expression in every phase of life can lend itself to great future progress. There has been some discussion of the effectiveness of graphic methods to convey facts and ideas, but no comprehensive analysis has thus Rene Descartes, 1596-1650
  25. 22 GRAPHIC PRESENTATION DEATH AFTER DARK )930 1931 1932 1933

    1934 1935 1936 1937 25.000 24.000 23.000 22.000 21.000 20.000 19.000 )6.000 17.000 16.000 15.000 14.000 13.000
  26. m}ft^?i(:i'f'WfS!i:iii,-m INTRODUCTION 23 I 1911 l*M !«• l«tO I9tl l»ll

    IttS IM4 Ittt l»t« t*tl Its* I9I* I«SO t«SI t«9t 1993 19S4 I99S t9SS I9S1 Ratio Chart Showing Prices of Non-Ferrous Metals in the United States fronts 1917 to 1937. The above chart was reduced from one transmitted by Western Union automatic telegraph, showing that, as machines are installed, graphic charts may be sent from one city to another. Service is now available only in New York, Buffalo, and Chicago. Other cities will be added. Graphic charts present unusually comprehensive data in con- densed form for analysis and interpretation. Major libraries should contain a division of graphic charts. Filing most of the material could be easily done by placing material in the usual letter vertical files. Provision should, of course, be made for cross references. Probably it would be desirable to have two sections, one for sci- entific and technical data, the other to contain all other material. To aid those studying graphic presentations, larger libraries would do well to have a separate file classified according to types of graphic charts, irrespective of the subject matter. .a!(«K«««sws-^AS '.j'Sa
  27. 24 GENERAL REFERENCES HISTORY OF GRAPHIC METHODS Funkhouser, H. Gray,

    "Historical Development of the Graph- ical Representation of Statistical Data," Osiris, Vol. Ill, Part I, 1937 Walker, Helen M., Studies in the History of Statistical Method, Williams & Wilkins Co., Baltimore, Md., 1929 GRAPHIC METHODS Arkin, Herbert, and Raymond R. Colton, Graphs: How to Make and Use Them, Harper & Brothers, New York City, 1936 Brinton, Willard C, Graphic Methods for Presenting Facts. Mc- Graw-Hill Book Co., Inc., New York City, 1914 Brown, Theodore H., Richmond F. Bingham, and V. A. Tem- nomeroff. Laboratory Handbook of Statistical Methods, Mc- Graw-Hill Book Company, Inc., New York, 1931 Chaddock, R. E., Principles and Methods of Statistics, Hough- ton Mifflin Co., New York City, 1935 Croxton, Frederick E., and Dudley J. Cowden, Applied General Statistics, Prentice Hall, Inc., New York, 1939 Crum, William L., Alson C. Patton, and Arthur R. Tebbutt, In- troduction to Economics Statistics, McGraw-Hill Book Co., Inc., New York City, 1938 Haskell, Allan C, Graphic Charts in Business, Codex Book Co., Norwood, Mass., 1928 Karsten, Karl G., Charts and Graphs, Prentice Hall, Inc., New York City, 1923 Riggleman, John R., and Ira N. Frisbee, Business Statistics, Mc- Graw-Hill Book Co., Inc., New York City, 1938 Riggleman, John R., Graphic Methods for Presenting Business Statistics, McGraw-Hill Book Co., Inc., New York City, 1936 PREPARATION OF ANNUAL REPORTS Selvage, James P., and Morris M. Lee, Making the Annual Report Speak for Industry, Compiled by National Association of Manufacturers, McGraw-Hill Book Company, Inc., New York City, December 1938.
  28. 25 Chapter 2 GRAPHIC NARRATIVE I Oynonyms for graphic narrative

    are: ideographic drawings, pic- tograms, figurative symbols, pictographic charts, and hieroglyphs. Graphic narrative may involve the keeping of records, quality of materials, time, or quantities. Walker Engraving Corporation, New York. SCALE .7 A Stone Age Man's Painting of a Bison. 1. Long before a written language had evolved, man recorded his actions and accom- plishments in stone carvings and paintings. 2. Although it is not certain that the picture above is one of a bison which the painter has slain, it is probable. 3. This early recognition of the value of a painting in preference to a verbal description is the forerunner of the use of illustrations in modern textbooks.
  29. 26 GRAPHIC PRESENTATION CHARACTERISTICS OF GRAPHIC NARRATIVE CHARTS 1. A

    picture is more universally understood than a word de- scription. 2. Graphic narrative is adaptable for poster use and has a great deal of popular appeal. 3. There are few rules for, or restrictions on, the use of graphic narratives. 4. Quantitative data may be shown or suggested in graphic narrative form. The picture may stand alone or may be accompanied by comments of explanation. BASIC ENGLISH Basic English is a system of 850 words and five simple rules for putting them together, which was the invention of Mr. C. K. Ogden of the Orthological Institute, Cambridge, England. It will do the work of 20,000 words of English for the normal purposes of trade, science, and everyday living. Special lists for general science and for any special science put the number of words up to 1,000, with Liberty Magazine, April 13, 1929. SCALE .9 The Pig Woman's Story of Her Movements and Observations on the Night of the Hall-Mills Murder. This form of graphic narrative may be used to accompany fiction as well as fact. It is very simple in idea —it gives the story in time sequence.
  30. GRAPHIC NARRATIVE 27 the addition of which the international signs

    of chemistry, for ex- ample, may be made to do their work at the expert level. Its interest for the writer of this book is that graphics —the interna- tional language of the eye —may be made completely international if Basic English is used where any words are necessary. Basic may be learned in a month by a quick learner, working privately, or in a year or less in school. To the eye and ear it is not different from normal English, and it takes only a very short time to get the trick of writing and talking in it. Of 1,500 living languages, only seven are used by more than sixty million persons. Of these seven, English is by far the commonest. It is the natural, or government language of six hundred million, it has for a long time been the second language of the Far East, and is now learned in schools in all parts of the earth. It is the lan- guage of the seas, of trade, to a great degree of science, of the mov- ing pictures and radio. Basic English is an international form of this most international of living tongues. This account of the system is in Basic English. Further facts about Basic English may be had from the Payne Fund, 1 Madison Avenue, New York City, or the Orthological Institute, Cambridge, England. THE TEXTILE COMMUNITY - occupies 880,000 homes owns 700.000 automobiles spends $3,000,000 on movies annually owns 300,000 mechanical refrigerators eats 3,500,000 tons of food annually Textile World. October m38, Part of an Editorial on Public Relations Entitled "Textiles a Source of Purchasing Power." An Analysis of the Textile Community. Without representing the pictorial items quantitatively, this form of graphic picture gives a concise analysis of the textile community. It was used effectively as an illus- tration for a public relations editorial.
  31. 28 GRAPHIC PRESENTATION l900rn^pT1T "STREAMLINED STANDARDS OF LIVING CREATED BY

    MACHINE TOOL INDUSTRY United States News, Washington, D. C, June 20, 1938. SCALE .6 A. The Story of American Efficiency in the Machine Tool Industry. Here is a vivid story of the changes that have taken place in history. It is purely a quali- tative analysis: —the wagon has been replaced by the truck; the broom by the vacuum cleaner. THREE-FOURTHS OF PIGS GO TO MARKET BY TRUCK /^^^•kLi^ Automobile Manufacturers Association "Automobile Facts!' September l').}8 B. A Graphic Presentation of the Fact That Three-Fourths of the Pigs in the United States Go to Market by Truck. The use of pictures to represent 3 out of 4 or 7 out of 10 or 4 out of 5 has been used for many years. It is still an effective method of presenting percentage analysis.
  32. GRAPHIC NARRATIVE 29 Opponents mAHHATTAn'S REVERSE Run no3 <><ksscs s*t.L

    TO NO* art FAKt SPIN Nrw York Journnl and American. SCALE S A. Famous Football Plays: Manhat- tan College Reverse Run. An explanation of a football play, either before a game or after a game, is a well-known form of graphic nar- rative. Players on each side are indicated by squares, circles, or other distinctive symbols, and the movements of the various players are indicated by arrows. The HHarvard-Yale Game of 1937. The Score Was 13 to 6 in Favor of Harvard. After the "game," spectators often would like to have a picture of the various plays before them so that any confusion as to what actually did occur may be seen at a glance. The work sheets from which the above chart was made were of heavy cardboard and easy to handle at the game. It may be possible that standards for this type of chart will evolve in the future. FIRST HALF O lO 20 30 40 so 40 30 ZO 10 G SECOND HALF « ID 20 30 40 so 40 30 20 lO G ^ H V^-N ^^^ v•^^ Sk^sJs/V« ff^fcf <L P ^-^ 1 %. % ^fH'i ««l f<ZAP>< X^ (oity u • MA(?VARO O YALE CfOc^JH Victor O Jones, Sports Editor, Boston Globe.
  33. 30 GRAPHIC PRESENTATION Compare the charts in this chapter With

    those in "Pictorial Unit Bar Charts," pages 121-131. Redrawn from Fortune Magazine, February 1932. The Use of Segments of Fruit to Represent Quantities. With the modern emphasis on novelty, the use of segments of fruit to represent quantities should be an effective one. A quarter segment of a lemon to represent the produc- tion by the United States of a fourth of the world's lemons, or a half segment of grapefruit to represent the production by the United States of half the world's grapefruit, vi\>uld be much more vivid than the same information presented in verbal form or even bar-chart form.
  34. GRAPHIC NARRATIVE ^f'^m-'^intn V** cl»*«t* *k« ^l«f tm4 pl*m fm

    want t«w ••k • I«*a- . . . TK« l< . TK« l*fld»f. miwrvd. pr«.i4*t (K« < t FHA tpptmwti k «i<*ii il rMf .•!«•«• h Ymc Wwm mitt* fMmtm t% •M«iili«l ®- Tk« ^nifn mnl b« .'ck.lK)»f<ll, ••u«<l riadil, uUabU How to get an FHA-insiired mortgage —f^raphically told in words, pictures and charts 31 T1i« coMtrw«t*eM fiiMt b« 90«d. r««titi»9 w*«rh«r «nd t T>.« pi»f m^n* b« prcctic*! (I«ft). not *****, vS Eqwpivivnt mwit b« appropriat* to kcuM a^d na>9kb«r^o«d Hou»f and Garden, June 1938 SCALE 6 The Procedure for Securing a Federal Housing Adnninisfration-lnsured Mortgage in the United States in 1938. Stories have been told by pictures since prehistoric times. Here the story was told graphically but the verbal narrative was also included. The pictures attract atten- tion; the words make sure that the picture is understood; and the combination of the two results in the reader remembering the procedure for securing an FHA-insured mortgage.
  35. ^^ GRAPHIC PRESENTATION Transparent material on which pictures and words

    may be printed has made possible a new type of book. It is literally a book, but a book that builds up a given idea, subject, or problem step by step as the pages are turned. By the use of transparent pages and an ingenious pictorial scheme, a complete story is spread out before the individual as a complete whole. The book is planned so that it can be read from front to back or back to front with the story differing according to which way the book is read. After the subject is built up, it may be reversed from the other angle. Since the page is transparent, the subject matter is carried through the page, presenting the other side of the same material. Educators, advertisers, science, and industry may use this new tool to unfold an object, lesson, or product in a practical, pictorial manner where the spoken or written word is often misinterpreted or misunderstood. It greatly simplifies the presentation of any object, and produces a vivid mental picture which is easily retained. Sources: Offset Gravure Corporation, Long Island City, New York S. Theo Jonas, 10 West Jackson Boulevard, Chicago, Illinois When You're mil/N^lAlO/\/C- Think About'-^LOlLINf; OU£R/ 25 Miles an Hour 50 Miles an Hour '^ -'wi..X-'i--''--'-"--t'^^ 75 Miles an Hour Travelers Insurance Co., Hartford, Conn. Graphic Presentation of the "Turnability" of an Automobile Traveling at Three Rates of Speed.
  36. 33 Chapter 3 TABULATION ATTRACTIVENESS can be a characteristic of

    statistical tables. , Adherence to certain simple suggestions will improve their appearance. Designing is an integral part of every table and should be carefully planned. The actual form which any table takes depends upon the data to be presented. For suggestions relative to setting up tabulation for reproduc- tion, see the Vari-typer in Chapter 44 and the material about type- setting in Chapter 51. CLASSIFICATION
  37. 34 GRAPHIC PRESENTATION REFERENCES Day, E. E., "Standardization of the

    Construction of Statistical Tables." Journal of the American Statistical Association, Vol. 17, March 1920. This issue of the Journal is so limited that the American Statistical Association cannot sell it. However, it is available in most libraries. /.UJ P.m. / J.? P. M.. t.j.9-r>»t. J_^ f.j j-fi^ j /Ljw '"•t J" '/.'i i7^«<. y.j.rP.H UJ^U^ wmmm .AjlE<JJL*jlJ^ / tt*.U*.uXZ. -V' AkAM«^«^ . £ — c /*. J-*f 4. /3"a. /«. Of Hi' 7.10 wtmmm M— ——M—W £' CU»,^L,4^^/ ¥-^ / f30- /^t<-»^<^ _3>J!L/c ,.j,\t~ .^w>-«^u.> -a-cAaa*.4-^^/v «*.' .. <. C»y «.».^^r 5t»-C~ /«.rr/.t IBMI 1 1 Three Methods of Tallying the Barking of Dogs. Data for Use in a Lawsuit, scale s Since intelligent planning preceded the tallying of this information, there was no need to record it in the form of tables.
  38. TABULATION 35 Mudgett, Bruce D., Statistical Tables and Graphs, Houghton

    Mifflin Company, Boston, Mass., 1930 U. S. Department of Agriculture, Bureau of Agricultural Eco- nomics, The Preparation of Statistical Tables, 1937. A pamphlet distributed free of charge. Walker, Helen and Walter Durost, Statistical Tables: Their Structure and Use (Bureau of Publications), Teachers Col- lege, Columbia University, New York City, 1936 /d;>uIii«oii WMhingt.m. D. C..' 486,860 Clicvy CliMc, Mil 8,000 Takoiim I'ark, Md 6,415 Silver Spring. M<1 5,000 UyalUville, M.l 4,264 Mt. Rainier, M«l 3,832 Ktlovatt-hourt < 1929 354,9.32,330 1930 400. 20S, 431 1931 43.S, 360. 3S1 1932 - 464, 108,604 1933 495,013,756 1934 . 602, 832,609 I r.nmj tfiienii-l for th« Wtshlnrloo Railway A Klntrlc ComiMDy b D<it inclu<Jcd Id IheM n^ros. Federal Power Commission. National Power Sur- vey, Cost of Distribution of Electricity 1936. SCALE .7 A. Population of the Principal Cities Served by the Potonnac Electric Power Company in 1934, and Trend. of Service Growth from 1929 to 1934. These are simple tables arranged accord- ing to magnitudes and chronologi- cally. Note that the arrangement is from the top down.
  39. 36 GRAPHIC PRESENTATION MANUFACTURES. Tabls M.-DrrAILBD eTATKMBirT FOB TIB TmiTBD

    TATm. < m lunrMPm CI 'sm Mi. i. ^UJi' " GENERAL TABLBB. BT OBOOIUPHIO DIYIBIOirS AND BTATK8: lilt TtSii, •uu. •Mfftf
  40. TABULATION 37 Value of VtiUic-lluildinn and HifihtvayConatrtution Awards Financed If

    holly From Slate Funds ' Otocraphio division All divisions. New Kii?liinil Middle .Mliintir K.Bst North ('nntral.. West Niirtli Oiitral. South .Mliiiitu- East South rentral.. West South Central. Mountain Pacific Value of awards for public building ' June 1038 May 1U38 June 1037 $1. 70^748 I0:<.8II v:»y. 1177 431. 47'.' :is. us.') 29. 15(i 15l»,853 6,500 $U3M. Jll 4. J.-.-i 4;ti.(i:i7 «.M.i):t2 i.r.'io lOS. 471' 23, (HM) IS, 02.5 $<..'.02,4fi7 H74 4.1. .'.;:< 3S4. i'2H :t77. 401 3. '.tiy 402. (KK) lO'.i. OGU 9.'. -.112 8:i, 800 Value of awards for highway con- struction June 1938 May 1038 June 1037 tl2,230,009 $13,571,006 42J.t.71 3. 7.14, 975 2. 930, "t-H 074.012 920.816 l,(m. 135 1,303. 3V4 4. 147 2. 4.S3, 148 I 18,621,883 614,837 1.821.320 2,479.513 1,008.710 388. 732 191. 2J2 876, .143 161. 123 1. 079. 853 ' Preliminary, subject to revision. ' Data for building projects which were located in the cities reporting to the Bureau are included also in tables 1, 2,3,5, 7, 9, and II. U. S. Def)artment of Labor, Bureau of Labor Statistics. A. A Tabulation Showing the Total for All Divisions as the First Item Rather Than As the Last. 1. The total of a column may be put at the top of a table, as shown here, instead of at the bottom. 2. The use of notes to clarify box headings should be encouraged. SUMMARY OF MEN DISPATCHED FROM CENTRAL HALL REGISTERED MEN DISPATCHEC
  41. 40 GRAPHIC PRESENTATION MACHINE TABULATION Punched card tabulating machines have

    proved a great aid in sorting and accumulating data. The information need not be purely statistical. Cards such as the one shown below are the basis of the punched card plan. Each card is a general-purpose record for one item, one customer, one salesman, or one person, etc. Holes are first punched in pre-determined positions on the cards according to the data registered. A sorting machine is used to group the cards according to the information punched in them. The cards are guided automatically into receiving pockets according to the position of the punched holes in the vertical columns. The automatic sorting is made on one column at a time. It is apparent, therefore, that to arrange a group of cards in numerical sequence according to the data punched in a three-column field, the group of cards is passed through the sorting machine three times. The third step in mechanical tabulation is the automatic com- pilation of the punched data. This is done in the tabulator. In a non-printing tabulator, the information is merely accumulated in dials. In another type of machine, the data may be automatic- ally added and printed. Machines for mechanical tabulation are built by International Business Machines Company, New York City, and Remfngton Rand, Inc., New York City. Tabulating work is done on a service basis in various cities throughout the country. s«ns tmittis c«n International Business Machine Co., New York City. Punched Card for Use in Machine Tabulation. 1. Tabulating cards arc made of paper stock carefully processed to permit of extremely rapid actuation of all three machines —the punch, the sorter, and the tabulator. The card size is 7W x 3'/i". 2. Cards may be punched for each item or classification on a customer's invoice show- ing, for example, customer number, salesman, district or territory, trade class, complete item identification, and amount. 3. All cards may be balanced to a control and at any time can be sorted and tabulated to prepare various analyses.
  42. TABULATION 41 »^nti— ——*w«i lis • IL. K ^^ a;

    ff5 CO — =^r:: a < 43 ^ mm:?:^ ^nr -X ^^\n I « ili'.lilll 11 I liiiiii lil] +^ t ' - 1 , tt 11 ji ^^iliSiii imi BBUhhiHF •-"irx ifi-H WWE 'M 'H-L xt niiii. Jill! llilll :;±tLS: Em til', ili m III iljii iL'Uii •€ 16 e o c •a 9 e o 0> n 2 « a> - C7» 2 *^ K E i! < 2 > 2 -c ^ o as c 5 o- -5 ^ li a: '^ :; (0 —
  43. 42 GRAPHIC PRESENTATION MILES ri5 ^ 35 ' 45 ^

    si ^ 65 PER HOUR. JMILES PfR HOUR MllfS PER HOUR MILES PER HOUR MILES P£R HOUR MILES PER HOUR D.u.'s (/DM.) , (2D.aj (3DMJ (5auj , (vau.) Vi QT. .13^ IQT .25< l%QTs 3QTs AViQVs 43^ i .75C i $1.13 50 GAIS. 55 GALS. 60 GALS. 69 GALS. 80 GALS. GASOLINE $8.75 $9.63 i $10.50 $I2.08 14.00 $1.50 ' $3.00 H.50 i $7.50 $10.50 TIRES MAI NTf NANCE TOTAL COST COST PER MILE $4.00 $500 i6.60 $10.00 $13.00 $14.38 $17.88 \A^4 \ U9ff $22.03 $30.33 $38.63 2.2 fi 3j03^ 386^ S/>eec///jc/iease Coffper/OOOm^ 7/meSaye(/ Chs//)erMfurSoyei/ 35 to 45 $4.15 6.4 Hours $.65 35 io 55 $12.45 10.4 Hours $l.20 35 to 65 $20.75 13.2 Hours $1.57 45 to 55 $8.30 4.0 Hours $2.08 45 to 65 $16.60 6.8 Hours ^2.44 55 to 65 $8.30 2.8 Hours $2.96 The Travelers Insurance Company, Hartford, Connecticut. "Lest We Regret," 1939. SCALE .9 Graphic Tabulation Showing the High Cost of Speeding in the United States. This table is based on a 1000-mile journey, with an average car, average roads, and an average driver. It does not include the economic cost of accidents, which rises in proportion to the speed at which the car is traveling.
  44. 43 Chapter 4 CLASSinCATION CHARTS IN a Classification chart the

    facts, data, etc., are arranged so that the place of each in relation to all others is readily seen. Quantities need not be given, although a quantitative analysis adds to the value of a classification chart. Brackets and arrows are effective tools to use in a classification chart. REFERENCES Karsten, Karl G., Charts and Graphs, Prentice-Hall, Inc., New York City, 1923. Riggleman, John R., and Ira N. Frisbee, Business Statistics, 2nd edition, 1938, McGraw-Hill Book Co., Inc., New York City. Man o" War WAR ADMIRAL, br. c, 1934 Fair Play T , c ^ I * Fair Mahubah y Gold ftrushup Hard TacW {» Rock Sand Merry Token e /Ben Brush Sweep 1 n- 1 n '^ IPink Domino » »k 1/ J Harry of Hereford i * Bathinq birl Swing On { 5EABISCUIT, b. c, 4933 f w vA/ / Pair Play I Man War A .. , .1 J IManubab It a L / * Rock Sane U"^'""'^ I Teas Over / Broomsl I Audicnci { Wiskbroom 2d Balance ick belais Balancoire • Imported. War Admiral bred by SO Riddle Scabiscuit bred by Wheailey Stable, (Mrs H.C. Phipps). The Pedigrees of the Race Horses War Admiral and Seabiscuit. 1. This chart shows the use of brackets in classification of data. The orig- inal was in newsprint. 2. The subject matter of this chart is the geneology of two race horses. (The pedigrees of War Admiral and Seabiscuit show that they are both descendants of Fair Play and also of Rock Sand.) Redrawn from New York Herald Tribune, Nov. 1, 1938.
  45. 44 GRAPHIC PRESENTATION ilttAtlAMt AMO PATMMt lOucAnoMAi OtAAMlZATlTMl otMta aTa»«

    IMfttfMU O* Cmc AMD OTMH *tOUP| U. S. Department of Interior, Office of Education, "School Life," February. 1938. SCALE .6 The Office of Education in the United States and Its Relationships. This chart is especially interesting because it shows graphically that to study one section of the myriad of groups in the government of the United States, that area must be "magnified."
  46. CLASSIFICATION CHARTS 45 Mr I -- -O -^ 'E 0)

    O c 10 > < c a> > Jli > •^ _ i! <« III *^ *r 9- IS Z o « c c '^ § E — « — • c o '•^ o
  47. 46 GRAPHIC PRESENTATION —— IllMENIAIr OnTftlCT JUNIO« HIGH SCMOd WSIKICT

    ffift ilEMENTAHV SCHOOL n I II JUNIO* HIGH SCHOOL fP^ UNIOII HIGH SCHOOL I^P?I JUNIO« COllEGi WHO WOdltS THROUGH KrAKTMENT HtAOS. miNCIfALS.ANO TtACHtKS U. S. Dcpartmrnt of Interior, Office of Education, "School Life," February, 1938. SCALE .6 An Organized City or County School System in the United States in 1937. Arrows emphasize and here show the relationship between the "people" and the school system.
  48. 48 GRAPHIC PRESENTATION Hailway hxjUlPMENT Division Tank Link Order and

    Shipping Division ( >p»TBUon . I Maintenance. .4 rHocords J ( ",Hr mil«Mjge and equaliralion accounts C StHllslicB I ( '.Hr distribution I Ix-asing of cars Equipmpnt and force Miscdlaneous upkeep I'ainting Home shops ^ fOutJet valves J Safety valves I Air brakes I Car tanks { Tests Railroad repairs. CK. \\. K. interchange rules I A. IV A. lank car specifications • ( )wniTs deft'cUs I Carriers liability I Railroad repair bills Stock supplies at U^rniinaLs. bulk plants, and warehoasos Allocation of orders for shipment of sUxk from and to refineries Buy-out points, terminals, bulk stations, warchoasus, etc. Designation of mode of transportation—Rail, water, truck, et*-. ( 'onsolidat<- or pool orders Tariff and Hati. Division ( IliNKllAL am> \dmimsthativi; DiMSION .\verage demurrage, credit, and weight agrwenents Claims —Overcharge, loss, and damage Diversion and reconsignmcnt Freight bills —checking and revising rMarkcting territories Rate surveys. .« Plant lo<-ations ^Competitive comparisons Male adjustments —Informally with railroads Rule iinil route tables I. C. C. practice and procedure Routing (technical, applicable rates, etc.) Servici- -c|uol)ilions to sales and purchasing departments Tariir and cliLssilicalion lilcs 'rru<'king and marine arrangements (local) Tracing and cx|)editing Voduction 1 . .u I Purchasing encral servK-.- U, other J M„„„f„,.if.ring departmenU 1 /Whol.-sale ^saies. ^^^^^^^^ Diilact with trade and traflic iLs.so<'iatioiis iMipcrution with carrier ollicials i PrrsoillK'l ^ 'Distribution of stinks (physical) Rureaii of exi)lusiM's regulations Clearance rules Misi I'lliineoiis 4 Railroad leases, side-track agreements, etc. 'rriins|M)rl .ser\ ill —rail, water, truck, etc. Riiutiiig - DLstribiiliiin iiml allotment of trallic as lM>twe<-ii carriers Pas.srnger trans|Kirta(i(iii \ ia rail, air, and water Metropolitan Life Iniurance Company, "Functiont of the Traffic Manaier," 193 7. SCALE .6 Traffic Department of a Large Company. The brackets in this classification were retouched. Since the important thing in such a presentation is to show relationships, the tool used, that is, the brackets, should be emphasized. Otherwise, the purpose is lost.
  49. CLASSIFICATION CHARTS 49 I WASHINGTON z MAi&ftCHusrrw 3 NEW NORK

    A CflLIPORNtA 5 COOJECncUT b OHIO 7 NtW JERStY 6 tLLINOli 9 COLORADO 10 iNDtANA 1 1 RHooe. l6uv^i0 12 VEPMONT CMIL- |6CK>0i.|tynMK K(N IN PLANT PtP SOWOlI ICMltD I r;;;/^^;^///^i \yyyyyy/A\ JL \Vyy///AV/////A\ II w/////Ay//////AVAy//A\ \mmy///m 13 WCW HAMRSHIRE ^ 14 UTAH W^^//AV/////AV;y//A^AV/////AV/////AV/yy//A\ 15 OREGON 10 MONTANA 17 MICHIGAN « N DAKOTA 19 IDAHO TO Minnesota 21 IOWA IZ MAINE. d3 PENNSYLVANIA « KAN6A5 \/M^,m\y//'-^/, \y/y///A\w/jr//A ^/ V//////At \yjy///Ay//////xmw^/A is, NEBPA5KA 2b 5 DAKOTA ex NEVADA 28 Wi6CON^lM IS> WYOMING 30 ARIZONA 31 OKLAHOMA 52 MISSOURI 35 W VIRGINIA 34 FLORIDA 35 DELAWARE 36 MAFTTLAND 37 TENNESSEE 38 TEXAS 39 LDUt5LANA 40 NEW MEXICO 41 VIRGINIA 42 KEKfTUCKY A5 ARKAN6A& 44 GEORGIA 45 MI&^'-^^PP' 46 Nl CARCXINA ^ 6. CAROL\NA 48 ALABAMA Brinton, "Graphic Methodi," McGraw-Hill, 1914. Rank of Each of the United States in Ten Educational Features in 1910. i\ \yArAM\y/x////.\ I |.v;%^/// \y//////.\ \^/M/-/A' - W///M\ Wiv/ ^:\:mf^'\^;>m^\ I I V4y////A \m;m/A/. -// YMf^/^W/Z/M \/Y./m\ I \W>.yM\ SCALE .9 1. In making a block classification chart it is important that shadings ranging from white (or light) to black are chosen to correspond to correct gradations of value. 2. The states are arranged according to their total ranking in all twelve educational features; thus Washington State which ranked among the first 12 states in all but one feature is listed first, and Alabama which ranked among the lowest 12 states in all 12 features is listed last.
  50. 50 GRAPHIC PRESENTATION METALS DAYS EXPOSURE MICH TEST GASOLINE LOW

    TEST CASOLINE BENZOL 91^. HKIM TEST 9% ANTI-KNOCK «4» LOW TEST 16% ANTI-KNOCK 97% HIGH TEST ]% ANTI- KNOCK S0% HIGH TEST 50% BENZa ANTI -KNOCK 1 1
  51. CLASSIFICATION CHARTS .Su c< T3 S a IB 1 1

    1 1 1 1 1 f • : - 1 r 1 : •
  52. GRAPHIC PRESENTATION 1 2 . 3 ^ 4 : DT

    CHART CF . „., . ^. ATOMS -nK'h^ TIm AiMM Cnmfi Acraram« l« tW NumWot oI OuUr I V*Imk* I ClKlroM PWntUry iIi lIi mi I II III V Vi Vi^ ym::it"T^tt4->7 Z2 997HU4.}^IK. 2&97|H ZtUX IB :il U2 «§[ J106 , 3J.45? 39S-i4H 'I^J _:_ - Cui 37 IT |77 iT^ I Wo QM. D i'lluiT?h(|rPd| JLpQ»IM.UZ-<' ift ll4.76llll&.oT^ 12I76|| 1276l|l26S2 , . 11U_M t^,:; i'^ ' Kb I 223^ l226-> 22a' l2W 2JI tzj&e? 2 8 i<j!a 'i>K 71 lUr* E>r«W II 40131 ^1 |lSa43Bh I62X> |l^ IklWa ll i<24i(|i r63j||KU4||. l«M|tl7XM ||- 17l«| 11 Wilri> «li.1 », I Compiled by Henry D. Hubbard of the U. S. Bureau of Standards; Publiihed by W. M. Welch Manu- facturing Company, Chicago. SCALE: Greatly Reduced A. Chart of the Atoms. Concise information on atomic structure as well as 40 different characteristics of the atoms is given in this chart. The original is lithographed in six colors, and all routine information is printed in large type. It can be obtained in two sizes, 42" x 64" and 22" X 30". Compiled by Henry D. Hubbard of the U. S. Bureau of Standards; Published by W. M. Welch Manu- facturing Company, Chicago. B. A Reproduction of One Unit of the Chart of the Atonns, and the Key Used fo Interpret All of the Graphic Illustrations on 52A. The right side is a reproduction, in one color only, of the unit which represents the element Potassium. The left side appears as a key at the lower right of each chart.
  53. 53 Chapter 5 GENEOLOGY AND GENETICS CHARTS eneology and Genetics

    Charts are known chiefly as means for tracing ancestors. Synonyms for geneology and genetics charts are: pedigree charts, genealogical charts, ancestral charts. I SAMPLE PCOieRCE CHART SHOWINO THE MANNER OF CONSTRUCTION, AND THE USE OF STANDARD AND SPECIAL SYMBOLS. iCir6 6 C^ _ _ if i * 6' 6irik' 6 d ti iikd^ x K tXPLAWATKIII Of ITMIOLI D'MQle,- O'^e""!!*; 0'3tT\n\ln>owi\., A-StiU-biiiW or M>scoima^e,X"CKi\irtT\— numbtr oi\4 sex -unVnown; OO'TwmSj Roman SnuTT's v> \h». U^V mditoX*. (^mtrotionv l\rQkM ^^urti \oca\e miwidMois, (\V«u4 ffl.T i» tt\« >\ovit\^ mon m \V«. >*iir4 qtntTo\ion who mornti >u^ countx). 31« ^oWtwnnfl Vttttr*, p\ate<i in or anMnd W»t i»dr(\4ua\') vtdv^rti S'^mbd), or* i\oi\4or4. ^or ttrtQ\r\ \roi\» R. a^toVvolit; B, blm4i ttdtaS. E. epi>«^ic, F, VtiWemmitdj I, \T»ant, Mj[m'\qr(i\ritou^;N,'norwa\ nv rtStrnvc* \t XmM Mtv4tr tQt\v4«ro.\xOT»j Nt, T»wrdl\t; P. pQr<i\x\>C; ^T, ^txuaAA)^ \mmort^, S.VtThMiC/ X tubtrtu\ouV H wanitrtr. 9* 5«cct%iSu\ \to4«ri \n pa)M^c^ O© • Ei\Ta tt\>onD on rM^W hani. Ul'H\<)hV\^ ^«^.t^^Su\ ou^Hor. L.s "VjIRt or no oMWi^ in \>)tr«r\^ iS<or1«,. #'^ui)Cr\or m volo\ »nuvt. B© » Mtdmrrv oWoinmenV. m MOtoV wuvc. To Vit \ti* fiar\>cJar SaR«\^ on4 Xro\\» (wHt>h«r pht^vtal.intntat or Uinp»Tamin*o\; qoo4 ftrVxkd) un4tr tOivMitroV^jn, vn««nt ?ptcio\ Sumbol^. or ^t\ti:\ ^ptooN \««iri(\rv adi\>nn No \rvan* ^«n4ar<lii«A \in4«T (oi obwtl \ft bi '^AUti vnS'nm or ntar VWt. paHiiuloT tn4lM^4uo\'^ p*4iv<t ^>(>>M, W in4ico\c p«T<icu\or \rovti an4 Vtwr dtt^rce a\ dtvOeprntnt- SCALE .9 Eugenic* Record Office, Cold Spring Harbor, Long Island, N. Y. Pedigree Chart ShowIr>g the Manner of Construction and the Use of Standard and Special Symbols.
  54. 54 GRAPHIC PRESENTATION •'tf , 4rd 6 d e' D*

    ti d o' " -. i Jo' rf Cf4'd do* n'b'da d'ei'd B'dVJ^'Jd'a o" dddddddd'ddn'dn'd'DdB'^d'ddoy'ed'Hd d ^. / ^/ *^m tmtJmm C* Um^'l, nw%_^ W. Eugenics Record Office, Cold Spring Harbor. Long Island, N. Y. SCALE .7 A. A Geneology Chart Showing the Actual Pedigree of Pre-Senile Lamellar Cataract. 1. Following the practice of tracing only one trait on one pedigree chart, this chart traces the trait of pre-scnile lamellar cataract. All individuals of the family tree are plotted even though all do not show the trait. 2. It would be fairly easy to construct a chart tracing the family distribution of a trait by following the principles exemplified in the above diagram. 1 n ID I • Wh.K Forclotk DO Nc Wh.H FcfloiK I 1 1 t? V • o s fy^ ^ ^ Ti 9-r9 OB D D O « 7 S « 10 h II. the firii recorded ancestor liavinn a white forelock. H-l, liis son inherited the while fore- lock And married a woman without it. ill. of their five sons three inlierited tlic white torek>ck and two did not. IV. ««howinn the four daug-hters of one son, III-J, tliree ilaiiRhters havinn inherited the white forelock and one lias not. V. sliowinf; the children of these four daugliters who married men without a white forelock : some of the cliildren of each of the three mothers possessing the white forelock have inlierited it but none of the children of the other tuotlier not possessing it have the white forehnk. Lyle Fitch "Inheritance of a White Forelock," The Journal of Heredity, Novemtwr, 193 7, American Genetic Auociation, Washington, D. C. SCALE .9 B. Five Successive Generations Showing Donninant Inheritance of a White Forelock in the Logsdon Family. Explanations below a geneology chart are helpful and should be used frequently.
  55. GENEOLOGY AND GENETICS CHARTS 55 < o o, In several

    places in this cliart the inheritance sinuilates tliat of a sex-linked dominant charac- ter, but tlie pedigree as a whole proves that the apparent association with sex is purely fortuitous. The largest sector in which sex-linked inheritance is suggested is bracketed with a dotted line. Mablr R. Walter. "Five Grnrrations of Short DiRits," The Journal of Heredity, April, IQ38, American Genetics Association, Washington. D. C. Pedigree Chart Showing Five Generations of Short Digits. 1. Deformed individuals are represented by solid symbols. 2. The use of a circular heredity chart is helpful when the number of persons in the fourth or fifth generation would necessitate too long a chart.
  56. 56 GRAPHIC PRESENTATION Codex Book Co., Inc., Norwood, Mats. A.

    A Genealogical Charf Sheef. 1. This sheet is 8'/2" x 11" and its purpose is to show graphically the genealogy of a person or the pedigree of an animal. In the central space numbered "1," the name of the individual is written. In the spaces of the concentric bands, the names of the ancestors are placed, each band representing a generation. The figures in the spaces may be used as reference numbers. 2. The fan-shaped pedigree chart, while it eliminates the difficulty of spreading over too much space, is less easy to read than 57. Theories of sound " finance Desires of rentiers with &xed money in- comes Poor harvest.^ Undue pessi- mism of busi- ness men Seasonal depression Foreign tariffs E>eflation f'r Trade de- pression L Rigid wages and prices Other (e.g. banking) conditions constant More unemployment r Fall in the (money) cost of living I Rise in pnce of fixed interest securities I More poor relief Higher insurance contributions Higher rates and taxes Additional public loans p. Sargrnt Florrnce, "Thr Statistical Method in Economics and Political Science," 1929, Krgan Paul fli Co., London. B. Genealogical Presentation of the Theory of Unennploynnent. 1. The lines in the original of this chart were undoubtedly set in type, not drawn. The lines have been retouched and thickened. 2. This chart illustrates the point that there is more than one reason for unemployment.
  57. GENEOLOGY AND GENETICS CHARTS 57 I Ancestral Publuhing H Supply

    Co., Chicago, 111. A Columnar Anceitral Chart. The left to right rather than top to bottom arrangement makes it possible to get in a great deal of information. The horizontal rather than circular arrangement makes the chart easy to read. Compare this form with 56 A
  58. 58 GRAPHIC PRESENTATION EIrctronicsi Octobrr, 1938. Part of an Editorial

    on Public Relations for Industry. The Family Tree of the Thermionic Tubes. SCALE .7 Although the term "family tree" does not necessarily mean a 'tree." the "tree" form of heredity or family chart is a well-known one. The "tree" here presented is in reality a chronological statement of events, all of which have contributed to the existence of the "thermionic tubes."
  59. 59 Chapter 6 ORGANIZATION CHARTS I'krsonnki. DiRECTOn E SuptTvisor of

    Technical Kmploymcnt and Training Medical Director SuptTvisor of Traitiinp Supervisor of Insurance and Benefits Supervisor of Research Metropolitan Life Insurance Company, •Functions of the Personnel Director," 193 7. A. Organization Chart of the Headquarters Staff of a Personnel Director Whose Company Has Units in Various Parts of the Country, .^Ji Personnrl Director r Supervisor of Employment Supervisor of Compensation Supervisor of Sales Personnel Supervisor of Training t: 1 Supervisor of Employee Helations Supervisor of Manufacturing Personnel Supervisor of OITice Personnel Metropolitan Life Insurance Company, "Functions of the Personnel Director," 193 7. B. An Organization Chart Showing That an Organization Which is Engaged in Manufacturing Also Has Special Staff Men for Both Functional and Depart- mental Problems.
  60. 60 GRAPHIC PRESENTATION I z • E il 'il <

    Mil ' IMlill mrz ^Hl -f •I mwwm ih 'ii!'ji'ilii!'L mm jii o o >- Z 3 O S t . o u. o c c j< 2 s -s ^ C HI c o c y jj c ^ o ^ I o ; > — o O jC 2 H z ir ^
  61. ORGANIZATION CHARTS 61 A. Diagram of the Organization of the

    CCC made by President Roosevelt in 1933. The most complex and widespread organi- zations may begin from just such crude drawings as this one. <^//i:, "/ [a^ \u^ ?/j, p^ ^' ^"^ ^ « Newtr>aper of the Civilian Coniervation Corpt, "Happy Dayt." April 2, 1938. SCALE .4 PURCHASING ZIZ PLANTATION (Owner or Generol Monoger) MARKETINC (0«n«r O' Monog»r) STORE OR COMMISSARY (S><yt w fvm U4O CONNECTION *1TM CREDIT INSTITUTIONS (O.ntf) Ode *tNiN' fAQMS WPA. Diviaion of Social Rrtearch, "Landlord and Tenant on the Cotton Plantation," 1936. SCALE .6 B. Organization of Enterprises on the Large and Closely Supervised Cotton Plan- tation in the United States. The organization chart starting with the top and then branching downward to small division at the bottom is perhaps the best known form of organization chart. How the branching will be done depends a great deal upon the organization.
  62. 62 GRAPHIC PRESENTATION I. Ho O«0£raphlcal SobdlTlBlons ovrici ill rincera

    II. Centnllied Geographical SubdiTlBlone Short Arms Long Fingers The Field III. Decentralized Geo- graphical SubdlTlfllons Long irns Short Fingers The Field Luther Gulick and L. Urwick, "Papcri on the Science of Administration." Institute of Public Administra- tion. N. Y. C. 1937. SCALE .6 Three Types of Geographical Division of Work. The practical application of these forms of organization may be found in government. A detailed explanation of each is in the book from which this chart was taken.
  63. ORGANIZATION CHARTS 63 NATWMAL fcLlCTRIC POWtR COMPAffY wm «»% ^

    fft-ff MOtfUl* COWMWr ^^^oftttrrmt co—P«Ht j < M rix*o tMOf* /v r ' • Hew York Times, Dccrmhrr H, 1QJ2. JlRliY Antral NWt«»ll«NTCO .1 <C JllIB^ tetrrtt M»MO¥t» StABiARD fUMKUtVICtCt : "J loetHiiftnjnfft in MU>mms 24 COMMNII i ftte B) IU1I0NALPU5IIC srtvict cow MUHICIHL )ttvic| COM Kfsiufiimmo a COMMMitS (31e 0) SCALE .6 A. An Organization Chart Showing How Holdings of the Eastern Insull Utilities Were Pledged. In order to differentiate, cross hatchings and shadings may be used effectively in an organi- zation chart. A variety of shapes as well as shadings distinguishes the divisions. I V- 1
  64. GRAPHIC PRESENTATION if i >ih ^ METER OIV. J^!.^ SWITCHGEAR

    OIV. 2441 ADVERTISING 16 SALES /| ENGINEERING SI 2098 // 304 MINISTRATION I ACCOUNT 15» 1519 OFFICERS It riNG SM DIRECTORS 16 Wettinuhouif Electric & ManufacturinR Co . PittsburRh, Pa.. 'WestiiiRhousc Industrial Relations." 1937. The Westinghouse Family Tree in 1937. This is an effective and leKitimate use of the structure of a tree. It is an organization chart superimposed upon a "family tree." Compare this form with 58.
  65. ORGANIZATION CHARTS ( ELECTORS ) 65 /^PUBLIC SAFETY^ DIRECTOR POLICE-

    FIRE -BUILDINGS WELFARE & W0RKMCXJ5E MARKETS, WEIGHTS & V MEASURES J ^ LAW ^ DIRECTOR LESI5LATI0N-ASSES3MENTS LEGAL COUNSEL-REAL ESTATE MUNICIPAL COURT ; I f PUBLIC WORKS A DIRECTOR HIGHWAYS • SEWERS RE CORDS MUNICIPAL GARASEPBOPERTV acHIGMWAY MAINTENANCE v^WASTE COLLECTION J /^PUBLIC UTILITIES^ DIRECTOR TRANSPORTATION TRAFnC STREET LISHTIN6 ^v AIRPORT 'water works^ SUPERlNTCNPgNT DISTRIBUTION SUPPLY COMMERCIAL 1. Nine members elected bi-annually. 2. Selected by Council from its membership. 3. Appointed by Council. 4. Appointed by the Mayor. 5. Three members — 1 each appointed by the Mayor, Board of Education, and University Directors. 6. Five members—3 appointed by the Mayor, and 1 each by the Board of Education and the Park Board. Annual Report of the City Manager, Cincinnati, Ohio. 1937. Organization Chart of the City of Cincinnati. SCALE .9
  66. 68 Chapter 7 RELATIONSHIP CHARTS A"RELATIONSHIP CHART" is a diagram

    in which facts, in- formation, etc., are arranged to emphasize their relation. It differs from a classification chart in that relationships may be shown without any classification of the material used. GEOGRAOhfy i^iuoootooy; .V^vif O (? CCONOM>CS From "An Outline of the Principle! of Geology" by R. M. Field, Copyright 1938. Used by Permitiion of the Publithert, Barne* & Noble, Inc. SCALE .6 A. The Relations of Geology To and Its Interrelations With Other Divisions of Knowledge. 1. This diagram suggests that geology is not an isolated thing, but is bound up with many branches of study. 2. The divisions immediately adjacent to the center of this chart are the ones most closely related to the science of geology. Those divisions on the outer edges are related to geology through the intermediate subjects. From "An Outline of the Natural Re»ource» of the United State*" by R. M. Field, Copyright 1936. Used by Permission of the Publishers, Barnes H Noble, Inc. SCALE .6 B. Relation of Natural Resources to Hunnan Activities and Interre- lations With Other Branches of Study. Although similar to the preceding chart, this diagram differs in that rela- tionships around the circle are in- dicated as well as from the center outward.
  67. RELATIONSHIP CHARTS 69 SPECIAL W*R WORK ON— MILITARY MAPPING Making

    progr«itiv« miliUry indei map of United States SURVEY OF SITES. Balloon fields Ordnance proving grounds Artillery sites Areas near cantonments Aviation fields ROUTE MAPS. Airplane routes. Motor truck routes ENGINEER REGIMENTS. Contributing 110 officers. Contributing 164 men. Training officers and enlisted men Training school for topographers. PURCHASE AND SHIPMENT OF INSTRUMENTS NEW AIRPLANE CAMERA. CONFIDENTIAL MILITARY DATA. Orientation manual. GENERAL TOPOGRAPHIC INFORMATION. TOPOGRAPHIC DRAFTING. Artillery instruction maps. Danger poster for hydroplane. French conventional signs. Base maps to scale for miscellaneous surveys '.^ >^' C'^v\\'vv'>V CONTRIBUTED TO- WAR DEPARTMENT. ' General SUff. Corps of Engineers. > Ordnance. '^' . Artillery. IcT .-V-:' I . Quartermaster. ' Signal Corps. Aviation. 'Surgeon General's Office. I Departmental commanders. ' Any officers requesting. , NAVY DEPARTMENT. Marine Corps. .COUNCIL OF NATIONAL DEFENSE. FRENCH MISSION. U. S. Department of Interior. "Thirty-ninth Annual Report of the U. S. Geological Survey." 1918. SCALE .8 Relationship Chart Showing the Contributions to War Service by the Topographic Branch of the U. S. Geological Survey. 1. In this chart, the fact that one government department cooperates extensively with others is brought out with force. 2. It would not be wise to use this form to show too many interrelationships, however, as all detail would be lost.
  68. T LajL nn m w GRAPHIC PRESENTATION Pl'RPOSE AND PROCESS

    SLBDI\ ISIONS |\ 0R(;ANIZATI0N PrIVBi* ••crstarlac lh4««k offlear AaeottBtut* r^fiifcMlM •ttumr •vitebboa^ operator Hoiorlt*d ••mo« g 'I ^ r AfttilMii •BBarlaMaAaali Pr|v«t« ••er«tart«« ni* clvrkt Cl«rk* 1>«««I offte«r Laboratory aoilvtaatt Olaoorocs %oaeb*r» •paelal toactaora LlkTarlaaa taeroatlOB laWlar* Plufgroaad mparrlat traffle auporvlaor ftvlkabbeard oparator UoiorlMd aarrli PCLia nvanar AcolitoAl Chlof* frtvaia oacroiarlaa Itaaecrapbaro ril* elarko CTarka Haoiawart la4cat off1 oar iCoouniaBto ^rehaali^ effioar CrUa laboratoT7 ataff Pellea •ehooj ttaff Valtormmd tore* Traffle foraa Jail ttaff Hountad feroa Hotorisad Borrloa V iattotMt Ot^loctoM Prlvata aeratarla llaaecraptera nia elorka Clortt BBd«at effioar ipcoulaate fttfcha«t4C off •tatlttlclMU h rill iBClMara irehltact* Laadacapa otaff Bapalr forea Jaaltora Plaat laboratory ataff Traffic foroa lae staff Tatarlaarlaa •vitebbeard operator Heterliad aarrlea IS 3 RlaiL nriwork - Puipoer dt-panmrnu RrtI network - Fiiicm drparlinrnu Luther Gulick and L. Urwick, "Papers on the Science of AdminUtration," Iiwtitute of Public Adminiitra- tion, N. Y. C, 1937. SCALE .6 The Interrelationships of the Purpose and Process Subdivisions in Organization. Four sample city departments are presented vertically, each divided into its functions and workers. A considerable number of workers are common to all or to several depart- ments. These are indicated by the horizontal red network. Thus when an organiza- tion has both purpose and process departments, interrelationships are essential, in fact, impossible to escape.
  69. GRAPHIC PRESENTATION — T3 O ^ 5 o> ° ^

    •) E « o «i O "U o SI E > w» 11 0) u o o 4) _c 52 t .5 Q. C 3 o - V « 5 u *^ ** C £ - « C O u a <c a „ 0) jy '5 «
  70. 73 Chapter 8 FLOW CHARTS low charts present a graphic

    explanation of the movement of materials, printed forms, etc., through an organization or struc- ture. "Cosmograph" is the trade name for a type of flow chart presenting numerical information or percentages by means of black and white strips of paper, showing source contrasted with destination. I Materials From the Wide-world For A World-wide Product Electric Storage Battery Co. Philadelphia, "Ezide-IroocUd Topic*." May. 1933. SCALE .5 How Charf Showing Source of Materials for Manufacture and Distribution of the Completed Product.
  71. 74 GRAPHIC PRESENTATION Month of MovCMeiR -1919- bastdupon OvfboundShip Tonnajt.

    1913. 1 * J Jamet R. Bibbins and Bion J. Arnold, "Our National Transportation System," Proceedings of New York Railroad Club, April, 1923. SCALE .9 A. Railroad Traffic Flow Diagram. The similarity between this flow chart and a simple balance sheet with "amopnts received" and "amounts paid out" is quite pronounced. Compare with 79. M«nufK~1urui|[ IVpanmrn Uiion DvptnmctiL Weekly Average Net Paid Circulation 1,910.282 Drawn Under the Direction of Willard C. Brinton in Consultation with a Firm of Certified Public Accountants. SCALE .5 B. Method of Displaying Proof of the Circulation for a Weekly Magazine. This chart resulted from a survey made by a firm of certified public accountants. Since the formation of the Audit Bureau of Circulations in Chicago, any survey like this would not be necessary.
  72. FLOW CHARTS 75 COOPERATING AG&NCIES N N N I'MTONAt. COOfctT

    NinvCt STATt ( INTtRMATt UI4MMI/AV COMWIVMON I COUNTY 4 Rt&IOMAL COUNTY PlANNINKi OTX PArjK BOARD -COOPtn- ATIN& WITH STAT6 AND CITY PLANNING BOAROl LOCAL 1 METROPOLITAN CITY Pl.ANNINfc COMMIIMON Planning tbCTiONt Of- PARK 4 ICUOOL BOAAOS NATOMAIPADK tCQVCL NATtONAL COntST »tffV>C4 U > QiCXO&CAt luRVtV CONitnvATON COMM MIGUWAV COMMltMON COOPtrJATiNG LCX.AL ACtNOtJ JL_1 COUNTY PAPlC BOARD BOAfJDOC lUPtaviKDni CCX)PtOATIN& LOCAL ACCNCitS CITV PARK BOAAO AND PATJIt DtPTV iCWOOL BOAaD\ I f I NATIONAL PARK itOVCt NATIONAL COQtlT VtnVKt u s BOLO&tCAL iuavtv VTATl CONitUVAnON COM I CON\taVATlON COMM WlGUWAY COMMimON CCX)PCr5ATiNG LOCAL A&ENCiES i N COUNTY PAn< ooAnD\ 1 PAHK DtPAnTMtNT» ICMOOL OOAnOi ntCRtATlON COMM. 1 ECDCnAL AGtNClCSTO CONTROL AND PntJtnvt AntAS Ot NATONAL IMPOOTXiMCt PQiMtVAL AQ^At ntttAfXU AOtAS NATONAL POntJT} NATIONAL PAJIICV WilLDLlCt MANGMTAQtAt HiiTonictAncw. htk^ iCCNC AOCA^ M^-NVAV^ AND PARKW/tt^ I iTATt AGtNCitS TO ACQUint DtVtLOPAND MAINTAJN CAClLlTltS TO ADCQUATt- LY MttT RtQuiRtMtNTi Of iTi PtOPLQ COO iN\Plf> ATOKNATunt tDUCATON AND ACTIVt OtCntATION NOTOTHtTNI/Ht PnOvlDCD ITATt fOQESTS JTATt PAnnS r»EStr3VATlC5N\ <WLD LIFt nCFUGtS ROADSIDt DtVtLDPMtNTJ PARitWAVS LAHtS AND nnEAMS GAMl MANAClMlNTAAlAt WliTCniCiCtNC lOthfTlfIC DtVtLOPMCNT AND OPCn- ATlON Of ATJtAS AND PROJtCTS OEVOND THE JCOPt OP LCXAL UNIT^ NOT WIDESPREAD ENOUGH TO JUlTltY HATt CONTROL COUNTY PARK.S PARKWAYS PRESERVES LAICtS PAIRGROUNDS tTC ^r^ LOCAL AGtNCItS TO ACQUIRE, DEVELOP AND MAINTAIN PAClLlTltS PRIMARILY POR LOCAL UiE NtlGWDOnwOOO AND SCWOOL PLAYGROUNDS PLAYPlELDS NEIGWBORMOOD AND •IN TOWN* PARICS LARGE PARKS PRESERVES PARK.WAYS ETC J PUBLIC RtCRtATION PACILITICS POR ALL TM& PEOPLE 1 National RctourcFt Board, "State Planning," 1Q35. A Plan for Public Recreation In Iowa. SCALE .8 The arrows indicate the "flow" of activity from four groups of cooperating agencies towards the attainment of public recreation facilities for "all the people."
  73. GRAPHIC PRESENTATION Ooial SJcpmno* J» htvJ m* tMt6o iitrm* atLJUM

    futttlr, t Ufi* CQsi of m4tititiit'^ /^e slor^ in s cond't/ot of rutjintii Kr jjas Cf^e nni» ittmt of ttpttta it ilot cUuificition art Rani. fu*l. Inter f%i on ii>u»»/m»mi Dtfirecntion on frxrurn a»a e^uipmmnl. rvpaira, a por- tion ofuj*9f dfoiud io —sinttnnnce LfA* cos^ of iiouM^ m*itAan^)n tkru /Ac processti of tkt biainrss CSt^wd tr)d itlliJici) <yf» IO*'* itmms ofttp%u» mUiii cUm trt. fioti cf U* itUrm* andimjiai, Aavrlnmd, daiirtr^ ofiantlioni. supplimt, Mywioae Oitt codt/ tk, credit function. <Ji* m*m tAmtatj or egpmt $» it ikii cUsjificthon art oH» coni of accountltd or boaikaaputd, coIk/xn ntinienAnce itd rfovemenc aown into kuK) smaller pooli LKpensc <«re cjitn broken, on the diffarenl haaes of- DiMct3iMoc*iiam. WmtDt^. jhtie pools art Chnrocd li. IKt liemi sola— * "yiiis poof /a cliar^md to tht ittt on th^ basis of dollars cjf a*ks. jftii pool on the 6dsis of an cilaiJishtd doJIar mainlen ance etpensrper JolLrcliJti pro n/rt^d to ittms iMrtct //lis poolon the t)Jiisaf the ai>0rade muentory inuescme/ir in the /naiYidual item in the drrxcri/ cJtt*artmtnt Zfhesc pools gre chardecf fo inn>4 On the l>isis offrt^^ncifofmslu U. S. Department of Commerce, Bureau of Foreign and Domestic Commerce, March, 1934. SCALE .9 The Commodity Cost Accounting Method Employed in a Survey Made by the Domestic Commerce Division of the U. S. Bureau of Foreign and Domestic Commerce. 1. Flow charts to indicate accounting methods are well known. 2. Similar charts are used to indicate terminology to be applied to certain classifications. For example, in a foreign trade chart cf this type, it could be indicated by means of boxes and arrows that the term "domestic imports" applies to those products which are exported by ut in raw material form and then imported in another form.
  74. FLOW CHARTS n MRVATI MAWI10WCI PUMX MMMTOVI MIMIC MAMTINANO AND

    •TAW* t«M,eM,Me lailroo^f, StTMt ^1^3. Railwoyt ft Subwoyt (400.000 000 Pip* lin*f. (Ml •! tl5.000.000 o* Production >d Oittribution (75.000.000 ph ghwoyt ft lrld9*l .315.000.000 T*l«phono ft T«l*9 $145,000,000 I CONSTIUCTION coiiv*m privat* tavia^t into pro4o<tlv« strwrtvrct and witfc public Mvinqi raitvt commaiilty «tM<«rdi •< liviaq. It pr«d»c»» tk* >tr»ct»r«i that pravidc our tkclter. traiiip*rtatieii, cemnmBicotioii, drf«BM, p«w(r. li^t. k*«t. water, watt* di>p«>«l. rocrratioa, coairrvatiea and dcvclopmeirt of ewr aatioiial re>ourc*<. Bngineerinc Newi Record, October, 1938, Part of an Editorial on "The Conatniction Indiutry, What It i»— What It Doe*.- SCALE .7 The Wide Range of Construction in the United States. Here again is a simple balance sheet, with the emphasis on the places from which the money for construction came, and the places to which it went.
  75. 78 GRAPHIC PRESENTATION International Butineti Machines Corp., N. Y. C.

    A. The Use of a Cosmograph to Make a Flow Chart. 1. The "Cosmograph" is a flow chart made by using the device shown above. One thousand strips of paper are set on edge to represent 100%, and are separated into com- ponent parts of 100%. 2. These two illustrations give two steps in making a "Cosmograph." The first shows the process of locating and firmly clamping the strips of paper into position. The second shows wedge spacers and bar spacers being inserted between groups of strips of paper. Tha Ant Of nagoliva phottMlohc prim of Ih* Cotmogroph M(-up ot tho lofl. International Butinrts Machines Corp., N. Y. C. B. The Completed Cosmograph. 1. Border guides are placed in position to block out excess ends of the paper strips and the Cosmograph is ready for photostatting. 2. The negative photostatic print appears at the right. Note that all black portions of the device fail to reproduce. Of the one thousand strips of paper, twenty are red and are set at each 5% mark. In the negative photostat, these red strips of paper repro- duce as white.
  76. FLOW CHARTS 79 u o o z o z g

    D m a. </) o 111 < o q: hi o u z § 8 *- .o I :5 1 i n E -^ v2 E .2 « Q. o tS J 8 ^ o .!! « ii O ^ « 0» a - c -f •» i - = O c < H
  77. 80 GRAPHIC PRESENTATION International Butinest Machine* Corp., N. Y. C.

    SCALE .6 A. Cosmograph Showing Distribution of German Reparation Payments. 1. The left side of the chart shows the total amount of reparations, and the countries by which they were received. The center of the chart shows the amounts retained by each country, indicated by the broken portions of the branches. The right side of the chart shows the amounts paid in turn by the several countries to the United States. The extreme right shows the total amount received by the United States. 2. The effect of the broken branches is obtained by sliding the paper strips backward until their ends lie at the center of the chart. The remaining strips are held in position at the center by the insertion of wedges. ll'TTtUit International Butineti Machines Corp., N. Y. C. SCALE .6 B. Cosmograph Showing Simple Income and Outgo. 1. In setting up such a chart, the center trunk is clamped in the usual manner. The income side of the chart is set up and clamped, the board is turned and the expenditure side is arranged and clamped. 2. A short strip of black paper is pasted across the trunk to provide a white block on the negative photostatic print. The total money value is noted in type on this white block.
  78. 81 Chapter 9 SECTOR CHARTS ASECTOR chart presents data in

    the form of a circle. The circle is divided along its radii so that the angle of each sec- tion is proportional to the factual data it represents. Other terms used for sector chart are: pie chart, divided circle. In practically every instance in which material is presented in a sector chart, the same information might also be presented in bar charts. See Chapters 10 and 12. I From D. P. Donnant, "StatUtical Account of the United State* of America," 1805, Oeeenland Ai Nofria, London. The Chart Wa« Made by William Playfair. SCALE .5 Statistical Representation of the United States of America in 1805. 1. This, so far as is known, was one of the first sector charts. William Playfair, the man who invented the method, called it a "divided circle." 2. In Statiatical Breviary, 1801, William Playfair presented a group of circles whose areas were equal to the areas of the countries they represented. The circle representing the Turkish Empire was divided into 3 sections. Since this preceded the illustration above in point of time, it may have been the first sector chart.
  79. 82 GRAPHIC PRESENTATION A. Employment and Unemploymenf Experience of 129

    Displaced Hand Cigar Makers in Man- chester, N. Y., as Recorded Five Years After the Lay-off. 1. Divisions within divisions are possible in the sector chart. Here two cate- gories, employed and unemployed, are further divided so that the circle is in reality divided into four parts. 2. Shading pieces of the sector chart makes the chart easier to read. Works Progress Administration, National Re- search Project, "Summary of Findings to Date," March, 1938. SCALE .5 INTEREST, RENTS. OTMER SMALL SOURCES il3.SS2,T85,000 DIVIDENDS FROM OTHER CORPORATIONS $2.a9C,041.000 (1%) Factory Management and Maintenance, October, 1938, Part of an Editorial on Public Relations Entitled, "How a Company Can Make Simple Reports to Its Employees." SCALE .8 B. Sources of the Total Income of Manufacturing Industries for the Period 1929- 1935. Total $330,709,960,000. The sector chart gives an angle and area comparison. The relative merits of the sector chart and the 100% bar chart in presenting the same facts arc disputed.
  80. SECTOR CHARTS 83 TO EMfLOYCCS IN SALARIES (mt inclu^in^ ttltrm

    •( cMsptny •ffici % 11.034,050,000 (1«.5%) TO OWNERS AS DIVIDENDS i U,904.C02,000 (19 2'/.) TO MANAGEMENT talirits of company offictri $ «,209. STC.OOO (8V.) Factory Managrmrnt and Maintenance, October, 1Q38, Part of an Editorial on Public Relations Entitled, "How Much Employee!, Management, and Owners Got." SCALE .6 A. Total Paid Employees, Management, and Owners for the Period 1929-1935 in Manufacturing Industries. 1. In all three of the sector charts presented , the largest component part has been placed on the top section of the circle. For artistic balance and eye appeal this may be the preferred practice. But to aid in making comparisons between any two of these, it probably would have been better to arrange the sections as shown in 88B. 2. Expenditures and income of the manufacturing industries are shown in this chart and 83B. SNNT F*r Mirctt and Rant tt.in,a:.o«« (i.«%) SffNT I «f PiMt aMt ^ylplMIlt S<1.«*«.TS«,0M Far T»«a }t.4«0,IM.SS0 AVAILABLE Far EmploYtti, Manaqamcnt, Ownara i7e.M2,)*4.«e« (tl.2%) Factory Management and Maintenance, October, 1938, Part of an Editorial on Public Relations Entitled, "How a Company Can Make Simple Reports to Its Employees." SCALE .6 B. Disposition of Total Income of Manufacturing Industries for the Period 1929- 1935. Total $330,709,960,000. 1. When it is impossible to place the titles for the compyonent parts of a sector chart in a horizontal position within the section, the above method exemplifies good practice. 2. Expenditures and income of the manufacturing industries are shown in this chart and 83A.
  81. 84 GRAPHIC PRESENTATION 1927 1930 $787,000,000 1932 $850,000,000 1934 $699,000,000

    Real estate Personal property Gasoline $608,000,000 Automobile f -^others licenses O' U. 8. Department of Agriculture, Bureau of Agricultural Economics. Sources of the Farm-Tax Dollar in the United States for the Years 1927, 1930, 1932, and 1934. The general rule regarding the arrangement of the component parts of a sector chart is that the divisions should be arranged according to magnitudes clockwise with the 12 o'clock mark as the starting point. This rule, however, is a flexible one. It should be noted that the 192 7 circle follows the general rule and establishes the arrange- ment of shadings which is adhered to in the other circles.
  82. SECTOR CHARTS 85 MIDNIGHT A. Comparison of Crimes Against Persons

    By Time Periods in Cin- cinnati in 1937. This is a comparison of areas rather than angles as can easily be seen by comparing the section labelled 18.3% with 9.9%. a ratio of about 2 to 1. The distance along the radius for each does not appear to be as 2 is to 1. (M^OOW Cincinnati, Ohio, "Municipal Activitiet." 1037. SCALE .5 1888 1938 Carpantsr
  83. 86 GRAPHIC PRESENTATION scanrr rtvo —St M«rr) OrVAJC >WTtfm» CnrvrnM

    Leonard P. Ayrci. "The War With Germany," Government Printing OflFice, 1919. A. Deaths of American Soldiers by Principal Diseases in the World War. This chart illustrates the position of a miscellaneous item when compo- nent parts are presented. Although the percentage of soldiers who died from diseases other than those listed is second to the percentage of those who died from pneumonia, it is placed last in the clockwise arrangement. Power. October. 1938, Part of an Editorial on Public Relations Entitled "Man's Power Part- ner." SCALE .8 B. Distribution of Industry's Dollar in 1937. 1. One distinctive feature about this chart is the use of a black background which emphasizes both the grey and blue sections. 2. By alternating light and dark, it is possible to make two colors do the work of four. Jnrrrtm^ifomi rtotocutrwi v^Tmow 'iimtac U. S. Department of Labor, Bureau of Labor StatUtict, "Labor Information Bulletin," October, 1936. SCALE .4 C. Total Cost of Direct Labor and Materials on PWA Construction Projects, 1933- 1936. 1. The use of many circles and the arrangement of each one makes this an interesting group of charts. 2. In order to aid in comparing one circle with another, it might have been better to have a common starting point, that is, to have the black section of each circle start at the top center as in 84. 3. Note that the numbers beneath the circle give the amount of money spent for each purpose, but have no bearing on the size of the circles.
  84. SECTOR CHARTS 87 SALES DOLLAR INVESTED DOLLAR I 4.3« Profit

    During the period 1923-1934 (latest figures available) the average profit in the manufacturing industries was equal to 4.2$ for each sales dollar, or 4.3( for each invested dollar Factory Management and. Maintenance. October, 1938, Part of an Editorial on Public Relationt Entitled, "A Program for Public-Relation*." Percentage of Profit from a Sales Dollar and an Invested Dollar. 1. The use of a dollar or other coin in place of a circle adds to the effectiveness of a sector chart. 2. It might have been better to place the section labelled "Profit" at the 12 o'clock mark. The difTcrence between 4.2 and 4.3 is so slight that the eye has difficulty in noting it. Because the sections are centered on the 6 o'clock mark, it is even more difficult to sec the difTcrence.
  85. 88 GRAPHIC PRESENTATION NET IMPORTS NET EXPORTS U. S. Department

    of Agriculture, Bureau of Agricultural Economics. SCALE .7 A. Average World Trade in Apples by Countries for the Five Year Period from 1928 to 1932. 1. The lettering on this chart, the method of division, and the arrangement of the sections should be commended. Although labels usually are kept on a horizontal plane, the small size of the sections may make it impossible to follow this method even by the use of arrows. 2. These data might be more clearly shown by a 100% bar chart. I9I0-I9I4 1924-1929 AV. PRODUCTION 2,614,000,000 BUS. AV. PRODUCTION 2,610,000,000 BUS. U. S. Department of Agriculture, Bureau of Agricultural Economic*. SCALE .7 B. Distribution of Corn in the United States for the Two Periods 19 10- 1 9 14 and 1924-1929. 1. This chart presents the best method of dividing the circle and labelling its parts. 2. The chart is marked clockwise in magnitudes with the first line beginning at 12 o'clock. 3. The lettering of the sections is on a horizontal plane so that it is not necessary to turn the chart to read the labels.
  86. SECTOR CHARTS 89 I American Society of Mechanical Engineers, N.

    Y. C, "Mechanical Engineering," February, 1921. SCALE .5 A. Average Annual Net Expenditure of the Federal Governnnent During the Period 1910 to 1919, and for the Same Period Exclusive of War Cost. 1. If you think of this type of chart as two sector charts, one larger than the other with the smaller on top, it is much easier to understand. 2. It would have been impossible to put the titles of the segments on a horizontal plane in this sector chart. Care has been taken, however, to make the lettering clear. American Atiociation of State Highway Official!, 'American Highway*." April. 1938. SCALE .5 B. Distribution of the Total Federal Budget for 1937 and 1939, Since the budget for highways was the point of emphasis, public works, of which it ia « part, was placed at the center top. Note that public works only was subdivides) to allow for this emphasis.
  87. 90 GRAPHIC PRESENTATION A. Assets and Liabilities of the Elgin

    National Watch Company in 1937. This differs from the sector chart below in that the dividing line between the assets and liabilities is a ver- tical one rather than a horizontal one. LIAMLITICS Elgin National Watch Co.. Elgin, Illinois, "Let's Look at the Record of 1937." South Manchuria Railway Co., "Contemporary Manchuria," a Bimonthly Magazine, Japan, September, 1938. B. Distribution of Assets and Liabilities of the South Manchuria Railway Company in 1938. Half of this circle represents the assets of the South Manchuria Railway Company and the other half the liabilities. Each half equals 100%.
  88. SECTOR CHARTS 91 M Oc in l»l« 7.0e in ISIC

    IS.Ic in 19IC S.Sc in l»IS 4.4c in 1916 l.lc in ISIC U.»c in 1»I6 For Labor For Locofnotiv* Fuel For other Matariali and S For Loat and Danrtafe, Injuri** to Parsons, Insurancs, Pensions, Ospraciation and Retirements For Tax For Equipnrtcnt and Joint Facility Rentals Balance Rentaininf (Net I Operating Income) as on the Capital Invested Property For each Dollar of Operating Revenues Received, the Railways had $4.90 Invested in their Properties in 1916 and $6.37 in 1936. S.9056 in 1916 When the foregoinf Pannies of Net Railway Operating Income were divided among the Dollars of Investment, each Dollar received this Return J.S956 in I93C Committee on Public Relations of the Eastern Railroad. N. Y. C, "A Yearbook of Railroad Informa- tion." 1937. A Comparison of the Distribution of the Average Dollar of Operating Revenues Received by Class I Railways in 1916 and 1936. This might be called a cumulative sector chart. Note that in each circle the total of all that has been presented above it is represented by a shaded section, while the part to be added is in black.
  89. Chapter 10 100% BAR CHARTS A one hundred per cent

    bar chart is one in which a single bar represents 100% and the divisions of the bar represent percentages of the whole. Synonyms for 100% bar chart are: percentage bar chart, relative bar chart, component parts bar chart. CHARACTERISTICS OF A 100% BAR CHART: 1. A straight bar is easy to divide into parts representing ap- proximate percentages, and is more convenient to use than a sector chart. 2. The sections may be shaded or colored for contrast. 3. Groupings of the parts are possible by using brackets or engineering dimension lines. 4. A percentage scale outside the bar is more easily read. 5. To aid in using the chart for reference purposes, the actual value of the bar and its component parts should be given. 6. To eliminate any need for turning the bar, the labels should read from left to right horizontally wherever possible. 7. The bar should be wide enough to allow for differentiation, and yet not so wide that the facts presented are distorted. I T p i T T ;i >l H I I I H I T I I I M t H I ' 1 I [ I I I I [ ' I I H I I I I I H I I I I I I H ' I I I I I I I H I I I I I I I T I |l r ' ' [I I I I I I I I n I M n %e lO to >0 40 M CO 10 to M ioo% A 100% Bar Chart Stamp. scale .8 1. A rubber stamp in the form of a 100% bar chart with the percentages marked may be secured from stores handling graphic chart material or from makers of rubber stamps. 2. When a bar chart is wanted in a report, all that is necessary is to allow two inches height and six inches length in the manuscript. The chart may then be placed in this space. 3. These rubber stamps may be secured in other sizes, but they are usually six inches long. Paper on which five 100% bars have been printed is also available. This illus- tration may be used as copy for making a rubber stamp.
  90. 100% BAR CHARTS 93 ALL RAILWAYS WATERWAYS HI6HWAY9 flPCLINES MILLIONS

    OF TONS "The Ffdcral Chart Book." Prepared by the Central Statistical Board arid National Reiource* Committee, January, 1Q38. SCALE .8 A. Estimated Tonnage in the United States Originated by Principal Types of Car- riers in 1932. 1. In this chart a comparison of weights is given rather than amounts or percentages, and the scale is separated from the 100% bar. 2. The value of this chart would have been increased if the tonnage for each of the four divisions had been given. 3. The choice of shadings was unfortunate, since at the point where the two sections, "waterways" and "highways," meet, the bar seems to sag. 4. The Federal Chart Book is an experimental publication and does not stand as a docu- ment for general use. As a result, the illustrations are in a tentative and not neces- sarily final form. E HEART DISEASE NFUJIH2A a TUKI- I LoiABCTES MELLITUS PMUMONU CmOSS l-AUTOMOeiLE ACCIDENTS AtL OT "The Federal Chart Book." Prepared by th^ Central Statistical Board and National Resources Committee, January. 1938. SCALE .6 B. Percentage Distribution by Selected Causes of Deaths in the United States in 1935. 1. The 100% bar chart is a classification chart with percentages graphically presented. It gives the component parts of the total along a straight line. By making the line a bar, the component parts are more easily identified and compared. 2. Note that the percentage for each of the seven divisions is given within each section. 3. The use of connecting lines to identify small sections of a 100% bar chart with its title is here demonstrated. OCPAXTHCNT 40% 00% aoX noX -FOOO STO«£S Z0% 40% GEN MERCHANDISE STORES ' AUTOMOTIVE GROUP •OX All otmcr stores "The Federal Chart Book," Prepared by the Central Statistical Board and National Reaoureca Committee, January. J 938. SCALE .7 C. Distribution of Sales by Types of Retailers in the United States in 1935. 1. The use of brackets or engineering dimension lines to show groupings of the parts of a 100% bar chart is often useful. In this chart the titles of the individual sections are given above the bar, while the titles of the groupings indicated by brackets are given below the chart. 2. The inclusion of the percentages within each section is a decided advantage.
  91. 94 GRAPHIC PRESENTATION ^neTaxe3-2ai^A ^rantportation «nd Marketing WioninaRefi"''^ Costs-zaz*/' Automobile

    Manufacturers Association, ' Auto- mobile Facts and Figures," 1938. A. Distribution of the Cost of Gaso- line in the United States in 1936. The use of objects which can be divided into percentages is a common practice. In this chart, a gallon can is very appropriate to illus- trate the distribution of the cost of gasoline. B. Cost of a Ton of Finished Sheet Steel at a Lake Port in the United States in 1931. 1. The amounts to the left of the bar are cumulative: each one is a total of all those below it on the right hand side. 2. It might have been better to include either a percentage scale or per- centages within each division. As it is now, percentages of the total may be computed, though they are not given. ib0 65— I 24 Gauge Sheet Cost before Interest or Depreciation 26.65—1 Sheet &ar Cost ^20 15 — Ingot Cost ^14.15 - Pig Iron Co»t i iiilM rr (t:^ SEE ^^ iiiivh'rui Drprcciation $4.00 Interest on Investment 6.00 Scrap Loss Fuel Supplies Overhead 3.00 Repairs and Maintenance 4.00 Direct and Indirect Labor 15.00 Scrap Lo«
  92. 96 GRAPHIC PRESENTATION Wage ossistonce - 29 9 %- Emergency

    relief -65 3%- Cotegoficol relief - 4 8 % Oih«r Works Program vogM W.PA WOflM Civil Works WOQM CCC wogts ond subsistence Emergency work relief Soeciol progrom relief Direct emergency relief Aid to the oged, to the blind, and to dependent children $5,375,000,000 WPA, Division of Social Research, "Trends in Relief Expenditure," 1937. A. Percentage Disfribution of Total Expenditures for Public Relief and Wage As- sistance in the United States for the Years 1933-35. 1. The vertical 100% bar when divided into small sections is much easier to label than if it were horizontal. 2. It also lends itself readily to grouping by sets of brackets to show such items as total fixed charges, total operating expenses, etc.
  93. 100% BAR CHARTS 97 lUM ntANSmssiON "CCtlvlHO SUSSrtTlON Prderal Power

    Commiition, "National Power Survey," 1936. SCALE .7 Elements of Costs in the Supply of Electricity to Residential Customers In the United States in 1935. 1. By illustrating each of the elements of cost in the supply of electricity to residential customers in the United States, meaning is given to such terms as "utilization expense" and "return on investment." This form of chart would be appropriate for an annual report. 2. In this illustration, no figures are shown. When a chart is to be used in a report, figures should be given and correct relative proportions maintained.
  94. 98 Chapter 11 COMPARISON OF 100% BAR CHARTS THE CHARTS

    in this chapter are the same type as those shown in the preceding chapter. The 100% bars are grouped for com- parison purposes. 1. Since it is difficult to determine the approximate height or length of any one of the sections of a bar, it might be better to put the percentage scale at both left and right, or top and bottom. 2. The shadings should follow the general rule that when no one thing is to be emphasized, the darker shadings should be next 100% 100% All Ort.«r t Usoureas , rOttMr Loons and Discounts Savings Ranks Loon ond A|| ComlJo'n... B<'"'*» 13,116,830 ^57,24^131
  95. COMPARISON OF 100% BAR CHARTS 99 to the zero line.

    A section to be emphasized should be the darkest shade. 3. Connecting lines from one bar to the next aid the reader. 1909 TOTAL 949,338 1919 993,597 1929 951,015 WPA. National Research Project, "Summary of Findings to Date." March, 1938. Percentage Distribution of Wage Earners Employed in the Mineral Industries In the United States in 1909. 1919, 1929, and 1935.
  96. COMPARISON OF 100% BAR CHARTS 101 CHARACTERISTICS OF BAR CHARTS:

    1. Bar charts may be adapted to fit almost any application. 2. The height of each bar is easily compared. 3. There should be some order for arrangement: a. Time-series b. Magnitudes c. Geographical d. Alphabetical 4. The actual amount which each bar represents should be given. ITEMS ORDERS ORDERED ONCE IN A SIX MONTHS PERIOD ORDERED MORE THAN ONCE BUT LESS THAN 10 TIMES ORDERED 10-24 TIMES ORDERED 25-50 TIMES ORDERED more: THAN 50 TIMES Redrawn from a Chart by U. S. D«partmrnt of ARriculture, Bureau of Agricultural Economicf. Frequency of Orders of Ten Selected Candy Plants in the United States in 1930. When none of the various shading films arc available to provide cross hatchings on a chart, rulings such as these may easily be put in by hand. Care should be taken not to create weird effects such as those in 93A and 115A.
  97. 102 GRAPHIC PRESENTATION Tolol wiuia cMioi Untli>ll«4 Hi Vtoffting ^

    u*uol toc*o-«conomic Oo\t p^^ Worlitng M 0IA«f thon utuol ucio-«conom*c ctOH Ptfccnl 20 40 «0 1 1 1 1 1 1 1 r ::;:.::::.::-:.xx.:v::::::::v:vX^^^^ 80 ii /mrTT» » I r^ I ' > 3. :S±2iS2±S5^ 31 3 ---^-'-^^ I fEMAUE WORKERS Totol Wh.lt COllOf SkillM Scm.tlitlltd WPA, Division of Social Research, "Urban Workers on Relief," 1936. SCALE .6 A. Proportion of Employed Workers on Relief in Jobs of Their Usual Socio-Economic Class in the United States in May, 1934. The inclusion of the "total" bar in each of the two classifications adds to the value of this chart. PERCI 100 r
  98. COMPARISON OF 100% BAR CHARTS 103 A. Average Migratory, Employment,

    and OfF-Season Periods of 500 Migratory-Casual Workers in the United States for 1933 and 1934. Each of these bars represents one year or 52 weeks. As a result, "weeks" arc used for the scale, rather than percentages. All. «0>«fM m^ _uiiiii I WPA. Division of Social Research. "The Mi- gratory-Casual Worker." 1937. SCALE .6 PCHC£NT 100 PERCENT 100 IturuiTlO ruu. TiMC 1037 NCUPVOTCO WPA. National Research Project. "Recent Trends in Employment and Unemployment." December. 1Q37. SCALE .7 B. Employment Status of Employable Persons As Revealed in the Philadelphia Un- employment Sample for the Years 1929-1937. Notice that the hachures are arranged according to relative darkness. See Chapter 9.
  99. GRAPHIC PRESENTATION t " ' ] No emptoymen* Of public

    oid t¥:»3 Relief ond o«her {''yj ReseHlemeni client K*i?x^ Nonognculturol employment only Aqriculturol employment only Works Progrom end ott>«r ** lOOr 90 eo 70 60 S 50 40 30 20 10 nlOO MONTANA SOUTH WISCON DAKOTA SIN WEST NORTH GEORGIA VIRGINIA CAROLINA * Including tfiose wt>o hod relief only ond relief ** Including those with Works Progrom employment combined with pnvote employment, but not including only, Works Program and private employment, orul those with relief ond Works Progrom employment Works Progrom ond relief. WPA. DivUion of Social RcMarch, "EfTectt of the Works ProKram on Rural Relief." 1938. Relief and Employment Status of Heads of Rural Households In the United States, in December, I 935. When it is not possible to give complete information within the chart itself, footnotes similar to these may be utilized. The footnotes here give a great deal more detail than would have been possible in the legend itself.
  100. COMPARISON OF 100% BAR CHARTS 105 Direct r«<ief '•' -•!

    work relief Work relief TOTAL COLORADO June October October
  101. 106 Chapter 12 MULTIPLE BAR CHARTS ach of the bars

    in the charts shown in the two preceding chap- ters represent 100%. Another use of the bar form is to have the length of the bars indicate values. The following are synonyms for bar charts when they are in a vertical position: column chart, "pipe-organ" chart, "pipe-of-Pan" chart. "flute-of-Pan" chart. Federal Reserve Aeent. New York. "Monthly Review," Sept. 1. 1935. SCALE .6 A. Estimafed Total Cash Income of Farmers in the United States from Agricultural Marketings Including Payments by the Agri- cultural Adjustment Administra- tion, for the Years 1929-1935. 1. Simple comparisons are easily repre- sented in bar form. The yearly comparison is best when presented in vertical form, the bars forming a curve. 2. The addition of the actual amounts which each bar represents would facilitate the reading of the chart and aid in its use for reference purposes. V vr.M - '/noooooto t?ff. n Prrcfnt Iron *w Sfff ' 'Xf6. 900. 000 as ftrrctnf ><>.-« ^ry- t^Ji 700 000 7 flrrcenf '-^3fxyftfw r^ifyryw' - 'Og 10(1000 l95Plrrcmt /»nw«m«w - 'fSd, 000.000 U. S. Department of Labor. Bureau of Labor Statiitics, "Labor Information Bulletin." Oc- tober, 1936. SCALE .8 B. Value of Orders Placed for Mate- rials Used on PWA Projects for the Period 1933-1936. 1. The total of the lengths of all the bars beneath the first one is equal to its length. 2. It should be noted that there is no difference between the width of the "total" bar and the others.
  102. MULTIPLE BAR CHARTS 107 WPA. "Report on ProgrcM of the

    Works Program." December, 1937. SCALE .7 A. Estimated Total Cost of Works Progress Administration Projects Placed in Operation from May 6, 1935, Through September 30, 1937. 1. The material here is arranged arcording to the magnitude of the bars. 2. Its presentation horizontally eliminates the possibility of the eye seeing a curve which would be undesirable. 3. Since stubs only are used in the vertical rulings, it might have been better to include actual figures to facilitate reading the chart. I $ PER UNIT 800 700 600 500 400 300 200 100
  103. 108 GRAPHIC PRESENTATION No schooling Partial grade school only Completed

    grode schoo< only Portiol high school only Completed high school only College 10 20 Percent 30 40 50 60 total of alt bars • 100% WPA, Division of Social Research, "Farmers on Relief and Rehabilitation," 193 7. A. Grade AHalnment of Heads of Open Country Households on Relief In the United States. October, 1935. As is indicated, the total of all the bars in this chart equals 100%. Compare this chart with 106A and I08B. 17.4 7.9 12.0 9.8 3.8 5.3 3.4 7.2 1.1 .9 SI. a AUTOMOTIVE :itiiii»n:w RAILROADS METAL CONTAINERS MACHINERY OIL, GAS, MINING AGRICULTURE HIGHWAYS SHIPBUILDING ALL OTHERS 20 as 30 5 10 15 17S7 DI3TBIBUTION OF nNISHED STEEL PBODUCCO IN THE U. S., BT CONSUMING CBOUPS The American RolIinB Mill Company, Middletown, Ohio, "37th Annual Report," 1937. SCALE .8 B. Distribution by Consuming Groups of Finished Steel Produced in the United States in 1937. Probably for variety, the titles of these bars were placed within the bars and the per- centages were placed to the left. This arrangement aids in ascertaining whether or not the total was 100%.
  104. MULTIPLE BAR CHARTS 109 m O C o o ^

    c £ SI V a > I 00 &£ .2 •> u «g O a > « ^ £ « O 13 2 c b *3 <J C 3 c C S a a>
  105. GRAPHIC PRESENTATION Georgio New Mexico South Ookoto Maine Utah Montane

    Woshington Maryland Arizona Idaho Connecticut New HarDpshire Vermont Oregon Rhode Island Wyonning Delowore Nevodo WPA, Diviiion of Social Research. 'Rural Youth on Relief," 1937. Estimated Number of Rural Youth on Relief in the United States in October. 1935. Compare with 109.
  106. MULTIPLE BAR CHARTS 111 WAGES AS ftR CfNT Of VAi

    ui 0> runn AAILAOAO R[»Ain SHOPS, STIAM FOUNDAltS Mositny LUMBCM AND T1MMK MIOOUCTS BOOTS ANO SHOES FUDNITURt • CLASS - WOOLtN WOVCN cooos _—..... —. PMINTINC ANO PUBLISHING, BOOK ANO JOB- COTTON MANUfACTUMCS CLOTHING. MEN'S, YOUTHS', ANO BOYS* MACHINE SHOPS STIEL WORKS ANO MOLLINC MILLS MACHINERY AGRICULTURAL IMPLEMENTS MOTOR-VEHICLE BODIES ANO PARTS ELECTRICAL MACHINERY. APPARATUS, ETC BREAD ANO BAKERY PRODUCTS WORSTED WOVEN GOODS DRESSES, WOMEN'S NONFERROUS METAL ALLOYS AND PRODUCTS LEATHER. TANNED AND FINISHED REFRIGERATORS — RUBBER TIRES AND INNER TUBES— BOXES. PAPER COATS AND SUITS. WOMEN'S. ETC. PRINTING ANO PUBLISHING. NEWSPAPER. ETC. PAPER CONFECTIONERY - - LIQUORS, MALT - CHEMICALS CANNED AND DRIED FRUITS . VEGETABLES, ETC. TIN CANS AND OTHER TINWARE-- MOTOR vtHrCLES COKE-OVEN PRODUCTS CAS. MANUFACTURED - PAINTS AND VARNISHES - DRUGS AND MEDICINES -- PETROLEUM REFINING ~ MEAT PACKING, WHOLESALE FOOD PREPARATIONS BLAST-FURNACE PRODUCTS " FEEDS. PREPARED SUGAR REFINING. CANE- - BUTTER - FLOUR ANO GRAIN-MILL PRODUCTS COPPER. SMELTING ANO REFINING CIGARETTES - - SHORTENINGS (OTHER THAN LARD), OILS. ETC :^ I2.0| I0.«| 1 ALL MANUFACTURING INDUSTRIES. 1899-1935 I National Induitrial Conference Board. Inc., February 18, 1938. SCALE 7 The Percentage of Value of Products Which Is Expended for Labor in \A(ages in Fifty Leading Manufacturing Industries in the United States in 1935. The inclusion of the value at the end of each bar, while it eliminates the necessity for two eye movements, visually decreases the length of the bars. It might have been better to put the values in a column on the left.
  107. 112 GRAPHIC PRESENTATION Woshmglon, D C New York, N Y

    Scronlon, Po Peono, III Stou« Foils, S Doh Milwoukee Wis St Louis, Mo Son Froncisco, Coht Boston, Moss Minneopoiis, Mmn Nework, N J Cincinnoli, Ohio Atlonlo, Go Pittsburgh, Po Chicago, III Philodelphio, Po Omoho, Nebr Norfolk, Vo Richmond, Vo Bridgeport, Conn Cieveiond, Ohio Albuquerque, N Me« Boltimore, Md Binghomton, N Y Rochester, N Y Detroit, Mich Foil River, Moss Memphis, Tenn Tucson, Ariz Dollos, Tex Providence, R I Buffolo, N Y Butte, Mont Houston, Tex Louisville, Ky Wmston-Solem, N C Knoxville, Tenn Oklohomo City, Okia Denver, Colo Portlond, Mome Cedor Ropids, lowo Indionopolis, Ind Columbia, S C Jocksonville, Flo Konsos City, Mo Los Anqeles, Co lit New Orleons, La El Poso, Tex Solt Loke City, Utoh Clorksburg, W Vo Columbus, Ohio Monchester, N H Little Rock, Ark Spokone, Wosh Seattle, Wosh Birminghom, Alo Wichita, Kons Mobile, Alo Portlond, Oreg 20 40 60 Percent 80 100 120 140 160 ^ nr -ZML ^ m ^=3 =:f E ^ WPA, Division of Social Research, "Intercity Difference* in Cost of Living —59 Cities," March, 1935. Relative Rents for a 4-Person Manual Worker's Family in Each of 59 Cities in the United States, March, 1935. 1. The 100% line here gives a good measuring rod for comparisons. 2. The chart would be read as follows: the four cities, Detroit, Michigan, Fall River, Massa- chusetts, Memphis, Tennessee, and Tucson, Arizona, may be described as average cities so far as rent for a 4-person manual worker's family is concerned. Rents are relatively much higher in Washington, D. C, and New York City, and relatively much lower in Mobile, Alabama, and Portland, Oregon.
  108. MULTIPLE BAR CHARTS 113 Abstracts from Time Series Charts. A

    Manual of Design and Construction. 1938, prepared by Committee on Standards for Graphic Presentation, under procedure of American Standards Association, with The American Society of Mechanical Engineers as sponsor body. TIMC-SniES CCXUAAN CHAHn A. DCFINITION Column choti art graphic prnaniotions wh«r*in fHiffl«ncol values or* r«pr«j«nt9d by lh« length ol vertical bars or caluemt. 6. THE COIUMN CHART IS PART1CULA81Y EFFECTIVE, I. To emphobie comparisons ol amounts in o single time series. 2 For popular presentation. 3 To show components lor o rekjtivelv few lolols. 4 To picture "penod' doto as ogomst "point" doNi. 5 For s>iowir^ o rar>ge of volues or deviations from a normal or bogey. C THE COIUMN CHART IS NOT THE BEST FORM: 1. For comporing several times senes 2. For lime series over an eilended period with many plottings 1. LAYOUT AND DESIGN A chon consisting of o few columns should generoify be higher than wide, for more than a few columns a wider- thon-high chort is preferoble 2 GRIDS. T)>e field or grid used for column charts may be a completely ruted coordirtote surfoca. Usuolly. however, il is not necessary to lrtd<ose all the rulirigs which would normally be shown on o line chon. A complete grid outline is usually not reauired The columns It^ewsehres generally moke vertKol rulings unnecessory. Moreover, (ewer )>ori2ontol rulings may be needed since column chorts ore more gerwrally used for popular presentation thon are line chorts. Often horizontal rulir>gs may be incomplete, being extended through only that portion of the field occup«d by the columns. 3. SCAIE SELECTION In column chorts the interest is generolly in a comparison between amounts os of different dotes. These amounts ore proportionote to the height of the columns This means Ihot the zero line, when it is ifie prir>cipot hne of reference, should olwoys be iTKluded in a column chort. It follows, too, that the omouni scoles should no* be broken, but mode continuous from the reference Ime. While normoffy the full length of the column should be shown, when it rep- resents on abr<ormally lorge value the column may be broken at the lop ond ttie omount irKitcoted. Columns should be spoced occording to their proper position on the time scale. SVhen time intervals between volues are not equal, columns should be spoced occordingfy. 4. SCALE DESIGNATIONS Ptocmg of scole numerals ond captions on coKimn chorts is less conventior^olized than on line charts. As the grid rulings ore ohen irKomplete, the verticol scole volues generally are ploced on the s*de where tfie rulif^gs ore complete (For exomple, if the tollesi columns ore at the right, the scole designations moy be shown on the righihond SKie only | Tifite Scale Desigrxitions are nornHslly centered ur>der tf>e columns, reodtng fiorizontally . in column chorts for popular presentotion fttfier or both omount and time designations may be ploced obove the columns & COLUMNS The eAeclive appeoronce of o column chart requires ipecol core m the design of the columns When there are only a lew cohrmrts H<ev should be norrower thon tl<e white spoce between, when there ore mony cohniuu the reverse should be trve COLUMN DESIGNATIONS It is generally more difTKult to lobcl segmented or grouped columns than curves because tfie columns themselves take up so much more of the spoce Segment labels should be placed ocross several columns il procticobte However, the space about labels should be reduced as much as possible and too much controst with the tone of the column ovoided so os not to distort the impression of the relative lengths of the columns ond segments Where labels cannot be placed on the columns, orrows may be used A key or legend should be used only when improcticoble to lobel directly. COIUMN CHART DESIGNATIONS Column chart titles con often be ploced most effectively occordmg to the distribution of the columns rather than in a fixed position ol the top Ithe usual cose with line chortsl. I Not* An •mpir<ol rtloliOns^'P b*»w—n column ond ipoc* it IXtMAtsd in ih« Chon b*iow. boMd on on octuoJ )Mt o( cHom qI root-two propofttont ond vOf'Ovi numb«f| o* columns, onm Ml wndOf -thon-hioh ond onoHlV high«r -than-wtd«. To space columns equoHv dong the titne scale, divide the ovoikibte horizontal spoce mio twice as mony spaces os there ore to be columns. Then center the columns on every other division mark begmnirtg with the First from either end.
  109. 115 Chapter 13 CONTRASTING BAR CHARTS ONE VARIATION of the

    type of bar chart shown in Chapter 12 is to differentiate the bars by using hachures. or shadings. Charts in which this technique is used are called contrasting bar charts. Green Giant brand peas Other Peas 1937 Green Giant pack increased 400% over 1930. Selling price ot Green Giants de- creased 12 1/3% since 1930. 1932 Advertising cost on Green Giants per case decreased 29% since 1930. Minnrtota Valley Canning Company, Beaver Dam , Wis., "Annual Report for the Fiscal Year Ended March 31, 1938." A. A Comparison of the Shipmenf of One Brand of Peas and the Shipment of All Others by the Minnesota Valley Canning Company in the Years 1932 and 1937. The reason for including this chart is to illustrate an optical illusion which is seldom seen and which should be avoided. Note how the bars are distorted to the left because of the cross hatchings. OISAIUNC INJURKS
  110. 116 GRAPHIC PRESENTATION Abstracts from Time Series Charts. A Manual

    of Design and Construction, 1938, prepared by Committee on Standards for Graphic Presentation, under procedure of American Standards Association, with The American Society of Mechanical Engineers as sponsor body. Specific column designs or shadings ore recommended os follows: Id) Black IsolidI for general use for narrow columns. However, a series of long narrow columns filled in solid may cause an un- pleasant optical effect. In segmented column charts, black is good for the bottom segments if they are not too large. (b| Vertical Line Shading is recommended for general use as pleasing In appearance and easy to construct. Id Diogonal Line Shading is useful only in small segments as optical illusion results if any appreciable length of column is shaded with this design, as illustrated at the right. Idl Horizontal Line Shading has limited usefulness and is not generolly recommended. (el Crosshatch Shading (diagonal! is recommended in place of black for wide columns. Crosshatch shading mode by crossing verticol and horizontal lines is not recommended. If) Dotted Shading (pebbled or stippled) is sometimes effective for columns of medium width and particularly for small segments for charts in which a third or fourth distinguishing shading is needed. (g) Hollow columns, if distinctly wider or narrower than the space between and outlined with a heavy line. Columns may present undesirable optical illusions unless slight cor- rectives are applied. A white or lightly shaded segment on top of a column may appear to spread unless the column outline is tapered about the width of a line; a block segment may appear more narrow than the rest of the column unless it is widened about the width of o line; a tall column may appear to be thinner in the middle unless the lines ore bowed out slightly. ftl i-|l OIACONAL SMAOINC MAT 'KNO' iXADINO MAT AfFCCT TMC COLUMNS APPAACHT WIDTH Effscts of improper use of shoding £20 8 ^B SIIF MflNOCNT EZ3 OfKNMNT \WTm ^_L CUtMNT lAININCS SAVINCS SICMITin SOCIAL OTHII SICUdTT ifsouica ACT OTHII SOCIAL rillNDS ot AdNCIIS (ILATIVIS Dun't Review, June, 1938. A. Means of Support of Persons 65 Years of Age or Older Living in the United States in April. 1937.
  111. CONTRASTING BAR CHARTS 117 Dun's Review, April, 1938. A. Adver+ising

    Expenditures for Newspapers, Magazines, and Radio in the United States from 1929 to 1937. 1. It might have been better to include actual figures in this chart. 2. Note the groupings, the spacing between groupings, and the narrowness of the bars. I 134.8% n Iwlcz of PriCM* Indcs of M«l( Hourly £«nuii(i 1929 - 100% Armstrong Cork Company, Lancester, Pa., "Annual Report," December 31, 1937. B. A Comparison of Weighted Average Selling Prices of All Armstrong Cork Company Products and Average Male Hourly Earnings in the Company for the Years 1929. 1936, and 1937. Rather than merely state that the year 1929 was equal to 100%, this chart visually repre- sents both index of prices and index of male hourly earnings as 100% bars.
  112. CONTRASTING BAR CHARTS 119 COST OF LIVING INOCX NUMBCRS. l«2«

    • 100 UMiTtO IMNGOOW rilANCE (PAKiS JA^AN (TOi>»0 MHO 5TATIS SWlTZtBLAMO WHOLESALE PRICES INOO NUMBOS. i«;< = 100 "'• . ^"X UNiriD STATtS UNITED niNCOOM CZtCMOSLOVAr NCTMtRLAND- I National Induitrial Conftrence Board, Inc., October 23, 1936. Cost of Living and Wholesale Prices in the United States and Specified Foreign Countries for 1929 and 1936. Compare this method of presenting two groups of facts with 144A.
  113. GRAPHIC PRESENTATION 0«n«ri ^^^^ Ttnonli Hundrtd doHors United States New

    England Middle Atlantic East North Central West Nortti Central Soutti Atlantic Eost Soutti Central West Soutti Central Mountain Pacific Seven Cotton States Alobamo Arkonsos Georgia Louisiana Mississippi Nortti Carolina Soutti Carolina WPA. Diviiion of Social Research, "Landlord and Tenant on the Cotton Plantation," 1936. SCALE ,9 Median Value of Farm Dwellings by Tenure in the United Sta+es in 1930. Divisions and subdivisions are possible in the bar chart as demonstrated in this one. The median value for the United States as a whole is first given, then for each of nine geograph- ical divisions, and finally a separation of the "Seven Cotton States" is made.
  114. 121 Chapter 14 PICTORIAL UNIT BAR CHARTS IN A pictorial

    unit bar chart comparisons are made by using a number of symbols, each of which represents a specific value. Synonyms for pictorial unit bar charts are pictogram, pictograph. The advantage of the pictorial unit chart over a chart in which large and small units are used is that there is a variation in one dimen- sion only. One R9«ire-2,000 MiKowitm mmmmimm -•' 1929 in2 7.738 1933 1934 1935 1934 iiii mm iumm 8.072 8.000 A Millionaire Is Defined Here as a Person WHt) an Annual Income of $50,000 or More 10.502 18.196 Chicago Tribune. The 1038 Chart Book." Number of Millionaires in the United States in Selected Years. 1. The reason for classifying this as a bar chart is readily seen. The rows of men create bars. 2. Since fractions are difficult to present in this form, the numerical value of each row of figures is given. 3. It might have been better to leave more space between the 1929 row and the 1932 row, since all the others are consecutive years. 4. As it appeared in the original, the 1936 row was at the top and the 1929 row at the bottom. Because it is general practice to read years from the top down, the rows were reversed.
  115. 122 GRAPHIC PRESENTATION SEPTEMBER 5251 OCTOBER 6618 NOVEMBER 6360 OECEMBEP

    4967 JANUARY 3372 FEBRUARY 2631 MARCH 2524 APRIL 2768 MAY 2702 JUNE 1918 JULY 1059 AUGUST 1023 m m EACH FIGURE REPRESENTS 250 HEN W. Sanford Evans. "Statistical Examination —GrorKian Bay Canal." Ottawa, Canada, 1916. SCALE ,9 Maximum Number of Trainmen and Yardmen Employed on Grain Trains on the Mani- toba, Saskatchewan and Alberta Divisions of the Canadian Pacific Railway in Each Month of the Crop Year I9I3-I9I4. 1. This was one of the first pictorial unit bar charts to appear, 2. Note that the numerical value of each row is given directly beneath the month. Com- pare this form with 121, 123B, and 124A.
  116. PICTORIAL UNIT BAR CHARTS 123 IN 1913 IN 1916 14

    AUTOMOBILES I30 HOUSES 56 AUTOMOBILES 63 HOIkSES From '"Humaniiinf the Greater City'i Charity" by Bertrand Brown, Department of Public Charities, City of New York. 1017. A. Comparison of the Means of Transporfation Used in the Department of Public Charities of New York City in 1913 with 1916. 1. The distinctive feature of this chart is that it is a 100% bar chart. Each row represents 100% and each figure represents 12'/^%. 2. It would be read as follows: in 1913 one out of eight, or 12V2%, of the transportation used in the Department of Public Charities in New York City, was by automobile and the rest by horses. In 1916, four out of eight, or 50% of the transportation, was by automobile and 50% was by horses. Number of TRACTORS per one thousand farm families Number per 1000 farms Successful Farming Families 357 "Heart" Farmers 246 u s Farmers 138 Meredith Publithing Co.. Des Moines, Iowa, "Successful Farming." SCALE 5 B, A Comparison of the Number of Tractors Per One Thousand Farm Families in Three Groups of Farmers in the United States. 1. The "heart" referred to in this chart means a group of states that form the heart of the farming industry, as estimated by the Meredith Publishing Company. 2. The date to which this comparison applies is not definite: the sources listed for the information given were dated 1930 and 1935.
  117. 124 GRAPHIC PRESENTATION -ooo I4.59I.OOO •*" ONE MILE 1911 32.837,000

    ONE MILE TT'TT'TT'TT'TT'7T'7t'7T"7T'7T'7T'7TTT7T7T"7v'7^'Tr Brinton. "Graphic Methods," McGraw-Hill, 1914. SCALE .9 A. Comparison of fhe Average Number of Passengers Carried Per Mile on United States Railroads in 1899 and 1911. 1. The theory behind pictorial unit bar charts is that there are more or less units rather than larger or smaller units. A pictorial unit bar chart consists of rows of symbols rather than large and small symbols. 2. In this chart, each figure represents 2000 passengers. NOPOmCdAISED 6.128 LBS OF POWC HAISED IN ni6 _ =.==„„^ IZm LBS OF POR.K. RAISED From "HumanizifiK the Greater City'i Charity" by Bertrand Brown, Department of Public Charitie*, City of New York, 1917. B. Increase in Poric Production at the Sea View Farms fThe New York City Farin Colony) from 1913 to 1916. Apparently the basis on which the pigs were placed inside the fences was this: one pig was added for each 6000 pounds of pork raised. CHARACTERISTICS OF PICTORIAL UNIT BAR CHARTS: 1. They are effective for popular presentation of educational matter. 2. They are effective to attract attention, and for publicity, ad- vertising, and propaganda.
  118. PICTORIAL UNIT BAR CHARTS 125 A. Fire Losses in the

    City of Cincin- nati from 1927 to 1936. 1. This is a unique and cfTective form in which to present fire statistics. 2. The inclusion of the numerical values adds to its usefulness. FIRE L055E5 — ^"S^ ^^ ... M^ City of Cincinnati, "Municipal Activitiet," 1936. SCALE .6 If Our Ptopl0-And Thtirs- Should Pack Up And Hovt By Molor Car, Tomorrow — How Many Would Havt To Walk? ITALY 1 MIOCS.aO WALK BERMANY I RIOCS.IOVAtR ussw. 1 RIOCt.lSO ••LN ALL moc d^^^^B^ Jf^^^^B^ ^^u^^^ ^^^^^^ tart Ma. fclaat. 10 »..al» Walfclaa Tht Flaurtt lucluit »m»*% » Truclit From "Our Country, Our People, and Their*" by M. E. Tracy, 1938. By Permittion of The Macmillan Company, Publi»her«. N. Y. C. SCALE .5 B. A Picture of Automotive Transport Facilities in Italy, Germany, Russia, and the United States in 1935 and 1936. It should be noted that although each man afoot represents ten people walking, each figure in the automobile represents one person.
  119. GRAPHIC PRESENTATION Relative Size of Oceangoing Vessels from the "Savannah"

    in 1819 to the "Super- Cunard" in 1935. 1. The universality of the graphic chart language is here illustrated. This chart was taken from a French magazine. 2. Compare with 13 IB.
  120. PICTORIAL UNIT BAR CHARTS 127 fAITII TUINOVII IIINOI MOII ftOMI

    ON ADVIITIIIO tlANOI ^-^ rr?:? iflT;-'^ TC '' Sale* ManoRcmfnt. Oct. 1, 103 7. SCALE 6 A. Comparison of Stock Turnover for Advertised and Unadvertised Brands of Goods in the United States in 1936. According to this chart, people in the United States are influenced more by advertisements for headache cures than they are by food advertisements, and are influenced by advertising in proportion to the unfamiliarity of the product advertised. I National Re«ources Board, "State Planning," 1935 SCALE .7 B. The Growth in Number of Hunters and Fishermen in Missouri from 1910 to 1934. 1. Although the height of the man and the size of the state may not represent the exact numerical value of each, the fact that there were too many hunters and fishermen in 1934 for the size of Missouri is quite apparent. 2. This chart illustrates the point made in 124Al relative to larger units or more units.
  121. 128 GRAPHIC PRESENTATION A. Adaptability to Training of 2,031 Patients

    Examined at the New York City Children's Hospital and School in October 1916. This is not a true pictorial unit bar chart, but is rather two 100% bar charts filled in with drawings of people. 1UIMU MTINIS OiSKXM. BOUHlfliat WUTi IKTONHB From "Humanizing the Greater City't Charity" by Bertrand Brown, Department of Pubhc Charitiet, City of New York. 1917. A Dou.A«'s WORTH Of Milk Feb is. 1029 hmmmL mmNs A Doijjms WORTH Of PtJ>n Bttr res a, 1029 FEaiS.1933 rcB ie.i937 <^^..^^^^ <^^-^ A DOIXAWS WORTH Of BUTTCR |
  122. 130 GRAPHIC PRESENTATION E.X«»tNOITU»«t PL« CAPITA PtR WEEK IN CENTS

    40 60 80_ 100 MISCELLANEOUS FOODS U. S Department of Labor, Burcnu of Lat>or Statistics, "Labor Information Bulletin," July 1938. Food Expenditures of Wage Earners and Lower-Salaried Clerical Workers af Suc- cessive Economic Levels in New York City for the Winter Quarter of 1934- 1936. This would be much more informative if the total annual income at each economic level had been given.
  123. PICTORIAL UNIT BAR CHARTS UI 67% ^ r. ) CITIES

    OVER* 10.000^ POPULATION RURAL AND CITIES UNDER 10,000 POPULATION PfOESTRlAN OTHER AAOTOR VEHICLE OTHER VEHICLE llNClvDmO MM TM*IM\ \ C STMtCT CAM I NON- COUISION Automobile Manufacturers Aitociation, "Automobile Facts and Figures," 1938. A. Types of Motor Vehicle Deaths in the United States In 1937. Pictures representing rural and urban districts are fairly well understood. The few strokes of the pen which were necessary to create these two captions were well worth the time. "^
  124. 132 Chapter 15 COMPARISON OF COMPONENT BAR CHARTS X he

    term "component bar" may refer to any bar which has been divided into parts. The charts in Chapters 10 and 11 are com- ponent bars in which each bar represents 100%, and the compari- son of the component parts is the important item. In this chapter, divisions of the bars are made without reducing all bars to the same length. Of DOtXARS pueuic WORK PRIVATE WORf Federal Reserve Agent, New York, "Monthly Review," Feb. 1, 1937. SCALE .7 A. Total Value of Building and Engi- neering Contracts in Thirty- seven of the United States, Showing the Proportion of Pri- vate and Public Construction from 1932 to 1936. 1. Here the component parts arc labelled in percentages, facilitating the reading of the chart. 2. Since there are so few horizontal rul- ings, it might have been better to give the numerical values of each bar. Federal Reserve Agent, New York, "Monthly Review," Nov. 1, 1936. SCALE .8 B. Comparison of the Gold Holdings of the Central Banks and Gov- ernments of 51 Other Countries and the United States in July 1931. and October 1936. 1. To prevent the reading of the top figures as the items for the 51 other countries, there should be a third set of figures placed in a position similar to the item for the United States. 2. Since both the vertical scale and the labels are put to the left of the bars, it may be more difficult to read the chart than if one or the other were placed to the right.
  125. COMPARISON OF COMPONENT BAR CHARTS 133 torAt, (hAMUo IN oMOcn

    or size or socio economic cmout in itso) 11 ill i i ^ MEN m WOMCN '^ "i III i nil iii ill i i StUISKILLED
  126. COMPARISON OF COMPONENT BAR CHARTS 135 FOR tVtRY tlOO SPtNT

    BY FAMILIES IN THE MEDIAN (tl ?40 »l.«t») INCOME GROUP OTHER GROUPS SPEND INCOME GROUP $^00- $ 749 PER YEAR MIOIAN
  127. 136 GRAPHIC PRESENTATION Oollors 600 800 1000 1200 1400 Wo»hington,

    C. »I4I4?4 Soo FroflCijco, Calif 1389 87 Minmopohs, Minn. 1367 79 NtwYork. NY. 1375.13 Cbicogo, 1 11 Milwoukce.Wis. Boston, Moss Ciev*lond, Ohio St Louis, Mo. Detroit, Micti. Scronton, Po. Cincinnoti, Otiio Piltsburgti, Po Los Angeles, Colif. Nework, N J. Baltimore, Md. Albuquerque, N Me« Phiiodelptiio, Po Bridgeport, Conn. Sioui Foils, S Ook Roctiester, NY. Tucson, Ariz. Butte, Mont. Portlond, Maine Peofio.lll Foil River, Mass. Atlcnto, Go Rictimond, Vo. Buftolo, NY. Averoge, 59 cities Omoho, Nebr Monchester, N. H. Norfolk, Vo Denver, Colo. Konsos City, Mo. Providence, R I Binghomton, N Y. Soil Loke City, Utoh Seattle, Wosh. New Orleans, Lo. Spokone, Wosh. Winston- Solem, N C Portlond, Oreg Memphis, Tenn. Louisville, Ky. Oklahoma City, Okia Jacksonville, Flo Houston, Ten Indionopolis, Ind. Coltmbio, S C. Clorksburg, W.Vo. Dallas, Te«. Cedar Rapids, lowo Columbus, Ohio Birmingham, Alo. KnoKville, Tenn. El Poso. Te. Little Rock, Ark. Wichita, Kons. Mobile. Alo Food Clolhing, Housing Household Miscel- clolhing upkeep, operation loneous ond personal core WPA. Division of Social Research, "Intercity Difference* in Costs of Living —59 Cities, " March 1935. Annual Costs of Living, by Mdjor Budqet Groups, of a 4-Person Manual Worker's Fannily in Each of 59 Cities in the United States in March 1935. Note the inclusion of the numerical values of the bars in the column at the left and the inclusion of the average for the 59 cities enumerated in this chart.
  128. COMPARISON OF COMPONENT BAR CHARTS 137 m cl Jon Apr

    1933 1934 WPA. Division of Socinl Research. "TrpnHs in Rrlicf Ex()fn(liturfs Oct Jon Apf Jul Ocl Dec 1935 SCALE .7 A. Percentage Distribution of Monthly Expenditures for Public Relief and Wage Assistance in the United States for the Period fronn January 1933 to Decem- ber 1935. 1. This chart and 137B present the same information, except that this gives percentages while 137B gives numerical values. 2. When component parts are given in a chart, the information should be presented in both these forms if possible. Works Progrom in operation I WPA. Division of Social Rcsfarch. "Trends in Relief Expenditures," 1Q37. SCALE .7 B. Trend of Monthly Expenditures for Public Relief and Wage Assistance in the United States for the Period fronn January 1933 to December 1935.
  129. 138 GRAPHIC PRESENTATION NATIONAL INCOME PHODDCED AND PAID OUT INCOME

    PRODUCED AND PAID OUT MINING AND QUARRYING I9W (950 1951 I9J2 I95J I9i4 INCOME PRODUCED AND PAID OUT METAL MINING INCOME PRODUCED AND PAID OUT NON-METAL MINING 19J0 1951 INCOHr PAID OUT ETI3 BUSINESS SAVINGS NEGATIVE BUSINESS SAVINGS EnRincrrinR and MininE Journnl. Ortobrr 1038, Part of an Editorial on Public Rrlationt Entitled "What MiimiK Mfani to the United Slates." SCALE .8 Income Produced and Paid Out in the United States with Special Reference to Cer- tain Industries from 1929 to 1934. The classification "negative business savings" means, no doubt, "losses."
  130. COMPARISON OF COMPONENT BAR CHARTS 139 roannnc nsHMC «no mmmc

    JM^aiCULTURC fH :i U. S. Dppartmfnt of Commerce. Bureau of Foreign and Domestic Commerce, "Construction Activity in the United States 1915-1937." 1938. A. Percentage Distribution of Gainful Workers in the United States by Occupations from 1870 to 1930. This chart is a scries of 100% bar charts, but is included here because of its relation to 139B. H(CM«MCAi. Dcusnacs rooo AMO Aixco MOusmcs OMniucnoM M>u$T*«s I U. S. Department of Commerce. Bureau of Foreign and Domestic Commerce, "Construction Activity in the United States 1915-1937," 1938. B. Percentage Distribution of Gainful Workers in Manufacturing, Mechanical, and Construction Industries in the United States from 1870 to 1930. Note that in 139A above, the division at the very top is labelled "Manufacturing, Mechani- cal and Construction." This chart is a further break-down of that one component. In the same way each of the component parts of 139A could be divided.
  131. 140 GRAPHIC PRESENTATION — LEG END — I I Unshaded

    areas show supplemental KVAXVVj Available watar for soil havioq ' water re^uirod Kr/ii\wiiM nfiltration capoci^Y o* OS ifKh per do^ IHHH "^ter required- laches permoolh. t^^t^y>^ Do liocb per day I. ./' "l Actual roirifoll t '.'/.tS'/W^ Oo 1 5 inches per day National Resources Board, "Report of Water Planning Committee, Part III," 1Q34. SCALE .7 Supplemental Water Required to Provide 18 Inches Total Water for Crop Use Per Day from May to October on Soils Having Various Infiltration Capacities in Atlanta, Georgia, and Bismarck, North Dakota, from 1930 to 1932. 1. These cities were only two of several for which this analysis was made. 2. The necessity for reservoirs and dams is clearly shown in an effective form.
  132. COMPARISON OF COMPONENT BAR CHARTS 141 •^te ...» \i, ^

    -S I- I. 1.-" 1-3 M.OCM TOTAL <«t*g r^wLT wCDwt wa howtw O iliOO'lt ntClaT«4i 0> BIT AytBAti rAKLY Mirr h» womtm $SI •« Land Utilization Comiriittfp. New York Building Congress, Arthur C. HoUlfn, Chairman. SCALE .8 Sources of Income and Ratio of Rent to Income for Families in Block 2007 in New York City in 1936. 1. Seldom does one find a chart in which so much information is given. While it may seem formidable at first glance, the key at the right simplifies it. 2. This amount of information in words and figures only would require many pages of text and could not make evident the interrelations clearly shown in chart form. I CHARACTERISTICS 1. Both actual amounts and percentages should be given. 2. When there is one bar to represent the total of all the others, it should be the same width as the others. 3. The amount scale may be placed at both the left and the right of the chart, or it may be placed on the side of greater sig- nificance.
  133. 142 Chapter 16 BILATERAL BAR CHARTS HETERM bilateral may refer

    to a curve or line chart as well as to a bar chart. In a bilateral bar chart the bars extend both up and down or both to the left and to the right of a common line. This results in a comparison of the distances from the line to the ends of the bars rather than from the bottom or line at the left. Bilateral bar charts are especially adapted to the presentation of profit and loss data or of deviations from normal. The following are synonyms for bilateral bar charts: two-way bar chart, two-directional bar chart. CLASS 1 RAILROAOS oenciT 12
  134. BILATERAL BAR CHARTS 143 1 PMr«t« i >ll«r»«t. Cav^aj lalai

    Dun's Rrvicw, April 1Q38. SCALE .5 Hypothetical Use of the Regional Trade Barometer of Dun's Re- view in a Comparison of In- creases or Decreases of a Com- pany's Sales from Month to Month in Each Sales District. Trade Barometers for 29 Regions in the United States in Which the Indexes of November 1938 Are Compared With the In- dexes of November 1937 in Percentage Reductions or In- creases. 21 SAN FtANCISCO 29 LOS ANCCLtS Dun's Review. February 1939. SCALE .7
  135. BILATERAL BAR CHARTS 145 1929 I9K) Dun's Review. April 1Q38.

    193$ A. Profit-and-Dividend Status of 348 Corporations in the United States for the Period from 1929 to 1935. Here again is a group of 100% bar charts. Note that the two types of crosshatchtngs below the zero line are in the classification "unprofitable" while the two above the zero line are in the classification "profitable." The zero line might well be heavier to emphasize this division. Typical 1. Paring knives priced at ^ 0.72 per doz. Right
  136. 146 GRAPHIC PRESENTATION •ILLIONS or OOLLAMS INVESTMeNTS 0. i coy,

    OTHER DIReCT LOANS TOTAL INVISTMCHTS 0«uC iMf ON SCCUKITIIS • I S.« LOANS COMMJRCIAL
  137. BILATERAL BAR CHARTS 147 MILES OF LINE NET INCOME PER

    Mil «».t*« lft.49* it^»» »>,ieo BSWEDEN S4,tt4 L IaustraliaH I -fa DEFICIT PER MILE OF LINE 'l ISTATt, ^$296 M,M* INDIA I93i* I I a»,Me *fiiC*L rt*ti NationnI lndM«lri.il Coiifrrrnce BonrH. \nc . N Y C . April 22. 19.18. SCALE .7 Net Income or Deficit of Governmentally Owned or Operated Railways for Various Foreign Countries in 1935 or 1936. 1. The point of interest in this chart is the net income or deficit of the various railroads. Tlic number of miles of line were probably included to show that there is no evi- dent relationship between the length of the railroad and profit or loss. 2. The dividing line between the two groups of bars in this chart is not a zero line with plus and minus quantities to right and left, since miles are the quantity on one side and dollars the quantity on the other. 3. Thus the arrangement of the bars alone makes this a bilateral bar chart.
  138. 148 GRAPHIC PRESENTATION Female Percent 60 50 40 30 20

    10 I 1 1 \ 1 r Agriculture Forestry and Fishing Extraction of Minerals Manufacturing and Mechanical Industries Transportation and Communication Trade Public Service Professional Service Domestic ond Personal Service Clericol Occupotions Male Percent 20 30 40 50 60 Relief 1934 Census 1930 WPA, Division of Social Rcsr.-irch, "Urban Workrrs on Rclirf." 1036. Usual Occupation of Unemployed Workers on Relief in 1934 and Gainful Workers in 1930 in the United States. The method of reading tfiis chart is as follows: according to the 1930 census about 42% of male gainful workers were in the manufacturing and mechanical industries. In 1934 about 52% of the men on relief designated manufacturing and mechanical industries as their former place of employment. This latter fact does not seem so startling in view of the first statement.
  139. 149 Chapter 17 AREA BAR CHARTS THE BASIS of comparison

    in an area bar chart is the area of the bar rather than the length of the bar. Other terms appHed to this type of chart are, 100% square; 100% block. M CXNTt Nl HCMM AVIMAM BUIIIIIiga IN CINIt ff« MOU* AVCMASC FOa AU TYKt KKSKT Of TOTAL HOUK OH WMKM MTMCKT WAS tAUD lOO % s I, *7*, 000,000 HOUM WPA. "Report on Progrpss of the Worki Program." December 1937. Average Hourly Earnings of Persons Ennployed on Works Progress Administration Projects, by Types of Projects for the Period from January through October 1937. 1. As both the percentage of the total number of hours and the earnings per hour are given, it is possible to compute from this chart the actual amount of expenditure for each type of project. 2. The chart indicates without computation in which projects earnings are above the average and which ones fall below.
  140. 150 GRAPHIC PRESENTATION •f 140 •f 110 •f I to

    MO ••> I 00 --9 + 00 •• 70 •• 60 - SO •(- 40 •(- 10 •I- 20 + I J.R.H. CORP. ». ••RIGHT PRICE'* - I - «0 - 10 - 40 - 50
  141. AREA BAR CHARTS 151 CHARACTERISTICS OF AREA BAR CHARTS: 1.

    Useful in presentinj; material which ^ivcs parts of a total. 2. They show in one view two independent {groups of facts. (M"M foci '•L U«NU>^*C TURING &N0 UCCHANICAL 29 4 INOUSTBll J INOUSTBUS AND scnviccs TDANSPOATATION ANO COMMUNICATION OOMISTIC AND PCDSONAL scnvicc acbicoltuhe. fisminc, and ^oblic siBvice M.» 4t.4 91.* I National Industrial Confcrcncr Board, Inc. N Y. C, February 11. 1937 SCALE 7 Proportion of the Working Population Covered by the Old Age Provisions of the Social Security Act in the United States, Using the Distribution of Occupa- tions of the 1930 Census. 1. Not only the percentage covered or not covered by old-age provisions of the Social Security Act is presented, but also the percentage of the total working force of each of the types of labor. 2. If only the percentage covered in each type of industry were given, the representation would be obviously false.
  142. 152 GRAPHIC PRESENTATION Massachusrtts Institute of TechnoloRy, "The. Technology Review."

    February 1933. Occupational Distribution in 1930 of 134 MIT Graduates of the Classes of 1917 to 1929 Inclusive. 1. This chart is in reality a group of 100% bar charts. It was placed in this chapter because of its resemblance to the preceding charts. 2. The emphasis on the area for "Major Executive" tends to make the comparison a vertical one, resulting in area comparison. CHARACTERISTICS OF AREA BARCHARTS: Area bar charts may take one of two forms: a. They may have one dimension in percentages of a total and the second dimension in numerical values. b. They may have both dimensions in percentages of two different totals. They then become 100% squares or blocks.
  143. 153 Chapter 18 GENERAL USE OF MAPS DOTS, circles, bars,

    curves, symbols, etc., may be placed on a base map to give the geographic location of statistical data. When used in this way, the general term "statistical map" may be applied. Synonyms for statistical map are cartogram, map chart. GENERAL REFERENCES Paullin, Charles O., Atlas of the Historical Geography of the United States, Carnegie Institute of Washington and Ameri- can Geographical Society of New York, 1932 Raisz, Erwin, General Cartography, McGraw-Hill Book Co., Inc., New York City, 1938 I Encyclopedia Americana. Outline Sketch of Borgia Map of the Fifteenth Century, A. D. 1. Man's earliest maps consisted of simple drawings. The map shown above is in a more advanced form. 2. Long before the Christian era, people living in Egypt and Mesopotamia constructed maps. For an early Mesopotamian map, see 170.
  144. 154 GRAPHIC PRESENTATION Encyclopedia Americana. Maps Drawn on Orthographic and

    S+ereographic Projection on the Plane of a Horizon, 1. When the discovery was made that the earth was round, map-makers were faced with the problem of how to present on a plane a picture which was best presented by a globe. 2. This involved transforming the lines of latitude and longitude on the earth into planer magnitudes. 3. The projections above illustrate two of many solutions to this problem. BASE MAPS Base maps to be used for presenting quantitative data may be secured from the following companies: American Map Co., New York, N. Y. Educational Exhibition Co., Providence, R. I. C. S. Hammond ^^ Co., New York, N. Y. Rand-McNally Co., New York, Chicago, Washington, D. C, San Francisco, and Los Angeles Maps may be ordered in many different forms: paper; cloth- mounted; sized surface; washable surface; wooden rollers; spring- roller case; pin-map board; cork carpet for pins; framed and braced. In making graphic representations of different sections of a city, it is often difficult to secure base maps of a suitable scale. Fre- quently maps can be obtained from the various city departments, or from public utility companies covering the area of special interest.
  145. GENERAL USE OF MAPS 155 ""^JjENERAL information about United States

    government ^^^m maps may be secured from Map Information Office, North H^H Interior Department Building, Washington, D. C. Aerial photographs are card-indexed, as well as other maps. This enables the Map Information Office generally to state whether or not an area has been photographed, and if so. from what source prints are procurable. The following are important government mapping agencies from which maps may be obtained directly: Geological Survey, U. S. Department of Interior. Basic topo- graphic maps of approximately one-half the United States. Key wo* 160* wo* 120* lOO' 80* 60* *0 20' o" 20* 40* 60* 80* ICO* 120* 1*0' 160' l«0* -«*—— J<7C/P L/NtS JHOV¥ ACTUAL POSmONS Of IamO Af^O iVArCff A^fAS. ^^A-^ Dotrco Aff£AS Sffotv rne posfrio»fs Acco/foiMC ro MefrcATOffS MAPOf /SM. Encyclopedia A.nfricana. A Map Drawn on Mercator Projection, A "Developed" Projection. 1. The term "developed" is derived from' the method: a cylindrical or conical surface is substituted for the plane of projection and then is "developed" or rolled out in a plane. The two types of projection most commonly used today are the Mercator and the polyconic. 2. The Mercator projection was first introduced in 1568 by Gerardus Mercator. a Flemish lecturer on geography and astronomy. In the Mercator projection a tangent cylinder is employed. The meridians and parallels of latitude cut each other at right angles and are represented by straight lines. 3. The polyconic projection employs an infinite number of tangent cones. The starting point for these cones is at the middle parallel or latitude of the area mapped. 4. See 267.
  146. ^^^ GRAPHIC PRESENTATION |e Kcuffel H Essrr Co , New

    York City. Map Measuring Device. This instrument is used to measure lines and distances on a map. The small wheel follows the line and the distance is recorded on the dial in inches or centimeters. maps made for individual states and distributed without charge are used in ordering specific sections. Geologic maps for many sections of the United States and Alaska. Coast and Geodetic Survey, U. S. Department of Commerce. Navigational charts of the coasts of the United States and its pos- sessions. Air route maps covering the entire United States. General Land Office, U. S. Department of Interior. Wall map of the United States showing the national parks, national monu- ments, and other useful information. Maps of the 29 public-land states, Alaska, and Hawaii. Hydrograpfiic Office, Bureau of Navigation, U. S. Department of ttie Navy. Maps and charts required in navigation in foreign waters and on high seas. Corps of Engineers, U. S. Army, Engineer Reproduction Plant, Fort Humpfireys, D. C. Special topographic maps of areas of mili- tary importance. Some topographic maps not covered by the Geological Survey. Forest Service, U. S. Department of Agriculture. Geographic maps of national forests. Topographic maps of portions of them. Bureau of Reclamation, U. S. Department of Interior. Topo- graphic maps of many federal irrigation projects. Office of Indian Affairs, U. S. Department of Interior. Portions of the Indian reservations. Mississippi River Commission, Vicksburg, Missisippi. Profile of the river and topography along the shores. International (United States-Alaska-Canada) Boundary Com- mission, Washiington, D. C. Topographic maps of the United States-Canada boundary line and east boundary of Alaska Lake Survey, Patrol of Lakes and Coasts, U. S. Department of Commerce. Hydrographic charts of Great Lakes. See 160
  147. GENERAL USE OF MAPS 159 Courtesy of Commission of the

    Government of the Commonwealth of Australia From Exhibit at New York Worlds Fair, 193Q Inclined Rotating Globe So Balanced That Only Support Is Half-Inch Tube Contain- ing Electric Wires. 1. Land with the exception of the British Empire is shown in brilliant blue celluloid, raised above the aluminum surface. The British Empire is in red celluloid with the area for Australia cut out and illuminated from within so that the red of Australia shows more brilliantly than the rest of the British Empire. The sphere is over six feet in diameter, made from individual discs of plate aluminum, about 30 inches in diameter, spun to the correct spherical curvature. Discs were cut and welded to build up a continuous surface, the joints practically invisible. 2. Special feature of this globe is that it is supported by a half-inch diameter tube and rotated by internal mechanism so balanced that the axis of the earth is inclined in the proper relation. Celluloid of Australia is removable as a man-hole cover so that a small workman may go inside if necpssary. Mirror below assists in accenting the southern polar region relative to Australia.
  148. 160 GRAPHIC PRESENTATION Ford Motor Compnny. Globe Used in the

    Ford Exhibit in the Rotunda Building in Dearborn, Michigan. This relief globe docs not Rive the names of countries or cities, hut the character of the land and its relation to sources of supply and distribution of product are strikingly shown. See 155 and 156 Bureau of Chemistry and Soils, U. S. Department of Agriculture. Maps showing the character of soils. Soil Conservation Service, U. S. Department of Agriculture. Maps compiled from aerial photographs. Bureau of Public Roads, U. S. Department of Agriculture. Maps of the United States showing the federal aid system of highways. Maps of some of the states. Bureau of Agricultural Economics, U. S. Department of Agri- culture. Various maps relating to agricultural economics.
  149. 161 Chapter 19 GUIDE AND ROUTE MAPS one purpose of

    guide and route maps is to show details which might be helpful in planning moves from one point to another. The form of guide and route maps is well known, and may be used for classifications as well as for routes. REFERENCES National Resources Committee, Suggested Symbols for Plans, Maps and Charts, Washington, D. C. A free pamphlet, sent on request. U. S. Geological Survey, "Standard Symbols Adopted by the Board of Surveys and Mays," a sheet 18^" x 30". Price 40c from U. S. Geological Survey, Washington, D. C. Map Printed on a Posf Card +o Show by a Dotted Line the Advan- tage of a Parkway Crossing Croton Dam in Westchester County, New York. 1. This map in convenient form was of great assistance in securing adop- tion of the route now called the Briarcliffe - Peekskill Parkway which includes 2300 acres of forest reserve. 2. The line of dashes, purposely made heavy, indicates a direct route which is the natural extension of the Sawmill Valley Parkway. 3. Words alone would have presented a less striking argument. -*r e Orisinal at Pror>otcd by Willard C. Brinton in 1921. SCALE .7
  150. JuguSStmi GUIDE AND ROUTE MAPS 163 Eastern Air Lines. N.

    Y. C. SCALE .8 A. A Comparison of the Air Line Routes in 1928 and in 1938 of What Is Now the Eastern Air Lines in the United States. 1. A "then" and "now" comparison is easily made on two maps. 2. Note that a great deal of black ink was used and that as a result the routes and the names of the cities are easily seen. I SCALE .8 B. Connparison of the Areas of the United States and Europe. Compare the effectiveness of this with 162 A.
  151. 164 GRAPHIC PRESENTATION National Rrsourcrs Board. "Rrnort of the Watrr

    PlanniiiR Committrf, Part III," 1934. Main Electric Transmission Lines in the United States in 1933. 1. In the original of this map. the whole of the United States was given. 2. In order not to reduce the map and thus lose much of its detail, a section only is reproduced.
  152. GUIDE AND ROUTE MAPS ^^-^N^"^ 5 t & 3 s.

    *E 2 M- >< o a. -3 a C e 9 E CO Xi ^ E .2 o 0) "O ::; * E I -D !>
  153. 166 GRAPHIC PRESENTATION ..., iJCCUTU> QOUTU Nnlional Rt-sourcc» Board. "Statf

    PlanninR." 1035. SCALE .5 A. Existing Routes of Midwestern Airways and Routes Suggested by the Iowa State Planning Board. 1. Because its state planning board prepared this map, Iowa is emphasized. 2. The inclusion of states other than Iowa makes it clear why the new air routes are suggested. EnginrrririK Nrw« Record. October 1Q38. Part of an Editorial on Public Relations for Industry. SCALE .6 B. States from Which Materials and Equipnrient for the Construction of Boulder Dam Were Secured. This type of map, whether it includes one continent or the whole world, is effective in explaining the interdependence of peoples. For the construction of Boulder Dam, materials had to be secured from forty-six states.
  154. GUIDE AND ROUTE MAPS 167 I American Aviation. May 1.

    1Q38. Pictorial Map of the Route of Eastern Air Lines In 1938. 1. A pictorial map attracts and teaches. 2. Compare this with 163A. SCALE 6
  155. GRAPHIC PRESENTATION Kit A en U»l T T < ffljnf

    C/imfiinf uiamondmU *^ National Rrsourcrs Board, "State Planning," 1935. Recreation Facilities of the State of Rhode Island In 1935. SCALE .7 By means of numerous line drawings, a base map could easily be converted into a pictorial map similar to the one shown above.
  156. GUIDE AND ROUTE MAPS 169 . t|li»E)S{£Si»SI|§l<|| ill I! in!

    lilllllHllili " -a o I Q. 3 o « o o. "5 & •=
  157. 170 Chapter 20 RELIEF AND AERIAL MAPS AERIAL MAPS, whether

    actual photographs, drawings, or photographs of models give a bird's-eye view of buildings, roads, trees, mountains, cities, etc. Relief maps are best known for their use in showing elevations and surface undulations of a country, but may be used effectively also in presenting statis- tical data. Talley, Capt. B. B., Engineering Applications of Aerial fir* Ter- restrial Photogrammetry, Pitman Publishing Company, New York City The Amrricnn SrhooU of Oririitnl Rcicnrch. Nfw Havrn. Connrcticut. Clay Map from Mesopotamia, Dated About 2500 B. C. This is perhaps the oldest known map. On it are marked positions of cities, indicated by circles; mountains, indicated by scales; and rivers, indicated by wavy lines.
  158. RELIEF AND AERIAL MAPS 171 REFERENCES ON MAP PROJECTION Hinks.

    A. R., Map Projections, Cambridge University Press, England. 1922 Wnrrrn H ManniiiK. A National Plan Study Brief." Landsca()« Architecture. July 1923. American A»iociation of Land»cape Architects. Cambridge. Mass. Relief Map of the United States. 1. The purpose of this type of relief map is to aid the study of the geographical features of the nation. 2. Relief maps emphasize rivers, lakes and harbors. They are therefore especially effective for depicting facilities for water transportation.
  159. RELIEF AND AERIAL MAPS 173 Salei Managrmrnt. N. Y. C.

    SCALE .4 A. A Relief Map Showing How the United States Would Look If Each State Were on a Level Proportionate to 1937 Federal Tax Collections. 1. The percentage of the total which each state contributes to the federal government is indicated on each state. 2. Such things as population density, sales density, and wealth density can be presented in this form. Federal Power Commission, National Power Survey, "Cost of Distribution of Electrkily," l'J35 SCALE .5 B. Essential Parts of a Complete Electric Power System. 1. In this diagram of the essential parts of a complete electric power system, a hypothetical land lay-out is used, since the important point is to include the information in the smallest possible space. 2. An attempt was made in this drawing to give the effect of a "bird's-eye view"
  160. 174 GRAPHIC PRESENTATION 9. I ?« t: o ^ ji

    0) w W &£ 'E Ql .5 E — -f^ < ^ 0.
  161. RELIEF AND AERIAL MAPS 175 N.-ition;.! Rc^ourrri Board. -State Hlaiiiimi;

    1 '7 t -. SCALE .7 Bird's-Eye View of the Passamoquoddy Tidal Power Project in the State of Maine. 1. This is an example of a pictorial map suggesting contours and character of the region represented. 2. For popular presentation, this combines the qualities of the pictorial and relief types of map.
  162. RELIEF AND AERIAL MAPS 177 WPA. Division of Social Research.

    "Landlord and Tenant on the Cotton Plantation." 1936. SCALE .7 A. The Average Cotton Plantation in 1934, Even the most elementary sketches are more effective than none at all. No attempt is made in this drawing to make it appear real, yet a clear idea of an average cotton plantation is obtained. I Reprinted by Permission of the Editors of "Fortune." B. Diagram of Large Scale Logging Operations. Here again the drawing is hypothetical. Compare with 173B. SCALE .6
  163. Chapter 21 CROSSHATCHED AND COLORED MAPS X he variety of

    cross hatchings available and the use of several colors are great aids in making statistical maps. Cross hatched and colored maps are especially adaptable to the presentation of fre- quency distribution data. For suggestions relative to the use of gradations of cross hatchings and colors, see Chapter 44, "Sugges- tions for Making a Chart." Not* Connecticut ond Motsoctiustttt lompltd by townships WPA. Division of Social Research, 'Trends in Rrlicf Expenditures," 1037. SCALE .7 Distribution of 385 Sample Counties and Townships Represented in the Rural-Town Relief Study in the United States. This map accompanied a very extensive study on rural-town relief. The validity of the conclusions drawn from that study may depend upon its method of sampling.
  164. CROSSHATCHED AND COLORED MAPS Courtesy of The Pint National Bank

    of Boston. Mass . August 1Q.18. SCALE .8 A. Federal Expenditures for 1929 and 1937 Represented as Inconne of Two-Thirds of the Population of California and as Income of Thirteen States, Respectively, 1. Although federal expenditures have increased vastly since 1929, the presentation of that information in this form distorts the facts. 2. The basis for coloring the states was according to the income of the population of those states. Since the income in the United States is not distributed uniformly through- out the United States, an area comparison is not valid. 3. This would be a true presentation of facts only if the area of each of the states were in uniform proportion to its wealth. LEGEND Proporuon of Municipal area lax delinQuent for one or more years Balance of Kjiral Land i urban area < not covered by survey i [S No information Note Tax aeiiooueni lono include} DCHn orcxJerty (Win- oueni (or one a more veors ano property xM lor laxei wim tax iifns (liner puciictv or privBieiv new I New Jersey State Planning Board, "Rural Tax Delinquency in New Jersey," 1938. SCALE .6 B. Tax Delinquent Rural Land in a Section of New Jersey as of January, 1936. 1. There are many kinds and types of cross hatchings and shadings. In this map, three very simple types are used. 2. In choosing shadings be sure they are distinctive.
  165. CROSSHATCHED AND COLORED MAPS 181 1810 NUMBER OF PEOPLE PER

    SQUARE MILE E2a Under Z ^2-6 Over 6 I U S Department of Agriculture, Bureau of Agricultural Economic*. Population of a Section of the United States in 1810 and 1920. 1. A comparison of these two maps shows at a glance the sections in which the greatest growth of population had taken place in a period of 110 years. 2. In view of the 1920 map, see 179A.
  166. 182i GRAPHIC PRESENTATION 5^ \5< Bev National Association of Motor

    Bus Operators, Washington, D. C, "Bus Facts for 1938." A. Rafes of Gasoline Tax Per Gallon in the Various States as of January I, 1938. Compare this method of presenting gasoline tax information with the method used in 195A. WPA, Division of Social Research, B Dollors CD Less Ihon20 ^20-30 130-40 40 ond more 'Landlord and Tenant on the Cotton Plantation," 1936. Per Capita Amount of Obligation Incurred by Each of the States for Ennergency Relief for Thirty-three Months —January 1933 to Septennber 1935. The appearance of this map indicates that it was made on a "mechanical" intensity shading map, a device developed by the graphics section of the Works Progress Administration. "State pieces" of the desired shading are placed in "state compart- ments" of an aluminum base map of the United States. These state pieces are interchangeable, and there are six sets of shadings from which to choose. The time required to prepare such a density map, photographing included, is about one hour, compared with eight hours if the shading had been done by a draftsman.
  167. CROSSHATCHED AND COLORED MAPS 183 N Y New York Hrrald

    Tribune, September 20, 1938. A. Racial Minorities in Western Czechoslovakia in 1938. SCALE .7 The variety of shadings given in this map is particularly interesting, as well as the arrangement of the legend. jAPAMtse rftmrogv The Seattle Star, March 4, 1938. B. The Division of the Pacific SCALE .6 This chart shows a good device in enclosing within black and shaded lines the minutely visible territorial possessions of the United States and Japan respectively.
  168. 184 GRAPHIC PRESENTATION National Rriourm Board. "Statf Planning, '" 1935.

    SCALE .7 Regional Plan for Washington, D. C, and Its Environs. As a plan for Washington, D. C, and the surrounding country, this map ncccsarily includes a great deal of information. Its value here lies not as a map for study, but rather as an example of what can be done on a map in the way of regional planning.
  169. CROSSMATCHED AND COLORED MAPS 185 U-: O r= H o

    E o •£ 2 > O bfl T3 « •^
  170. 187 Chapter 22 DOT AND PIN MAPS one well known

    use of dot and pin maps is to present geo- graphic distribution data. In this form, the dots or pins represent numerical values and effectively show geographic location. The placing of the dots is an important item. If the exact geographic distribution of the data is known, the placing of the dots is no problem. However, when the data is in the form of general geo- graphic distribution, such as data for an entire state, the dots are distributed throughout the whole state although one section may have contributed the total amount. Each dot represents one plantation I WPA, Diviaion of Social Rrscarch, "Landlord and Tenant on the Cotton Plantation," 1936. Distribution of the Plantations Which Were Enumerated in the Study of the Cotton Plantation Made by the Works Progress Administration. When the number of samples is small, the location of each may be shown on a map as was done here. Compare with 178.
  171. 188 GRAPHIC PRESENTATION WPA. National Rrtearch Project, "ChanRcs in Technology

    and Lalx)r Requirements in Crop Production — Potatoes," 1938. SCALE .8 A. Potatoes Produced for Sale in the United States in 1929. 1. In a dot map it is important to know whether the dot has been placed in its exact geographical position or whether the dots are distributed within a county or state irrespective of the exact location. 2. In this case, there is little doubt but that the dots were placed where the potatoes were produced. WPA. Division of Social Research. 'Rural Youth on Relief." 1037. SCALE 8 B. Rural Rehabilitation Cases Receiving Advances of Capital or Goods in the United States in 1935. 1. Note the square of dots in the state of South Dakota, as well as in other states. This indicates that the distribution of the dots was by counties; that is, statistics for each county were secured and the dots were distributed in each county irrespective of the exact geographical location. 2. Compare with A above.
  172. DOT AND PIN MAPS 189 Eoch dot represents $ 1,000

    or fraction ttiereof I WPA. Divition of Social Rctfarch, "Landlord and Tenant on the Cotton Plantation," 1936. Amount of Emergency Crop and Feed Loans Extended by the Farm Credit Admin- istration, by Counties in the United States in 1932 and 1933. 1. The distribution of the dots in this chart is definitely by counties. 2. The shift from the Dakotas in the one year period is quite pronounced.
  173. 190 GRAPHIC PRESENTATION Sidewalk 17 30 3 -f PRIVj Private

    driveway A. Graphic Distribution of Position at the Time of the Accident of 50 Pedestrians Who Were Hit by Automobiles in Hartford, Connecticut, During the First Six Months of 1927. This chart should be read as follows: in Hartford, Connecticut, during the first six months of 1927, 30 per- sons were hit by automobiles at street intersections, 17 were hit while crossing the street in the middle of the block, and 3 were hit by cars coming out of private driveways. National Automobile Chamber of Commerce, 1927. SCALE .7 Toronto Infliistri.il Commission. "Canada's National Market." 10.T8. SCALE .6 B. Concentration of Buying Power of Canada's National Market Within a Radius of 100 Miles of Toronto. 1. Although no key accompanied this chart, according to another map in the same pam- phlet, the dots represent population. The numerical value of each dot was not given. 2. The important feature about this map is the use of color to emphasize the circle around Toronto.
  174. DOT AND PIN MAPS 191 I U. S. Department of

    Af(riculturr. Bureau of Aftricultural Economics. Number of Slaves In the United States In 1790 and In I860. SCALE 8 1. These two maps are the first and last of a group of six. Space does not allow all six to be shown here. 2. The use of these two maps in a history lesson would clarify and simplify the slave problem of 1860. This material in tabulated or verbal form would be formidable. 3. Only a section of each map is reproduced here.
  175. 192 GRAPHIC PRESENTATION Brll Telephone Laboratories. Inc., New York City.

    A. Exhibit of the Bell System at the New York World's Fair, 1939. Brinton, "Graphic Mclhodi," McGraw-Hill, 1014. B. Residence of the Men of the Class of 1907, Harvard University, Six Years After Graduation. The Bead Wire for Boston Includes All Men Living Within Twen- ty-five miles of the City Hall. 1. Rather than have a pin for each individual stuck in the map around the city in which he Hved, a bead was put on a wire for each person in the same city. 2. Every tenth bead on a wire is white to aid in counting the beads.
  176. DOT AND PIN MAPS 193 Series 1 500 I on

    Senes 600 I ®0 Seri«9| 5400 Series I 5000 The M o • I Kor < ionftrnlril C'.onininn M<c Map* <ir rliiiriK iiwit I* llilK mikI holriliiR KT- It fllH>ti III Ihi oiihcrlrul lif:nl rliory or miii |iln. roril In I'lnrr II niiinul roiiic ii\:\n iim' Ihln |>lM. olT. <ilaiiii Spot l-'nunirl Sp<ii rin I hi' npoi or "KliiK I'lii " JlKil In rniim- liciiil III Itic |ilii rli'fl r li I N mill llir iilii.'M •|K>I |>ln |ilii>- iiiRniiili nil a rItiK. Sorie si Special 5000 Workings Knamrl Spot* mil 1(0 ftir- II I K h r (I hm n I) A H H or iltoss If <|i- iilrrcl. @ 5eries4500 ® 5ene3.,,.^55G Q (iU Series 650 II. c. oil WrII Pin. Shii|>o rr»'nilil<-» oil woll ilrr- rlrk ("iiii Im' Niiiipllril wllh iwiHcolort'd lioiid Map RInft. ('olori-<l rilliilolil rlMK for sllii- pliie ovrr hi-:iil of pin lo Indlciilr aititllloii;il f:ict. ^ PIni and Deads A C2 Series I 6300 An Series | 6100 I Dnn Series | 6400 I 6200 Trlanitular or Square Head |ilns arc iiso<l whorp Ihc IT. rolorK do no! furnish siifflrlcnt varloly. They also help riilor- bllnd users These plus show distlnollve shaiKSs when pholoKraphed whereas sonic colors pholoRraph the same. °ooo BF.An.S are used lo show nrrumiilallun al one iiolni. Nine eusiomern In or.e clly would he Hhown as In Illustrations A or ('. Heads are also used with the |ilns to show two fnels at one iwilnt, as In the cut at the left. The color of the heads shows one type of fact and the color of the pin another. Thus; Heads Hed Machine No. I (ireen Machine No. 2 Yellow Machine No. 3 Pins Red Consumer C'.rccn Retailer Hlue Jobt>er A red pin and n red bead mean that a No 1 machine was sold to a customer, etc. Where several cuctomers are In one town or city hulldlne. alternate lar>;e and small heads are |ille<l on a lont; |iln. Sec Illustration (li). Serlies 34.150 Glass Head Pins Series 3900 Celluloid Tacki Pins and Tacks with Writinit Surface. Rough surface claits head pins and roii(?h surface celluloid lacks are convenient because you can write data on them with pencil or with India Ink. Pencil can be erased with ordinary erasers and Ink washed off with water and a little soap, so that pins can be iLsed acaln and again. Educatiotial Exhibition Co., Providence, Rhode Island. Map Marking Devices. 1. A very effective method of using beads is to string them either on a long pin or on a drill rod of small diameter, and then place them upright on a map. See 192B. In selecting drill rods, the largest size that will go through the hole of the bead should be chosen. Beads for this purpose may be obtained at any variety store. 2. Beads on pins have been used very effectively on a map showing intended civic improve- ments. Red beads indicated assessed valuations on buildings, while green repre- sented assessed valuations on land. Each bead represented a certain number of dollars and each pin represented an individual property. The wide adaptability of this material is evident.
  177. 194 Chapter 23 MAPS WITH CIRCLES AND SECTOR CHARTS THE

    chief advantage of placing circles and sector charts on maps is that the geographic location of the information is given. The general rules for sector charts in Chapter 9 may be followed here also. 1. A white line separating overlapping circles prevents any con- fusion. 2. Actual amounts and percentages for each geographic division should be given. 25,000 50,000 100,000
  178. MAPS WITH CIRCLES AND SECTOR CHARTS 195 Each diac rapi

    American Petroleum Institute, N. Y. C , "Petroleum Facts and Figures," 1937. A. Gasoline Tax Rates in the United States as of Novennber I, 1937. SCALE .7 Compare this as a method of presenting gasoline tax information with the method shown in 182A. IIMiatt. aao aooi pn Nofs tnd pork \C»iil: ctlvt ' b**/. and vaa/ -SAaap. /ani6«, snd wool I U. S. Department of Agriculture. Bureau of Agricultural Economics. SCALE .5 B. The Average Cash Income Received fronn Meat Aninnals. Meat, and Wool Sold by Farmers in the United States in the Period from 1929 to 1933. Two sets of data arc presented on this map. The percentage comparison of the sectors shows the distribution of cash income among the three categories at the lower left. The areas of the circles show the amount of cash income.
  179. MAPS WITH CIRCLES AND SECTOR CHARTS 197 Migration From State

    COLORADO 1*10 Migration To State 1910 KANSAS NEW MEXICO I ILLINOIS 2UI530imi lOHIO 4 INDIANA WPA, Divition of Social Rtiearch, "The People of the Drought State*." March 193 7. Study of Migration To and From Four Drought States, Based on Place of Residence in 1910. 1. The four maps on the left show the states to which native white migrants have gone, and the four maps on the right show the states from which residents of the four states in 1910 have come. 2. Although a general idea of the amount of migration to and from these four states is obtained by glancing at the maps, to secure the actual amount would be quite a task. I
  180. 198 GRAPHIC PRESENTATION /• -\.'r^: #::;-^i.>^'--> •^...--^ '1 .* ;

    . ::^ , ncreate of to 30y, ?^ y Increase of 30% or More rr\ POPULATION SCALE National Rciourcri Committcp. "Our Citift." June 103 7. SCALE .7 Urban Places in the United States Which Have Had an Increase of to 30% and of 30% or More in Population from 1920-1930. A section only of the original map is shown to illustrate the method of putting a white border around black circles which necessarily fall on top of each other.
  181. 200 Chapter 24 MAPS WITH BAR CHARTS Bars superimposed on

    a map allow a great many comparisons not possible with one cross hatched map. Time-series bars may be placed on a map. A comparison of several items rather than the presentation of just one item may be obtained. The practices commended in the chapters on bar charts, pages 92-152, should be adhered to when bars are placed on a map. "The Federal Chart Book," Prepared by the Central Statistical Board and National Resources Committee, January 1938. SCALE .7 Geographical Shift in Cof+on Manufacturing in the United States from 1923 to 1937. 1. Bar charts may be used as effectively as sector charts in presenting information for geographical divisions. 2. Note the method of outlining in black the section of the United States to which specific groups of bars refer. 3. See 93 A 4.
  182. MAPS WITH BAR CHARTS 201 "The Frdrral Chart Book," Prepared

    by the Central Statistical Board and National Resources Committee. January 1938. SCALE .7 A. Population and Area of the United States by Regions in 1900, 1930, and 1935. 1. When the United States is divided in this way, the horizontal hars seem to fit into the spaces very well. 2. See 93 A 4. U. S. Department of Agriculture, Bureau of Agricultural Economics B SCALE .5 I Percentage of All Farmers Buying Cooperatively in the Various States in 1919, 1924. and 1929. 1. All the various types of charts shown in the bar chart section are applicable to maps. 2. When it it impossible to put the bars on top of the state, such as is the case with Rhode Island and New Jersey, arrows connecting the bars with the state aid in reading the chart. Compare with 202A.
  183. 202 GRAPHIC PRESENTATION U. S. Department of Agriculture, Bureau of

    Agricultural Economics. SCALE .4 A. Average Sales Per Farm Through Cooperative Associations for Each of the United States in 1919. 1924, and 1929. 1. While this same material could be presented in a series of groupings with a common horizontal base, superimposing the bars upon a map not only condenses the material but also gives the geographical distribution. 2. Note the use of arrows to connect tht bars with the states. Compare with 2 IB. R«ilro>d5 I Rapid Transit Trollei^kWhicIn NuMeta or PensoMs n )\ ikri:- i-fl-i* Regional Plan Attociation. Inc., N. Y. C. "Information Bulletin No. 11," Jan. 30. 1933. SCALE .6 B. The Number of Persons Crossing 59th Street South Bound in New York City, by Railroads, Rapid Transit, Trolleys, and Vehicles for a Typical Business Day in 1932—(24-hour Period). A traffic study of a particular street is perhaps best presented in this way rather than as a flow map with the width of the lines proportional to the traffic.
  184. MAPS WITH BAR CHARTS 203 LEGEM D 1924 Persons ^m

    1932 Persons TOTALS 1934 -2.217,353 1932 - 2.709430 nP 556 556 16.1% 1.137.755-513% 1,384.555-51.1% Regional Plan Aatociation, Inc.. N. Y. C, "Information Bulletin No. 11," Jan. 30, 1933. Number of Persons Entering the Borough of Manhattan, New York City, During 24 Hours on a Typical Business Day in 1932 and in \91A. 1. The inclusion of numerical values and percentages in this map is particularly good. 2. Compare with 22 7. I
  185. 204 GRAPHIC PRESENTATION EXPLANATION OF MILITARY HISTORY SFRIES Bntrsh and

    Brftnh-Coionul forcn m Cokmal W*n, UnKed SUtn lorcn x\ RmoMnnary, 1812. ind Mexiun Htn. Teuns m Tojn Cimpaicns. 3nd Federals m On4 War Frmdi and S(Mnali torctt « Cotonal Man; Bntnii m RawlMtenan and 1112 Wrni. Miucam n MaxcM Vnr and 1mm tei- pH^; Coniadirato m Civd Wv. X
  186. MAPS WITH BAR CHARTS 205 r^J N' ifl64 1865 •M«<Mrl<aal

    y*' JLJ). I Charlr« O. Paullin. "Atla* of the Hittorical Geography of the United States," CarncKie Institute of Wash- ington and American Geographical Society of New York, 1932. SCALE .5 Two Historical Maps Showing the Progress of the Civil War from 1863 Through 1865 and a Resume of the Entire War. The bars and war lines in the originals of these two maps were in red and blue.
  187. MAPS WITH BAR CHARTS 207 Map of Great Britain's Merchant

    Marine at the New York World's Fair, 1939. 1. The models of the ships represent Great Britain's merchant marine. 2. The map and models are not built to the same scale. In the Arctic Exploration Building of the U.S.S.R. at the New York World's Fair, 1939, there is an exhibit in which the whole Arctic region at the center of a hemispherical dome is painted with luminous paint. As ultra-violet lights go on and off in short cycles, the paint shows up routes of recent exploration. I mir .gfaJMIiift&i^*
  188. 208 Chapter 25 MAPS WITH CURVE CHARTS THE three statistical

    maps in this chapter, all of which deal with precipitation, demonstrate the value of showing the location of data for geographic regions. While other maps may show that there was rainfall, these maps show the actual amount of precipa- tation. See "Flow Maps," pages 216-230. Although curve charts have not been discussed up to this point, maps with curve charts are included here in order to keep the map section intact. > -4 3 ^J. ^•Ht^^K^v"^!.: LEGEND Monthly Runoff for Maximum Year Average Monthly Runoff for Period of Record Monthly Runoff for Minimum Year Outline of Drainage Area tributary to station for which hydrograph is shown. Ordinates show mean annual discharge for maximum year, period of record, and mini- mum year, respectively, in cubic feet per second per square mile. National Rfsoiirrcs Board, "Rci>ort of thr Watfr PlanninR Committee, Part III," 1034. Characteristics of Runoff from Typical Drainage Areas in the United States. Only a section of the original map is shown.
  189. MAPS WITH CURVE CHARTS 209 0- 0) o O u

    « 0. .ii . Q. ^ § a O to s w 1- 2 5! K < _ a» S .E 2 > I I
  190. Chapter 26 '''* ^"'"^ '*'°'''''' "'' I93Q. MAPS WITH SYMBOLS

    QUANTITATIVE material may be presented in the form of symbols by increasing the number of symbols as in "Pic- torial Unit Bar Charts" on pages 121-131. A variation in the type of symbol may also indicate a quantitative difference. WPA, Divbioa of Social Rrtcarch. "The Micratory-Catual Worker," 1Q37. SCALE .8 State of Principal Employment for 100 Migratory-Casual Workers in 1933 and 1934 in the United States. 1. From this map, it can be seen that certain states ofTer relatively more casual employ- ment to the migratory worker than others. 2. Note the relationship between this map and 230. I
  191. 212 GRAPHIC PRESENTATION £ •a/'; ...lill" 1 fn'^ «li* '1)1,1'

    AMJUOUCROUC . N Ht • CM4»L0TTt KC , "Ml M iiiiiiiiii, "Mil "llli , \, J ''"•Ill ^^ , ll '^Ill>""'>llllllll,, I "0 WPA. E>ivision of Social Research. "Urban Workers on Relief," 1936. SCALE .7 A. Principal Occupations in Selected Cities of the United States in 1936. No quantitative data is presented in this map. It is merely a device to show the principal occupations in certain cities of the United States. .'X^-^'"' Tropic of C|c; ^^^^ Hawaiian Islands '*-,. r-al Standard t,- I Equator \ ^ «> o ^v \ Endcrbury and Canton Islands E in CO •<* E „ injsij — — Q.^o ^ ^^ "^r, ^s ^ AM Beginning of total V- ^ • /2)^ ^./,,7^ / (^ (Q) (^ ^^ ^ End ofsjotal Eclipse at Sunrise I- .. ' • '^ -iu- Eclipse at Sunset - -^ \^. - I . Tropic of £^P£^'£2r- L- AUSTR>LIA r New Zea I •SO ^--jfrnir of P^/T.r-^^ ^<^/> SOU/TH AMERICA <^J«^N SCALE .6 The National Geographic Society. Washington. D. C. 1937. B. Map of the Eclipse of the Sun June 9th and 8th. 1937. By the use of symbols, a time-analysis of the eclipse of the sun is made. The "date line" showing the change from Wednesday to Tuesday is particularly interesting.
  192. MAPS WITH SYMBOLS National Rrtourcr* Board, "State Planning." 193S. SCALE

    .7 Metallic Ores and Rare Minerals in Maine, August 1934. The purpose of this symbol map is to show the geographic location of metallic ores and rare minerals in Maine. No quantitative data is presented.
  193. 214 SSAPHfe^PSEgffiWATiw^ SCALE .8 National Rrtourcrt Board, "Statr Planning," 1935.

    Industrial Distribution in the State of New Hampshire in 1932. By increasing the size of the symbol, a quantitative as well as a location analysis is made.
  194. 215 Aekansas/T^nnessm. \\\ \ \ ' AUADAAM< ' SCALE .6

    American Iron and Stcrl Inititute, N. Y. C, 1937. A. Steel Ingot and Finished Steel Capacity of the United States in 1937. This combination of circles and squares gives a concise statement of two sets of data: steel ingot capacity and finished steel capacity in the United States. A section only of the original map is shown. Alcmandcr Hamilton Institutr, Bureau of Butinesi Conditiont, "Butineti Conditions Weekly," July 33. 1938. SCALE .5 B. Map of Credit and Sales Conditions in the United States in July 1938. Since interest is chiefly in the "active-and-up" cities, the choice of a solid black symbol to represent them was a logical one. I
  195. 216 Chapter 27 FLOW MAPS Jflow maps may be used

    to show both qualitative and quantita- tive flow of goods, persons, automobiles, etc. When a flow map is used to indicate the number of persons or automobiles on streets and highways, it is generally called a traffic map. See Cosmographs in "Flow Charts" on pages 73-80. cy^ r' i^*^^^
  196. FLOW MAPS 217 National Rftourcct Board. "Rfport of the Water

    Planning Committee, Part III," 1934. SCALE .8 A. Prevailing Winds in January and in July in the United States. 1. Arrows to show the course of the wind on a weather map are often seen in daily weather repKJrts. 2. These two maps shows the prevailing winds for two months in the year. vmoiNiA National Re«ourcet Board, "State Planning," 193S. B. Origin and Ports of Destination of Cargo Shipments of Bituminous Coal from the Great Lakes in the United States in 1932. The tonnage of the various shipments of coal is given at the end of each line. I
  197. 218 GRAPHIC PRESENTATION American Telephone and Tflfgraph Company, N. Y.

    C. SCALE .6 Map Showing Where the Hurricane of I9?8 Hit Hardest in the United States. This map of the path of the 1938 hurricane appeared in an advertisement of the Bell Telephone. Compare with 216B.
  198. 220 GRAPHIC PRESENTATION National Rrsourcrs Board. "State Planning," 193S. SCALE

    .5 A. Migration Into and fronn North Dakota for the Period from 1920 to 1930. 1. In the original of this map, the migration from North Dakota was indicated in red ink. 2. The two groups of figures in each state give the inflow and outflow. The top figure represents the outflow to North Dakota, the bottom figure the inflow from North Dakota. 3. While there is no scale to give the exact proportion of the width of the lines to the number of people, the width of the lines gives some indication ot this. Amrrican Petroleum Institute. N. Y. C, •Petroleum Factt and Figurei," 193 7. SCALE .8 B. Directional Flow Map of Crude Oil and Gasoline Pipe Lines in the United States in 1936. There is no quantity representation in this map. It is purely a directional flow.
  199. 222 GRAPHIC PRESENTATION National Re«ourc«i Board, "State Planning," 1935. SCALE

    7 Average Daily Traffic on Michigan Trunk Line Highways Based on the Years 1930 and 1931. 1. The legend for this traffic map might have been better if a scale for the widths of line had been given. 2. The inclusion of the names of the cities is an advantage.
  200. FLOW MAPS 223 Jamct R. Bibbint and Bion J. Arnold,

    "Our National Transportation System," Proceedings of New York Railroad Club, April 1923. Flow Diagram Showing the Rush Hour Passenger Traffic Outbound fromi One-Mile Zone on the Surface Lines in Chicago. Because this was reproduced from a photostat, much of the detail is lost. The important feature, the use of circles to show the mile zones, is effectively shown even in this reduced scale.
  201. 224 GRAPHIC PRESENTATION J. R. Bibbint, and Bion J. Arnold,

    "Our National Transportation System," Proceedings of New Yoric Railroad Club. April 1923. SCALE .6 B. Suburban Passenger Rush Hour Car Movement to and from Chicago Terminals from 5 to 6 p.m. Comparison of the routes taken by two groups of passengers is made in these two traffic maps. A. Main Line Passenger Rush Hour Car Movement to and from Chicago Terminals from 7 to 8 a.m. Each line represents 10 nrullion dollars' worth of petroleum products American Petroleum Institute, N. Y. C, "Petroleum Facts and Figures," 1937. C. Petroleum in United States Export Trade in 1936. 1. The representation of volume in this map is correct in that the general idea that Europe receives most of the petroleum products of the United States is obtained. 2. As a method of graphic presentation it is incorrect in that two lines, or 20 million dollars, is visually about three times as wide as one line, or 10 million dollars. The error is greater when there are just a few lines.
  202. FLOW MAPS 225 0> o c o Q. O <

    2 o o > P o a o o Of CL H H <-!«/) « (M
  203. FLOW MAPS 227 North Jersey Transit Commisiion, "Summary of 1926

    Report, Rapid Transit for Northern New Jersey," January IS. 1926. Diagram Showing Routing and Density of New Jersey Passenger Traffic to and in New York City in 1924. 1. A great many people commute to New York City from New Jersey. Few persons realize the number. Although this is a 1924 analysis, a later study has not superseded it. 2. Note again 203. I
  204. FLOW MAPS 229 IS UMITOrttMC uMTT ormc LEGEND — tS

    MMUn MWt WITT.-«UT5lOt LHWT OT ] ^ SOiMUTtzoMC-ftHAjQ-ovniOC LMwr or] o«an t»— W T anc mu. Odnnca rwM sr*n mouoc. Prom "A Report on the Street Traffic Control Problem of the City of Boston" Prepared under the Direc- tion of the Mayor'* Street Traffic Advisory Board by Albert Russel Erskine Bureau of Harvard Uaiveisity, 1928. Time Zones on Seventeen Highway Routes to and from Corner Parle and Trennont Streets in Boston During the Morning and Evening Rush Hours from June to September 1927. While most of the traffic maps give the amount of traffic, this map gives the length of time it takes to get into Boston from outlying districts.
  205. 231 Chapter 28 CONTOUR MAPS _ ontour maps may be

    used to show lines of erosion, precipita- tion, climatic conditions, as well as the topography of the land. Gradations of shading and cross hatching may be used on contour maps to differentiate. For suggestions relative to the arrangement of shadings, see "Suggestions for Making a Chart," pages 367-380. GENERAL REFERENCES Raisz, Erwin, General Cartography, McGraw-Hill Book Co., Inc., New York City, 1938 Robert Waril. Cliiiiatts of tht Umtrcl States. " Ginn & Co., Boston and Nrw York, I'liS. Average Annual Number of Rainy Days in the United States. 1. While the contour map is best known for its use in uivinn the topography of land, it may also be used to show preci(>itation. temperatures, and erosion. 2. Since no key for the shadinus was nivin with this map. it is rather ditlicult to read accurately.
  206. 232 GRAPHIC PRESENTATION Robert Ward. "Climates of the United States,"

    Ginn St Co.. Boston and New York, 1925. A. Average Annual Minimum Temperatures in the United States. 1. Because "contour" means "outline," lines may be used to outline the major temperature sections of the United States. 2. Comparison with a topographic map would reveal no doubt, a relation between the elevation of the land and the temperature. if/mcM/ JEK ieh: The New York Timei, March 19, 1939. SCALE .6 B. Weather Map of the United States at 7:30 p.m. E.S.T. March 18. 1939. 1. The reports on this map arc for exactly the same time; that is, although it was 7:30 p.m. Eastern standard time, it was several hours earlier by the clock on the Pacific Coast. 2. Compare this method of indicating rain with the method shown in 234A.
  207. CONTOUR MAPS 233 National Resources Board. "State PlannioK." 1035. A.

    Topographic Map of Colorado, Showing Contour Lines af Intervals of 2000 Feet. The combination of a topographic map and a profile section makes this a valuable map. MacElwee 8i Crandall. Inc.. N Y C. SCALE .4 B. Connparative Dates on Which the Chance of Killing Frost Falls to Ten Per Cent in the Spring in the United States. I
  208. 234 GRAPHIC PRESENTATION ARROWS INOlCtrE WIND DIRECTION OIC*TE PREClPITATlPH —2

    :us£^ National Resources Board, "Rejxjrt of Water Planning Committee Part III," 1934. A. Weather Map for the United States at 8:00 a.m., February 2. 1934. 1. Weather reports rather than weather maps are most often consulted in daily newspapers. However, for an over-all view of the United States, this type of weather map is good. 2. Note particularly the use of shaded areas to indicate rain. Erosion unimpo'toni, •icept locolly aModerate sheei and gully erosion, serious locoliy k/)Si qii wind erosion, tlUmode'Oie sheel ond gully erosion Moderate to severe wind erosion, some gullying locally Moderate lo severe erosion includes mesas, mountains, canyons ond bodlonds ^M Severe sheet and gully erosion WPA, Division of Social Research. "Landlord and Tenant on the Cotton Plantation," 1936. B. General Distribution of Erosion in the United States in 1936. This map reveals that the South suffered as much from soil erosion as the mid-West.
  209. CONTOUR MAPS 235 Original forest regions V ^ t>RE5ENT rORC3T

    ARl 10^^ 100 iOO S00MIH3 merci timber Warren H. ManninR. "A National Plan Study Brief." Special Supplement to Landscape Architecture, July \m3, American Association of Landscape Architects. Cambridge. Mass. Original and Present Forest Areas In the United States. Before and after comparisons arc always interesting. These two maps tell the story of the vanishing forest.
  210. 236 GRAPHIC PRESENTATION National Reiourcps Board, "State Planning." 1Q35. SCALE

    .7 Average Annual Precipitation in the State of Utah. Since a key to the shadings is given in this map, it is much easier to read than 231.
  211. CONTOUR MAPS 1870 1910 237 1890 1930 LEGEND INHABITANTS PER

    SOUARC MILE I I FEWER THAN 2 ^^ 2-5 JH 6 - 17 Q IS - 44 ((45-89 90 AND MORE WPA, Division of Social Rrsrarrh, "The People of the DrouEht States." March 1037. Density of Population in the Drought Area in the United States for the Years 1870, 1890. 1910, and 1930. While the lines for 1870 and 1890 seem to follow natural contours, the lines for 1910 and 1930 are definitely county lines.
  212. 238 Chapter 29 DISTORTED MAPS IN A distorted map, geographic

    location of data is maintained by- making the area of states, countries, etc., proportional to the quantitative data. Distorted maps are sorhetimes called proportional maps. GENERAL REFERENCES Raisz, Erwin, General Cartography, McGraw-Hill Book Co., Inc., New York City, 1938 Litpr.iry Diurst. A|)ril 23, 1021. Relative Size of Each of the United States If Based on Electrical Energy Sold for Light and Power in 1921, The theory beliind the construction of a distorted map is to represent the area of each state as proportional in size to some value other than land area. Thus the geo- Kraphical position of tlie state is maintained, and the new area values can be com- pared.
  213. DISTORTED MAPS 2A^) SWEDEN NORWAY Electrical Worki. January 6, 1Q23.

    SCALE .7 A. Comparative Size of Leading Nations If Area Is Based on Total Amount of Electrical Energy Consumed. The form of this comparison map eliminates the greatest fault of the distorted map: that is, changing the shape of the country, or state. The Dartnell Corp.. ChicaKO. Ill . 1031. SCALE .4 B. The United States With the Area of the States Proportional to the Urban Population of 1930. This map represents a popular form of distorted map. I
  214. 240 GRAPHIC PRESENTATION Power Plant Engineering, New York City, 1933.

    A. Horsepower Map of the United States in 1933 With the Area of Each State Drawn Proportional to the Amount of Horsepower Installed in the State. Horsepower is one of many things which a distorted map may present. 'Mour\t«in Wost North Ewt North 4* $621/ Central C«nti»l 7.2^^ »3.Z78 31 7-».^ $14.383 Weat South East South Central Central 4 2'. $1914 3 3*. $1,496 Buiine»» Week, June 12, 1937, New York City. SCALE .6 B. The United States With the Areas of the States Proportional to Their Manufac- turing Output in 1935. 1. Rather than attempt to maintain a semblance of the map of the United States, this map presents all the states in rectangular form. In so doing, it seems to lose some of its attractiveness as a distorted map. 2. The inclusion of the percentages for each state and for each section as demonstrated should be encouraged.
  215. DISTORTED MAPS 241 niAL 0» L(y>N) AND ONANT^ iM ThC

    UNiTIO MIkTtS. (94. 926. 7*3 9yX)X TO H StATeS A* SMOWN OtlOW H*^ tMAN IT. TO fACM O^OTMCa ^TATCS t' B^K-. Z 2 ot) r * < o OKCG <2 ^ T E X A s MINN. IOWA MISSOURI I Ml 1411,460 «1K MICHIGAN ll.730.4S6 ILL- l.T»» NEW YORK • r? J2.e04 OHIO 3.B4t 12.676.247 NEBRASKA 33.77y. 131,919.572 KAN. I 0'<'-*> \7.7ir. (1^303.300 KglklTUeWv^ TCNNCSSK 7.45V. 7,044.112 MISS. ALABAWA 2.6?*/. 2.481 .7 2 b ,MJ 6A , _ VIRGINIA I 7»% «l.»kO.034 NORTH CAROLINA * 3.743.300 SOUTH CAROUNA 9. 36'/. 8.852.000 R FLORIDA U0% il.i>«.<l5 Public Utilities Fortnightly, February 3, 1938, Washington, D. C. How Each State Shared in PWA Allotments for Non-Federal Power Projects as of July I, 1937. Only a slight attempt was made to maintain the geographical location of each of the states. When a chapter name or number is given as a reference, turn to the Topical Index, either on Page 1 or Page 247, and spin pages to the desired chapter.
  216. GRAPHIC PRESENTATION o 2 o o o •^ c u

    i o f -o 2 Q. O c t: *> o > a o o 1^ a -D 0) 3 a> o Q. I 2 c: I <
  217. 243 Chapter 30 RATING CHARTS IN RATING charts, the "rank"

    of items is presented in graphic form. The arrangement of the material is determined by the quantitative value of each item. ^ SAFETY SCORE BOARD ik 1 . Tobacco 2, Comen-f 5. Laundry nl Anirriran Iron & Steel Institute. New York City. 'Safety in Steel." Deiember 10.18. The Safety-Record Rating of the Steel Industry In the United States Fronn 1934 to 1937. The ratinK chart is a relatively sin-.ple kind of Rraphic chart and may take a variety of forms. This chart merely i;ives the position of "Steel" on a safety score board in 1-2-3 order. I
  218. 244 GRAPHIC PRESENTATION S H 3 i« Ti r n

    E( il T? iS From "CoUtctcd Studies of the Dionne Quintuplets" by W. E. Blatr et al., St., George's School for Child Study, University of Toronto, 1937. Reproduced by Permission of the Authors. A. A Comparison of the Records of Each of the Dionne Quintuplets in Mental Development From 12 to 35 Months of Age. 1. Converted into this form, the progress of each of the quintuplets in comparison with the others is easily followed. 2. Compare this form with 243 and 245. ^0A
  219. RATING CHARTS 245 wro MoDtuia. Idaho . . DakoU. .

    Arixuna.. Wyoming Rank • NrwYork t Prno. 3 IlliniiU 4 Ohio 5 Miiiouri • Trial T Ma.t. A Iniliaoa 9 Mi< hiftaa 10 I«wa 11 ('•rorfoa It Krnturky 13 Witniniin 14 Trnnr^MT 15 N r»r<.lina 16 Nrw Jrrwy 17 Virginia A Alabama !• Minnr«ota >0 Miviisiippi ai fBlifornia 21 KariMi 23 lyouMaoa 24 S. f arolin* 2B ArkaDsai 26 Mnrylaod 27 NVbraika 20 W Virginia Z9 rnonrcticut 30 Maine 31 (olurado 32 Floriila 33 WHslimKton 34 Rhoh I^l'od 3B(>rrK'>n 3«N Hanipsb'e 37 S Dakuta 38 Oklahoma 3* Indian Ter. 40 Vermont 41 N. DakoU 42 Dut. di C. 43 I'Ub 44 Montans 4»N Mexico 4« Delaware 47 Idaho 40 Hawaii 40 Arizona eVN'yuming Bl Alaaka W. C. Brinton. "Graphic Methodi." McGraw-Hill. 1914. SCALE 9 Rank of States and Territories in Population at Different Census Years From the Civil War to the Beginning of the Twentieth Century. The column at the left gives the key number for each state, while the column at the right gives the rank of the state in 1900. I
  220. TOPICAL INDEX (2nd Half) ^47 Place ri^ht thtiiiib on tri<m^lc,

    /infers irisidc back cover. Spin pu^es to desired chapter. 248-255 .U. Chronoiogy Charts ^ 256-262 32. Progress Charts < 263-274 33. Curve Charts ^ 275-285 34. Comparisons witli Two Curves 286-293 35. Comparisons with Curves 294-300 36. Component Parts Shown by Curves 301-309 il . Index Numbers Shown by Curves — 310-319 38. Frequency Charts -^ 320-330 3^). Correlation Charts 331-338 40. Ogive and Lorenz Charts 339-353 41. Ratio Charts 354-359 42. Three-Dimensional Methods 360-366 43. Composite Charts 367-380 44. Suggestions for Making a Chart — 381-396 45. Standards for Time Series Charts 397-404 46. The Camera and Its Use 405-409 47. Lantern Slides 410-422 48. Preparation of Illustrations 423-428 49. Color and Its Use 429-434 50. Methods of Reproducing 435-442 51. Methods of Printing 443-448 52. Selection of Paper 449-453 53. Binding Techniques 454-463 54. Graphic Charts in Advertising 464-474 55. Quantitative Cartoons 475-485 56. Quantitative Posters 486-493 57. Displays and Exhibits 494-496 58. Dioramas 497-500 59. Graphic Charts in Conference Rooms 501-505 60. Glossary 506-511 Index (For 1st Half of TOPICAL INDEX, See Puge 1)
  221. 248 Chapter 31 CHRONOLOGY CHARTS X he practice of showing

    time as a straight line is utilized in mak- ing chronology charts. Often the line is widened to make it pos- sible to shade sections. Both quantitative and qualitative data may be presented. O VACATIOnS POH TRI YTAR So 1th Coop«r Brown Harris iThlte Jonee Dale Johaaon rratt Black Rogers Doe Carson Honry C'Bara Jackson SulllTsr Orey 14 21 20 Ipril 5 12 19 26 May 9 16 23 JXMC 14 21 July 11 la Aug. £6 1 16 22 29 Sept. Brinton, "Graphic Methods." McGraw-Hill, 1914. Chart for Assigning Vacation Periods in a Large Office. SCALE .9 With such a chart, one can see at a glance just how many persons from an office will be gone at the same time. This form is valuable in planning vacations so that two persons doing the same type of work will not be on vacation.
  222. 250 GRAPHIC PRESENTATION F. P Fi>itir. "Drrn'iiifili/ini' Lniii-shorr L.iluir ;iiiil

    the Sciittlt- Exp<-rirnr<-." W;ilrrfront Eiliploycrs of Sriiltlr. Wiish.. Fctiruiiry 1. I'l.M. SCALE .7 Exact Hours and Days Worked in 1929 by the Highest-Earnings Holdnnan in Oregon Ports. Till- fxtrenu- irrcj^iilarity of the work of lonj;shorf labor is shown in this study. The black scctiorjs show the number of hours worked per day accordln^; to the scale at the left, and the scale at the bottom shows the days.
  223. CHRONOLOGY CHARTS 251 I F. P Foisir. "DrrHsiiali/inK L<inK%h(>rc- Liilxir

    hikI thr Sriitllr ExptiKiu' Sriittlr. W;i»h . Ftl.riiary 1. I'I.I4 Walrrfrciiil Employers iif SCALE 7 The Working Year of Pacific Lighterage Corporation Deep Sea Gangs by Days for 1932, Showing Analysis of Broken Working Tinne and Leisure Time. Prfsi-nti-d aloHK a horizontal line instead of in a circle, this stiuly would have taki-n a Urcat deal more space. In this form it is concise and adequate for the purpose.
  224. CHRONOLOGY CHARTS 253 4000BC AO i i i 1 i

    i i I i i » r I < i i i i g I mn manumi « •Ma fo •ouit iw itmm mtota » nc orriMin onauvM I AD-OME '::r iwdo v i CD* V nc Mimic noinaior M o«tii«(>i Frank J. Roo«, "An Illustrated Handbook of Art History," Macmillan Co., New York City, 1Q37. SCALE 6 Chronological Development of Art Periods From 4000 B.C. to 1937. The shading of the bars indicates gradations in the development of art, and thus gives meaning to art periods named beneath the bars.
  225. 256 Chapter 32 PROGRESS CHARTS l3 ynonyms for progress charts

    as used in this chapter are schedule charts, Gantt charts, procedure charts, process charts, production control charts. REFERENCES Clark, Wallace, The Gantt Chart. A Working Tool of Manage- ment, The Ronald Press Co., New York City, 1922. Gantt, H. L., "Organizing for Work," Industrial Management, Vol. LVIII, August 1919 (Now Factory Management and Maintenance). Induitrial Management, December 1918. A Material Control Board SCALE .9 The dotted lines represent orders received. The straight lines represent materials received. The dotted lines beneath the straight lines represent orders on the factory depart- ments. The full lines represent completion of that number of pieces.
  226. PROGRESS CHARTS 257 PRODUCTION PROGRESS CHART UNIT VALUE tA\% ORDER

    NO. XOOI ENTERED DEC. IB 19- SHIPMENT DESIRED MAY IV 19- APPARATUS 3000 K-V^- TURBO OCNCRATOR ITEM Aritfiur* Fl*n^€ Afiwtur» 5fidcr Cotia J>nu»ry | ftbru^ry | Mfcrcl tPR. — April '^^i — i — \t „ 19 IS to rr I Factory. December 1919. A Production Progress Chart. SCALE .9 1. The solid black lines represent the schedule, while the dotted lines represent the progress made to date. 2. Note the percentage schedule per week and total at the bottom of the chart. This indi- cates that the job has progressed faster than schedule.
  227. 258 GRAPHIC PRESENTATION ^^ Organication to arriral In Franoe rrlTal

    In France to entering line Entering line to aetire battle service Service aa aotive oonbat AlTislon Leonard P. Ayrc». "Thr War With Germany." Government PrintinR Office, 19)9. A Time Study of the Various Divisions of the United States Arnny During the World War. It would be interesting to liave an analysis of the reasons why certain divisions, although they arrived in France before others, did not enter the line until long after and sometimes did not enter the line at all.
  228. PROGRESS CHARTS 259 A. Progress Chart for a Catalog Production

    Job. 1. While each company may have its own, some form of proRrcss chart aids in determining where certain jobs are, how far they have pro- gressed, and how much more has to be done before the job is com- pleted. 2. The use of colors makes a progress schedule valuable for display.
  229. 262 GRAPHIC PRESENTATION Widlh of ii»ilv «|i.i<i' rrpri'iiriits niiiouiit of

    %tork th.'it slioiiM linve boon iloni' in a d«/. Amount of work nrtually done in n d»y. Tiino t.'ikrn on nork on nliirli no eatim.ile is av:iil:iblc. Wcoklv total of operator. Roliil line for o»ti niatitl work; broken line for time apent ou work not eslimuted. Weekly total for group of operators. Wi-ekly total for department. The portion of the daily upaee tliroucb wliieli no line drawn Rhown hoiv niucli the man has faUeti behind what \ cipwtcd of him. Rc.vsoNS roR K.M.LiNo Behind Abneiit ti —(".reen operator I —Lurk of inntruetions L—Slow o|>i*rator M—Material trouble* When tliere is more than R—Rep.'iirs neisled T—Tool troubles V—Holiday Y—Smaller lot than estimate u basi'd on. reason for failure to do the work in estimated time, the reason enteriil on ehart is deter- minetl by nskiuK questions in the follow inj; order; R—Was the maehine in f^ood eonditionf T—Were the tools and fixtures in gooil eondition' 1 —Was the op<-rator i;i\eii proper instructions .-ind snfHeient information? M—Was trouble experienced with material.' G—Was the operator too (jrivn to do the job? L—Was the opi'rator loo slow ? V — W;is the lot smaller than estimate is basiwl on? Wallacf Clark. "The Gantt Chart —II." Management Engineering. September 1921. A Gantt Man Record Chart SCALE .7 This chart is one type of those identified as Gantt Charts, developed by the organization of the late Henry L. Gantt. REFERENCES Knoeppel, Charles E., Graphic Production Control, McGraw- Hill Book Co., Inc., New York City, 1920. Smith, W. H., Graphic Statistics in Management, McGraw-Hill Book Co., Inc., New York City, 1924.
  230. 263 Chapter 33 CURVE CHARTS I Xhe curve charts in

    this chapter are only those having one curve on a grid. This includes those having visual captions. The chap- ters up through page 366 cover other types of curve charts. REFERENCES Karsten, Karl G., Charts and Graphs, Prentice-Hall, Inc., New York City, 1923. Riggleman, John R., and Ira N. Frisbee, Business Statistics, 2nd edition, 1938, McGraw-Hill Book Co., Inc., New York City.
  231. CURVE CHARTS 265 B«i*d Upon Av*««4« U S. ftic»% •«

    R»porfsd by tht U. S. Butmu of Ubor Statitttct I Chicneo Trihunr. The l')J8 Chnrt Book. " Fclnunry 22. 1Q38. A. The Cost of +he "Market Basket" in the United States Calculated From Gov- ernment Prices From 1929 Through 1937. It is not possible to compare the curve in this chart with the chart B below since the content of the "market basket" as listed is not the same. 7jOO B«f*d Upon Avvraq* U. S. Pricat »t R*pert*d by th* U. S. Bureau of Labor Statittici OOOAXS 7JM JFMAMJ JASOND JFMAMJ J A SON J F MAM J J AS ON J FMAM J J A SON D JFMAM J J A SON 1914 1915 1916 1917 1918 L«tt«r« Abova Ara kwKal* of MeirHu: J for January, F for Fabmary, Etc Chicago Tribune. "The 1938 Chart Book." February 22, 1938. SCALE 8 B. The Cost of the "Market Basket" in the United States During the World War. 1. When the zero line is omitted, this is one method of indicating its absence. It might have been better if the line had been more wavy so that in reduction the irregu- larity would not be lost. 2. The visual caption used in this chart is very effective. By cutting an appropriate pic- ture from a magazine or newspaper apd using it in this way, a chart is easily "dressed up."
  232. CURVE CHARTS 269 Excess Reserves of New York City Central

    Reserve Banks Fronn 1934 to September 1937. This chart presents weekly averages of daily figures. I Federal Reserve Bnnk of New York. "Monthly Review," October 1, 1937. SCALE .6 -Improved carbon filament lamp costing $1.60 Squirted ] tungsten { straight — Drawn tungsten vwire — filament straight filament vacuum vacuum Ho\u research on lamps has reduced the cost of electric lighting .This chart is based on the lumens of light produced by nevu eOviJatt bulbs per \uatt of electricity consumed. Da fa furnished by Wtstinghouit Elecfric Mfg Co Draiwi tungsten Drawn tungsten —— wire re \wire coiled fila- ment gas filled Average cost of lamp 75(t Due to greater manufacturing precision Due to research Ol I I I ' ' ^ ' I I I I I I I I ' J I I I'll — — — — — oldr^ccJ CM •* vD ao »0 ro Kl to 0> <J> O o> Product Engineering. October 1938. Part of an Editorial on Public Relations Entitled "Research in America —the Key to Belter Living " B. The Effect of Research on the Price and Quality of Light From 1904 to 1938. Supplementing the information given here with further details, it is estimated that if the iillumin«tion of 1937 had been attempted with the lamps of 1900, it would have cost two billion dollars more for electricity alone at present power rates.
  233. CURVE CHARTS 271 A. Cost of Rubber Per Pound in

    New York From 1838 to 1937. When data over a long period of time is plotted in curve form, it is usually necessary to allow a great deal of space horizontally, or to condense the years so that a trend only is indicated. This method of break- ing a series of years into four parts solves both these difficulties. H I MM
  234. 2^2 GRAPHIC PRESENTATION Abstracts from Time Series Charts. A Manual

    of Design and Construction, 1938, prepared by Committee on Standards for Graphic Presentation, under procedure of American Standards Association, with The American Society of Mechanical Engineers as sponsor body. FUNDAMENTAL CONVENTIONS OF FORM 1. A TimoS«ne$ Chort is one of severol types of bi-numericol scole cherts. A binumericol scole chort is based on the conception of two- dimensionol movement in o single plane. 2. The field or coordinate surfoce on which the voloes ore located is formed by intersecting verticol ond horizontal rulings located ot measured intervols from the two principal axes. 3. It is the convention that positive values are measured upword from the horizontal oxis and to the right of the verticol axis and negative values ore measured downward from the horizonlol axis and to the left of the vertical axis. 4. In o time-series chart the vertical or Y axis measures amount, ond the horizontal or X oxis meosures time. 5. Time values In o time-series chart ore usuoily represented as positive and move from left to right on the horizontal or time scale. 6. Every plotted point in o time-series chart has two values: An amount volue meosured on the verticol oxis ond o time value measured on the horizontal axis. 7. The horizontal oxis, zero line or other line of reference, should be accentuated so os to indicate that it is the bose for comparison of volues. There is no such bose of comporison for the time scale in a lime-series chart, however, there being no beginning or end of time. 8. In o time-series chart the plotted points ore generolly joined consecu- tively by straight lines to form o continuous line movement which is conventionally spoken of as o curve. The points of volue con be indi- cated by means of other grophic forms such os columns or surfoces, but the fundomentol principle is the some. 9. The values on the omount scale should be continuous,- and points on the scale with their corresponding horizontol rulings should reflect the actual intervals on the scale. 10. Time should be regarded os continuous with vertical rulings used to indicate only certain intervals of time. Equol intervals of time should be indicoted by equal space intervols on the scale. Mathematical graph
  235. 274 GRAPHIC PRESENTATION a; q: ft: uj :5 ::j ^

    Uj-4oco5 ^ hft:S;Ujl U,5coO r
  236. Ill 275 Chapter 34 COMPARISONS WITH TWO CURVES HE types

    of curve charts covered in this chapter are simple comparisons of two curves, cumulative curves, causal rela- tionships and high-low curves. REFERENCES Arkin, Herbert and Raymond R. Colton, Graphs: How to Make and Use Them, Harper & Brothers, New York City, 1937. Croxton, Frederick E., and Dudley J. Cowden, Applied General Statistics, Prentice Hall Inc., New York City, 1939. 49 30 20
  237. COMPARISONS WITH TWO CURVES 1920 •30 '35 1920 25 I93e

    DATA ARE PRELIMINARY U S Drpartmcnt of Agriculture, Bureau of AKricultural Economics. SCALE .8 Production and Farm Prices of Strawberries in the United States from 1918 to 1938. This chart shows an effective way of comparing two curves. Note the combination of the shaded curve and the dotted-line curve.
  238. 278 GRAPHIC PRESENTATION THOUSANDS OF PERSONS 2500 1920 21 22

    23 24 25 26 27 28 29 30 J2 33 34 35 WPA. National Research Project. "Summary of Findings to Date," March 1938. A. Movement to and from Farms in the United States from 1920 to 1935. This information is also given in B below. Here the emphasis is on the population move- ments to and from the farms. These two charts illustrate the technique of shading different sections of the same chart for different emphasis. 1 1 1 1 1 LEAVING FARMS FOR CITIES AND VILLAGES NET MOVEMENT TO FARMS U S Department of ARriculture. Bureau of Auriculfural Economics. B. Movement to and from Farms in the United States from 1920 to 1937. The interest in this chart is centered on the number of people who came to the farms, causing an accumulation of farm population. As a result, the section labelled "arriving on farms" is shaded darker than the "net movement from farms."
  239. 280 GRAPHIC PRESENTATION Abstracts from Time Series Charts. A Manual

    of Design and Construction. 1938, prepared by Committee on Standards for Graphic Presentation, under procedure of American Standards Association, with The American Society of Mechanical Engineers as sponsor body. MULTIPLE AMOUNT SCALES SOLID HOLLOA SHADED DASH 0ASH-HOLU3W DOTTED LINE AND DOT DOT DASH BALL AND LINE LINK A/' .1 M • • • • • • Curv* pottamt Principles 1. The purpose of multiple omounl scoles is to compere the movements of two or more series differing considerably in magnitude. 2. Multiple omount scales can be effectively used for comparing on the same grid two or more series not measured in comporable units (e.g., dollars and tons}. 3. In general, the use of multiple amount scales should be restricted and regarded as a device for special cases. Procedures 1. LIMITED NUMBER DESIRABLE. Multiple scales should normolly be lim- ited to two, as more ore likely to be confusing. 2. SAME RULINGS FOR BOTH SCALES. Scales should be so selected that all horizontal rulings for both scales will coincide. 3. ZERO VALUES SHOULD APPEAR. The zero lines of both scales should, if possible, be included on the chart and should coincide. 4. WHEN ZERO IS OMITTED. If the zero lines of the two scales cannot well be shown on the chart, the scales should be so adjusted that the zero lines would coincide if the scales were extended to zero. This procedure, illustrated at the right, will present the curves in their cor- rect relationship. 5. CONTROLLING CURVE MOVEMENT. Scales should be selected which will ovoid undue emphosis of any one curve. iSo selected that the relative movement of the various curves will be comporoble. It is not permissible to enlarge the movement of one curve orbitronly while minimizing the movement of the other.) 6. WIDE SEPARATION UNDESIRABLE. Scales should be selected that will bring the curves in close enough proximity for ready comparison. 7. THE SCALE RATIO. If possible, scole intervals of one scale should be in even multiples of the intervals of the other scale so as to facilitate comparisons of relative magnitude. 8. LOCATION OF SCALE DESIGNATIONS. Normolly, it is best to des- ignate one scale at the left and the other ot the right. 9. ALTERNATIVE METHOD OF PRESENTATION. The difficulties of mul- tiple scale presentation may be avoided by converting both series to a common base leg., index numbers, per cent of overage for pe- riod, etc.). CURVE PAHERN 1. Curve patterns should be so selected that the curves can be distin- guished readily from each other. 2. In general, the simplest patterns ore most effective and most eco- nomical. 3. In selecting curve patterns, it Is well to bear In mind the drafting diffi- culties and disturbing optical effects of complicated patterns.
  240. 286 ill Chapter 35 COMPARISONS WITH CURVES ^^^H types of

    curve charts covered in this chapter are simple comparisons of more than two curves, progressive average curves, moving average curves, and normal trend curves. REFERENCES Croxton, Frederick E., and Dudley J. Cowden, Applied General Statistics, Prentice Hall Inc., New York City, 1939. Karsten, Karl G., Charts and Graphs, Prentice-Hall, Inc., New York City, 1923. PERCENT 60 National Association of Motor Bui Operators. Washington, D. C., "Bus Facts for 1938." SCALE .7 A Comparison of the Percentage of Sales of Five Types of Motor Coaches in the United States from 1929 to 1937. 1. The total of the percentages which the lines represent is one hundred. 2. One way of differentiating a large number of curves plotted on one grid is shown here. 3. It might have been better to connect the labels to the lines with arrows, eliminating the necessity for putting them at an angle. ill
  241. 288 GRAPHIC PRESENTATION ^Arrtiiiiiuiiiuiuiiiiii'iiiuuu ; 1 1 ;i j a

    1 9 > II { s J ; ; 1 1 s .1 1 2 s .8 s } ? Iji 11 ! .: 1 Brinton, "Graphic Methods." McGraw-Hill, 1914. SCALE .5 A. Yearly Average of Revenue Tons per Train Mile on the Pittsburgh and Lake Erie Railroad. 1. The dotted line in this chart is a progressive average, or an average of all the items shown. 2. The numbers along the top of the chart give the value of the points on the plotted curves. 3. When space does not allow the dates to be put in full, the method shown here identifies each vertical line, and accents the decades. 4. Note the position of the scale designation in the upper left corner for both the scale and data figures. 1930 U. S. Department of ARriculture, Bureau of Agricultural Economics. SCALE .8 B. Annual Yield and Nine-Year Moving Average Yield of Rye Per Acre in the United States from 1 866 to 1930. A moving average, often used in graphic charts, is obtained in this way: the sta- tistics for a number of years are averaged and the result is plotted at the half-way mark. Thus if the data for the 9 years from 1890 to 1898 had been averaged, the result would be plotted at the year 1895.
  242. COMPARISONS WITH CURVES 289 '• E (J o o L.

    a. >« '<o O 0) 0) TJ <0 Id wt- _ O u a, Li ^ 0) > < > o 2 ^ o i 2 o -D — c So E «> O t: _2 <N £ ^£: c -o - ij V c c c 2 5 M JJ " a It o > 1. a£ T3 a CD „ > « 15 i
  243. 290 IIE GRAPHIC PRESENTATION Active File ...... Inflow of Appliconts

    ^^— Outflow of Applicants Excess outflow of appliconts over inflow. Excess inflow of applicants over outflow. U S Employment Srrvirc "Survey of Employmrnt Service Information." Fetiriinry I9J8. Effect of Outflow and Inflow of Applicants in the U. S. Employnnent Service on the Active File from April 1934 to January 1938. 1. Whereas each of these three curves minht have been presented separately, the com- bination of the tliree presents a picture not otherwise possible. 2. Notice how a solid section in the two lines at the bottom is rcHected in the upper one.
  244. 3IE COMPARISONS WITH CURVES 291 FftCSHMEN 1912 1913 19W 1915

    1916 1917 6,000 5,000 SOPHOMORES JUMIORS SENIORS I 4/XX) 3,000 2.000 Engineering Nfw«-Rccord, Novfmber 29, 1917. A. Enrollment in Engineering Schools in the United States from 1912 to 1917. 1. This chart presents the effect of the draft and enlistments for the World War on the enrollment in enginering schools. 2. The dotted line gives the numbers of students enrolled as freshmen, sophomores, etc. The other line by linking these lines shows the history of the classes from the time the students entered as freshmen. 3. Thus in 1914, over 6,000 students enrolled as freshmen to be graduated in 1918. The enrollment of this class in 1917 at the beginning of its senior year had dropped to a little over 2.000.
  245. COMPARISONS WITH CURVES 293 I Brinton, "Graphic Methods." McGraw-Hill. 1Q14.

    SCALE .9 A, Chart Showing by Months the Average Total Daily Water Consumption In Boston, and by Months the Average Daily Per Capita Water Consunnption. Also the Yearly Average of Daily Consunnption Stated in Total and Per Capita. 1. In this illustration, the curves may be read from either of two different sets of coor- dinate rulings. Using the horizontal ruled lines, we may read from the curves the average total consumption per day. By reading from the slanting lines, the same curves may be interpreted as the average consumption per capita per day. 2. The scheme of using two sets of coordinate rulings is a valuable one. The scale for "million gallons per day" should, however, have been shown only at the left, with the slanting line scale for "gallons per capita" placed in the right-hand margin for the sake of clearness. 3. The scale for "gallons per capita" is shown in the second vertical zone of the grid. Exhibit of thf Metropolitan Life Iniurance Company at the New York Worlds Fair, 103<) B. Curve in Neon Lights on a Glass Grid Placed in Front of Three Related Curves Painted on a Wall Surface. 1. Tubular form of the neon light lends itself particularly well to the making of illuminated curve charts without limit in size. Colors are available to give contrast in super- imposed curves. Consideration should be given to glare as lights may be too brilliant for easy reading. 2. On the glass-ruled grid for the neon lights above it is unfortunate that the zero line of the death rate was omitted. 3. For other methods of display, see "Displays and Exhibits," pages 486-493.
  246. 294 Chapter 36 COMPONENT PARTS SHOWN BY CURVES IN THE

    chapters on "100% Bar Charts." pages 92-105, and "Component Bar Charts," pages 132-141, the method of show- ing component parts in bar chart form is illustrated. The charts in this chapter present the same type of information in the form of curves. Other terms used for charts in which component parts are shown by curves are percentage charts, band charts, 100% band charts, percentage band charts, and surface charts. The terms "100% band chart," "percentage chart," and "percentage band chart," designate only those charts in which material is presented qn the basis of 100%. See 297B, 299B. and 300. The terms "surface chart" and "band chart" may be used when referring to either of the two charts shown on page 300. Pfdfral Rfservc Bank of New York. "Monthly Review," July 1. 1037. SCALE .7 A. Reserve Balance of Banks in the New York Federal Reserve Bank District from 1932 to 1937. 1. In a curve chart, showing component parts, it is possible to plot the totals of several groups of figures and the parts of which the total is composed. 2. In order to show rulings in a solid black or cross-hatched area, white ink is extremely useful. The white lines may be drawn after the area is completely filled in with ink. Alexander Hamilton Institute. N. Y C . ' Busi- ne<.s Conditions Weekly." July 2S. 1').18 SCALE 6 8. Employment and Unemployment in the United States from 1929 to 1938. 1. Because it probably was desired to em- phasize the unemployed, the divi- sion of the total supply of workers representing the unemployed was put in black ink. 2. Note that the total supply of workers increases each year, due no doubt to the increase in population
  247. COMPONENT PARTS SHOWN BY CURVES 295 1900 1910 1920 1930

    1940 U S Department of ARriculturc. Bureau of Agricultural Economics. SCALE 8 Approximate Acreage of Crops Harvested and of Pasturage to Feed Horses and Mules in the United States from 1900 to 1936. Brackets may be utilized for grouping in a number of ways. Compare this with 96A.
  248. 296 GRAPHIC PRESENTATION WPA and Bureau of Agricultural Economici, "Rural

    Poverty." 1938. SCALE .8 A. Expenditures for Direct Rural and Town Relief in the United States from 1932 to 1937. 1. Because the CWA and WPA reduced the number of persons receiving direct relief, ex- penditures during these two periods were affected. 2. The division of the total into parts shows that public relief has been reduced since the beginning of 1935, and that another form of direct relief has increased. "The Federal Chart Book," Prepared by Central Statittical Board and National Resources Committee, January 1938. B. Population in the United States by Size of "Conrimunity" from 1890 to 1930. 1. Each incorporated place is a separate "community." The use of a heavy line to repre- sent the total emphasizes the fact that the lines below it arc merely divisions. 2. See 93 A4.
  249. COMPONENT PARTS SHOWN BY CURVES 297 MILLIONS OF PERSONS 50

    AO — }0 ' 20 ^O' * o ^--^^'c -,, ^\>-r--^vv\^^v ,-^ V X - Cmp/oyeea in Distribution Sarvice .^ t x ." o ;" • c>\; ,-' ^ ^"^>. 1929 1930 I9?i I9?2 19?? I9M 1935 19)6 I9?7 19^8 I U. S. Dfpartmcnt of Commfrcc. Division of Economic Resrarch, "Survfy of Current Business," July 1938. A, Total Non-Agricul+ural Employment in the United States from 1929 to 1938. 1. When the labels for the various sections of a component-part curve chart are indicated within the section, an attempt should be made to keep the labels on a horizontal plane. 2. Note the position of the label for the "total" line. Dun's Rrview. August 1938 B. Percentage Distribution of Strike Issues in the United States from 1927 to 1937. The 100% band chart is similar in principle to the charts which contain a series of 100% bars. See 102B.
  250. COMPONENT PARTS SHOWN BY CURVES 299 A. Percentage Distribution of

    Three Types of Gasoline Feed in En- gines fronn 1910 to 1918. The total of the figures at the right-hand edge of the chart is 100%. as commented in 286. I "Automotive Induitrict," January 3, 1418. SCALE 6 Abstracts from Time Series Charts. A Manual of Design and Construction, 1938, prepared by Committee on Standards for Graphic Presentation, under procedure of American Standards Association, with The American Society of Mechanical Engineers as sponsor body. 3. SCALE SELECTION. Since surfaces ore built up (rom the zero line or other line of relerence, the oitiount scale should never be broken. Multiple amount scales ore not opplicoble to this type of presentation. 4. SCALE DESIGNATIONS. In general, the principles ond procedures ore the some as lor line charts. 5. SURFACES Surloces should be so shoded os to present a pleasing, even tone. In stroto charts the layers should be so shoded as to be easily distinguished. The weight and spocing of the lines and dots of the shading ore important; both should be determined from a con- siderotion of the size of the areas to be shoded end amount of reduc- tion intended Proiected surfaces may be indicated by lighter shoding of the some type as illustrated at the right. THE FOLLOWING SHADINGS ARE SUGGESTED: lal Block (solid) for generol use for purposes of emphosis. It should be used with discretion, however, and usually not for large oreos. In stroto charts the lowest layer should be the most im- portoni and therefore generally requires the heaviest shading (usually block). Ibl Crosshotch Sfiodmg* of o relatively dork lone, is often used in place of block for large oreas. A light Crosshatch is often useful for small layers of o strata chart. (c) Parallel Line Shading* may be used lor large or small surfoces. The lines should not porollel any opprecioble length of the curves end vertical or horizontal shading is not recommended as it may be confused with grid rulings. (dl Doited Shading (pebbled or stippled) is particularly useful for narrow layers of a stroto chart. 6. SURFACE DESIGNATION. Lobels should generally be pieced entirely within their respective surfaces If the surface is too smoH to permit this, o lobel may be placed entirely outside ond related to the sur- foce by meons of on arrow. Keys should not be used if direct lobielmg is possible. However, the spoce about labeU should be reduced as much OS possible to ovo<d loo great contrast. 7. SURFACE CHART DESIGNATIONS. In general, the principles ond procedures ore the same as for line charts. * Crosshotch ond oorolt«t line shod<ng should b« drown ot o 45 d«ore« ongi« Shoding constructed with v«rticol or horizontal lines is rtot recom* mended lo< surlocc chorts.
  251. 300 GRAPHIC PRESENTATION TOTAL B T U EQUIVALENT CONSLKtO »^^

    2» ?« -x PERCENT OF TOTAL B T U EQUIVALENT CONSUMED <m 1* at 10 WPA, National Research Project, "Fuel Efficiency in Cement Manufacture," April 1938. Total Energy Consumed in Hydraulic Cennent Manufacture by Types of Energy in the United States from 1909 to 1935. When component parts are presented in curve charts and if space will allow, it is desirable to use two charts, one showing quantities and the other showing percentages. The above charts illustrate the reason.
  252. 301 Chapter 37 INDEX NUMBERS SHOWN BY CURVES in a

    chart showing index numbers, 100 is used as the basis of comparison. In computing index numbers, one item or the average of several consecutive items is represented as 100. All other items are expressed as percentages of the base. Index numbers are computed and published by the U. S. Bureau of Labor Statistics, the Federal Reserve Board, the U. S. Depart- ment of Commerce, Dun and Bradstreet's, and many other statis- tical organizations. REFERENCES Brown, Theodore H., Richmond F. Bingham, and V. A. Tem- nomeroff, Laboratory Handbook of Statistical Methods, Mc- Graw-Hill Book Company, Inc., New York, 1931 »!••» -21 11 13 14 IS •» -27 » •» -JO ^l -il -JJ -M-JJ 1* Fcdrral Rctervc Bank of New York, "Monthly Review," January 1, 1937. SCALE .6 A. Index of General Production and Trade in the United States from 1919 to 1936. 1923-25 Aver- age Equals 100%. In index numbers, one figure is selected at 100% and all others are expressed as percentages of that figure. In this chart the average for the years from 1923 through 1925 was se- lected as the base figure or 100%. 1929 1930 1931 1932 1933 1934 1935 1936 Federal Reserve Bank of New York, "Monthly Review," March 1, 193 7. SCALE .7 B. Indexes of Volume of Agricultural and Non-Agricultural Exports in the United States from 1929 to 1936. 1923.25 Average Equals 100%. It is better to have both the 100% line and the zero line heavier than the others in an index-number chart.
  253. 302 GRAPHIC PRESENTATION -i —I —r—i —I —I —I —I

    —i —I — r -I —I —I — \ — \ —I —I —I — ' —I —r- Price Barometer of Profits (1910= 100) Income Alexander Hamilton Institute. "Business Conditions Weekly." July 2J. 1<»38. A. Price Barometer of Profits in the United States from January 1937 to July 1938. The crossing of two lines often creates areas which can be labelled. Compare the shadmg of these two areas with 283. * SEASONAL AVERAGE PRICE TO CKOIVERS U S Department of ARricuIture. Bureau of ARricultural Economics SCALE b B. Comparison of the Indexes of Production, Total Value, and Price of Seventeen Vegetables for Fresh Market in the United States from 1919 to 1936. In curve charts, when a number of curves are plotted on the same grid and when a num- ber of curve patterns are used, it is better to have the curves labelled as they are here than to have a boxed legend or key to identify them.
  254. INDEX NUMBERS SHOWN BY CURVES 303 INIXX XUMBtM Ivn-KK) l«M

    l»» l»V >9yi nfi !?>« I«» r»>6 l»)7 U S Drpnttmfiit of Commerce. Division of Eco- nomic Rrscarch, "Survey of Current Busi nr%5 June l'»38 SCALE <> A. Indexes of Income Paid Out by Type of Paynnent in the United States from 1929 to 1937. 1929 Equals 100%. 1. Till' thfcjry of index numbers is clearly demonstrated in this chart. Since the hgurcs for 1929 are equal to 100%, every curve begins at the same point in 1929. 2. In choosing a base year, care should be taken to select one which is rep- resentative, and devoid of "high peaks" or "low valleys." 3. For another method of presenting this material, sec 114A. I Per Cent 105
  255. 304 GRAPHIC PRESENTATION I9t6 1917 I9te 1919 1920 1921 r922

    1923 1924 I92S 1926 1927 1928 1929 1930 1931 i932 r933 1934 1935 r93( t937 The Magazine of Wall Street, November 20, 1937. A. Changes in Major Connmodity Price Group in fhe United States from 1916 to November 1937. The technique of putting the detail for the last year under a magnifying glass is good. eso
  256. INDEX NUMBERS SHOWN BY CURVES 305 •((.LIONS V OOLLAM TOTAL

    EXPORTS I "The Federal Chart Book," Prepared by Central Statistical Board and National Resources Committee. January 1938. SCALE .7 Total Exports and Imports of the United States Compared with the Index of Physi- cal Volume of Exports from 1919 to 1937. 1. To add meaning to numerical values, a comparison with index numbers is often useful. The insertion of the small index number chart in the space at the upper right shows one method of accomplishing this. 2. Note the method of breaking the grid to indicate an omission of a period of years. 3. See 93A4.
  257. 306 GRAPHIC PRESENTATION WPA. and Burrau of Acncultural Economics. "Rural

    Poverty." l')38. SCALE 7 A. Trends of Expenditures for Relief in the United States fronn 1932 to December 1936. When a broad line is used for a curve, the point in the middle of the line is the plotted point. If great accuracy is desired, a thin line should be used. The advantage of a thick line is that it is easily seen from a distance. \w
  258. INDEX NUMBERS SHOWN BY CURVES 307 MOCX NUMBint, HI6H MONTH

    Of i«s;>ioo I National Industrial Confrrcnoc Board. Inc , November 2S. 1038 SCALE 7 Depression and Recovery in the United States for the Years 1937 and 1938. 1. The most interesting feature of this chart is that the high month of 193 7 is equal to 100% in each of the six charts. The result is that each curve has a different base figure. 2. The lowest point from that date to the date when the data were last available was designated the end of the depression period. As a result, there is a variation in the date at which the depression period supposedly ends in each of the six charts.
  259. INDEX NUMBERS SHOWN BY CURVES 309 Yearly Output of Four

    Important Industries in the United States from 1919 to the Middle of 1936. Relative to 1923-25 Aver- age. Noti- the- use of iirruws lo imlu-ntr tin- scale applii'iiblr tu tlic ilata. The reas«)ii (or prisj-ntmj; this mate- rial in 'his form was no doubt to avoid crossing the curves. Com- pare tJus nuthoil with .U)JA. Fr.lci Kurtvr Blink of New w Aiimi»t 1. l'JJ6. York, ••Monthly I INDCXtS or INDUSTRIAL PRODUCTION MCTAL INDU5TRIC3 1921 l^^^ nzi I9^^ i925 l^^6 isz' on i929 i9J0 Brown Bineham. ami TrmnomrroH. ' Laboratory Handbook of Statistical Methods/' McGraw-Hill, 1931. B. An Example of a Multiple Axis Graph. 1. It has been noted that when a multiple scale is used on an arithmetic chart, all scales must have a common zero line. When the data are chant; ed to index numbers, it is possible to arrange the curves on a multiple axis; that is, each curve fluctuates around its own base, or 100, and can be moved farther from or closer to other curves without distorting the facts presented. 2 The purpose of this arrangement is to facilitate comparisons of the time and ampli- tude changes in the curves.
  260. 310 |i || Chapter 38 FREQUENCY CHARTS HE charts in

    this chapter present data showing frequenoy dis- tribution. The most common bases of classification or arrange- ment are according to kind, size, location, or time of occur- rence. Other terms that may be applied to this type of chart are histogram, distribution chart, and block diagram. When the curve in a frequency chart assumes the shape of a bell, it may be called a bell curve chart. 250 200
  261. Ill III FREQUENCY CHARTS MACHINE OPERATORS PERC£NT or TOTAL PCRCLNT

    OF TOTAL III 311 16-19 20-24 25-34 35-44 45-54 55-64 AGE GROUPS HAND CIGAR MAKERS PERCENT OF TOTAL 35 PERCENT OF TOTAL 135 20-24 25-34 35-44 45-54 55-04 85 AND ON/FR AGE GROUPS WPA National Rrsrarrh Projcrt. CiKar M;ikrr» —Aftrr thr Lay-off." Dfccm»>*r 1Q37 SCALE 9 Age of Machine Operators in Cigar Factories and Hand Cigar Makers in the United States as of July 1931. 1. A comparison of these two frequency charts indicates that machine operators are rela- tively much younger than hand cigar makers. i. The notation of the median age means that there are as many men younger than 26 working as machine operators as there arc men older than 26. Ill III
  262. 312 GRAPHIC PRESENTATION Male Female WPA, Diviiion of Social Rcsfarch.

    "Urban Workers on Relief," 1936. SCAI.E 9 Duration of Unemployment Since Last Non-Relief Job of Unemployed Workers on Relief in May 1934 by Socio-Economic Group of Usual Occupation in the United States. Note that the total of the bars representing any one group, such as female unskilled work- ers, is equal to 100 per cent.
  263. FREQUENCY CHARTS 313 400 350 300 250 200 150 too

    50 400 350 300 250 200 150 100 50 I
  264. 314 II III GRAPHIC PRESENTATION |i HUMDRCDS OF CARS MAY

    JUNE JULY AUG. SEPT. OCT. Rrtlrawn from n Chart liy Biirrnu of AKririiltural Economic*. U. S. IDcpt. of ARriculturc. SCALE 8 Average Weekly Carload Shipments of Peaches in the United States by States. 1. The average is of the years 1927-19.^0. 2. The copy from which this was redrawn was a photostat, and it was redrawn because the base lines of some of the charts were wavy. After the chart was finished, it was found that there was a definite optical illusion. When the chart is viewed from a distance, notice that the base lines seem to hump at the point where the bars arc the highest. Ill ill III
  265. Ill III FREQUENCY CHARTS |i 315 40 30 20 10

    30 20 - 10 c ^ 30 20 10 30 20 10 16-17 - ytort o» og« am- —Iili 18-19 I ftOfi of 09« 20-21 yeort o( oge ' ^tiI I 22-24 yeors of oqe ' LLt[ JLJL-M. II 12 htow 1-3 4-5 6 7 8 9 10 Grode school and high school OPEN COUNTRY - Grode completed 2 3 College 10 16-17 years of oge 6-17 rs of oge zidtulxx^ 30 18-19 20 [- yeors of oge 1 I l^-rrl 30 20 10 20-21 years of oge 1_I_I Jml 22-24 yeors of oge T^ITI i!__&I None 1-3 4-5 6 7 8 9 10 II 12 Grode school and high school VILLAGE - Grode completed 40 30 20 10 30 20 10 30 20 10 30 20 10 ^ ^0 30 12 3 4 College WPA. Divifion of Social Research. "Rural Youth on Relief." 1037. SCALE 9 Grade Completed by Out-of-School Rural Youth on Relief, by Age and by Resi- dence, in the United States, October 1935. This may indicate a lower percentage of college graduates on relief, or only a lower per- centage of college graduates in the community. Ill
  266. FREQUENCY CHARTS 317 HALF-YEARLY INTERVALS. JULY 1933 -JULY 1935 0f^

    y<Kt 0Ot)o«ort 0P(ftittrl»On« ©Oijlnel o( Colun*w ©Aiobomo @Wnl Virqmio @Aikcnsos (|)Ncrin Co'Dii'va ®Sg>k>> Conttno @Oiar>oma WPA. Division of Social Research, "Trends in Relief Expenditures. 1910-1935." 1937. Percent of Population Receiving Relief, by States, fronn the General Relief Pro- grann, F.E.R.A., from July 1933 through July 1935. 1. If this chart is turned so that the left side becomes the base line, the similarity be- tween it and other frequency charts is more easily seen. 2. The shaded areas and the use of numbers to give a key to the states are good tech- niques.
  267. 318 III GRAPHIC PRESENTATION ! UCDIAN, BWKAU OF STAHOAffOS •

    SM-A^y or Ott Of HJODC IMXvmMLS ontp cu»f3i tA/tm^Gs or CNc»€)a»c auaMJB, auLUVN a ISOOO 14000 13000 12000 IIOOO 10000 90O0 aooo 7000 5000 4000 3000 2000 lOOO
  268. Il III FREQUENCY CHARTS ! 319 A. Distribution of the

    Causes of Ac- cidents in Hartford, Conn. Compare this method of showing the dis- tribution of the causes of acci- dents with that used in 190A. I Travelers Insuranrr Co . Hartford. Conn SCALE 7 Burni. "The Decline of Competition." McGraw-Hill, 1936 (Source: Federal Trade Commitsion Price Baies. Inquiry). SCALE .7 B. Net Yields on the Sale of 2.350 Carloads of Cement to Five Minneapolis Line Lumber Companies at 2 1 Destinations in Minnesota, Iowa, and North and South Dakota Between July I, 1927 and June 30, 1929. 1. Each dot represents one carload of cement. Dots in the area marked "one price sys- tem" represent sales at prices yielding to the mill its "then current maximum mill net price." 2. Dots in successive outer zones represent sales yielding less than the mill's maximum mill net by an amount within the range of cents indicated within each zone on the chart. The guide for cents per zone is shown in the South Dakota section.
  269. 320 Chapter 39 CORRELATION CHARTS THE purpose of correlation charts

    is to indicate the degree and type of relationship between variables. One form of correlation chart, the scatter diagram, also called the gun-shot or shot-gun chart and buck-shot chart, sometimes indicates that there is no relationship between two variables. See the chart below. ( 4tfir tu^Kidtf t IT" vuit votuui itn - TMOtnANM of ook.iu\ Dun't Review, August 1938. SCALE .7 The Increase or Decrease of Sales for the Period 1935-37 for Individual Retail Stores in the United States According to Sales Volunne in 1935. 1. According to the comments in Dun's Review, the wide scatter of individual cases indicates a "growth tendency in favor of small concerns" rather than indicating that "all large stores had built sales volume more rapidly than the small ones." It should be noted that the vertical rulings are logarithmic. The limited number of vertical and horizontal rulings was intentional -that is, they were limited to make it easy for the reader to notice the lack of pattern of the dots.
  270. CORRELATION CHARTS 321 . The Development of Electrical Ad- vertising

    as Revealed by the Number of Watts Usea per Inhabitant in 143 Cities in the United States in 1922. This scatter chart is supplemented by an average hne secured by com- putation. The lack of pattern here indicates that there is little correlation between the two variables. Aggregate population of the 143 cities was 6,300,000. The average of 3 1/3 watts per inhabitant was weighted according to population, not according to the number of cities.
  271. •Il III CORRELATION CHARTS || 323 a: < o o

    > UJ o o < (/) 300 — FOUR SMALL CITIES IN OREGON AND WASHINGTON FOOD HOUSING ^50 600 750 1000 AUTOMOBILE ZOO 400 6O0 — 300 123 250 373 SOO RECREATION 50 100 130 200 FOUR COUNTIES IN PENNSYLVANIA AND OHIO PERSONAL CARE HOUSEHOLD OPERATION 50 100 150 aoo MEAN IN DOLLARS Dorothy S. Brady. "Variations in Family LivinK Expenditures." Journal of thr American Statiitiral Association. Junr 19J8. Standard Deviations of Fannily Expenditures in Relation to The Mean in Four Small Cities in Oregon and Washington, and Four Counties in Pennsylvania and Ohio, 1935-1936.
  272. 326 GRAPHIC PRESENTATION txKPtoiTimes in OOLLtRS s,ooo ex^MoiTimes IN DOLLARS

    3,000 4.000 - SfiOO t.ooo - 4,000 t.ooo 3,000 INCOME n OOLLA/tS - 3,000 A. D. H. Kaplan. "Expenditurr Patterns of Urban Families," Journal of the American Statistical Asso- ciation. March 1938. SCALE .9 Expenditure Pattern of Wage-Earner Families in Chicago, Illinois, in 1935-36. 1. It should be noted that these lines are cumulative. The line numbered 5 represents on the expenditure scale the amount spent for 5, 4, 3, 2, and 1. The difference between 4 and 5 is the amount spent for "fuel, light, and refrigeration." 2. If line 17 is above 16, the families in that income band were not in debt at the end of the year; if line 17 is below 16. the family income did not cover expenditures. Ill III III
  273. Ill CORRELATION CHARTS 327 100 90 80 t 70 V)

    K SO < O 50 I- bJ I- E < 30 20 ID
  274. CORRELATION CHARTS 329 SAltS SCAU IN PlRCtNIACC 4*0 5SA M6

    710 SCALt OF PERCENTAGES Prepared hy E. S. La Ro«e, 1Q31 Year Book of the National Association of Cost Accountants, N. Y. C. SCALE ,7 A. Profit Chart Showing the Relation of Sales and Profit. 1. This is a detailed version of 328B. 2. The two lines around which the others are plotted are the ones labelled "A" and "B" at the lower left, which represent total income from sales and total cost of sales, respectively. So long as "B" is above "A" there is a loss. I kl - IMlOOO >. ' 140000 . . °{ noooo. o tooooo. 2 O O 2 ^ _ )M00O u ^ I400OO. .* G 5 £ tioooo a o tooooo it '°°°° J - 40000. < ^ _.i.. ;r w*40ow cnspiAY cm vLAYB m tAcH OF THE;i-iit>OKKirieY Its- : . : . : : ! -:: r i:t IIQW fuE ACIUKO. eiR i*CH or TWt LAROlUlTOItigci ! ES FRDMTHl! TRCUIUI II»t :v;iNt otPBEJl MTca BY 'pit 1 .' The Advertising Research Foundation. New York City. 1937. SCALE .5 B. The Average Daily Circulation of the Number of Window Displays Required to Obtain Normal Distribution in Various Cities. The dots represent actual average daily window display circulation passing the normal number of displays in each of the cities studied. It has been estimated that to produce normal display distribution, the average daily window display circulation passing a display should equal 50% of the population of the market. The curve represents that theoretical 50%.
  275. 330 III GRAPHIC PRESENTATION [ I r UMABSORBEO INVESTMENT (

    I . ABSORBED INVESTMENT pTH »C0NCt8SI0NAIRt'S CLEAR PROFIT f^—^ ' CONCEStlONAIRE'S TOTAL PARTICIPATION in* FAIR PARTICIPATION ^H < OPERATING COSTS CRO*5-0V(R AT 19 MILLION ADMIf SION0 14 MILLION ADMISSIONS 28 MILLION ADMISSIONS 40 MILLION ADMISSIONS New York World's Fair. l')3Q, Treasury Division, Methods and Planning Dept. A. Break-down of Receipts in Percentages of the Ice Cream Stand at the New York World's Fair, 1939. 1. This includes also soda fountains, and carbonated beverages. 2. The Fair participation basis is 11V4% at 14 million admissions, 20% at 28 million admissions, and 35% at 40 million admissions.
  276. Ill=l|l=l|l=l|l=l|l33, Chapter 40 OGIVE AND LORENZ CHARTS X he Ogive

    chart is also called a cumulative frequency curve. Its definition is as follows: a frequency distribution in which "more than" or "less than" data are presented. One scale of the grid represents percentages and the other scale represents "more than" or "less than" values. NUMftER OF FAMILIES 90,000,000 20,000,000 10,000,000 NUMftER OF FAMILIES RECEIVIN6 INCOMES OVER SPECIFIED AMOUNTS I <Z Rrdrawn from Advertising and Selling, January 1917 Number of Families Receiving Incomes Over Specified Amounts in the United States in 1916. 1. In reading the above chart the amount of the income is read by the scale at the bottom of the diagram. The number of families is indicated by the scale at the left-hand side. 2. If you wish to learn how many families are receiving an income of $1,500 and up- wards, it is shown by the point where the curve crosses the middle vertical ruling between the $1,000 and the $2,000 lines. This is found to be at 3,750.000 accord- ing to the scale at the left. There are, therefore, approximately 3,750,000 families that are receiving an annual income of $1,500. In the same way it is possible to estimate that there arc 5,150,000 families that are receiving an income of $1,200. lll =lll=lll=lll=lll
  277. 332 GRAPHIC PRESENTATION A Lorenz chart gives frequency distribution when

    both the vari- able and invariable quantities are reduced to percentages. The curve is plotted on a grid on which both the horizontal and the ver- tical scales represent 100%. 100 90 80 70 60 50 40 30 20 10
  278. OGIVE AND LORENZ CHARTS 333 Henry S. Dfnniton. "ManBBrmcnt and

    the Buiinets Cycle." Journal of the American StatUticnl Asso- ciation. Washington. D C . March 1922. SCALE .8 A. Relation of Disbursements to Receipts from Sales in the Upward Swing of the Business Cycle. E Brown. BinKham. and Tcmnomeroff . "Lafioratory Handbook of Statistical Methods." McGraw-Hill. 1931. B. An Ogive Curve Plotted on Probability Paper to Determine the Probable Dis- tribution of 100,000 Shirts According to Neck Measurements. 1. When an ogive curve is plotted on "probability" paper, assuming that the frequency curve is symmetrical, the curve is in the form of a straight line. For this reason it is possible to construct the curve for any particular problem with a small number of observations. 2. For explanation 6f this chart, see 335.
  279. 111=111=111=111=111 334 ^^^.,^.^ GRAPHIC PRESENTATION TABLE A. Neck Measurements of

    White Troops at Demobilization Neck Measurements, Centimeters
  280. OGIVE AND LORENZ CHARTS 335 TABLE A. Determination of Number

    of Shirts H. B. Mann, Incorporated Shirt
  281. 338 i|i=iii=iii=iii=i|i GRAPHIC PRESENTATION PERCENT OF TOTAL NUMBER OF STORES

    U. S. Department of Commerce, Bureau of ForeiRn and Domestic Commerce, "Small Scale Retailing," 1938. Correlation of Proprietors and Nunnber of Retail Stores in the United States in 1933. 1. Because this chart is plotted on probability paperj the "line of equal distribution" assumes an "s" shape rather than a straight line. 2. It is clear from this chart that the number of proprietors of retail stores correlates closely with the number of stores. The figures and curves show that nearly 33 per cent of all stores are operated by nearly 35 per cent of the proprietors — who operate stores of less than $3,000 annual volume. When certain series of observations showing frequency data are plotted on arithmetic probabiHty paper, the points do not fall in a straight line, but in a curve. Plotted on probability paper with a logarithmic scale as the ordinate, the points may fall approximately in a straight line or a gentle curve. In order to benefit from the use of probability paper, it is not necessary that the plotted points fall exactly in a straight line. If the curve is so gentle and uniform that it may be extended beyond the limits of the plotted points, it will usually be found sufficient. Sources of Arithmetic and Logarithmic Probability Paper: Codex Book Co., Norwood, Massachusetts. Educational Exhibition Co., Providence, Rhode Island. ili=ili=ili=ili=ili
  282. RATIO CHARTS, for idrnlifirr Cro«« lmr« i|>iii-r rloirr As you

    l(M>k hichcr. Chapter 41 RATIO CHARTS 339 ^^ ratio chart is designed to indicate rate of change rather than arithmetic change. Although in many instances the spacing of the ruHngs clearly indicates to an experienced reader that the chart is plotted on ratio ruling, it is frequently desirable to indicate the ratio basis as shown in 345 and 346. This is especially necessary if the chart covers a comparatively short range of scale since the reader might not notice the difference in spacing of horizontal lines on the grid. Synonyms for ratio chart are logarithmic chart, semi-logarithmic chart, rate-of-change chart. The term "ratio chart" is short and expressive. There is need for a corresponding term equally expressive to designate charts planned on the usual arithmetic basis. lOO.OOO.OOO lO.OOO.OOO I.OOO.OOO lOO.OOO lO.OOO I.OOO lOO lO I A. Arithmetic Scale and Ratio Scale. 1. On the arithmetic scale, equal vertical distances represent equal numeri- cal differences; that is, the dis- tance from 1 to 2 is the same as the distance from 2 to 3 and from 3 to 4. 2. On the ratio scale, equal vertical dis- tances represent equal percentage differences; that is, the distance from 1 to 2 is the same as the distance from 2 to 4 and from 4 to 8. B. Key for Assistance in Selecting the Proper Scale for Three - Deck Ratio Paper. 1. If the figures of the data to be plotted on 3-deck ratio paper fall within the range of any one of these six brackets, the four figures within that bracket indicate the scale to be placed at the 4 points of the 3-deck paper. 2. A similar key could be made for 4- deck and 5-deck ratio paper.
  283. 340 GRAPHIC PRESENTATION REFERENCES: Bivins, Percy A., The Ratio Chart

    in Business, Codex Book Co., Norwood, Mass., 1926. Fisher, Irving, "The 'Ratio' Chart for Plotting Statistics," Journal of the American Statistical Association, Vol. XV, June, 1917. (May be obtained from ASA for 75c.) SCALE 2000 ISOO 1000 900 800 700 600 500 400 300 200 100 90 80 10 60 50 40 iO 20 10
  284. RATIO CHARTS 341 I S t« i - t og

    ar ^ t ni* i c tctlal NUMBER CONSUMED PER CAPITA 1.00
  285. lllHlllHlll GRAPHIC PRESENTATION 1910 1915 1920 1925 1930 WPA, Division

    of Social Research, "Trends in Relief Exjjenditures. lQlO-1935," 1937 SCALE .8 A. Expenditures for Public Outdoor Poor Relief in Indiana from 1910 to 1931. 1. The broken lines indicate that thrf data were not available, or not available in comparable form for these years. 2. Since there is no zero line on a rate-of-change chart, there is no difficulty in pre- senting on the same grid two groups of data which have different scales. Com- pare with 276A.
  286. RATIO CHARTS l|lHl|l 343 REFERENCES: Karsten, Karl G., Charts and

    Graphs, Prentice-Hall, Inc., New York City, 1923. Wenzel, J.. "Graphic Charts; the Use of the Logarithmic Scale for Charting Statistics," Scientific American, 1917. This issue of Scientific American is so limited that copies are not for sale. However, it is available in most libraries.
  287. 344 GRAPHIC PRESENTATION Dun's Review. Fcl>ruary 193Q. Failures by Industrial

    Groups and Size of Liabilities in the United States from 1935 to Decennber 1938. There is a definite corollary to be derived from these two charts. In the upper one indus- tries labelled "retail trade" have the largest number of failures. In the lower one. those industries whose liabilities are under $25,000 have the largest number of failures. From these two facts, it may be deduced that the retail trade is in that category "under $25,000."
  288. RATIO CHARTS 345 CWA in op«ralion Wofkt Program in optrolion

    Work* Progrom in operation UNITED STATES TOTAL Semi(ogorilhn>ic scol« \ \ -< I 1 I 1933 1934 1935 1933 1934 == Obligotions 1935 •^^— Cases = WPA Divuion of Social Research. •Trend* in Relief Exf)enditure», 1910-1Q3.S," J937 Trends of Relief Cases and of Obligations Incurred for Relief Extended to Cases in the United States from July 1933 to December 1935. The horizontal line running through each pair of curves represents the average month, July to December 1933, for both cases and obligations.
  289. 346 lllaalllHlllailll GRAPHIC PRESENTATION 1910 1915 1920 1925 1930 1935

    Note Broken lines mdicote doto not ovoiloble or ool ovoiloble in comporoble form for these yeors WPA. Division of Social Rcsrarrh, •Trctxls in Rtlicf Ex|>rndituret, iqiO-IQ3.S," 1937. Trends of Expenditures for Public Outdoor Relief in Selected Areas from 1910 to 1935. The scale may be omitted, as it is here, with only a notation that the chart is plotted on a rate-of-change scale. The curves have been moved toKcthcr even though the scales do not coincide.
  290. RATIO CHARTS 347 A. Growth of Business Based on Re-

    search, Showing Industrial Con- tributions of Research and Invention in the United States from I860 to 1930. The oriKinal of this was black with the lines and lettering in white. By revcrsinR the original, black on white was obtained. 14000
  291. 348 GRAPHIC PRESENTATION Abstracts from Time Series Charts. A Manual

    of Design and Construction, 1938, prepared by Committee on Standards for Graphic Presentation, under procedure of American Standards Association, with The American Society of Mechanical Engineers as sponsor body. RATE-OF-CHANGE CHARTS A. DEFINITION. The rate-of-chonge chart ("rotio" or "semi-logarithmic" chart) is a type used for picturing the percentage or relative change in values of a series over a period of time rather than the change in absolute amounts as shown by the arithmetic chart. 1. The picture of rate of change is achieved through the use of logarithms. Rate-of-change curves can be constructed either by plotting the logarithms of the values on an arithmetic scale or by plotting the actual values on a logarithmic scale. The latter is the more usual procedure. 2. The effective use of rate-of-change charts requires an appreciation of their limitations as well as their possibilities. B. WHEN TO USE RATE-OF-CHANGE CHARTS: 1. When the interest is in relative movement of a time series and not in the differences between amounts. 2. When it is desired to compare the relative movements of several time series. 3. When the readers are likely to be familiar with this form of chart. 4. When the usual arithmetic chart would present a misleading pic- ture of movement. 5. For occasions when there are no minus figures included in the time series. Note; If it is desired to present a complete picture of both rote of change end amount of chonge the dato con be presented on componion charts, one with a logarithmic amount scale and the other with the usual arith- metic scale.
  292. RATIO CHARTS 349 50.000 45,000 401000 35.000 30.000 2S.000 20.000

    15,000 12.000 \0.000 9.000 6,000 7.000 6.000 5.000 4,000 3.000 2.000 1.000 1915 16 17 'W 19 10 t1 tl IS M IS 16 t7 la 19 10 '31 1i 13 I9<4 Automobile Manufacturers Association. "Automobile Facts and FiRures." 1035. SCALE .9 A. Average Life of a Car as Shown by Two Cumulative Curves. Two cumulative curvt-s are plotted on the same logarithmic grid. The horizontal distance between the two lines thus gives the average life of the car. A cumulative curve may be shown on logarithmic scale as well as arithmetic. See 2 7 9. E Abstracts from Time Series Charts. A Manual of Design and Construction, 1938, prepared by Committee on Standards for Graphic Presentation, under procedure of American Standards Association, with The American Society of Mechanical Engineers as sponsor body. CURVES. The plotting on rate-of-change charts requires consider- able care because of the peculiar character of the logarithmic spacing. Where special grids are prepared without intermediate rulings, it is desirable to use a logarithmic plotting scale which may easily be made from printed commercial paper of the proper dimensions. In general, rate-of-change charts call for simple lines connecting the points of value. Columns or surfaces, of course, should not be used to indicate values on a rate-of-change chart. Columns and surfaces may be used on an arithmetic chart to indicate changes in ratios, however.
  293. 352 GRAPHIC PRESENTATION Total RarcB 1926 1928 1980 1982 1984

    1986 19S8 Textile Economics Bureau. Inc.. N Y C. "Rayon OrRanon," June 1Q38. SCALE .7 World Rayon Yarn and Staple Fiber Production. This chart shows a number of interesting items, among them the ranking of the principal nations of the world in the production of rayon.
  294. RATIO CHARTS 353 SCALE 8 A. A Method of Ruling

    Logarithmic Paper. 1. When logarithmic paper with cycles of the proper height is not available, it is fairly easy to rule paper using a cycle bigger or smaller than the space allotted. In the illustration above, a cycle from logarithmic paper is used for scale reduction. 2. A statistician's scale may be an easier method. / |iiii|iiii|iiii|i;iMii!l |^i|i|ii|i^ipi^i^;^j^^TT7 Ue« rj PARAGON M75 P STATISTICIAN'S SCALE Keuffel & Esscr Co , New York. 6. l3t edge, 2 complete logarithmic scales, one 25 cm. long, one 4J cm. long. 2ud edge, 3 complete logarithmic scales, one 12 J cm. long, one 10 cm. long, one 6^ cm. long. 3rd edge, 30 centimeters, subdivided to millimeters. 4th edge, 12 inches subdivided to 40ths of Inches. This scale is for the statistician. r — zs::: WlUf a^^^MM^^ J^ Wk C. Triangular Scale, Engineer's, div. 10, 20, 30, 40, 50, 60 parts to the inch. Keuffel 8» Esser Co.. New York.
  295. 354 Chapter 42 THREE-DIMENSIONAL METHODS EY MEANS of three-dimensional models,

    similar to those shown in 354, 355A, and 355B, it is possible to present three variables in the form of curves rather than the usual two. Other methods of showing three dimensions are illustrated in the isometric block diagram in 356A and in the trilinear chart in 359B. Commonwrallh Edison Company. Chicago. Ill SCALE .6 Three-Dimensional Curve of the 1935 Load of the Commonwealth Edison Company. 1. Thrcc-ply bass wood was used in the construction of this three-dimensional model. Each curve is a board which, before it was cut. measured Yt x 17 x 11 inches. 2. The Klass case is ruled with a scale of kilowatts on the sides and with the 24-hour period from midnight to 12 midnight on each end. The third dimension is by days, the scale for which is on the base. 3. The exhibit is about 5 feet long and weighs approximately 300 pounds.
  296. THREE-DIMENSIONAL METHODS 355 Pacific Gas and EIrctric Company, San Franrlsco.

    California. SCALE 4 A. Three-Dimensional Curve of the 1935 Load of the Consolidated System of the Pacific Gas and Electric Connpany. 1. Dimensions of the model, excluding base, are 12" x 24" x 12" high. 2. The front black section represents a load curve showing variation from day to day throughout the year for the last half hour of each day. The clefts between the tifty-two sections are Sundays. Additional clefts are the holidays. I The Detroit Edison Company, Detroit, Michigan. SCALE .5 B. Three-DImensional Curve of the 1935 Load of the Detroit Edison Company. Apparently the data for the entire year were gathered before this model was started. The load for the first half-hour of each day for the entire year was then cut out, and for each half-hour after that, making 48 curves. Compare this with 354 in which the load for each day was plotted, making 365 curves.
  297. THREE-DIMENSIONAL METHODS 357 I W. D. Johnston, Jr., and T.

    B. Nolan, "Isometric Block Diagrams in Mining Geology," Economic Geology, August 1937. A, Isometric Protrac+or. >
  298. 358 GRAPHIC PRESENTATION INCOLARVM OCiCKIPTIO MARE5 pVl VIVl NATl 5VNT

    ET 5VPER.mTE5 PER. yeXATEi DEiCKIPTI IVXTA. CENLSV5 IN JVECIA HABITOJ AB AN MDCCLAD MDCCCLXXV LINL« ^TATVM • JVUVTITVM IIOMMICiC CtMUTOtyu ITALl/C REGNVM TABVLARIVM CEN5VALE ROM/E AN MDCCCLXXX Journal of the Royal Statistical Socifty of London. Jubilcf Volume —188.S. Chart by Luiri Perozzo in 1870. SCALE .5 Three-Dimensional Model Showing the Growth of the Population of Sweden from 1750 to 1875. The picture of this model which appeared in the Journal of the Royal Statistical Society of London was in a brown half-tone with black, red, blue, and j-reen lines. The three dimensions are the years from 1750 to 1875, the number of persons, and the age of the persons. In this book, an illustration occupying a full page is referred to by page number. When there is more than one illustration on a page, each is identified by a letter of the alphabet. When there is more than one footnote beneath an illustration, each is numbered. Thus the cross reference 267B2 means page 267, illustration B, note 2.
  299. THREE-DIMENSIONAL METHODS 359 A. Triangular Coordinate Graph Paper. The trilinrar

    chart was fust used for in- vrstigation on strength of con- crete mixtures. This form lends itself to the demonstration of prob- lems involving a mixture of three ingredients, such as alloys con- taining three metals and food ra- tions containing three dietetic ele- ments. Krufffl (k Ejifr Co , N Y. v(Oiopside) *PDt«s?i Feldspar (PolaihTeWspar) WT. PER CENT «»7* 17/3" J F Sfhairrr and N L Bowcn. 'Thf SyHrm. Lruritr —Diopiidc —Silica." Amfrican Journal of Scicncr. IQ38 Groi>hy«ical Laboratory CarnrRif Institution of Washington B. Equilibrium Diagram of the Ternary System, Leucite —Diopside —Silica.
  300. 360 Chapter 43 COMPOSITE CHARTS Jb o present a more

    complete picture it is often desirable to com- bine several different types of charts. The charts in this chapter illustrate different methods of combining various charts. NET INCOME IN MILLIONS OF DOLLARS z - « li 200 175 150 - m - 100 75 75 - too 1975 197b 1977 1978 1979 1930 1911 1957 19JJ 1914 NET INCOME OR DEFICIT
  301. COMPOSITE CHARTS 361 INDEX SCALE INDLX SCALE /•Labor Cost IjieO

    ' '.Per *100 Value. (^ Gross- >/vlncomc no 108 0(> -84 82 60 9^t Guttav R. Stahl, J. T. Trenholm & Co.. N. Y. C f75ah7 957 r9?3 A. EfFect of Walk-Oufs in the United States on Business From 1936 to June 1938. ^^ "«!* :% ^ate^
  302. Ill 362 |1- GRAPHIC PRESENTATION III CENTS PER BUSHEL 150

    100 50 50 WINNIPEG -25 BUSHELS (MILLIONS) "1 r MinneapoUs ,'v No. 1 . D. Northern p ^ Spring — Winnipeg No. 3. Manitoba i.l.i.l-i.l.i.l.i.l.i.l.i.l.l.l.l.l.i-l-'-l-i-l l.l.l.l.l.l.l - Tariff level -^^^ ^ PRICE MARGINS AND TARIFF LEVEL ' ^ ^- Minneapolis over ~ Winnipeg . I I I I I I .1 . 1 I I I . I I .1 I . I . I .1 . 1 .1 I I I . I I I . I I . I . I I 1 — r -I 1— HARD RED WHEAT, IMPORTS FOR CONSUMPTION, FULL DUTY PAID ii- ILJ _lA.i 1922-23 '26-27 '30-31 YEAR BEGINNING JULY '34-35 U S. Drpartmrnt of Aerirulturr. Burrau of Acrirultural Economiri. SCALE 8 Prices, Price Margins. Tariff Level, and Imports of Wheat in the United States From July 1922 to July 1937.
  303. COMPOSITE CHARTS 363 COST or LIVING INMX NUMMMt,l92«-IOO REAL" WEEKLY

    EARNINGS INDEX NUMBERS, 1929^100 tclepmones and TELECBAPHS Electric light and power AND manufactured GAS - Class i railroads Electric railroads and motorbuses crude petroleum producing metalliferous mining __ YEAR-ROUND motels ALL MANUFACTURING _ DURABLE GOODS NONDURABLE GOODS LAUNDRIES WHOLESALE TRADE RETAIL TRADE _. GENERAL MERCHANDISING- OTHER THAN GENERAL MERCHANDISING QUARRYING AND NONMETALLIC MINING- DYEING AND CLEANING _ I National Industrial Confcrrnrr Board. Inc.. N. Y. C. June 17. 1938. SCALE .6 Cost of Living and "Real" Weekly Earnings in the United States From 1929 to 1938. Curves, bars, and a sector chart combined give a clear, concise picture of a problem. I II. I III
  304. 364 GRAPHIC PRESENTATION BY CLASS OF SERVICE. 1929. 1933. 1937

    ROAD MSSENCen ENGINEERS ROAD rnElCHT ENGINEERS ROAD PA&SENCER CONDUCTORS ROAO FREIGHT CONDUCTORS YARD ENGINEERS ROAD PASSENGER FIREMEN YARD CONDUCTORS ALL TRAIN AND ENGINE SERVICE LABOR ROAD FREIGHT FIREMEN ROAD PASSENGER BRAKEMEN YARD BRAKEMEN ROAO FREIGHT BRAKEMEN YARD FIREMEN UNSKILLED LABOR ||i^^ >«l l»| | t8«.09 l»5V. e i| **« «t leo.se unsL • 4«.0t 1S0.23 (47t» t49.00 *i»t»: SSS.if
  305. COMPOSITE CHARTS 365 PASSENGER CAPACITIES OF SURFACE STREETS 60 R.

    Poy»m»nf 3 Lonct EacK Direction No Pardinq AulomobiUl Only Auloi A But*> k Autos & Street Cort IN AUTOS IN AUTOS IN AUTOS IN BUSES IN STREET CARS COMPARATIVE PASSENGER CAPACITIES OF MAJOR TRANSIT AND TRAFFIC IMPROVEMENTS One express-local subway will carry 100,000 passengers per hour in one direction on two tracks. Twenty-one four-lane elevated highways would be required to carry the same load in autonnobiles. It everyone came to work by private automobile, each office building would need a garage of the same size for the storage of vehicles. Transit Journal, September 26, 1938, Part of an Editorial Entitled "Transit's Job Masses." Moving the SCALE .7 A Picture of the Transit Problem in the United States. 1. The first chart presents graphically passenger capacities of surface streets. 2. The second one gives comparative passenger capacities of major transit and traffic im- provements. 3. The third shows the amount of space that would be needed for garage if everyone came to work by private automobile.
  306. Ill "lll" III GRAPHIC PRESENTATION I 1899 1914 1925 1937

    * Electrical horsepower in factories Elrctriral World. Ortobrr 8. 1938 Part of an Editorial on PuMic Rrlations Entitled What Elcrtririty Mrant to Amrrira "' SCALE .6 A Comparison of the Status of Labor in the Electrical Industry and the Increased Production in That Industry in 1899. 1914. 1925, and 1937. 1. The implication of this chart is that with the increase in use of electrical horsepower in factories, average wages per hour go up and average hours per week go down. 2. Note that the two curves and the bars have a common zero line, but the scales arc different. I III I III I III
  307. Ill I III I III I 367 Chapter 44 SUGGESTIONS

    FOR MAKING A CHART I HE FIRST problem in producing a chart, assuming that the data have been gathered, is in the choice of materials to be used in drawing it. Often the materials at hand in the office or drafting room are sufficient. It is also possible to plan the produc- tion of a chart, basing all the plans on the materials at hand. PAPER The test for the selection of paper on which to draw is to try the drawing medium upon it; that is, the ink, pencil, paint, or crayon, and see the result. Cross section paper drawing materials may be secured from the following companies: SOURCES: Codex Book Co., Norwood, Massachusetts. Educational Exhibition Co.. Providence, Rhode Island. Rectangular Coordinate Graph Paper. 1. The number of lines drawn on graph paper and the spacing of the lines may quite often indicate the use to which the paper will be put. For that reason, a wide choice of printed graph paper is offered the draftsman. The use of printed graph paper saves time and is comparatively inexpensive. 2. One type of rectangular coordinate paper, called utility paper, is shown above. It has 52 spaces on the long edge to represent one year by weeks, or 4 years by months. The 36 spaces may be used to represent one month by days, 3 years by months, or one year by months taking every third space. 3. This paper is so spaced that it may be put in the typewriter and the lines of type will fit into the space; that is, on the standard typewriter there are six lines of type to the inch, and on this utility paper, there are six spaces to the inch. I III I I I III
  308. 368 GRAPHIC PRESENTATION Educational Exhibition Co., Providence, Rhode Island. Eugene

    Dietzgen Co.. New York City (and various other cities). Keuffel & Esser Co., New York City (and various other cities). Rubber cement is a "must" in the drafting room and copy room. It does not wrinkle paper and may be used for a temporary joining, as well as for a permanent one. Transparent materials may be used to great advantage in com- paring curves, bars, or other types of graphic charts. The charts are drawn directly on the transparent material. When placed over each other, a clear comparison is possible. SOURCES OF TRANSPARENT MATERIALS: Celluloid Corporation, Newark, New Jersey. E. I. Dupont De Nemours &> Company, New York City. Eastman Kodak Company, Rochester, New York. Monsanto Chemical Co., St. Louis, Missouri. Eugene Dietzgen Co., New York City. A. Ratio or Logarithmic Chart Paper. Logarithm ic paper is obtainable with the log scale in both horizontal and vertical rulings or with the log along only the ordinate. Log paper is obtainable in vari- ous sizes and with various cycles or decks. Kcuffcl & Esser Co.. New York City. SCALE .6 B. Percentage Protractor. The percentage protractor is of particular value to anyone making graphic charts, since it can be used in the construction and measurement of sector charts and similar graphs.
  309. SUGGESTIONS FOR MAKING A CHART 369 A. Triangles, T-Square, and

    French Curve. 1. The triangle on the left is 30 x 60 de- gree, while the one on the right is a 45 degree triangle. 2. French curves are available in a great many shapes and forms. The one shown here is one of the simplest. 3. These drawing instruments arc part of the equipment for a standard drawing board. Eugene Dietzgen Co., New York City. SCALE .5 Us (9)
  310. 370 I GRAPHIC PRESENTATION REFERENCES Arkin. Herbert and Raymond R.

    Colton. Graphs: How to Make and Use Them. Harper & Brothers. New York City, 1937. Brinton. Willard C. Graphic Methods for Presenting Facts, McGraw-Hill Book Co.. Inc.. New York City, 1914. Brown. Theodore H.. Richmond F. Bingham, and V. A. Tem- nomeroff. Laboratory Handbook of Statistical Methods, McGraw-Hill Book Co., Inc., New York City, 1931. Haskell. A. C, Graphic Charts in Business, Codex Book Co., Inc., Norwood, Mass., 1928. Karsten, Karl G., Cliarts and Graphs, Prentice-Hall, Inc., New York City, 1923. CRAYONS If you do not have crayons of the desired color on hand, try your nearest art dealer. If you are unable to secure the materials that you want there, write to the manufacturers. They will put you in touch with your nearest dealer. A wide variety is offered. There are colored pencils, wax crayons, pressed crayons, water crayons, etc. If when using a wax crayon, the color tends to smear, scrape the surface with a razor blade. The excess crayon is thus removed. Lumber crayons may be used for extremely heavy color work. Makers of crayons: American Crayon Co., Sandusky, Ohio, New York City. Art Crayon Co., Inc., Brooklyn, N. Y. Binney &" Smith Co., New York City. Joseph Dixon Crucible Co., Jersey City, N. J., New York City (and various other cities). Ea^le Pencil Company, Inc.. New York City Eberhard Faber Pencil Co.. Brooklyn. N. Y. Koh-I-Noor Pencil Co., New York City. E.-ii;lr Pencil Company. Inc . New York City Pencil Lengthener. 1. The pencil lengthener is used with a pencil stub. This makes it possible to use the entire pencil and yet not be uncomfortable while using the small length. 2. The pencil lengthener may also be fitted with a pencil which is made short especially for use in a lengthener. .ill , ill , ill
  311. Ill I ll" III SUGGESTIONS FOR MAKING A CHART 371

    Charirt M HigRins Ik Co . Inc . Brooklyn. N Y. SCALE 8 Inks for Drawing and Lettering. A good drawing ink should be smooth flowing and quick drying as well as permanent and waterproof. The stopper is usually equipped with a quill to be used in Tilling drawing and ruling pens. 2. 3. PASTED COLORED PAPERS The problem of putting color on a graphic chart is further sim- plified by the use of colored paper. 1. Plain colored paper may be pasted on with rubber cement. Colored paper with a gummed back may be obtained either in tape form or in sheets. Colored paper with a back which adheres to any clean, smooth surface and which requires no water may be obtained in a variety of widths and colors. Sources: Dennison Manufacturing Co., Framingham, Mass., New York City (and various other cities). Industrial Tape Corporation, New Brunswick, N. J. Minnesota Mining &' Manufacturing Co., Chicago, New York City (and various other cities). Poster Products, Inc., Chicago, New York City, Van Chef Bros., Chicago, New York City. .1. ..I. Ii.
  312. 372 GRAPHIC PRESENTATION ERASERS Erasers are necessary implements in the

    drafting room. They may be classified into the following types: 1. velvet —for erasing pencil 2. sandpaper —for erasing typewriter type 3. scrubbing —for erasing smudges, charcoal, pencil, etc. 4. roll-off —for cleaning up drawings 5. kneading erasers —for cleaning pencil, etc., from walls 6. ink erasers and ink eradicators 7. erasing machines Sources : Joseph Dixon Crucible Co., Jersey City, N. J. Eagle Pencil Company, Inc., New York City Eberhard Faber Pencil Co., Brooklyn, N. Y. Weldon Roberts Rubber Co., Newark, N. J., New York City Erasing Machines: Chicago Wheel & Manufacturing Co., Chicago. Charles W. Speidel &> Co., Philadelphia. Illllll No. 00 1 2 3 4 5 6 7N 8N 9 10 12 14 Kcuflrl S Esser Co . N<-w York City. Leroy Let+ering Pens and Width of Letters. While these pens are designed primarily for use with the scriber and lettering guide shown in 373 they may also be used for free-hand lettering and line drawing. A special socket which fits into an ordinary pen holder is necessary for this.
  313. SUGGESTIONS FOR MAKING A CHART 373 INK A good waterproof

    permanent ink is essential. Colored inks such as red and green are often standard equipment in an office. These may be used to color graphic charts and maps. See 371. If there is a choice of colored inks, the following order of choice is recommended: 1. black 2. carmine red or scarlet 3. green 4. blue 5. yellow 6. brown 7. orange I KeufTrl H Esscr Co.. New York City. Leroy Lettering Guide and Scriber. 1. This lettering guide is of three-ply construction, two white sections, with one blacic center section. The letters arc cut only in one white section, revealing the black one underneath. 2. There are two types of scribers: the adjustable one that produces both vertical and slanting letters, and the fixed scriber that produces vertical letters only.
  314. 374 "III-. -I|i GRAPHIC PRESENTATION •I' Wood Rrgan InsUumcnt Co..

    New York City. SCALE .6 A. Wrico Lettering Pen and Lettering Guide. 1. Tubular points on this pen prevent ink from getting on the edges of the openings of the guide. Steel needles regulate the flow of ink and prevent the points from becoming clogged with ink. 2. The under side of the guide is grooved so that ink will not be smeared when the guide is moved from one character to another. The guide is placed directly over the portion of the paper on which the lettering is to be done. Thro. Altcnrdrr Qi Sont. Philadelphia, Pa. B. Ruling Pen of the "Hinged" Type. 1. The hinge arrangement of this pen makes the pen easy to clean. Ruling pens are avail- able in a variety of sizes and shapes. This is the actual size of the pen. 2. The firm from whose catalogue this illustration was taken also handles a helpful device called a "Spacing Divider." This instrument consists of 11 teeth, numbered from to 10, and so designed that they always divide the extreme setting of the dividers into 10 equal parts. I III I III I III
  315. Ill I I" III SUGGESTIONS FOR MAKING A CHART I

    375 I Poster Products, Inc., Chicago, and Tablet Sl Ticket Co., Chicago. Cut-Out LeHers. 1. Another method of lettering a chart is to secure cut-out letters and (inures and then to put them on the chart. The letters come in a variety of styles and sizes and may be secured cither with a gummed back or a back wliich adheres to any clean smooth surface and which requires no water. The latter are both removable and reusable. 2. The letters "OSNX" are K^in^i^^<l-t'3<^l< a"d come in sizes from 'g to 2 inches in height (Tablet & Ticket Co.). The letters W2" require no water. A white backing protects the adhering surface and is stripped off just before using. These letters come in sizes 13 16 to 9 inches in height (Poster Products Inc ). 3. A third company making letters from 1 inch to 18 inches in height is The Rcdicut Letter Company, Los Angeles, California. I III I III I nil
  316. 376 GRAPHIC PRESENTATION lip PACRAtti or TYHE m^' ASSORTED FURNtTURt

    The Kclsey Company. Meriden, Conn. A. Small Portable Printing Press and Outfit. 1. The small press shown above prints a type space 6 x 10 inches. A downward pressure on the lever gives the impression. Ink is spread on the ink table, which may be removed for cleaning. From 600 to 2000 sheets may be run through per hour. 2. These small presses are available in a number of sizes. Pica— No. 1 (10) This is a sample of writing with No. 1 Pica type, the style most used for general correspondence. 123456789 10 Elite No. 6 (12 or 10 Special) ILITE. Is used largely for personal correspondence. Much matter in small space without crowded appearance. L. C. Smith Typewriter Co., New York City. B. Pica and Elite Typewriter Styles. 1. Graph paper may be inserted in the typewriter so that the lettering and numbering may be typed. A standard typewriter makes a legible chart. The most commonly used type styles are the pica and elite. 2. There are ten letters to the inch on the pica type and six lines of type to the inch. On the elite type there may be either twelve or ten letters to the inch. 3. A large variety of type styles are available on typewriters today. A new machine makes it possible to use several styles of type on the same typewriter. See 379.
  317. SUGGESTIONS FOR MAKING A CHART 377 OROrrH Of Trg ILfCTHIC

    LIOUT AHP rOfIR HCDUSTBT -- 190? TO 19^ y^wi or vuHT ahh ijuipmimt la MlUloQ. of Dollar. XliL 1937. . 1932. . 1927. . 1922. . 1917... 1912. . . 1907. . . 1902. . . Million' 3 T 5 5^ -2_I — "i 1 1 * «• 7 8 9 10 11 13 Ik TTTTlTm umim ummi nmuE r mnuR nmmLUR ummni zzzz zzzz zzzz zzzz zzzz zzzz zzzz zzzz zzzz ZZZZ2ZZZ zzzz B mLUR zzzz zzzz zzzz mLTULUR TnLmLnminL JUL TEL TEL mi TRL m JUL zza XttL 1937... 1932. •• 1927. . . 1922. . . 1917... 1912. . . 1907. . . 1902. . . anRQT agyiRATiD—BUUOMs or tiLowArr-HOUHg B 1 1 1 i a t of k 1 1 w a t t - h tt r « 10 20 30 50 50 50 fo 10 fO 100 110 120 77777 ZZZZZ ZZZZIZZZZZ ZZZZZ ZZZZZ 7773 H jmLmmmmmR ma mmmiL mR zzzffizzzzLznzz ZZZZZ ZZZZLZZZZL ZZ3 ZZZZL ZZZZZ ZZZZZ 77777 mmmmwu ma mR mR ZZZZZ ZZ3 Rmmmm I International Business Machinrs Corp , Nrw York City. SCALE .7 Two Bar Charfs Made on a Typewriter. 1. For the employee in a business office, lacking the tools and the skill in drawing and lettering of a draftsman, the typewriter offers an opportunity for quick and easy preparation of graphic presentation of data through charts and diagrams. It solves the problem of lettering and asures that vertical and horizontal lines will be at right angles without the use of a drawing board and T-square. 2. Making bar charts is a simple process. By letting one space on the machine represent a unit quantity, the character selected for a given bar can be struck the correct number of times to represent any specified amount. There are several characters which when written so that one row exactly touches the next one will make a very attractive "all over" pattern.
  318. 378 I' •! GRAPHIC PRESENTATION DisT«noTio>r OF ncH dolus LXSS

    COST or MATPI AU) International Businrss Machines Corp., New York City. SCALE .5 A Sector Chart Made on a Typewriter. A sector chart can be made quickly -and easily on a typewriter by the following method: 1. Draw the circle of convenient size with any ordinary school compass. 2. Indicate the division of the circle into its parts by a protractor and draw the dividing lines in ink. 3. Type in the names of the sectors. 4. With the compass set as it was to draw the original circle, draw another circle exactly like it on a sheet of thin typewriter second paper. By running the sharp point of the compass around the circle several times on the thin paper, the circle will drop out and leave a hole in the second sheet. 5. Place the copy in the machine with the second sheet over it so that all of the copy excepting the circle itself is covered. 6. Roll the copy up in the machine and place a strip of second sheet along one of the dividing lines and another strip along the adjacent dividing line. The two strips of paper will cross at the center of the circle and will cover all of th* circle but one sector. 7. Beginning at the bottom of the exposed sector, make rows of the desired character to make the "all over" pattern for that sector, allowing the rows to extend beyond the edge of the sector a few spaces. The excess typing will fall on the second sheets and a very sharp edge of the pattern will appear on the copy. Adjust the strips of paper each time to expose one sector and fill in each sector, running the pattern carefully around the lettering. 8. It takes as long to describe it as it does to do it. I III I III
  319. I III-- -ll- -III SUGGESTIONS FOR MAKING A CHART 379

    I The Varl- Typer Electric Composing Machine Is •*nuf *c tured by the Ralph C. Coxhead Corporation, with their main office at 17 Park Place, Mev Tork City, II . T. Vari-Typer, an Electric Typewriter with Interchangeable Type The Vari-Typer Electric Composing Machine is used to "cut" stencils and to compose the master copy for reproduction by Photo—Offset . The machine features Interchangeable Type, Horizontal Spacing Control, Vertical Spacing Control, Uniform Impression Control, Bold Face Repeat Key, Margin Justification Mechanism, Open End Carriage, Standard Keyboard and Shadow Light. The machine is simple to operate. The above was typed on the Vari-Typer. I III I III I III
  320. 380 GRAPHIC PRESENTATION GRAPHIC GRAPHIC GRAPHIC GRAPHIC GRAPHIC GRAPHIC RAfHllG

    MiPiHin© Martin J Weber, New York City. Photographic Method of Securing Various Types of Lettering Effects. 1. All the above letter eFfects were made photo-mechanically by a special device on a camera from the same original line. The original is the top line of the left column. 2. The letters can be made to slant either to the right or left. 3. In addition to altering the letter effects, this process invented by Martin J. Weber, New York artist, will produce variations of the original which will register perfectly with that original for color registration work. Green and red as favorable and unfavorable originated with rail- road signals which were based upon the idea of red for danger and green for safety. Today, red and green are used in traffic signals for stop-and-go. When there is to be a gradation from dense to least dense there is a question as to how the gradations should be crosshatched. Generally, black represents the unfavorable and white the favor- able. Since the question is one of interpretation, the decision should be made relative to the particular problem.
  321. 381 Chapter 45 STANDARDS FOR TIME SERIES CHARTS on the

    following pages are abstracts from Time Series Charts. A Manual of Design and Construction, 1938, prepared by the Com- mittee on Standards for Graphic Presentation under the pro- cedure of the American Standards Association, with the American Society of Mechanical Engineers as sponsor body. Other abstracts from this report will be found in the following chapters: Chapter 12. MULTIPLE BAR CHARTS Chapter 13. CONTRASTING BAR CHARTS Chapter 33. CURVE CHARTS Chapter 34. COMPARISONS WITH TWO CURVES Chapter 36. COMPONENT PARTS SHOWN BY CURVES Chapter 42. RATIO CHARTS Chapter 51. METHODS OF PRINTING The pamphlet number of this report is ASA Z15.2 — 1938. It may be secured for $1.25 from the Publications Department of the American Society of Mechanical Engineers, 29 West 39th Street, New York City. The Committee on Preferred Practice for Time Series Charts, with Arthur H. Richardson as Chairman, prepared the report Time Series Charts. It is a subcommittee of the Committee on Stand- ards for Graphic Presentation. Within the next year, it is expected there will be a report by the subcommittee on Engineering and Scientific Graphs, of which W. A. Shewhart is Chairman.
  322. 382 GRAPHIC PRESENTATION DESIGNATION OF CHART COMPONENTS GENERAL NOTE REFERENCE

    SYMBOL HORIZONTAL RULINGS LABELS (curve captions) AMOUNT- SCALE NUMERALS AMOUNT- SCALE PTION /Vye of Paper REFERENCE NOTE BASE LINE (ZERO LINE) TIME DESIGNATIONS The arrow and designation "Edge of Paper" have been added to the original in order to indicate that the outside hne is not a frame. The author beheves it is undesirable to put a frame hne around a chart because of the possibihty of that hne being falsely interpreted as a zero line.
  323. STANDARDS FOR TIME SERIES CHARTS 383 GRIDS Grid Structure ploys

    a controlling port in interpreting the facts. However, grid specifications should seldom if ever be determined without tokmg the scales into consideration. In the matter of influencing the behavior of the curve, the two are of equal importance. The proper construction of a grid involves more than sim- ply covering a convenient space with cross rulings. As in the matter of general layout, the nature of the doto ond purpose of the presentation must be considered. A grid un- suifed to the doto moy be not only lacking in effectiveness but may actually be misleading. GRID DIMENSIONS 1 . Grids should be so proportioned as not to distort the facts. 2. Grid proportions should not be rigidly standardized. 3. Grids should be of pleasing proportions. FREQUENCY Of VERTICAL RULINGS 1. The number of rulings should be sufficient to indicate the frequency of plotting. 2. There should be a sufficient number of rulings to facilitate the read- ing of time values on the horizontal time-scole. WEIGHT OF VERTICAL RULINGS 1. Vertical rulings should be of sufficient weight to guide the eye readily to the time-scale designations. 2. The weight of vertical rulings should be varied so as to indicate clearly the nature of the time intervals or the subdivisions of time for which data ore shown. FREQUENCY OF HORIZONTAL RUUNGS 1. Horizontal rulings should be so drawn as to meet the requirements of their two-fold purpose: To assist in reading values on the vertical scale and to provide a series of horizontal bases of comparison 2. The number of horizontol rulings should vary according to the close- ness with which it is desired to read values of the vertical scale. Rulings should not be so frequent as to imply a greater accuracy of the data than actually exists. 3. In general, there should be no more rulings than ore necessary to guide the eye to on approximate reading of the curve values. WEIGHT OF HORIZONTAL RULINGS 1. Horizontal rulings should be sufficiently heavy to guide the eye to the amount scale without conscious effort. 2. Horizontal rulings should be heovy enough to serve os supplemen- tary "boses" of comparison for the curves. 3. Horizontal rulings should be light enough to contrast sharply with the curves. F«w plotting* Many plottings Emphasis on chonge I Indkotlng omUsion of rulings Infrequent rulings generally desiroble
  324. STANDARDS FOR TIME SERIES CHARTS 385 IMPORTANCE OF PROPER SCALE

    SELECTION EFrECT OF SCALE ALTERATION - CHART SHOWING MOVEMENT OAiCINAL SCALC ARnANCCUCNT *
  325. 386 GRAPHIC PRESENTATION RELATION OF TIME SCALE TO AMOUNT SCALE

    1. The relofion between the time scale and the amount scale has a de- termining influence on the movement of time-series curves. Note: The movement of o curve ij here understood to meon the o'opf^ic effect of the progressive chonges in the quantity considered The trend is the graphic effect of the overoil changes in the quontity considered 2. Selection of both scales should be made to convey the correct im- pression of the trend and movement of the series. 3. Manipulating the scales so as to picture a movement contrary to the facts is never justiPied. True picture .L Distortion fMultino from oinitslon of zero value 20
  326. STANDARDS FOR TIME SERIES CHARTS 387 RANGE AND SPACING OF

    AMOUNT SCALE Principl*! 1. Since the omount scole has a controlling effect on the movement oi the curves it is highly important that a scale be selected which will result in a true picture of the facts. 2. The amount scale should be divided in a manner that will facilitate accurote reading of the curve values. Procedures 1. FULL RANGE DESII^ABLE. Generally the amount scale should begin at zero. It should extend continuously to a point somewhat beyond the greatest value, to avoid crowding the grid. In cases of marked upward trends, curves generally should not point obove the upper right-hond corner of the grid. 2. AVOID WASTE SPACE Unnecessary extension of the scale range should be avoided if blank space which serves no useful purpose is thus added. Noie Eoendino 't<e scole range reduces the fluciuotion and separation of Curves When this is desirable it mov be belter accomplished by reducing the Koie dimensions i( the resulting chorl con still be made ol the desired pro- portions. 3. "FREAK" VALUES. Where a series contains a few widely divergent points lunless they ore really significant) it is often better not to attempt to select a scale that will include them all. Inclusion of these points will tend to depress the fluctuations of the rest of the curve. 4. DIVISION OF SCALE. It is desirable to select a scale range that is divisible into convenient scale intervals. lal For reading SCALE VALUES it is generally well to subdivide the scale into intervals that are familiar and easy to visualize leg., 5, 10, 15, 20). (bl For reading CURVE VALUES for purposes of interpolation or read- ing between the main points on the scale, it may be desirable to divide the scale into even units rather than odd, as the eye can more readily divide the space into even ports than into odd. 5. "BREAKING" AMOUNT SCALE. Although the amount scale should generally be continuous, it is sometimes permissible to omit on inter- mediate portion 111 when the curves on the grid ore widely seporoted and it is desired to compare them more closely, or (2| to magnify the fluctuations of the different curves which may be widely separated on the amount scale. 6. INDICATING BROKEN SCALE. When there is any break in the amount scale or any intermediate portion is omitted, the fact should be clearly indicated by some accepted convention. 7. SPACING BROKEN SCALE When the amount scale is broken, spac- ing in both resulting portions of the scale should remain identical. Ploclng the curve Method of showing "freok" values I Division of amount scale ^H Breaking amount scale (Se« procedures 6 and 7)
  327. GRAPHIC PRESENTATION LOCATION OF AMOUNT-SCALE DESIGNATIONS Principle 1. Amouni-scole designations

    iiiould be ploced where they con be read most easily in coniunction with the curves. Procedures 1. AT BOTH SIDES: In general la) To provide for any reading requirement. (b) To give balance to the chart. Especially Ic) When the grid is extremely wide. Idl When the horizontal rulings are dose together. 2. AT RIGHT SIDE OF GRID ONLY: lal When interest is definitely centered of the right, (bl When a noturol reading of the chart requires reading the curve before the scale. Noie The theory of plocing 'he scole oi the right is ihoi o oerson will normolly read the chort trom let' to right (thoi is. from the curve to the scole ro'her thon (rcn 'he scole lo the cu'vel. 3. AT LEFT SIDE OF GRID ONLY: lal When interest is definitely centered at the left. jbl When interpretation of the chart requires reading the scale before the curve. 4. NEITHER SIDE It is sometimes feasible to place amount designations adiacent to the plotted values on the curve. iThis treatment is most effective when grid Imes ore omitted, and is especially suited to charts for popular appeal ) AMOUNT-SCALE NUMERALS 1. Amount-scale numerals should be so written and placed that they will clearly and easily indicate the value of the horizontal rulings. Scales both sides o*rierolly recommended (See proceduie 1 1 Interest ot right Interest at left
  328. STANDARDS FOR TIME SERIES CHARTS 389 AMOUNT SCALE CAPTIONS 1.

    A scale caption should always accompany the amounl-scole numerals unless the character of the scale units is otherwise indicated. 2. Amount-scale captions should be located where they will most effec- tively mdicate the units of value. TONS 400 I. I.. CopMon above numerali Caption at the tide »io RANGE AND SPACING OF TIME SCALE 1. The time scale should correspond to the characteristics of the data both in regard to the span of time covered and the frequency with which values ore recorded. $e — Caption combined with numerals I RELATION OF TIME SCALE TO VERTICAL RULINGS AND PLOHED POINTS Note: Time icale^ consist of a series of successive equally spaced points of time Idates. time of doy, etc.) ; the intervals between such points representing periods of time. "f^INT DATA" are values in a time series as of specific points of lime "PERIOD DATA" ore volues in o time series for periods of time. 1. IN THEORY, vertical rulings should always indicate specific points of time on the time scale. |a| Point data should be plotted on such point-of-time rulings, lb) Period data should be plotted midway between point-of-time rulings. 2. IN ACTUAL PRACTICE, however, this principle may often be disre- garded in showing period data. 1 1
  329. GRAPHIC PRESENTATION LOCATION OF TIME-SCALE DESIGNATIONS Principle 1. Time-scale designations

    should be placed where they con be read most easily in conjunction with the curves. Procedures 1. USUALLY AT BOnOM OF GRID BECAUSE: lol The bottom o( the chart is the conventional location. (b) The base line is ordinarily the principal line oi relerence to which the eye travels lor a basis of comparison. |cl In many coses, the curve starts near the bottom of the grid, eg., growth curves starting near the base line. (dl The scale designations at the bottom odd to the appearance of the chart in balancing the weight ol the composition. 2. SOMETIMES AT TOP AND BOHOM— (al When the grid is unusually high. (bl When the vertical rulings are so numerous as to cause difficulty in following them to the scole at the bottpm. Icl When a considerable portion of the curve lies near the top of the grid. 3. AT TOP ONLY, IN SPECIAL CASES— la) When it is desired to emphasize the time periods in conjunction with the title, lb) When the space at the bottom is insufficient. |c) When the principal line of reference lies near the top of the grid. 4. WITHIN THE GRID. In very simple charts it is sometimes effective- to place time designations within the grid directly under or over the plotted points. (This treofment is well suited to advertising or publicity charts, especially when the curve is shown without grid lines.) 1932 1933 1934 1935 1936 1925 1926 1927 1928 1929 Usual location of time-scale designation 1936 Procedure for unusual coses
  330. STANDARDS FOR TIME SERIES CHARTS 391 ARRANGEMENT OF TIME-SCAIE DESIGNATIONS

    l»2S l»M IMT ins l«2« WM It3l W33 Arrong«menl for yoort 1930 1931 1932 1933 1934 1935 Arrongemenl for quarters Principle I. Time-scale designations should be so arranged as to focilitote the reading of time values lor all plotted points on the curves. Procedures 1. DESIGNATION FOR EACH RULING. A time designation should normally accompany each vertical ruling. 2. OMISSION OF DESIGNATIONS. When vertical rulings ore so numerous that designations cannot be shown in legible size lor each ruling, it is well to omit some of them; e.g., every other ruling. 3. PLACING. Time designations should be centered under the vertical grid rulings or spaces to which they relate. 4. READING POSITION: la) Designations should, if possible, read horizontally. (b| When there is insuFTicienf space to place time designations in a horizontol position, it is generally desirable to place them in a vertical position reading upward. Note In some cases where it is important to retain horizontal reading it is possible to "stogoer" captions. 5. SUBDIVIDED TIME PERIODS. When major divisions on the time scale ore divided into minor divisions, it is normally desirable to indicate both, by means of primary and secondary scale designations. Major divisions should be indicated by captions placed under the minor designations to which they apply. Note: Dropping secondory designations As a means of retaining hori- zontal reading, designations for minor time divisions con often be dropped entirely where interest lies in the general trend rather than in specific points on the curve, eg, for time series plotted weekly it is often sotisfactory to show only monthly captions under the weekly rulings. iSee illustration at the right I 6. DESIGNATION FOR EACH PLOHING. For series containing irregu- lar time intervals, it is sometimes effective to designate on the time scale only those points for which there ore plotted values. 7. TIME-SCALE CAPTIONS. If necessary to on understanding of time . Arrongemenl for weeks . . .. I J • . •• L ij u I _i (Oindicotes beginning ond end ot characteristics of a series, a descriptive caption should be placed ^ montt»i) below the time designation; e.g., "end of each month." 1933 1934 Arrongemenl for monlhi JAN ^ r(B t^AII API! UAV .lUN
  331. 392 GRAPHIC PRESENTATION ABBREVIATION OF TIME-SCALE DESIGNATIONS SUN MON TUE

    WED THU FRI SAT Abbreviations for days of the week JAN FEB MAR APR MAY JUN JUL AUG SEP OCT NOV DEC Abbreviations for months of the year I I I I I I Principles 1. It is desirable to abbreviate time designations whenever the complete designations v^ould be too crowded or require o size of lettering too small to be legible. 2. Only stondord or recognized obbreviations should be used. Procedures 1. IN GENERAL, time-scale designations should not be abbreviated until the possibilities of other methods have been considered Isuch as stag- gering or placing verticollyl. 2. DAYS. The days of the week should conform to the usual method of abbreviation except that Tuesday and Thursday should generally be written '"Tue" and "Thu" in order that all may be of equal length and emphasis. 3. MONTHS. Months also should generally conform to three-letter ab- breviations in order that all months may be of equal length. Note: If it is importoni to retain horizontal reodino but sufTicient space lor stondord obbreviolion is not ovoiloble, the initio! letters of the month con sometimes be used: JfMAMJJASOND. This form is not recommended for generol use. Another oliernolive sometimes used to retain horizontal reading is to indicate months by numerals: I 2 3 4 5 6 7 8 9 10 11 12. This is not oen- eroMy recommended becouse many people do not readily associate month numbers with month names. 4. QUARTERS. Designation of quarters can be 1, 2, 3, 4, or 1st, 2nd, 3rd, 4th, with the word "quarter" below, or, if space permits, first quailer, second quarter, etc. 5. YEARS. Where possible, years should be written out in full, whether horizontal or vertical, but if abbreviated, should be shown as — '28, "29, '30, etc. When abbreviations are used, it is well to have some of the years written out, as follows: 1920 '21 '22 '23 '24 1925 '26 '27 '28 '29 1930 1925*26 "27 •28 '29 1930 "31 Abbreviated yeorly designoilont
  332. STANDARDS FOR TIME SERIES CHARTS 393 CURVE WEIGHT Noi*^ Proctlcet

    rec6mm«nd*d In Ihli tecllon apply primarily to lolld lin* curvai. Principlet 1. Corves should be sufficiently heavy to attract immediate attention and to impress a visual image on the mind of the reader. 2. In general, time-series curves should be heavier than is the practice in the case of engineering and scientific charts. Procedures 1. RELATION TO WEIGHT OF RULINGS. Curves should be sufficiently heavy to be distinguished readily from the co-ordinate rulings. 2. RELATION TO WEIGHT OF REFERENCE LINES. Single curves should normally be heavier than the zero line or other principal line of refer- ence. Multiple curves should normolly be no lighter than reference lines. 3. RELATION TO NUMBER OF CURVES. Curves usually should be heov- ier when shown singly than when several are shown together Iper- haps decreasing % for each additional curvel. 4. RELATION TO CHARACTER OF CURVES. Irregular curves should nor- mally be lighter than relotively smooth ones (the greater the irregu- larity the lighter the curvel. 5. RELATION TO OTHER COMPONENTS. Curves should not be so heovy as to appear crude or to overpower the other elements of the chort. 6. GENERAL PICTURE vs. CLOSE READING. The weight of curves should vary according to the use —from relatively heavy lines in charts for popular appeal to very light lines in charts used for close reading of values. 7. VARIATION OF WEIGHTS on the same chart: la) To distinguish one curve from another. (b) To indicate the relotive importance of curves. 8. OVERLAPPING CURVES. The more curves intersect or overlap on the same grid, the greater should be the contrast in weight las well os pattern). Curve 5 limes Curve 2 to 3 times grid rulings grid rulings I
  333. 394 GRAPHIC PRESENTATION LABELS 1 . labels should be brief.

    2. Labels should be of sufficient size to be easily read. 3. Labels should be placed where they will clearly identify the curves to which each relates. 4. Labels should be so placed as to assist in effecting a balanced com- position.
  334. STANDARDS FOR TIME SERIES CHARTS 395 RELATION OF CURVE TO

    PIOHED POINTS Not* Quesiions on this subieci arise mainly in coses of very heavy curves where the difference >n volues of the upper and lower sides of the curves ore sufTiciently Qreat to give sionificanl differences of interpretation. Where extreme occurocy is required heovy or wide curves should not be employed. 1. Curves should be so drown as to depict accurately the trends and relative values of the plotted points. 2. A uniform procedure should be followed in locating the curves in relation to the plotted points. MCOUUINOCO
  335. 397 E Lcitr, Inc . Nfw York. A. Leica Camera.

    Cnniliil Cnnirra Corp ol Amrrica, Chicngo. III. B. Perfex 44. Chapter 46 Carl Zciii, Inr . New York, C. Contax Camera. THE CAMERA AND ITS USE REPORTS, publicity, etc., now consist largely of photographs and graphic charts. A camera is a necessity and some knowl- edge of photographic possibilities imperative. For the inexperienced, a reflex such as E, below, showing a full size image in the focusing finder, is desirable. Imported miniature cameras like A and C above, of high quality, have interchangeable lenses and attachments covering the whole photographic field —if expertly handled. American miniatures are cheaper but only the Perfex 44, B above, approaches the Europeans in quality and flexi- bility. For contact prints cameras of the Speed Graphic or Linhof type, D and F below, are widely used by reporters and professional pho- tographers. Made in several sizes, they use film pack, cut film or plates, and can be fitted with lenses of different focal lengths. Folmer Graflrz Corp. Rochritrr. N Y D. The Speec Graphic. Burleigh Brooks. Inc. New York, N. Y E. The Rolleiflex. F. The Linhof.
  336. 398 Dcvin Coloruraph Co., New York. N. Y. Thomas S

    Curtis Lab . HuntinRton Park, Cal. B. The Curtis Color Scout. A. Devin Tricolor Camera. OPTICAL SYSTEM OF DEVIN TRICOLOR CAMERA A portion o* iho Ughl possmo I'lrough itip lens is retlecled by iho Iranspoieni pellicle minor lAI lo blut> Tliei Ibl. All colors e«- (epting blue ore Tillered oui and Ihis blue light posst-s on lo opusu a pluio ICI. thus (orming the blue record The light romommg ofter passing through the Tirst mirror is ogain reflecti-d bv tie second minor 101 lo the red filler (El, thence lo the plata IFI, to form the 'red record ' Tho residual light posses lo the rear of Iho comervi. iind through tiie ore» n hlter iGi lo lonii Iho greon record ' at IMI Tricolor cameras come «n and makes. TWO METHODS of color photography are in general use. One requires a tricolor camera. A and B above, making simulta- neously by one exposure three separate negatives on panchromatic plates, using color filters and mirrors. Process plates are prepared from these for three-color halftone or offset printing, or one of the photographic color printing processes such as Carbro or Wash-Off Relief. The other method uses color film or plates in an ordinary camera. Kodachrome and Dufay film. Lumiere and Finlay plates are examples. When developed they show the image as a color transparency which must be viewed by transmitted light, directly or by projection. For printing, three-color separation negatives are made from them by contact or enlargement. The Kodak exhibi-
  337. 'HE CAMERA AND ITS USE 39 tion at the New

    York World's Fair, 1939, shows Kodaclirome 35mm. film l" x 1^4" projected to 17' x 22' with perfect color ren- dering, clear definition, no grain, and a remarkable three dimen- sional effect. It is obtainable in 35mm. rolls and several sizes of cut film. Development at the Eastman plant in Rochester, New York, is included in the price. "Dufay color film, in both roll and cut film types may be used with almost any camera and developed anywhere. Lumiere and Finlay plates are used chiefly in lantern slide size or larger and are not difficult to develop. Films and plates for black and white photography are too nu- merous and varied to mention. The manufacturer or an experi- enced photographer should be consulted as to the one best suited to your work. . • 3.Smm. Kodachrome him is also developed at Kodak, Ltd., Wealdstone. Middlesex, England: Akt. Fabrik, Friedrirhshapener Strasse 9. Kopenick, Germany; Kodak- Pathe, S.A.F., Avenue Victor Hugo, Sevran, France. A. How Various Lenses Are Con- structed and the Approximate Speeds That Result. 1. It is easy to see why the price in- creases with the speed. 2. The illustration does not indicate the greater size of a fast lens, but it does suggest the added weight. Eastman Kodak Co., Rocheiter. N. Y. The lens is the camera. In choosing a lens, sharp definition and good color correction are important. High speed is of value for only a few special uses. A set of lenses with different focal lengths is most advantageous. Portable dark rooms, daylight loading developing tanks, and compact and efficient enlargers make it possible to do most photo- graphic work in a drafting room or store room boasting hot and cold water. Opaque curtains or a wall board screen may be drawn when necessary to exclude light. Portable equipment appears in 400A.
  338. 400 GRAPHIC PRESENTATION ^^^JE^ I —Vorking lopa Urge eooH^ to

    t*ke four (4) tUndard traft. 2 —Sptec for Irimmer, blotun, tquMigM pUlM, etc. J —Four (4) driwrn for paper*, filnu, Degttive*. etc. 4 —Foldind doora 6tled with lock and key. S —Section for storage bottle*, chemicala, meaauring glaaa, etc. 6 —S«fivcl caatorv. G Grniicrt. New York. N Y. A. Portable Darkroom. USING a variety of photo- graphic techniques will add interest to a record or re- port. Photomontage, as seen in 401 A, effectively presents much information in a small space by combining several negatives or parts of negatives in one print. Photomosaic is somewhat similar but combines several prints or portions of prints, drawings, etc., by cut- ting and pasting, using either photographic or other back- grounds. Lines may be thickened as in 40 IB. Figures, lettering, models, etc., may be made to look taller or wider by photographic methods. Shading, bas-relief, etc., may be added photographically in copy- ing quite simple designs as indicated in 380. Distortion can be prac- ticed in photographic cartoons. Pagano, Inc., Ray Albert, and Martin J. Weber, all of New York, N. Y., specialize in this work. A photograph of present conditions may be strikingly contrasted with a drawing of future plans or possibilities as in 402A and 402B, or a drawing made on the actual photograph of existing conditions may indicate the effect of suggested changes as shown in 404A and 404B. Simmon Bros.. Long Island City, N. Y. B. Omega Enlarger.
  339. THE CAMERA AND ITS USE 401 Analyzing the Facts Walter

    P. Burn Ai Aisociatet, New York, N. Y. A. Photomontage — "Analyzing the Facts." Martin J Wcbrr. New York. N Y B. Lines Thickened by Photographic Reproduction. This method is valuable in reproduc- ing charts in which the lines are too fine as originally drawn. LARGE collections of charts, maps, plans, etc., may be photographed on 35mm. film in either black and white or full color and stored in a small space. All government census records are being reduced to this form. Rare and valuable original documents, prints, maps, etc., in private or public collections may be copied and recorded in this way at small expense and with great accu- racy. Ancient documents copied on infra-red film are often more legible than the original.
  340. 402 GRAPHIC PRESENTATION From o BoDklrt o( thr Civic Crntrr

    Union Station Coniinittrc of Los Ant;rlrs. Califurnia, I') .17 A. Panorama Made from Three Separate Photographs Taken from One Location, New Union Railroad Station, Los Angeles. From a Booklet of the Civic Ccntrr Union Station Committee of Lo» Angclej, California, 1Q3 7. B. Architectural Perspective Drawing Accurately Representing the View That Buildings in A Above Should Be Removed and Minimum of Landscaping 1. The method of using three photographs as in A is one that can be applied anywhere 2. Though the Civic Center Buildings were mostly completed, an oblique aerial photo- majestic buildings so well as the perspective drawing looking upward rather than
  341. Kf: '^':f^i'i^. THE CAMERA AND ITS USE 403 Will.ird C

    Bnriton ContullmR EiiKinrrr Showing Buildings Blotting Out the Civic Center When Viewed fronn Site of I Willard C Brinton, Coniulting Enginrrr. RrndcrifiK hy Aintm Wiltlr^py, Anhitrrt P.ts.nlrn.i C.tl. Could Be Had from the New Union Railroad Station of Los Angeles if Added. without special eq-jipment. The street, really straight, appears to be elbowed, graph could not have illustrated the possibilities for an impressive vista toward downward.
  342. 404 GRAPHIC PRESENTATION New York Cily Tunnel Authority. A. New

    York City from the Bay, Governors Island on the left. New York City Tunnel Authority. B. The Same View as Above with Superimposed Sketch Showing Proposed Bridge from New York to Brooklyn as It Would Appear, Cutting Off Most of the View of Lower New York as Seen from the Bay. 1. This is a somewhat different technique from that shown in 402A and 402B. 2. The possibility of exaggeration is always present in the use of this and similar tech- niques. REFERENCES Eastman Kodak Co., Rochester, N. Y. How to Make Good Pic- tures. Clear and concise. Morgan and Lester, The Leica Manual. Wide technical and sci- entific field. Scacheri, Mario and Mabel, The Fun of Photography. The best yet.
  343. Chapter 47 LANTERN SUDES 405 B. Kodaslide Ready - Mount

    for Ready-Mount Changer. Red bordered side faces screen wl>cn in projector. Eattman Kodak Co.. Rochcitrr. N Y. A. Kodaslide Projector With Ready-Mount Changer in Place. I C. Kodaslide Ready - Mount Metal Franne for Use Other Projectors. n this movie-minded world, photographic projection shows constant improvement in materials and methods. The rapid rise of color film for both moving pictures and lantern slides has brought projectors such as the Kodaslide in A above and the Spencer Delineascope in D below, with lenses and illumination corrected for accurate rendering of color. Sev- eral of the less expensive models give good results with audiences up to two hundred while the 750-watt Leica and Spencer machines are effective for two thousand. The Spencer is equipped to handle all sizes of slides. ^ . , Li ghtness and conveni- ence is push- ing the 2" X 2" slide ahead of the 3i>4"x4" D. Spencer Auditorium Color Slide Delineascope — 750 Watts. Equipped to use any sue slide. ] 4i% Sprnccr I"" r^ B- ff .1 N V
  344. GRAPHIC PRESENTATION A. The Selectroslide. 1. Holds 48 Klass-mounted 2"

    x 2" slides. 2. May be operated by remote control. J. Can be equipped for continuous automatic operation. Sptndlcr fli Sauppe, Inc., San Francitco. Cal. Standard American lantern slide and the 3%" x 3%" used in Europe, Lightest of all is the cardboard Ready-Mount shown in 405 B, now included in the development charge for Kodachrome film. Fifty of these in the Kodaslide Changer in 4 0.S A are moved into posi- tion by working a small plunger. Glass-covered slides are mounted B. 800 Foot Con+inuous Projection nnent for Film. Attach- 1 6 mm. t .It I i( II 1 w <, I / r 1 1 I < c tors . itli. I \<. i!h or witliiiut With sound runs 22 niin. without I cpt'.itin^; Sil>nt pKSMitat ii-'n l.')sts J,i mjn. Bell & Howrll, ChicaKO. Ill with tape or metal bindings. Projectors similar to the Selectro- slide in A above require a glass-covered slide or one with a metal frame. The recognized value of moving pictures and lantern slides for the effective presentation of facts and ideas has recently produced several easily operated machines for projection by remote control or continuous automatic action. Some of these are illustrated — the Selectroslide in A above, the Kodaslide in 405A, the Bell 8g Howell automatic machines in B and C, and the Contimovie in 407A. For advertising, exhibitions, and educational work some equipment of this type is almost a necessity. Bell (k Howell. ChifttKo. Ill C. 600 Foot Continuous Projection Attachment in Sound-Proof Case with Shadow Box and Screen in Place. .1.
  345. LANTERN SLIDES 407 Sources of Screens Da- Lite Screen Company,

    Chicago, Illinois. Motion Picture Screen &> Accessories, Inc., New York City. (See C below) Raven Screen Corporation, New York City. Sasco Photo Products, Los Angeles, California. (See B below) Eighteen Kodachrome films in Ready-Mounts 2" x 2" cost $2.2 5, about 14 cents each if there are no failures. Glass-covered black and white slides of the same size may be made for about the same price. Some other types and larger sizes are higher. It is as easy now to use color as black and white, but the slides are not so dura- ble. Heat and concentrated light affect color, especially the yel- lows, though the dyes are improving in this respect. A. The Contlmovie. 1. Can fic ust(! w.ith any pf<)jti"ti>r uith or \».ith- out Sound 2 16 mm. SOti-.^OOO fet-t. 35 mm. SOO-.iOOO (cet. 3. iOOO f( < » \t\ mm. runs for Hilt hour without rt ptdtion. Conlimovir Salrs Co . New York ^^^^"TT^ I i. L ^ 5^^ Satco Pholo Product! Lo« Angrlrt Cal B. The Sanders Screen. 28 X 42 . - 28 X 50 Motiun Picturr Scrcrn fii Arrr»- »oric4 Co . Inc . New York. C. Britelite - Truvislon Crysta I Beaded Screen. 30 X 40 and other sizes.
  346. 408 GRAPHIC PRESENTATION "Engineering and Scientific Charts for Lantern Slidet,"

    Prepared by Sulicommittee of Com- mittee on Standards for Graphic Presentation. Sponsored by The American Society of Mechan- ical Engineers, New York City. 1932. Desig- nation Size of Letters Sample Letters Approx. Height, inches HI ABCDE 175 H-2 ABCDE 0.140 H-3 ABCDE Same Source as A Above. 0.120 B. Key to Letfering for Lantern Slides. Valuable slides may be damaged if left on the screen too long. The Lynhoff Laboratories, Roches- ter, N. Y., makes a heat-re- flecting glass, either clear or diffusing, which may be placed between the slide and the light source in the projector. As a further precaution, irreplace- able slides may be copied in full color at no great expense and with satisfactory results. Cardboard Ready-Mount Ko- dachrome slides are light and thin. They may be filed 19 to the inch, and are easily packed for mailing. The boxes in which they are returned, 18 to the box, fit well in a 3" x 5" card index file. A. Chart Reduced to Lantern Slide Size. 1. The original chart wat 6f^" x 9" in- cluding margins. 2. The cut from which this illustration was taken was standard lantern slide size 3Vi" x 4", one-third re- duction. The illustration above was reduced Va from that to about the 2" X 2" slide size. 3. Directions on the right of the illus- tration refer to the dimensions of the original drawing. Line Width of Letters Approx. Desig- Width, nation Sample Line inches W-1 iV-2 W-2 0.025 0.017 0.017
  347. LANTERN SLIDES Science Service, Inc., Washington. D. C. Microfilm Reader.

    photo- Reading by projection is of increasing importance in the larger public libraries, universi- ties, scientific institutions, and business organizations where research is carried on. A typi- cal machine for this purpose is illustrated at the left. Through the cooperation of the more important libraries throughout the world, immense resources are rapidly being made available to the research worker by this cheap and con- venient method. Prices vary somewhat but complete books may usually be copied for from one to three cents a page. Work in color is slightly more expensive, but sometimes in- valuable. The photographing of old documents and manu- scripts on infra-red film fre- quently brings to light erasures, changes, and sometimes for- geries hitherto unsuspected. The American Documentation Institute, Washington, D. C, in cooperation with the United States Department of Agriculture, public libraries, and other research institutions, acts as a clearing house for much of this Bibliofilm Service. Publication by this film method is also coming into use for re- search material which does not require a large edition. The econ- omy and convenience of this can easily be seen. The use of Micro- color film by Bibliofilm Service adds to the scope and value of research extract copying, since colored specimens and objects as well as illustrations may be reproduced and used either for indi- vidual reading or projected on a wall screen for class or lecture use. REFERENCES: Morgan. Willard D., and Henry M. Lester, The Leica Manual, Morgan & Lester, New York City, 1937. 1. For reading books or records graphed on 35 mm. film. 2. Turning the handle changes the pages either backward or forward. 3. The image is magnified 12 diameters. 4. The Reader may also be used as a projector for ordinary screen. 5. It may also be used as an enlarging printer, making enlarged paper print copies of any microfilm ma- terial.
  348. 410 Chapter 48 PREPARATION OF ILLUSTRATIONS THE preceding chapters have

    shown the many ways in which information may be presented in graphic chart form as well as information on how to read a graphic chart. Choice of the form in which material will be best presented, while an important step, is not always the first or last step. The following chapters will show Bausch 6t Lomb Optical Co., Rochester, N. Y. A Reducing Glass. 1. The diameter of this glass is three inches. It will reduce in the ratio of about two to one. The reducing glass is made with a double concave lens of white ophthalmic glass, protected by a wide chromium rim. 2. A criterion in reducing an illustration might be that an area measuring about 3 " x 6 " is about all the eye can hold at one time. In planning page lay-outs, a reducing glass may be used to determine whether reduction to fit a given space will cause loss of detail. It is possible to sec how an illustration will appear when it is reduced by adjusting the distance between the illustration and the glass until the correct ratio between the original and the reduced image is obtained.
  349. PREPARATION OF ILLUSTRATIONS 411 some of the problems involved in

    the actual presentation of the chart. When presenting material in a pamphlet or book, it is possible and sometimes a good policy to use only graphic charts. Illustra- tions of other types may be included and many times should be included. The choice of illustrations will depend upon a number of factors. The material to be presented will be the most important criteria. E W, Pikr S Company Cranford N J SCALE 8 A. Illuminaied Hand Magnifiers. Any nnagnificr may be used to secure an idea of the appearance of an illus- tration when jt IS enlarged. The same method suggested in 410 may be used for this also. SIZE OF COPY t^ n u SIZE OF *^ FINISMED CUT 5 B. Scaling Copy. Since the ori^mal drawing or photo- graph seldom fits the allotted space, it is necessary to "scale the copy," that is, to figure out the height and width it will be when one side is reduced or length- ened. A diagonal line drawn from corner to opposite corner will be the di- agonal of a larger or smaller illus- tration made from that copy. Use a tissue overlay paper for drawing the diagonal. A slide rule is also a useful device to determine the reduction of a pho- tograph or drawing.
  350. 412 GRAPHIC PRESENTATION A photograph which is to be printed

    or reproduced should never be rolled. If it is absolutely necessary, roll the photograph with the picture outside. Then if the surface should crack the cracks may close up when the photograph is flattened out. Instructions written on a photograph or picture will often appear in the halftone. A paper clip often cracks the photograph and appears in the finished picture. Writing should never be put directly on a photograph or drawing. Instructions should be writ- ten on a separate piece of paper and folded over the margin. Steel Industry Wrong Way to Make Crop Marks. See 413 for remarks.
  351. PREPARATION OF ILLUSTRATIONS 413 To determine whether a cut is

    already a halftone, look at it through a small magnifying glass. If the shaded portions appear as many dots, it is a halftone. Halftone screens are designated as fine or coarse, depending upon the number of lines of dots to the inch. A rotogravure illustration when looked at through a small magnify- ing glass appears as many small squares, less clearly than a half- tone. E Right Way to Make Crop Marks. Put crop marks in the margin of a photograph or drawing. If you MUST mark the copy, use a China marking pencil for this purpose. The reason for this is simple:—crop marks drawn on the photograph oblige the engraver to make the plate smaller than the size indicated by them.
  352. 414 GRAPHIC PRESENTATION Reproduction Media for Art Work Amt MUIUM

    IViiiil. Charcoal. Pailcl. Clulk. Square Slick, or l.illiiiKr;i|>h Prim. K»:pR(H)i'(.TloN MtvilinM Usi'Ai.i.Y Employki) I Highlight or rrgular fine- I screen copper halftone re- I quired ID secure fine grada- tion of tone. If to appear on nou-»print, use a coane- scrccn halftone. I't'iiancl'liik. Wood Cut, Vraitli Hoard. Reverie Drawuig. or Black Crayon on Pebbled Board, or Proof (rom Coarv Screen Half- tone Line engiavmif: on copper for very fine work, or long runs, on line where work is nut extremely fine in shading, and run is rehitivelv short. UnSUIIABLE KKPRlimiCTlUN MrtHom Line engraving not suited un- less tones are solid, showing no gradation. Halftone is uniuited. as it "breaks up" the solid black lines and areas. CklMMKNTS If technique is bold, coanc screen can be used. If later to be duplicated by electro, stereo, or mat. spec- ify when the original plate is made. Dry Brush. .Vir Brush. Wash Drawing. Walrr Color or Oil P.ainting to reproduce in Black-and White. Combination Line and "Flat" lones (i.e.. tones which Ikixc no >^adalinn of v.ilur) Print from "Dry Point" or .\cid-Bilten Etching. l'hoirif>rjpli. Photo-Montage. Oilored Drawings. Water Oilor .ind Oil Painting. Colored Photos, Crayon or Pastel Drawing (to be re- produced in color). Drawint^ ol more than one fo|f>r. ii*in(; solid color ;irras or sli.i(ling\ done with lin<^ or lion Highlight or regular fine- screen coppr) hdlllont if to Im' um'cI on smooth paper: co.irv'-Mrecn halftone if on Mt-wsprini. Highlight or regular fine- screen ( tipper hnlflotir if to bo iiscti on smo<iih paper; coarsc-strcen halfloiir if on newsprint. Line engrailing used with Ben Day. or other shading me- dium for flat toned areas Line engraving will not re- produce tone values. Where lines and tone etlects (as in meMOlint) :ire fine, use a fine-xrreen nipper halflone. Halflone: Coarse screens for rough papers: fine screens on copper for smooth papers. Two-, three-, four-, five-, etc., color process, dejiending upon ttature of copy and fineness of work required. line engraviiif^i for caih of the 2. J. or more colors will produce a grc.ii variety of tones by overprinting of areas, either solid or shaded to different decrees Line engraving will not re- produce tone values. Halftone is unsuite«l as it would make a "pattern." Line engraving .ilone un- suitcd unless time is on original art work by use ol Bourges screiiis. Craf-tint, Prcs-.i -Tin t . or other iiiclhod. Line engraving unsuited un- less technique is quite bold and simple. If use of dry bnuh produces solid black stippled dots, line engras itig ran l)e used. In certain cases, use of color filters is required to pre- serve tonal relations of original. Stippling or ruling can be done by hand, rather than by a mechanical shading method. Use coarse screen halftone only if to be used on nesvs- print or rough paper. Line engraving will produce tones Line engraving will not re- proiluce tones. If photograph shows only solid areas of black-and- white, or lines and no tones, a line engraving may be used. Color process plates mav be used in < on junction with additional flat tints for spe- cial effects. Halftones unsuited, as they form an iMulesirable "pat- tern" and hre.ik up the solid areas (iosts can often be reduced by having an artist make a separate black and - white drawing on tissue (so as to secure register) for each color. Separate line engrav- ings are then made from each. The Colton Press, New York City, "Production Yearbook," Vol. V, 19.19. Reproduction Media for Art Work. SCALE .7
  353. PREPARATION OF ILLUSTRATIONS 415 I Lawrrncr W I>rapKfr. "The Art

    of Linoleum Cutting. " 1Q38. Publithed by Government Printing Office Apprentice School, Washington, D. C. A Linoleum Block Cut. 1. Linoleum or wood blocks may be used for the actual printinj;. In fact, the first printed letters were wood-cut type carved into pictorial wood-cut blocks in explanation of the picture. Its wide use and the ease with which it is cut have made linoleum one of the best known and best liked materials in the reproduction of decorative designs, silhouettes, and the simpler illustrations. 2. In a great many printing plants, linoleum blocks, which are supplanting wood, are cut for tint blocks, second-color plates, for use in graphs and charts, for indicating zones or routes on maps, and for all kinds of work ranging from advertising blotters to letterheads. The block prints best on an antique finish paper, and inks of a heavy body should be used.
  354. 416 GRAPHIC PRESENTATION MACHINE FINISH PAPER SCREEN Photo-Engravrn Board of

    Trade, New York City. Halftone Screen Tints. The purpose of the half cirrles in this illustration and the one on page 417 is to indicate how curves will appear when the various screens are used.
  355. 418 GRAPHIC PRESENTATION 1 Vz V4 1 Vz 'A 1

    % V4 The "1" indicates a full color value. "'/a" a half screen and "54" * quarter screen. Those colors that are checked (r ) are the ones used generally in this book. Because of the possibility of patterns, the colors marked x" have not been used. The small areas of color between the combinations of color are helpful in determining the colors and color values that are combined in adjoining sections. Colors and Possible Combinations of the Colors Used in This Book. Because enough tints and shadings of color may be obtained by using half screen and quarter screen colors, the combinations of colors shown above that would require a double screen have not been used in this book. For an example of color combinations, see 186.
  356. PREPARATION OF ILLUSTRATIONS 419 When color is used in printing

    a pamphlet or book, "tints' of the color or colors may be used to secure shading instead of using cross hatchings. However, because the areas for color tints usually are irregular in shape and require more skill in applying them, the cost of color tinting may be greater than the cost of the halftones. One definite problem arose regarding the use of the color "green." As shown opposite, green may be secured from a combination of full yellow and full blue. If this "combination" green were used, both blue and yellow color plates and an extra press run would have been necessary, whenever green was wanted. As a result, a green ink was used instead of the "combination" green in some chapters. The subject "Color and Its Use" is discussed on pages 423 to 428. DS-25 DT-60 Transograph Corporation, New York City. Shading Film. 1. A transparent film on which cross-hatchings and halftones are printed in ink has been developed by several firms. This shading film is placed over the original drawing on those sections to be shaded and a photograph is taken of the combination. The halftones available in this film are those used for newspaper work, that is, from a 2S-linc to a 60-line screen. Perhaps in the future, they may also be made with a finer screen. Film is made for light or dark background. 2. A modification of the transparent film is also available in the form of illustration board, which when treated with a chemical solution brings out the shadings in the desired sections. A screen as fine as 80-line may be secured in this form. This may be secured from The Craftint Manufacturing Company, Cleveland, Ohio. 3. Other companies from which a similar film may be obtained are as follows: Arthur Brown flk Bros.. New York City. (Artist Improved Shading Sheet.) Grafa-Tone Co.. New York City. Zip-A-Tone , Chicago, Ulinois.
  357. 420 GRAPHIC PRESENTATION i i!ili!!l ;,lhl:,|.' iiiillilii!! Courteiy of Ch;ii;

    Company, Philadelphia. A. Drawing Boards for Securing Halftone Effects. 1. These drawing boards and many others may be used to secure halftone effects. Before a pencil is applied to the board, it is perfectly white with slight indentations on the surface. The pencil touches only the high spots, and the effect desired is thus secured. 2. A charcoal drawing on rough paper also secures a halftone effect. 3. Whenever any drawing material which may smudge is used, spray of liquid "fixative" will prevent any possibility of smudging. No. 523.— 9I4X 14J4. No. 509. —9^4 X i4'4. No. 526.—9J4 X 14^4. No. 512.— 7 X 7. Xo. 5iS.—bHx7'/2 No. 527.—9I4 X 14I4. Courtesy of Ben Day. Inc., New York. B. Ben Day Shading Films. 1. The Ben Day process is used to make crosshatchings and shadings on charts, maps, and pictures. The shading medium consists of a transparent film stretched taut upon a wood frame. This film bears a design in relief on the outer side. The work is done on the drawing, on the negative, or directly on the plate before it is etched for printing. If done on the negative, the finished plate will show the tint in reverse as to black and white. When a particular shading and the sections in which it is to appear have been decided upon, all other sections are protected by French folio paper, gum, or gamboge (a semi-transparent solution). The inked film upon which the particular pattern appears in relief is then placed face down upon the drawing, negative, or plate. The top side of the shading medium is rubbed with a stylus or rubber roller, and the pattern is thus transferred to the copy. 2. Various shadings are available, as well as textile tints. 3. See 419 and 422 for other methods of securing shadings.
  358. 422 GRAPHIC PRESENTATION Charles T. Bainbridge and Sons, Brooklyn, New

    York, make a Coquille Bristol that may be used in the same way as the board illustrated in 420A. This company also makes an illustration board for general artwork and a board that is used for work requiring fine detailed drawings. Samples may be secured upon request. Sunray scratchboard, handled by the Steiner Paper Company, New York City, may also be used in the same way as the board illustrated in 420A. Chicago Cardboard Company, Chicago, Illinois, manufactures a colored art poster board calendered so that both lettering and printing may be done on it. REFERENCES Wallace, C. E., Commercial Art, McGraw-Hill Book Co., Inc., New York City, 2nd edition, 1939. U. 8. Drpartnicnt of Afirirulturr, Bureau of Agricultural Economic*. A Series of Density Distinctions. 1. These cross -hatchings were made on sheets of paper by the Bureau of Agricultural Economics. It is possible for any individual using a great many hachures and desiring a large variety, to design several and have sheets of them printed. 2. To secure the greatest variety in shadings, every fourth or fifth one beginning with black might be selected.
  359. COLOR AND Recent years have seen the dawn of a

    new era in the use of color. An outline of certain color facts and theories may prove helpful. B. C. D. The above colors arc approximate. The correct hues, vermilion, emerald green, pale cad- mium yellow, and light ultramarine blue, may be obtained generally in high grade tempera or show card colors. A. The Primary Colors as Used and Described by Early Ariists. Color study was based on human vision alone until Newton made the first physical analysis of liRht about 1672. B. The Primary Frequencies of Vibration in the Radiant Energy Called Light. Young. 1773-1829; Hclmholtz, 1821-1894; Maxwell, 1831-1899. and Konig, 1832-1901, proved these three frequencies of light vibration can produce all light colors. C. The Primary Colors in Pigments as Taught During the 18th and 19th Centuries. 1. Green was considered a secondary color during this period. 2. The pure emerald green of Leonardo da Vinci and other early artists, however, cannot be produced by mixing pigments. D. The Two Pairs of Primary Color Sensations in Human Vision. Hering. 1834-1918. based his color studies and theory on color sensations in the human brain instead of on the physical properties of light. E. The Three Primary Frequencies of Light and the Four Primary Color Sensations Which They Produce in the Human Brain. 1. Through studies in color blindness, Ladd Franklin in COLOR AND COLOR THE- ORIES. 1929, showed that color vision has developed from the power to see yellow and blue only, into the ability to differentiate red and green from the yellow rays. 2. It was clearly shown that for normal human vision, the three primary color frequencies of light produce four primary color sensations. 3. This reconcile* apparent contradictions in earlier theories and is now generally accepted.
  360. 424 GRAPHIC PRESENTATION A. Maxwell Discs of Slit Paper or

    Cardboard. s the idea of the spectrum band of colors invaded the field of practical use, it was made into a circle by adding the purple hues between blue and red. for which there is no spectral wave length. Scientists and artists divided this circle of hues to suit their needs, usually at regular inter- vals around the circle, with complementary colors opposite each other. Complementary colors are those producing neutral gray when mixed in cor- rect proportions. Unmixed they tend to intensify each other. R /(4/u 7 A A 70 BG Allcolor Company, New York City, "An Explanation and U«e of Allcolor Paperi." Courtesy of Munscll Color Company. C. The Horizontal Scale of Chroma. 1. This shows the practical advantage in numbering chroma steps beginning at gray. 2. Hues differ in the number of their chroma steps. 3. As new pigments of greater intensity become avail- able, new chroma steps can be added. Some hues have acquired four new chroma steps since tliis sys- tem came into use. Millon Bradlry Co. New York City B. Color Top. 1. Maxwell discs of slit paper or cardboard, for studying primary and other color relations, can be obtained with small color tops, and larger color wheels, from Milton Bradley Co. and the Abbott Educational Co., New York City. I. These discs arc easily made from water-color paper painted with tempera or show card colors. They should be slit from the edge to the center, so that they can overlap as desired when superimposed. 3. When spinning rapidly, the colors of the overlapping discs metgc. 4. Light reflected from the surface of revolving discs creates \\\v scnsation of colored light, not colored pigments. Light ultramarine blue and pale cadmium yellow spun together look almost pure white, not green. Vermilion and true emerald green produce a darkish yellow, not neutral gray. D. Contrasting Colors In Even Balance. Strongly contrasting or comple- mentary colors, repeated in equal quantities, are confus- ing and hard on the eyes.
  361. COLOR AND ITS USE 425 These diagrams illustrate the Munsell

    System of Color Notation, and are reproduced through the courtesy of the International Print- ing Ink Corporation from Three Monographs on Color, a publica- tion of unusual interest and beauty. The countless hues, and their modifications, used in science, art. and industry required orderly arrangement, and some method of accurate iden- tification. This need produced several color sys- tems, of which A. H. Munsell's A System of Color Notation is the most widely used commercially. A. 1. Hue indicates the spectral wave length of a color and its position in the color circle. 2. In Munsell's notation, hue is indicated by its initial letter. B. 1. Value, or brightness, indicates a color's approach to white or black. 2. In this system, it is indicated by a number written above a diagonal line. C. 1. Chroma, intensity, saturation, are here shown as a number of steps away from neutral gray toward full chroma, on the hue at its greatest intensity or satu- ration. D. 1. The three qualities of color, hue, value, and chroma, are clearly shown in this diagram. 2. R 4/14 indicates a brilliant, intense red, and G 8/13 a light, gray green. grttn A. The Hue Circuit. Wh,u 9 Another version of these relationships is found in 42 7B. Bhck B. The Value Scale. I Blu* grtm C. Chroma Steps. D. Correlation of Three Dimensions of Color. SCALE .8 International Printing Ink Corporation. New York City. "Color ia U*e" No. 3 of a Scric* of 3 Monograph* on Color, 193S
  362. COLOR AND ITS USE 427 mill 11 /I III axceo

    / :>is> AD /CD IZ3 1456 I r These colors differ in hue. I I ^ I These colors differ in value. Grace Cornfll. "Color." Carter's Ink Company, Boston. Mass.. 1934. A. Use of One Color with Black and White. The use of red for emphasis on a black and white page is effective be- cause of brightness, intensity and high contrast combined with a wave length on which the eye can focus easily at about reading dis- tance. These colors differ in chroma. George Welp. "Color for Packaging." 1938 Cour- tesy of International Printing Ink Company. New York City. B. All Colors Differ in These Three Ways. A very fine summary of Ostwald's (1853-1932) color theory and system appeared in "The Science of Color," More Business, * November, 1937, written by Egbert G. Jacobson, President, Asso- ciation for Color Research. The interrelation of hues is beautifully shown throughout the color solid with unusual accuracy and rich- ness. Faber Birren follows Ostwald with modifications, using a 13-26 hue circle instead of Ostwald's 12-24. or Munsell's 5-10 circles. His chart gives the natural intervals between hues as seen by the human eye. Printing inkstand tempera colors^in these hues are available commercially. All color charts are good if used intelligently. Published by American Photo-Engravers Association, Chicago, Illinois. t General Printing Ink Corporation, New York. t E. William Berg. 5510 Warwick Avenue. Chicago. Illinoit.
  363. 428 GRAPHIC PRESENTATION The Allcolor Company, Inc., New York City.

    A. The Allcolor Cabinefs Containing Colored Papers of 362 Hues. Each paper shows its Munsell Notation number on the back; also the number of the Inter- national Printing Ink Corporation's ink with which it was printed. A yellow green is the brightest color in a dim light. Yellow green light is used in photographic dark rooms whenever possible. In a large garden, light blue flowers can be seen against a dark green background farther than any other color. A light yellow is next in visibility. Green and blue look brighter in a dim light than orange or red, which require full illumination. Effective color schemes may be composed of black and white and another color, different values of one color, adjacent colors in the color circle, near complements rather than exact complements, a color and split complementaries —that is the colors on each side of its complement in the color circle, triads or three colors equally distant in the color circle. REFERENCES Birren, Faber, Monument to Color, McFarlane, Ward, McFar- lane, New York City, 1938. Luckiesh, Matthew, Color and Colors, D. Van Nostrand Co., Inc., New York City, 1938. Sargent, Walter, The Enjoyment and Use of Color, Charles Scribners Sons, New York City, 1923. Others also are referred to in the text.
  364. 429t Chapter 50 METHODS OF REPRODUCING THE materials on hand

    may be used in some instances, but in others the work must be done outside the office. If you have only certain equipment, your process of publication is limited by the need for other equipment. Carbon paper is one of the simplest methods of securing a num- ber of copies. If the original is made by hand (pencil or ink), a special type of carbon paper should be purchased. Best results will be obtained by using a pencil with hard lead, or a manifold pen. Tracings in pencil or ink may be made by placing tracing paper over the copy. Thin paper can be used for small tracings, while for large ones a tracing cloth, which comes in a larger size than the paper, should be used. |P^F^
  365. 430« flRAIHI g IRIIENTATION A. Arc Lamp. Today it is

    possible to secure a continuous blue printing, washing, developing, and drying machine with either elec- trically heated or gas dryer. The C. F. Prasr Company. Chicago. Illinois, and NfW York City. Charle* Bruning Co , Inc , New York City. B. Developing Machine for Making a Whife Print. 1. After the print, whether black and white, blue line, or a blue print, has been exposed in a blue print machine, the print must be developed in a developing machine. The machine shown above develops a positive black and white print. 2. The Ozalid Corporation, New York City, makes a machine which exposes and dry- develops a positive print from a positive original.
  366. METHODfWfEPRODUCING '431 The principle of the blue print, white print,

    and blue line print machine is that chemically treated paper is first exposed to a chem- ical light action, which prints the design. The print is then devel- oped, that is. treated so that the design will appear clear and remain semi-permanently. The first method of exposure was by means of blue print frames placed in the sunlight. The next step in the development of the present machines was the use of a single arc lamp. Later a bank of arc lamps placed side by side was em- ployed. Since the convenience of operation seemed to fit into the reproduction field, mercury vapor tubes were utilized. It was later found that such tubes did not compare with arc lamps in the efficiency of printing. Makers of Blue-Print Machines: The C. F. Pease Company, Chicago, Illinois, and New York City Paragon Revolute Corporation, New York City Shaw Blue-Print Machine Company, Newark, New Jersey I Photcntat Corporation. Providrncf. Rhodr Itland. Photostat Machine with Engineering Board. 1. The Photostat is a machine designed for the rapid production of copy by means of photography. 2. The subject matter is photographed directly upon sensitized paper without the inter- vention of any plate or film negative. Printed or written documents, drawings, blue prints, records, maps, fabrics, small tools, machinery parts, etc., may be copied in a few minutes at the cost of a few cents. 3. In addition to copying at original size, enlargements or reductions may be made in any desired size. If enlargements required are larger than the maximum size sheet of the Photostat used, they may be made in sections and pieced together. Transfer negatives for reproduction by other processes are easily made on this apparatus. Standard models produce, on a single sheet, prints up to 18" x 24 ".
  367. 432 GRAPHIC PRESENTATION A. B. Dick Company, Chicago. A. Mimeograph

    Machine. 1. MimeoKraph stencil duplicating can reproducr large numbers of copies in black ink or colors at a low cost. This process is widely used for reproducing graphic material of many kinds. 2. When enlargement or reduction of an original chart or graph is neces- sary to effect conformity with Mimeograph duplicating size lim- itations, Mimeograph photochem- ical stencils will be found useful. The photochemical stencil is fre- quently used where graphic struc- tures are too complex to be con- veniently drawn with a stylus on a stencil sheet. Standard Mailing Machines Co., Everett, Maai. B. Liquid or "Fluid" Process Duplicator. 1. The original or master copy for this duplicator is made with a "spirit" hectograph car- bon in such a way that a reverse or negative impression is made. This master copy is inserted in the drum. While proceeding through the machine the copy paper is moistened with a thin film of an alcoholic duplicating fluid. When this inserted copy paper is brought in contact with the negative impression of the master copy, it dissolves sufficient dye to produce a copy. This process will make from 200 to 300 clear copies from one original. 2. Type of copy may be printing, handwriting, or typewriting. 3. The master copy can be stored and reused if less than the maximum number of copies is made from the original. The life of the master copy is from ten to fifteen years.
  368. METHODS OF REPRODUCING 433 A. Mimeoscope for Illuminated Draw- ing

    Board. 1. With the aid of the Mimeoscope and •tyli, both straight and curved lines, either broken or soHd. are obtainable. Thus, ruled forms specially designed to suit current needs can be quickly and econom- ically produced on the Mimeo- graph duplicator. 2. Triangle guides, beam compasses, and circle guides, manufactured espe- cially for the preparation of Mim- eograph stencils, are also avail- able. A. B. Dirk Company, Chicago. I Lithoprint Company of New York. Inc. B. Two Steps in the Lithoprint Process. The lithoprint process is a simplified form of lithography. A plate coated with special composition replaces the lithographer's stone and the copy is obtained by a simple process of contact printing. Lithoprint reproductions duplicate the original draw- ings.
  369. 434 METHODS OF REPRODUCING AddmsoKraph-Multigraph Corp., Cleveland. Ohio. A Multilith

    Plate for Use in a Multilith Machine. 1. The Multilith process is "offset" in miniature. The paper-thin Multilith plates may be placed in the typewriter. By using a special typewriter ribbon, typing can be done on the plate just as it is done on paper. Writing, lettering, or drawing may be done directly on the plate with a special type of crayon having a grease content. 2. However, the photographic method of transferring an image from the copy to the plate is usually used. The photographic film is placed in contact with a sensitized Multi- lith plate and the negative image is "burned into" the plate by exposure to light. REFERENCES Binkley, Robert C, Manual on Methods of Reproducing Research Materials, Edwards Brothers, Inc., Ann Arbor, Michigan, 1936. Colton Press, New York, N. Y., Production Yearbook, Volumes 3, 4, and 5, 1937, 1938, 1939.
  370. 435 Chapter 51 METHODS OF PRINTING THE three basic methods

    of printing are —relief (raised surface), planographic (surface), and intaglio (subsurface). In relief printing, also referred to as letterpress, the design is raised in relief from the surrounding surface and only the raised surface portions print after being inked. Examples —newspapers, magazines, booklets, circulars printed from type, electrotypes, stereotypes, halftone plates, line cuts, etc. Relief printing is adapt- able to all finishes of paper for type work. Where the screen is coarse enough it is adaptable on rough-surface papers, but the best results for halftone printing are obtained with a fine screen halftone on a coated paper surface. REFERENCES ON RELIEF PRINTING Hoch. Fred W., Handbook for Pressmen, Published by Author, New York City, 1937. New York Employing Printers Association, Inc., New York City, How to Buy Printing Profitably, 1927. Hamilton Manufacturing Co., Two River*. Witconiin. California Job Case for Type. 1. In setting type by hand, individual letters of type are picked from a job case and placed into a composing stick in which they are arranged and spaced as desired. Each line is removed as it is set and placed on a flat tray called a galley. When the page is complete, corrected, etc., it is locked up for the printing press. Simple corrections are made by removing the letter or whatever is in error and changing it. 2. The illustration above is a California Job Case, which is the universal case. About 95% of the cases used for typesetting by hand are California Job Cases,
  371. "^^^ GRAPHIC PRESENTATION In planographic printing, which includes lithography (both

    direct and offset), the design is in the same plane as the surrounding or non-printing portions of the plate. The design, however, is grease- attracting, while the non-printing portions are treated so as to make them grease-repellent. On the press, the non-printing por- tions are dampened with water between impressions to keep them in that condition. It follows that when the greasy ink is applied by the rollers to the plate only the design takes ink and prints. In direct lithography, the design is printed directly upon the paper. In offset lithography, the design is printed upon a rubber blanket which in turn transmits the design to the paper. Practically all lithography is now of the offset type. While both coated and un- coated papers are being successfully used for lithographing pur- poses, the latter is chiefly used. Blanket resiliency makes it pos- sible to secure excellent results in halftones on uncoated (rough) stock. Examples —displays, posters, books, book covers, booklets, circulars, labels, wrapping papers, calendars, inserts, etc. REFERENCES ON LITHOGRAPHY Rhodes, Henry J., Art of Lithography, Scott Greenwood & Son, London, 2nd edition, 1924. Miles, Russell N., The Encyclopedia of Lithography, Published by Author, Chicago, Illinois, 1938. Intertype Corporation, Brooklyn, New York. Slug Cast by a Typesetting Machine of the Line Type. 1. Type may also be set by composing or typesetting machines. 2. One of three types of machine is the intertype. It composes with matrices, small brass dies, which have the forms of various characters indented in their sides. The indi- vidual matrices are assembled in the desired order for each line of the material, and a type-high metal slug with the letters in relief is cast in one piece from these matrices. 3. Another typesetting machine which operates on the same principle as the intertype is the linotype. 4. Corrections in linotype and intertype matter are made by resetting the complete line in which an error occurs.
  372. METHODS OF PRINTING '^^^ Soderstrom, Walter, Photolithographers Manual, Waltwin Com-

    pany, New York City, 1937. Lithographers National Association, Inc., New York, N. Y., "Books on Lithography" reprint from Bookbinding and Book Production. Lithographic Technical Foundation Publications, 220 East 42nd Street, New York, N. Y. In intaglio printing (also referred to as rotogravure, photo- gravure, and sheet-fed gravure) the design is etched into the sur- face of a copper plate or cylinder, thus producing sub-surface recesses. Ink is applied to the plate or cylinder in sufficient vol- ume to fill the recesses following which the surface proper is wiped clean. In rotogravure, the surface is cleaned by a thin steel blade known as "doctor blade" which fits tightly against the surface of the plate as the cylinder revolves. The paper is brought into direct contact with the copper plate or cylinder by means of a rubber roller. As a result, the ink is lifted out of the recesses thereby a**"*^. I Lantton Monotype Machine Co.. Philadelphia. Pennsylvania. Type Set by the Monotype Machine. 1. The third kind of typesetting machine is the monotype. It casts and assembles indi- vidual letters automatically. As soon as each letter is cast, it is moved into the proper place in the line of type. When the line is completed, it is moved out on the form that holds the lines of type. 2. On monotype forms, corrections are made by removing the letter or whatever is in error, and replacing it from a case of type of the same style. 3. This illustration shows how the monotype machine may be utilized in making "run- arounds." The operator of the machine sets "quads" in the space of each line in which the illuatration is to be set. The cut is mounted in position on the quads.
  373. 438 GRAPHIC PRESENTATION transmitting the printed design to the paper.

    Examples —roto- gravure newspaper supplements, magazine inserts, booklets, cir- culars, etc., usually printed from copper cylinders at high speed. A wide range of papers from the finest grade down to newsprint — all from the original roll of paper as delivered by the mill —is used for this type of printing. A substantial percentage, possibly two- thirds, of the gravure printing being done today is done at news- paper speed on both sides of the sheet and folded on the press ready for delivery. Ttx HoaMrV TjrpMctllnt MmMik mU tyitt in >ll mMauraa up to M piru in ill •!••• Irnm 4 to I* point. Strattkl »*tt«r. tabular and int/irat« work, rulad form*. rui« and ficurc work—in fact, all kind* o/ typowttini —ajv dona with lUioqualUd facility and apaad. No othar marhina ambodira within th« aoop* ai ila oparation ao wida a raaca ol 4 Point Modem. No. 8 Seriefl Under The Monotype System New Type, Decorative Material. Leads, Rules, Slugs and metal furniture are provided in unlimited supply for the use in hand composition and at a cost so low that non-distribution becomes an economy as well as a convenience 6 Point Binny Old Style, No. 21 Series The Monotype Typesetting Machine Sets Type In All Measures Up to 60 picas wide in all sizes from 4 to 18 point for straight matter work 8 Point Binny Old Style. No. 21 Series Monotype Versatility Is Known By Every Printer Using Monotype machines for composing room needs and supplies 10 Point Binny Old Style. No. 21 Series The Monotype Unit System Makes It Possible to fit copy accurately to the space to be occupied 12 Point Binny Old Style, No. 21 Series Type-&-Rule Caster Supplies Your Needs 14 Point Binny Old Style, No. 21 Series Cut Mounting Base 30 Point Binny Old Style, No. 21 Series Artistic Designs .16 Poinl Binny Old Style, No. 21 Series C_^ TYPE FACE 36H4 Point Kennerley, No. 268 Series Lantton Monoty|>r Mitrhinr Company, Philntlrlphia. Range of Type Sizes. 1. These are only a few of the sizes of type available. 2. The four point type is the smallest that can be set on the Monotype machine, and eighteen point ii the largest. Larger sizes may be set by hand.
  374. METHODS OF PRINTING 439 REFERENCES ON ROTOGRAVURE Cartwright, Mills H.,

    Photogravure, American Photographic Publishing Company, Boston. Massachusetts. Bennett. Colin N.. Elements of Photogravure. American Photo- graphic Publishing Company, Boston, Massachusetts, 1935. GENERAL REFERENCES Colton Press. New York. N. Y.. Production Yearbook. Volumes 3. 4. and 5. 1937. 1938. 1939. Hackelman. Charles W.. Commercial Enf^raving and Printing. Commercial Engraving Publishing Company, Indianapolis, Indiana, 1924. University of Chicago Press. A Manual of Style, Chicago, Illi- nois, 10th edition— 1937. Cvnlurr OldttTl»6l 16 poinl 6 to 3A poink PACK MY BOX WITH FIVEj Pack my box with five doz|1234 Go»»..c No 5A4-26J le point (6 to 36 pent) PACK MY BOX WITH FIVEj Pack my box with five do|123 &tr«>T(o*d Bold 474 IS poot 6 to 72 point (16, 04 to 130 point) PACK MY BOX WITH FIVE D| Pack my box with five dozen 1 12 34 Scotch RecHCH 379 16 Bainl (6 to 34 point) PACK MY BOX WITH FI| Pack my box with five cloze|l23 Bedoni Book 27 18 poiat 6 to 36 point (42 and 40 point) PACK MY BOX WITH FIVE DOZE| Pack my box with five dozen jug 1 123 American Typ* Foundrr*. Elii«b*th. Nfw Jertey. Five Different Type Styles. For comparison of type stylet, write to American Type Founderi, Elizabeth. New Jer»ey.
  375. 440 GRAPHIC PRESENTATION Abstracts from Time Series Charts. A Manual

    of Design and Construction, 1938, prepared by Committee on Standards for Graphic Presentation, under procedure of American Standards Association, with The American Society of Mechanical Engineers as sfKDnsor body. LETTER SIZES Elite Type - 12 characters per inch Pica Type - 10 characters per SMALL GOTHIC - 9 CHARACTER LARGE GOTHIC - 9 CHARACTER .120" TEMPLATE LETTERING J40"TEMPLATE LETTERING .175" TEMPLATE LET! .240" TEMPLATE LINE WEIGHTS POINT —^^— 4 3 POINT 2^2 POINT 2 POINT I '/2 POINT I POINT 3^ POINT I/O POINT Original Size Note: A point, in printer's measure, is opproximately 1/12 of a pice, which, in turn is 1/6 of on inch. Therefore, a printer's point is opproximately 1/72 inch.
  376. METHODS OF PRINTING 441 LETTER SIZES Bllt* Typ* - 12

    oharftctars p«r inch Pica Type - 10 characters per SMALL GOTHIC - 9 CHARACTER LARGE GOTHIC - 9 CHARACTER .120" TEMPLATE LETTERING .I40"TEMPLATE LETTERING .175" TEMPLATE LET! .240" TEMPLATE LINE WEIGHTS POINT ^—^^^— 4 3 POINT 2'/^ POINT 2 POINT I '/2 POINT I POINT 3^ POINT 1/9 POINT Reduced to two-thirds of original size Courtesy of The Rrgfrntriner Corporation. Chi- ca(o. Illinoit A. Relief Printing —Halftone Cross Section. In relief or letterpress printing, the image to be printed is above the surface. The raised portions of the plate represent the image to be printed; they are inked by the rollers and give off the ink by contact with paper. The illustration to the left it a reduction of the material on the opposite page. See key to lettering for lantern slides on page 408. Courteiy of The Regentteiner Corporation, Chi- cago, Illinoia. B. Planographic Printing- Lilhographic Plate. In planographic printing the image is on the surface, it is ink attracting, while the non-printing areas are made chemically ink-repelling. I Courteiy of The Regeniteiner Corporation, Chi- cago, Illinoit C. Intaglio Printing- Enlarged Gravure Plate. In intaglio or gravure printing the image is below the surface.
  377. 442 GRAPHIC PRESENTATION PROOF- READERS MARKS It is imperative that

    corrections should be marked on the margins of a proof sheet opposite the indicated errors. Do not attempt to make a correction by writing over the print or between the lines. Errors marked in this way are in danger of being overlooked and are generally illegible. Proofs read by authors or depart- ment readers should be marked to con- form to the style as illustrated at the right.
  378. mil 443 Chapter 52 SELECTION OF PAPER AFTER the method

    of copying or printing has been decided I upon, paper suitable to the process chosen should be se- lected. In some cases a preference for a certain type of paper may be a determining factor in the selection of the copying or printing method. However, the usual procedure is to decide upon a method of reproduction and then to select the paper. For that reason, this chapter on Selection of Paper is placed immediately following the chapter on Methods of Printing. REFERENCES Wheelwright. William Bond, "Choosing thcRight Paper. What an Author Should Know About Paper." {Paper and Printing Digest, Dec, 1939). Production Yearbook, The Colton Press, Inc., New York, N. Y., Volume IV—1938. The term "paper" covers a great many articles and products and no attempt will be made to cover all of them. This discussion will be confined to those types of paper which would be used most in presenting graphic charts in annual reports, pamphlets, text-books, and similar publications. The Mead Corporation. Kingi|>ort, Tcnn Paper Machine With "Wet End" In the Distance, and Drying Roils, Finishing "Stacks," and Reel in Foreground.
  379. 444 GRAPHIC PRESENTATION CONSIDERATIONS IN THE SELECTION OF PAPER: 1.

    Reader comfort Paper with a minimum gloss and reflectance of light is a factor for easy reading. When using the letterpress process, however, a high finish or levelness of surface is vital to the sharp reproduc- tion of cuts. English Finish and semi-dull Coated papers give the maximum of reproduction without objectionable reflectance. For the lithographic process high finish is not necessary, but again, tends to increase the sharpness of detail. For the gravure process the same is true. 2. Opacity Good opacity is desirable, and in the medium and heavy weights should be no problem. In the lighter weights much de- pends upon the type of paper selected. The introduction of spe- cial materials to increase opacity has produced special papers for this purpose. 3. Grain direction In all Book paper made on a paper machine, the majority of the fibers run in one direction. Hence we have the terms "with" and "against" grain. Such paper is stronger when torn cross- grain and folds smoother with grain. In general, paper is or- dered with the grain running the length of the sheets for all pur- poses. In the folder, booklet, or bound book the grain should run parallel to the fold or binding. This gives a smoother folded edge and the pages, being more flexible, lie flatter. B. F Perkins 6t Son, Inc., Holyoke, Mati. Perkins Pressure Bulker to Measure the Bulk of Sheets of Paper. 1. The diameter of the pressure foot is three square inches and the pres- sure is figured in pounds per square inch of paper. 2. There is no fixed standard for the amount of pressure. The amount is intentionally flexible to meet current requirements. 3. The pressure bulker is used chiefly to measure a specified number of sheets of paper to ascertain how thick a book with that many pages would be. The number of inches is recorded on the scale on the left.
  380. SELECTION OF PAPER 445 4. Physical durability The physical strength

    of paper may best be tested by tearing it with and against the grain. 5. Permanence Book papers are generally made of rag, chemical wood pulp, mechanical wood pulp, or a combination of these. Chemical wood pulp is wood cellulose extracted by chemicals from the wood. In the process, gums, resin, and lignin are eliminated. In the better grades such fiber has much of the characteristics and permanence of rag paper. On the other hand, mechanical pulp is merely the crushing of wood into pulp with nothing eliminated. These fibers deteriorate in strength and color just as wood does under exposure. Mechanical pulp is used only in the cheapest grades of Book paper, which are classified as Groundwood papers whether they contained a large amount, as in news paper, or a small amount. All Book papers free from Groundwood are classified as free sheets, indicating that they contain only chem- ical wood pulp or rag, or both. In recent years, the improve- ment in chemical wood pulps has given us papers of fine strength. Trimmed ze Page S 4'/4x 6 4 X 9H SVax 7Vg 5'/ax 83/i 6x9 6 X 9'/8 7^x105/8 SVixU 9'/^xl2'/, nches nches nches nches nches or nches nches nches nches Cuts without 32, or 64 up Cuts without or 32 up Cuts without or 24 up Cuts without Cuts without or 32 up Cuts without or 32 up Cuts without up Cuts without 16 up Cuts without 16 up Cuts without Boolclefs on Book Paper waste from 32x44 (128 pages out) when run 4, 8, 16, waste from 25x38 (64 pages out) when run 4, 8, 16, waste from 25x38 (48 pages out) when run 4, 6, 12, waste from 38x50 when run 4, 8, or 16 up waste from 32x44 (64 pages out) when run 4, 8, 16, waste from 35x45 (64 pages out) when run 4, 8, 16, waste from 25x38 (32 pages out) when run 4, 8, or 16 waste from 32x44 (32 pages out) when run 4, 8, or waste from 35x45 (32 pages out) when run 4, 8, or waste from 25x38 (16 pages out) when run 4 or 8 up 1 Guide In Determining Size of Sheet to Use to Secure a Desired Page Size It is desirable that the page sizes of booklets, etc., permit the printer to use standard •ixes of paper which are regularly carried in stock. The booklet size should cut without waste from such standard size sheets rather than require special size sheets or waste. Much depends upon the size of the printing press and the arrangement of the printing form. Therefore, the printer can best advise on this question.
  381. 446 mil GRAPHIC PRESENTATION color, and permanence. As a result,

    the majority of Book paper today is made from chemical wood pulp. Rag fibers are still used in the highest grades for certain characteristics, although it has been demonstrated that by using the best chemical wood pulp such paper has much of the characteristics and permanency of rag paper. No matter what the material used, paper cannot be permanent in color and strength unless carefully made, and acids or other deleterious materials eliminated. 6. Type of illustration, or printing process, to be used. It is vitally important that the paper be selected with this in mind. For the type of paper to use most effectively with various line screen halftones, see 416 and 417. Machine Finish Book paper has a medium smooth finish suit- able for ordinary printing where the cuts used are not too fine and the requirements, from a printing standpoint, not too exacting. A better grade of similar paper is called English Finish, which, having a more level surface, gives a better printing result than Machine Finish. Both of the above papers are finished on the paper machine, but Supercalendered paper is polished after being made, giving a higher shine to the surface for sharper reproduction of the details in the cuts when desired. However, the polishing of Uncoated paper has some effect on color, hence Supercalendered papers are not so bright in color as Machine Finish or English Finish and are also somewhat lower in bulk. Thr Mrad Corporation. Kin|;s|>ort Tciin Calender Stacks Which Give Paper a Smooth Finish, and Winding Rol
  382. mil SELECTION OF PAPER 447 Other types of paper finished

    on the paper machine are called Antique. Eggshell and Text. These papers have a rough or semi- rough finish suitable for use where only type or line cuts are used, but have good bulk and color. In general, the terms Antique and Eggshell are used for the medium and low grades, and Text is used for higher grades. The term Offset paper implies paper made for use in the litho- graphic process, namely, hard sized or water resistant. Uncoated Offset paper has good color, strength, and bulk. The finish varies from fairly smooth to medium because the lithographic process does not require an absolutely level surface for the reproduction of cuts. Almost any paper can be run offset if sufficiently hard sized. Coated paper is produced by the application to a special paper of a considerable amount of coating material, which is then polished. This coating material is generally composed of clay, casein, and other materials which will impart brightness or color to the final sheet. Either a high glossy finish or a semi-dull finish may be secured, depending upon the composition of the coating material used. Both are suitable for fine, detailed cuts, and the glossy Coated gives sharpness where semi-dull Coated gives softness. Coated paper is used for the best reproduction of halftone illustra- tions. Good strength and folding quality are implied when the BOOK PAPER Bulking Table showing ihe Approximate Number of Pages Per Inch of Various Types of Papers According to the Various Weights Available WEIGHT OF ONE REAM (500 SHEETS) 25x38 Supercalendered Machine Finish or English Finish Antique or Eggshell Offset , GloHy Coated _ Semi-Dull Coated 40 670 640 4S 574 548 50 60 500 480 450 426 70 400 384 80 960
  383. 448 GRAPHIC PRESENTATION paper is called Folding Coated. Also Coated

    Offset paper has been developed and when so termed is suitable for the lithographic process. Writing or Bond paper as differentiated from Book paper indi- cates a sheet made for hardness, crackle, and strength for letter- heads, forms, etc., rather than for printing surface and opacity. In other words, Book paper is a "filled" sheet to secure printing qual- ity and opacity, whereas Bond paper is not "filled" These quali- ties are not as important as the other requirements desired in Bond Paper. In the selection of paper, samples of various suitable papers should be obtained from the printer, who best knows the problem and can best advise on the selection. The final appearance of the finished job should be determined by the making of a dummy to demonstrate bulk, opacity, color, strength, etc. Paper sold under the manufacturer's brand implies full value, uniformity, and avail- ability. A more detailed explanation of the factors in selection of paper may be found in booklets published by various paper companies: S. D. Warren Company, Boston, Mass., "A Workbook for Plan- ning Printing" and "Estimator's Book." HammerTnill Paper Co., Erie, Pennsylvania. Champion Paper & Fibre Co., Hamilton, Ohio. American Writing Paper Co., Holyoke, Mass. ' •" f
  384. 449 Chapter 53 BINDING TECHNIQUES THE TYPE of binding to

    be used for a pamphlet or book de- pends not only on the size of the pamphlet, but also on the final appearance of the binding. If a permanent binding is not needed, a simpler binding than that for a reference book might be selected. See 451. Whether the binding job is large or small, the following speci- fications should be given to the binder: BINDING SPECIFICATIONS Title Headbands Quantity Cloth No. Pages Leather Plates: Boards Single Tips Stamping To Jacket Tissues Maps Wraps Whipstitch^ Boxes Reinforce \ "- " Deliver to Tapes When Required Linings Charge to Trimmed Size Special Instructions Edges Round and Back
  385. GRAPHIC PRESENTATION If the book is to have an edition

    binding, there are a number of features that should be considered. See below. 1. Imposition. See 452A. The binder should be consulted in de- termining whether the imposition should allow for folding in 16- or 32 -page units (signatures) before the book goes to press. From a binding standpoint, it is important that the bulk of the paper be considered in determining the method of folding and that the grain of the paper run the way of the fold. 2. Inserts. Pages that are printed on different paper from the body of a book, such as illustrations, maps, etc., constitute in- serts. They are commonly pasted to the text pages. 3. Reinforcements. The first consideration for strength in the joints of the cover is the end papers (the papers pasted to the inside of the cover and forming the first page of the book). The strength and durability of the binding depend largely upon the tearing strength of this paper. Other means of reinforcing are "turned ends," "muslin guards," and "cloth joints." To secure "turned ends," the end papers are cut about half inch larger in width than usual to allow a quarter of an inch stub. These stubs are placed around the first and last signatures and then pasted down. In sewing, the threads pass through the stubs of the end papers as well as the first and last signatures. ^ A uddle wire slitchH book A side wire slilched book (with cover omiHed) A side Singer sewed book A Smyth sewed book (cover omilte<l) Four Forms of Edition Binding. The choice of binding depends somewhat on the size of the book or pamphlet. Pamphlets and small catalogs require the saddle wire stitching. Books of 64 pages or more require the sewed types. Li^^iilii...iil.i...iilii...iil
  386. III-IIIIII'I'IIIII'IJIIII-I'III BINDING TECHNIQUES 451 "Muslin guards" arc strips of muslin

    pasted around the first and last signatures. The threads pass through the first and last signatures as well as the muslin, preventing the threads from cutting through the paper. "Cloth joints" are obtained by cutting the end paper in two and joining it with a strip of harmonizing book cloth. 4. Covers. The front and back of a cover (or cases) are made of two pieces of binders boards. A strip of manila or bogus forms the backbone. These are covered with cloth or leather. When paper is substituted for cloth, the style is commonly known as "bound in boards." 5. Stamping. This term covers lettering or finishing the cases. Flat Bindings. 1. The advantage of using this ty(>e of binding is that every page is 100% visible and all pages lie flat. 2. Various sizes and shapes of inserts may be used, and no special imposition of page form is necessary. 3. The binding on the left is metal; the one on the right is plastic. A variety of shapes, forms, and styles are available. These two were drawn from samples obtained from Spiral Binding Company of New York City and Brewer-Cantelmo Co., Inc., of New York City. I.I .I.I I.!.! l.l.l l.l
  387. PROBLEMS IN THE CREATION OF THIS BOOK Ai thi* hooh

    may hr rrviKd, any tugBrttioni from thr rradrr friativr to (iOMlhtlill«« for im|>rovr- mml. rtthrr in make-up or rontrr«t, arr invited. The aim of this hook was to srciirr the Kreateit potsihie numhcr of illuitrationt and to reduce the text to the minimum. A majority of the charts prrarntcd in thu hook were rrilured to fit our page plan. The scale notation should therefore he considered if a chart seems too small to be read easily. It may be advisable in some instances to use a readmit ((lass. Color has been introduced on many charts in which the original was black and white. If this has resulted in an accentuation of a part of the chart not intended by the pro- ducers, we hope they will understand our difficulty, since enough charts with color were not available. In our attempt to secure a book of about 500 pages, we found that by printing 32 pages on one 25" x 38" sheet of paper —16 pages on each side —we could secure a book of 512 pages with a 6' x 9" page. There would be 16 such sheets. By printing color on one side of each of these 16 sheets, there would be two pages of color alternating with two pages of black print. In order to have more than one color on several color forms. 24 colorplates were distributed throughout 16 forms. One form, the color form of the 14th sheet (pages 417 to 448) has all four colors. The color form of the 3rd sheet (pages 65 to 96) has three colors. All the others have either one or two colors. The four colors used —red, yellow, blue, and green —were selected as the ones that could be used to the best advantage in "dressing up" graphic charts. This necessitated colors that were strong enough to be used alone and that could also be combined effectively with others. Printing was done by Gray Photo-Offset Corporation, New York City. The following offset inks of The Fuchs & Lang Manufacturing Company, 100 Sixth Avenue. New York City, were used: Red NY-10876. Green # 4697-A6690. Yellow #41 Litho Ink, Blue #26 Litho Ink. Domino Black Litho Ink. The ink for the end paper was Fuchs fls Lang Offset Brown #60 Litho Ink. The paper was furnished by Mead Sales Company, New York City. It is Moist rite Offset 70 #. The paper for the end papers is Weycroft Ivory 100 #, manufactured by W. C. Hamilton dt Sons, Miquon, Pennsylvania. The illustration for the end papers was redrawn from a photostat of the original, measuring 195^" x 11". The topical index (1st half on page 1. 2nd half on page 247), should be noted. The tabs on the pages of the book were planned to overlap in order to give a large thumb space and yet divide the topical index into only two parts. Bleed-outs on the outside edge of the pages were eliminated in order not to conflict with the tabs. The flexible covers are Red #700 Fabrikoid. The stamping on the backbone and front cover is in Peerless Gold Leaf. The book was bound in 16-page signatures in order that the pages would open as flat as possible. The color lines at the top and bottom of the pages were designed to differentiate the various chapters and to suggest possible borders for use by anyone reading this book. The effect of shading on the borders was secured on pages 34, 35, 42, 43, 92, and 93 and several others, by using Transograph Shading Film DT-60, manufactured by Transo- graph Corporation, 30 West 15th Street, New York City. Transograph Shading Film DT-60 was also used in the following charts: 47. 82B. 90A, and 366. The first letter of the first paragraph in many of the chapters is in one of the follow- ing forms: See Page 194 See Page 354 See Page 263 ^See Page 286 DOTS, cir 1^^ lENER T' base ma tm maps X he term "c [^^/)ne well When used in I 1 Interio divided into graphic distri applied. Syn photographs a ponent bars in numerical val The following type faces and sizes were used in this book: Credit Line —6 point Book- face, Title Line —10 point Vogue Bold, Comment—8 point Bookface. Text —12 point Bookface. The type was set on Intertype machines by Allied Typographers. Inc., New York City. 453
  388. 454 |l' illli ' illli 'U Chapter 54 From Lfttcrhrad

    of Shnrp AilvrilisiiiK ARrncy. Srattle. Wash. GRAPHIC CHARTS IN ADVERTISING l^ince graphic charts present an idea clearly and concisely, their use in advertising should be encouraged. The utility of graphic charts in advertising is clearly demonstrated in this chapter. REFERENCES Carlyle. Paul, and Guy Oring. Layouts and Letterheads, Mc- Graw-Hill Publishing Co., Inc., New York City, 1938. Kleppner, Otto, Advertising Procedure. Prentice-Hall, Inc., New York, 1938. O Yeah! Thp Elfctric Storaer Battery Comiiany. Phila- delphia. Pa. SCALE .4 A. The Use of 100% Bar Charts in Advertising. Success THE tmnwMl MW <rf Ac two coki liM m^iMMiii pntUM ot our awnf* cImm bcfo«v and *hn otcupvinf lh« w«rrho««» • Tlvr MOi* Mi«««a in*> «ri»oJ vom« houad u. • bu*knj oT ou. d~»i>. Tb« wcnMdoa no* drpcnd upon "t» n dt UwWiy pUiM»*d (o«. "nd M iliUiiiMch UUunL Ev«T fcoiu™ tkM long «udr •W «H>"- «nn h» pnxn piodl.hU lo ihc cWm • put imo ihc buUnf. ln«*«T\ti«ddtnKih*f*nonr, ormort. .fluiid. iMMinJ idrM dr*»to|»«l (f\«n thr tlirni". Bl niwvlN*TU |S« you«ndono br«r».»h*n wni Ihnk of h>t«n( u—. ~ c.|»»ding. lK.n con-* Moorcs 6 Dunford 744 Finl National bulk CKicago.Ill. Moorcs & DunforH. ChicaRO, III. SCALE .3 B. A Proportion Connparison. Since the figures in each individual case would differ, these bars have no scale, but their heights indicate the comparison. The ratio is about 19 to 7. Ill Illli Illli l|||l III
  389. Il" .III. "Ill" .III. "Il GRAPHIC CHARTS IN ADVERTISING '^^^

    The Story Of Three Little Minks This Little Mink Went to Joeclcel lome This Little Mink Stayed at H« lis Little Mink Got too Much Heat and now there is only ONE JAECKEL Fur Storage costs no more than ordinary storage and protects you against every risk Telephone BRyant 9-8720 and w will tall for your furs iimtfdiatmly Jacckcl Fur Storagr. New York. SCALE .6 Graphic Narrative. This simple graphic narrative which was printed in a small folder tells its story convincingly, chiefly because of the use of the illustrations. Ill Mill iih, iiiii III
  390. 456 GRAPHIC PRESENTATION Stevrni Hotel, Chicago, III. A Guide Map.

    Note that just enough points of interest are given on this map to locate the hotel SCALE .6
  391. GRAPHIC CHARTS IN ADVERTISING 457 WHY Any lO-Year Old Locomotive

    is inadequate WHAT HAS HAPPENED TO HORSE POWE R 19 14 475 H. P. p«f drivinf •«!( 192 4 575 H. P. p«r drivinf txlc WHAT HAS HAPPFNED TO FUEL CONSUMPTION 19 3 4- OVER 1,000 H. P. p«r drivinj axU 19 14 6^ LBS. COAL p«r drawbar koncpowar 1924 5 LBS. COAL par drawbar kortapowar 19 34- A 3 LBS. OR LESS par drawbar hooapew* DO rapid has been the advance of locomotive design that not a single locomotive in this country over ten years old can begin to hold its own with the really up-to-date power plant on wheels known as the Super-Power locomotive. LIMA LOCOMOTIVE WORKS JNCORPORATED Lima Locomotive Works Inc.. Lima. Ohio. SCALE .6 Volume Representations.
  392. Il" .III. "Ill" .III. "Il GRAPHIC CHARTS IN ADVERTISING 459

    LOOK TO TOUR SALES MILEAGE Tha topmott map npnaunit America at il }ooka when ttattt are drawn in proportion to butintu trantacfed. Mulual'i •//ectiV* covera0« cu«a (tbown ia bJack) twtlh doubJe in tarmt of tola* — quick yardttick of productive broadcoMting. In th* concsntrated area east oi the Missiuippi valley, 40% of the country's square mileage yields 80% of the nation's business (and encircles 78% of the nation's radio listeners). Here, deep in Mutual territory, is by far the richest sale* mileage in America. The Mutual Broadcasting System is the only ma)or network deliberately organized for low-cost coverage of this highly profitable area. Mutual is the only network whose basic stations are all of super-power and whose station locations oMiure freedom from costly over-lapping coverage. The resulting economies, for coverage of the richest sales mileage in America, explain why advertisers use Mutual, bcih alone and in conjunction with other network activities— why 47 sales-scientists in the past nine $1,180,722 in Mutual facilities nths have invested And Mutual expands at a touch. You may enlist as many, or as few, extra stations as you may require for sales em- phasis or market extension. We shall be glad to tell you of resuIlM achieved by clients who have looked to Mutual for Males mileage . . . Costs? Mutual's comprehensive planning makes available these low basic rates un|}aralleled in major network history: One half hour night for 52 weeks $90,000 Five quarter hours day for 26 weeks .... S75,000 Three quarter hours night for 13 weeks . . $50,000 One half hour night for 13 weeks $25,000 THE MUTUAL BROADCASTING America's Newest Major Network 8TSTEM orricss! cmcaoo. tsisumi Towts-wair • DITSOIT WIIIDSOS. SADIO S T * T I O C X 1 W IIW Tots 1440 SOADWAT-I BOSTON. TANKIl N I T W O S K S • ClMCIMMATI. SADIO STATIOM WLW riTTSSUSOH. SAOIO STATIOM WCAi I Thr Mutual BroadcastinK Syttrm. A Comparison of a Distorted Map and an Actual Map. SCALE .6 III Mill iill, illli III
  393. 460 GRAPHIC PRESENTATION Why Your Electric Light Bills Vary The

    Rruoci Wkr RmmWdIi^ Lifhtinc Bdli ar« Higher ia December Uutn in June People Ute EJectric Light Nearly Four and One Half Time* a* Long in December a* Tliey Do in June Thii chart divides the 24 hours of a day into three periods —the period of ileep, the period of using Elcctnc Light and the period of dajrlight Public Service Company of Northern Illinois. SCALE .5 A. A Component Part Chart. UPHILL— WITH DOWNHILL SPEED! Bakers'Helper TMi FIRST @ Bakers' Helper, Chicago. III. B. A Growth Curve. SCALE .5 BUSH TERMINAL UnlaUUh^ Its a CITY — An Induttriol dty whar* monufacturart ond dltttibuton can cut cost* In hoH orvd wh«r« ainclanclM multiphr MrfM o^porfvnHtM IkjO Bush Terminal IS not o butldmg ' ^ onyWior* than N«wYork iio ilreel. Imogin* t«n millon iquar« fa*! of floor sooc* devoted completely to the mon- ufacture, warehousing and distribution of m«rchondise M you find it difficult to picture that much floor tpac*. Ihmk of it OS a twenty-foot itrlp of ttoor that would r»och o hun- dred milM. 6wth Terminol is not a building but a city of butldingi . Not ordi- nory loftt - but new types of (ndustnol buildings They may w«llb«call«dtndustri- al oparimenl houses, for they provide economies ond conveniences for man- ufacturing or distributing merchandise thai ore OS carefully planned and exe- cuted as the economiesond convenien ces of your dwelling oportment house To tell all the story of Bush Terminol would be to tell hundreds of stories about hundreds of prominent manufac- turers and distributors who hove used Bush Mom <«»Ii *nd »w*fc w»r«w* M^i and »roill« efficiency or enlarged soles. ond efficie You ore interested only In your busi- There is no ness — your economies — your efficien- your request cies and your enlarged soles. Bush billty we will Terminal momtams a staff of industrial engineers who ore conjtontly fitting Bush Terminal facili- iies to individuol and specific needs. Why not talk obout your business to one Bush T« neel hundreds of real problems. In each of these instances the re- sults were economy. of these trained men, and lei us help you determine the eitent to which you can effect economy THESE Wdl KNOWN nOOOCTS ore monufoctured or wore- hovied ot— or distributed from Bush Tenninol cxMirms •nCNNUT COffff f sncn • tiur oirvis Mt MOMTI cofm Miaoiss kAnffus ncy cost, no obligotion. At but on Our own responti- conduct o free Industriol Survey of your business. If our suggestions ore of volue. adopt them. if you wish tf not. discard them. wRiTCKMDcscarTnn liKtATUtf on Mon. ufacture Ware- housing or Oistrlbu- hon or set o lime at which a Bush BUSH TERMINAL COMPANY MelropolDon (ocililiei for DISTRIBUTION. WAREHOUSING AND MANUFACTURING Ixaoitlva Offkaat 100 tread Str*«t, Naw York P<eri, Sldingt. Worehouwi, Truck Depot and Monufocturiog loflt on New Yofi Boy ndut ot exper moy trierview you Bush Terminal Company. New York City. C. An Inverse Relationship Curve.
  394. GRAPHIC CHARTS IN ADVERTISING 461 5 we're y^/there's been a

    DEPRESSION H. LONE^ST. ytt «rel Hcrr'n why. FalliniE mIct ^hakr people up. They're willing lo ilo thinf:* differenlly. They'll liolen lo new, Mlen-buildini; ideati. ir« actually a prat time to iarf;e ahead. Some of our cuctomer* have been doinf; ju*t that. Ilerr'n how: Bv cnrrjul rrarardi lhr> dLwttr the nmifor nrt tfUing poinu in thrir product. Thr> re- dniffi. fTr arr aiked /or nru and more al- troctifr finiahn. A hntrr pmdurt rtnrrffa. And a SELLS — tUs today! Of course buaineM ri|;ht now i« not all it mi(:ht be. But you thould aee the unall order* pour- in|[ in here! They're Mmple», really . . . Ki- peninent» . . . Progrnal There are good times and belter aalea ahead (or thoac people who are thmkinf out and wnrkinf out belter way* of finixhinf; their pniductt. .\re you |;oing lo |tel your *h»rr in the next periocl of prosperity? Will vtju he glad for the drprcMiion? Maybe we can help you to be. Call in tlie nearest Kgyptian man and gel his advice. No obligation, of course. It may lum the tide for vou. "Kpyptian Lacquer" in listnl in the phone boiiku of the following cilien: \rHNTA
  395. 462 ||| .III. iiii .III. Ill GRAPHIC PRESENTATION lii4UA«»0ll« Si

    Louit WkhltA Clevb Albl*4v«fQiiC Wlmlow iwiiimiiiuiiiiimiiuiimiiiiimmiimiimiiimiiiiiiiuiiiiiii . I » I ( I « II .nBimnniHHiinmnuiiimiim uwimniiiimDiimiuumuiiiimiiiiiiiiiiiiiiiiuhinpim^^^ Airports —A Market EVERYTHING that goes up has to come down. So airports are quite essentia! to the aviation industry. But if you think of an airport as a nice muddy field olTering a soft landing spot for airplanes, or even if you know what an airport really looks like, you ought to be interested in the accompanying chart. It shows the progress made on a baker's dozen of flying fields undertaken by mu- nicipalities or ijrivate airport operators. A glance at this chart should convince almost any manufacturer that the airport is a field —not a muddy field, but a field for his products —perhaps a field which he has completely overlooked in his search for new markets. Reproduced from "Plane Talk", which is published by Transcontinental Air Transport, Incorporated, the chart shows the various steps all the way from selec- tion of site to completed airport. And it gives more than an inkling of the airport's demands from the manufacturer. Inci- dentally, when all the units can be shown in black TAT will bepn operations. Are you, as a maker of equipment adapted to airports, missing any bets? Transcontinrntnl and Writtrn Air. Inc.. N. Y. C. SCALE .7 A Progress Chart. Seldom does one find a chart as complicated as this in an advertisement. This one was found in a technical journal. Ill l|||l lllh lllll III
  396. |l> .III. Mil' .ill. Ill GRAPHIC CHARTS IN ADVERTISING 463

    TME TREND TODAY IS TO GAS fF AjiJL FOR BROODING CHICKS Amrrican Gai Assn., Nrw York City. Two Methods of Presenting the Same Trend Curve for DifFerent Types of Advertising. The curve at the top was used as part of an advertisement for promoting the use of gas for brooding chicks. The one at the bottom was used in a beauty shop "ad." BLACKBOARDS Blackboards may be used to display graphic charts. White blackboards on which black chalk is used are now available. Swinging panels and easel blackboards also aid in exhibiting infor- mation. Sources: New York Silicate Book Slate Company, New York City. Weber Costello Company, Chicago, Illinois. White Blackboard Company. Elgin. Illinois. Bulletin boards are especially useful since material may be tacked up temporarily. Two manufacturers of bulletin board material are; Armstrong Cork Company, Inc., Lancaster. Pennsylvania. The Celotex Corporation, Chicago. Illinois. I III i||l> illii illli ill
  397. 464 Chapter 55 QUANTITATIVE CARTOONS raphic charts may be used

    effectively in cartoons. REFERENCES Briggs, How to Draw Cartoons, Harper edition, 1926. Garden City edition, 1937. Byrnes, Gene, How to Draw Comics and Commercial Art, Bridg- man, Pelham, New York, 1939. Thorndike, Chuck, The Secrets of Cartooning, House of Little Books, New York, 1936. Thorndike, Chuck, The Art of Cartooning, House of Little Books, New York, 1937. 95.104 ALL ACCIDENTAL DEATHS /attm.s pate (Kl THK OMITtO STA,TtS 99,300 96.258 1928 1929 1950 American Mutual Liability Insurance Co., Boiton. 1911 I9S2 The Safety Movement Sawing OfF Accidental Deaths in the United States.
  398. QUANTITATIVE CARTOONS 465 "During this period ire couldn^t even afford

    ireic" Copyricht. April 1938. by E»quire-Coronet, Inc. A New Low. SCALE .7
  399. 466 GRAPHIC PRESENTATION fe 7 e 9 lO n 11

    13 14 13 It) 17 16 19 20 11 22 2J 24 GOOD A BAD AWFUL I vV-
  400. QUANTITATIVE CARTOONS 467 Jtttt iround iKc co<ntt Thf Nfw Yorkrr

    A. The Search for Prosperity. SCALE 7 too 90 80 xlO acSO >40 30 zo ^ y I i Sufficiency-Curve- a I 10 HAi.rL»AD' Bkcu B. A "Sufficiency" Curve i» 20 •Puu. LoAl' 30 'Ovt>.L«A»'
  401. 468 GRAPHIC PRESENTATION The Professional "Liberar New York Herald Tribune,

    Cartooniit —Darling. SCALE .8 How Our Dollar Would Look If Indirect Taxes Were Actually Removed.
  402. QUANTITATIVE CARTOONS 469 I New York World-Tflegram, Cartoonist —WiU B.

    Johnitone. Curves of Emotions. SCALE 9 The news item which accompanied this cartoon read: "Emotions mapped by new geography, charts of colored lines show likes and dislikes of individuals and groups for each other."
  403. 470 GRAPHIC PRESENTATION ^ ' — ' m Lifr SCALE

    .7 It's All in How You Look at a Thing.
  404. QUANTITATIVE CARTOONS 471 SPECIME.V AT THE WASHINGTON ZOO The Los

    Ansflfs Times —Cartoonist —Russell. A. Big and LiHie Business View With Alarm a New Species of Industrial Curve. PERPETUAL MOTION AT LAST
  405. QUANTITATIVE CARTOONS 473 INJURY FRE.QUENCY AND SEVERITY RATES IN ALL

    INDUSTRIES noiSKr. ^«»^*•^oo Axes^p;;^ 1924 1927 19 2& 1929 I930 H3I 1932 American Mutual Liability Insurance Co. , Boaton . A. A Carfoon Showing the Importance of Keeping the Lines Representing "Injury Frequency" and "Severity Rates" in Industry Close Together. sold anoth«r hcMiborg^r" ThJa Week, Cartoonist —Henry Boltinoff. B. The Use of Charts in ''Business." \
  406. GRAPHIC PRESENTATION "It's only a crack in the wall, but

    it looked so good I had a frame put around it" lawrfnce iari*r CoIIirr't Magazinr. The Efficiency Expert.
  407. Chapter 56 QUANTITATIVE POSTERS 475 LTHOUGH all the charts in

    this cliaptcr did not appear in their original form as posters, the ronstructiou and layf)Ut of the charts are such that tliey could be used as posters. REFERENCES Richmond. Leonard, The Technique of the Poster, Isaac Pitman & Sons. New York and London. 1M3.S. Sieel Workers and Families in the UNITED STATES UNITED STATES TOTAL POPULATION FRANCE GERMANY TOTAL POPULATION I TOTAL POPULATION TOTAL POPUUTION American Iron and Strcl Inttitutr. N. Y. C. A Quantitative Poster Showing a Comparison of Car Ownership in 1937. Quantitative material may be presented in posters with great success. Although the quan- titative presentation in this poster is not absolutely correct, the general idea that steel workers and families in the United States have more automobiles is easily obtained. I
  408. 476 GRAPHIC PRESENTATION UNDERWOOD ELLIOTT FISHER SUPPLIES Will Speed Your

    Business — and Reduce Cost COST of CO RtP P O N D E N C E 7int Qwalitif Ihbboiu & Garbons M)l*i PROVEN COST OF 1000 LETTEflS ^KtaHon ....WS.OO Shorthand 80.00 OuetheaJ 3 7.53 SMioneri^ 26.80 CMa,/,n<f 24.50 cFi/in^ 6.00 %Uons & Qarboru ...1.60 $301.63 This Chart Tells the Story - Look at It NOW! Underwood Elliott Fither Company. New York City. SCALE .6 A Building Used as a 100% Bar Chart. The danger in using a building for a 100% bar is that the eye compares volume as well as height. Thus while the height of the 41% area in this building is correct in rela- tion to the height of the 2 7% area, the volume of the first makes the proportion wrong.
  409. QUANTITATIVE POSTERS 477 •r«n4 IU^Mb.M United Statn Gypaum Co., Chicago.

    III. A Home Made Bulletin Giving a Connparison of the Accident Rates in Eighteen Mills in 1924.
  410. 478 GRAPHIC PRESENTATION IF an accident occurs while your car

    is traveling* under 4oMlLB$ AN HOUR there is onlyONt CHANCE (N 44 ffiat someoTie iviil be killed 4afi%. 6>ai^ «afiM^ ffiii^ SH^^ ^ip"^ fl*"^ <8ap«^ik 9P^^ Ir an accident occurs while your car is traveling- over 4o MILES AN hour there is ONE CHANCE IN 19 l/iat someone wi/l6ekilled . . • CT> . , a i DEATH /)ecrzns all\0/ Triivrlrr* Imtininrr CompHny. Hartford, Conn. SCALE .7 Death Begins at Forty. The combination of color with the automobiles and speedometer make this an effective method of presenting the idea that "death begins at forty."
  411. QUANTITATIVE POSTERS 470 DIVERTED FROM HIS«WAY TAXES IN 1937 Aiitomoliilr

    Manufarturrrs Association. New York. A. The Use of a Broken Dollar in a Poster to Indicate the Portion of the Dollar Which Was Diverted fronn Highway Taxes in 1937. HOW NEW VORK CITY U5ES ITS LAND BROOKLYN QUEENS \nOlilfeSIDeMTiML (iREATER NLW YORK RICHMOND \lttSIDlHTIPL ["|,|i ; V<»»yj /INQ CtMCTtnttS \ \ v»CANT t«Hb I The Nfw York Time*. B. How New York City Used Its Land in 1936. SCALE K
  412. 480 GRAPHIC PRESENTATION Ordiiuir>- and Kmcrftcnrv Nffd» That Call For

    an Outlay of Ten Billions Thi» Year and Six Billioae Next —The Rrvenues Expected, the Borrowing Required. an<l the F,ffm on the National Debt The New York Timet. A. Balancing the Budget for the Fiscal Years 1933-34 and 1934-35. SCALE .8 National Folk Festival Aitociation, Wathington. D. C. B. A Folk Festival Bulletin. SCALE .8 This map was used in various forms as an advertisement for the fifth annual Folk Festival held in Washington, D. C, in May 1938. Twenty-seven states participated.
  413. QUANTITATIVE POSTERS FARM PURCHASING POWER NEARS '29 TOP 481 The

    Chartmnkrrt. Nrw York Cily A. Farm Purchasing Power From 1929 Through 1937. SCALE .s ri Ainrn. Ill Iron ,..i,l Sl« < 1 InMiMilr NYC B. Educational Preparation of Steel Workers in 1938.
  414. 482 GRAPHIC PRESENTATION INCIUOINO THt HUMOROUS TRIOITION AND FEATURES OF

    ^ X jL K^^ JudRr iiikI Lifr Matsazinr. A Mountain Made Out of an Increase. A curve chart is easily imagined as a series of hills and valleys. By putting the points in a curve, a mountain can be formed as in this cartoon. The original of this cartoon was in colors.
  415. QUANTITATIVE POSTERS 483 THE SSZHRDAY EVJy Rrprodurrd by Sprcial Permission

    of The Saturday EvcninR Post. CopyriRht 1932. by The Curtis Publishing Company The New Year Forecasts the Future. At a time when the public is thinking in terms of increase or decrease of business, a car- toon utilizing curves attracts attention and carries meaning. This drawing capitalized on that fact. I
  416. 484 GRAPHIC PRESENTATION CHART OF ACCIDENTS cfown thisl/ne! Amrrican Mutual

    Liability Insurance Co., Boston, Mass. A Simple Curve Used in a Poster. The idea that curves represent man's actions is vividly portrayed here. According to correct procedure in a poster, there are few details given, and the lines are heavy. The original poster was in black, red, and white, and measured 11" by 17".
  417. QUANTITATIVE POSTERS 485 CHARLESTON THE PORT OF NO DELy^^^T. MINIMUM

    HOURS OF FOG PROXIMITV TO OPEN SEA STRATEGIC LOCATION HARBOR FREE FROM ICE SPECIAL.IZED SERVICE AN AVERAGE OF ONLY 38 MINUTE9 OF FOO PER DAY POR TEN YEARS o 30 MINUTES FROM BAR TO BETRTH .:di£i 1 I I I lO BO so rtro SHORTEST AVER- AGE OCEAN HAUL TO PRINCIPAI- KEY PORTS TO SHIP THROUGH CHARLESTON - 15 TO SHIP WITH EXPEDITION | Bureau of Forrign Trade and Port Development. Charle»(on, South Carolina. A Poster Used in a Campaign to Secure Greater Use of the Port of Charleiton, South Carolina.
  418. 486 'V'f.\ Chapter 57 DISPLAYS AND EXHIBITS fc—I — HEN

    properly planned, a display becomes a salesman for ^A/ its sponsor. The value of a good display is tested by its ,JE_?L-. ability to draw buyers to it and in turn tell them a complete and convincing sales story. Graphic charts make an effective tool to use as part of a display. Interesting problems in large scale displays were brought to the fore during the construction of exhibits at the New York World's Fair, 1939. The turntable in the Ford Building weighing 152 tons with its exhibit was so heavy that a major foundation problem was involved. The solution was to float the turntable on a circular moat filled with 20,000 gallons of water. The turntable is revolved by a two horsepower electric motor. The "futurama" of General Motors is the largest scale model animated diorama ever constructed. The 35,538 square-foot panorama is a conception of America and its highways in 1960 Gardner Display* Company, Pittsburgh. Pennsylvania. Mechanical Exhibit of the National Tube Company. This display tells how seamless pipe is pierced from solid steel. The rolling and piercing operation is shown in the center of the display.
  419. DISPLAYS AND EXHIBITS 487 Gardner Ditplayt Company, Pittsburgh. Pennsylvania. A.

    Scale Model of a Plant. This model of a Bethlehem Steel heat treating plant was built for industrial shows. A synchronized voice explains operations of the model. Gardnrr Displays Co.. Pittsburgh. Pennsylvania. B. Exhibit of the National Cash Register Company at the Business Show of 1938 in New York City. This small stage was six feet ten inches wide, six feet five inches high, and four feet seven inches deep. The characters were approximately twenty inches high. A sound mechanism controlled the action and voice of each of the five men. At the Business Show, an eight minute playlet was re-enacted. E
  420. 488 GRAPHIC PRESENTATION Factory Managemrnt and Maintenance. July 1938. SCALE

    .7 A. Big-Scale Model of the Plymouth Motor Corporation Plant at Detroit. Even drinking fountains are shown on the big board where Plymouth lays out to scale its 1,110,620 square feet of plant. New York Herald Tribune B. The Use of a Model Fighter to Familiarize British Students at the Royal Naval College, Dartmouth, with Sea Terms.
  421. DISPLAYS AND EXHIBITS 489 Luminous paint first used as a

    medium for magic is now being used by industry for display and exhibit purposes. At the New York World's Fair. 1939, this paint, which is luminous only under ultra-violet light, gives the effect of illumination in the night scene in the Perisphere. is on the stars and underground cable lines in the Consolidated Edison "City of Light" and illuminates the night scene in the General Motors Building. These are just a few of the many places at the Fair in which this ultra-violet paint has been applied. Sources: Stroblite Company. New York City Baltimore and Ohio Railway Company. Baltimorr. Md. SCALE .6 Photomural Covering the Entire Wall of the B. & O. Ticket OfRce and Travel Bureau in Rockefeller Center, New York City. 1. This picture is 35 feet long and 16 feet high. It was enlarged from a panoramic 20 inch negative and required 12 forty-inch strips, each strip 17 feet long in order to avoid horizontal seams. 2. The picture shows B. & O.'s streamline Royal Blue crossing Thomas Viaduct, nine miles west of Baltimore, on the route to Washington. In the foreground is the little "grasshopper" locomotive —the Atlantic (built in 1832) —hauling the Imlay coaches. I
  422. 490 GRAPHIC PRESENTATION A. Schedule Board. This display fixture is

    in production con- trol headquarters of the Pneumatic Scale Corporation, Ltd., Quincy, Massachusetts. Charts are lifted out by the production clerk for day-by-day posting. Factory Management and Maintenance, Febru- ary. 1938. SCALE .5 Installing photomurals in the Ford Rotunda building at Dearborn, Michigan —the largest photographs in the world. Kaufmann & Fabry Co., ChicaRo. B. Photomurals. SCALE 7 Photomurals are enormous photographic enlargements which are hung to walls much in the same manner as wall paper.
  423. DISPLAYS AND EXHIBITS 491 Mutlipl" Display Fixliirr Cnmpnny, St. Louis,

    Missouri. A. Wall Pivot Display. 1. This display fixture has twenty-four display surfaces, each with six-square feet of display area. Material may be either fastened to the board, with thumb-tacks or posted permanently. 2. Multiplex displays work on the principle of a loose-leaf book except that the swinging wing-panels are considerably larger. Material may be posted on each side. In this way charts, graphs, etc., are shown in full. They are smooth, flat, and always available for quick reference. 3. If necessary any display wing-panels may be removed from the fixture, taken to a desk where work may be done on the posted material. The entire display is easily returned to its place in the fixture. S|>rrdway Manufacturing Co . Cicrro. Illinois. B. Electric Motor Driven Turntables. 1. The turntable on the left operates on an A.C. line and has a five-pound capacity. The platform measures 11^". 2. The turntable on the right may be obtained for either A.C. or D.C., and has a 500-pound capacity. No platform is provided. 3. These tables may be used for every type of display. I
  424. 492 GRAPHIC PRESENTATION A. Battery-Driven Turntable. This turntable when equipped

    with three batteries will turn fifteen pounds of display material for 700 hours. The table has interchangeable discs, one 5' i" and the other 8'/a ". Flrisrhrr & Co.. and Aristo lm|>ort Co.. Inc. Nrw York City. Di-itritnitnrs Diorama Cori>oration of America. Long Island City. New York. B. Plastic Relief Map in the Exhibit of the Pan American Union at the New York World's Fair. 1939. 1. This map is constructed of transparent plastic, phenolic resin base, and is lighted from beneath. The map is made in twenty-nine individual panels, modeled from United States topographical maps. 2. The size of the map is 27 feet deep and 20 feet wide. It slopes from a height of 10 feet from the Canadian portion in the rear to 8 inches to South America in the fore- ground. 3. This map was designed to show primarily the interdependence of North and South America in regard to transportation and communication. 4. There is approximately six hundred feet of neon tubing, nine-tenths of which is under- neath the map. Over one hundred principal cities are shown by lights.
  425. DISPLAYS AND EXHIBITS 493 T«f tf lIHItll or* Iktl wrALL

    ^ Courtrty of RnymoncI Locwy. Drsicntr. Nrw York City. A. Sketch of the Service Exhibit of the Eastern Presidents' Conference Division of the American Association of Railroads, in the Railroad Building at the New York World's Fair. 1939. 1. This exhibit will be a graphic chart in the form of a huge mirror showing the decline of revenues in comparison with rising expenditures of the American Railroads. The following title will appear on the chart: "Revenues are constantly decreasing and taxes, wages, and overhead are constantly increasing." 2. Starting at 1922 a neon light will move to the right and up along the face of the chart up to 19.18. This line represents the increase in expenditures. When this line is completed, pictures will emerge from the back of the mirror in the sections marked "transparencies," showing the improvement in services on the railroads. 3. Following this the contrasting neon line will move down, and two "transparencies" will emerge on the face of the mirror —the comparison of old and new service. - • «
  426. 494 Chapter 58 DIORAMAS jJQl diorama is a life-like, three-dimensional

    representation in miniature. It is capable of reproducing any scene, sometimes em- ploying sound and motion. The general visual effect of a diorama is similar to that which the observer gets when looking in or out of a window onto the actual scene. A diorama, or a series of dioramas, is used principally as the focal point of an exhibit, such as a world's fair exhibit, traveling display, window or industrial museum. The M;irrhan(l Dinramn Cotji , Mt Vrrnon. N. Y. Diorama of the Columbia Steel Company, Subsidiary of the U. S. Steel Company, Under Construction in the Marchand Studio. This diorama was part of an exhibit at the Golden Gate Exposition in San Francisco.
  427. DIORAMAS 495 DIORAMA IN PLACE PLATE (3iLA$S LINE OF DIRECT

    IMAGE TUNNEL U S. Dfpnrlmcnt of Acricultiirc. Bureau of Public Ro;ul». A. Sketch Illustrating the Reflecting Device for the Historical Dissolving Diorama Exhibit Illustrating 400 Years of Highway Development in America from 1539 to 1939. Eacli of the dioramas is six I'nchcs in dcptli. To secure tlie apjiearance of a third dimension in tliis sniall space, the lin'ires were molded on the face of a curved piece of tin. Uniird Sl.ntct Stcrl Cori>oration. N< w Y.dk City. B. Chart in the Entrance of the United States Steel Subsidiaries' Exhibit at the New York World's Fair. 1939. 1. This chart shows tlie growth in the use of steel per capita in the United States from the time of George Washington. In 1789, the use per capita was one-half pound. In 19J9. the use per capita is 19,000 pounds or 9', j tons. 2. The indispensability of steel in modern times is the theme of the huge mural seen in the background. Thin sheets of steel were hammered into miniature buildings, bridges, tools, horses, tractors, streamliners, airplanes, and automobiles, and were mounted on a background of plain blue steel. I
  428. 496 GRAPHIC PRESENTATION Dioramas can be constructed to almost any

    size. The average would probably run between four and eight feet in length, two and four feet in depth, and four and eight feet in height. The depth, therefore, is usually half the length. About 3,600 dioramas including cut-outs, models, and other forms giving the three dimensional effect were used in exhibits at the New York World's Fair, 1939. The price range is from $50. to $150,000. Due probably to the impetus of business from the New York World's Fair, 1939. the diorama business has expanded tremen- dously. Two years ago there was one company specializing in diorama design and construction. Today there are twenty- five active in the field. J Consolidated Edison Company of New York, Inc. The "City of Light" Diorama at the New York World's Fair. 1939. 1. This diorama is the exhibit of the Consohdated Edison Company of New York. It is almost a city block long and is taller than a three-story building. Four thousand buildings with more than 130,000 lighted windows are included. An eight-foot space beneath the street level demonstrates the city's network of subways and electric, gas, and steam mains. 2. In the illustration above, the semi-circular wall of the building is quite apparent. It was especially constructed to house this diorama.
  429. Chapter 59 / 497 GRAPHIC CHARTS IN CONFERENCE ROOMS X

    he display characteristic of graphic charts makes them valuable for use in conference rooms. In some cases, the conference room is Automobilr Manufacturer* Association. Washington. D. C, "Automobile Facts." February 1939. The Use of a Pin Map fo Indicate Changing Tastes by States in Autonnoblle Colors Month by Month ih the United States. 1. Differences in color preferences over a period of time and in different sections make it necessary for color experts to study fashion trends in order to anticipate changing demand. 2. More than 40% of the New England drivers and only 16% of the motorists in the South- west elect black cars. 3. Light hues predominate in California, while Washington and Oregon go in for dark tones. 4. Blue is No. 1 choice in the prairie states, although black tops that color in the states immediately to the east. I
  430. 498 || || || GRAPHIC PRESENTATION constructed so that graphic

    charts may become a part of the gen- eral plan. In others, the display of graphic charts is made possible by means of lantern slide projectors. The display fixtures explained in the preceding chapter could well be used in any board room. Burroughs Adding Machine Co., N. Y. C, "The Burroughs Clearing House," September 1938. Board Room of the Bowery Savings Bank in New York City. 1. The wall maps show all sections where the Bowery Savings Bank has or will have real estate loans. 2. The projection machine shown in the lower photograph can throw enlarged photo- graphs, layouts, charts, and other pertinent information on a large screen placed at the far end of the room. 3. On the west wall of the room is a 35-foot photomural, an aerial photograph of J*4ew York City. ill li III
  431. GRAPHIC CHARTS IN CONFERENCE ROOMS ^^^ Nrw York Hrrnl.l Trituinr

    J.inuary 1 l<i.l A. Mayor F. H. LaGuardIa of New York City, and Dr. John L. Rice. Health Com- missioner, Before a Chart Showing New York City's Death Rate from 1898 to 1938. U S Drpartmrnt of Juiti.r Fnlrr.il Burrau of IiivcsliK^tioii B. John Edgar Hoover, Director of the Federal Bureau of Investigation, Before the Map of the United States on Which Are Tabbed the Location of the Bureau's Investigative Personnel. ill ill ill
  432. 500 GRAPHIC PRESENTATION Copyright by Harris and Ewing, Washington, D.

    C. A. Board Room of the New Federal Reserve Board Building in Washington, D. C. The star holders on the walls of this room and the charts that hang on them are a definite part of the decoration of the room. c^c:^o^c:^c:iC^c:sc^c^c^c^c^c^c^c^^^ ^ ^zp^^zp^^^zy^^z^^y^y^n^^ip^ip^y^zp^i? O B. Sketch of the Lay-out of the General Motors Conference Room Showing the Position of the Projector and Screen. The solid black line indicates the screen. The projector is directly behind the screen. Q c^ o Ci o c '^ O O C? C7 C. The Use of Projectors in Conference Rooms. The illustration shows the general lay-out for the use of a lantern slide projector in a conference room.
  433. 501 Chapter 60 GLOSSARY SINCE there has been little organized

    work on vocabulary, the wordings in this glossary should be considered as suggestions, and not in any way officially sanctioned. Absolute Bar Chart. —See component bar chart. Aerial Map. —A photograph or drawing giving a bird's-eye view of buildings, roads, trees, mountains, cities, etc. Area Bar Chart. —A bar chart in which at least one dimension is in percentages, resulting in a comparison of the areas of the sec- tions of the bar. Arithmetic Scale. —An amount scale on a grid with equal numerical values represented by equal special intervals. Band Chart. —See component curves chart. Bar Chart. —Presentation of data in the form of bars whose lengths and divisions indicate values. Bell Curve Chart. —A frequency chart in which the distribution assumes the shape of a bell. See frequency chart. Bilateral Bar Chart. —A bar chart in which the bars extend both above and below, or both to the left and to the right of, a common line. Bleed-Out —An illustration on a printed page which extends as far as the edge of the page, leaving no white space between the edge of the illustration and the edge of the page. Buck-Shot Chart. —See scatter chart. Carto^ram. —See statistical map. Chronology Chart. —The presentation of data with the emphasis on time rather than quantity or quality. Circle Chart. —Presentation of data in the form of a circle. The area may be proportional to the corresponding facts, or the circle may be divided into sectors. See sector chart. Classification Chart. —A chart in which facts, data, etc., are so ar- ranged that the place of each in relation to all is readily seen. Column Chart. —A bar chart in which the bars are arranged ver- tically. See bar chart.
  434. 502 GRAPHIC PRESENTATION Compound Bar Chart. —A bar chart with

    several contrasting bars. See bar chart. Component Bar Chart. —A bar chart in which each bar is divided into two or more parts. Component Curves Chart. —A curve chart in which the total is shown graphically divided into parts. Contour Map. —A map in which lines indicate the topography of the land. The contour method may also be used to show erosion, precipitation, climatic conditions, etc. Correlation Chart. —A chart showing degree and type of relation- ship between two variables, Cosmograph. —Trade name for a flow chart made from black and white strips of paper, and presenting numerical information or percentages. Crosshatched Map.—See statistical map. Cumulative Curve. —A curve in which each value, except the first which is zero, is a total or accumulation of all preceding values. Curve Chart —A chart in which a line is plotted on a grid. Dependent Variable. —The data presented in a chart or table which varies according to a change in the independent variable. The amount scale on a time curve chart is the dependent variable. Disc Chart. —See circle chart. Distorted Map.—A map in which the areas of states, countries, etc., are proportional to quantitative data. Divided Circle. —See sector chart. Dot Map.—See statistical map. Extrapolation. —Projection of the data beyond known points. Flow Chart. —Graphic representation of movements geographi- cally or through an organization or structure. Flow Map.—A map in which either or both qualitative and quan- titative flow of goods, persons, automobiles, etc., is shown. Form. —One side of a printed sheet. Frequency Chart. —A chart in either bar or curve chart form show- ing distribution of items according to kind, size, location, or time of occurrence. Gantt Chart. —A specialized type of production chart. See progress chart. Geneology Chart. —A chart used as a method of showing ancestry and heredity traits. Genetics Chart. —See geneology chart. Graphic Narrative. —A story told by means of pictures. Grid. —The surface or field composed of coordinate rulings on which data are plotted or graphed.
  435. __^^^^^__^—^-^— 503 GLOSSARY Guide Map. —A detailed map on which

    highways, railroad routes, or other methods of transportation are indicated together with cities, etc. Sec route map. Gun-Shot Chart. —See scatter chart. Halftone. —A method of reproducing on a printing plate the de- tails of a photograph, drawing, painting, etc.. including all the gradations of color. High- Low Chart. —A chart in which the difference between two curves is the center of interest. Independent Variable. —The data presented in a chart or table which does not vary because of some influence within the data. The time scale on a curve chart is the independent variable. Index Numbers Chart. —A chart in which all items are expressed as percentages relative to a base figure. Interpolation. —Process of locating data between two known points. Key. —See legend. Lag. —The condition that exists when two curves are not concur- rent, but one "lags" behind the other to some extent. Legend. —An explanation or identification of symbols, etc., used in a chart. Logarithmic Chart. —See ratio chart. Logarithmic Scale —A scale of numbers on a grid so arranged that the spacial intervals are proportional to the differences be- tween the logarithms of the numbers. Lorenz Chart. —A chart giving frequency distribution with both the variable and invariable quantities reduced to percentages. Both scales represent 100%. See frequency chart. Map Chart. —See statistical map. Moving Average Curve. —A curve in which each value is the aver- age for an overlapping period of time. A moving average for a period of time "centered" is the average for half the time before the specified date and half the time after the specified date. Moving Total Curve. —A curve in which each value is the total for an overlapping period of time. Ogive Chart. —A frequency distribution in which "more than" or "less than" data are presented. One scale of the grid repre- sents percentages and the other scale represents "more than" or "less than" values. See frequency chart. 10(P/o Band Chart. —See percentage curve chart.
  436. ^^"^ GRAPHIC PRESENTATION 100% Bar Chart. —A chart in which

    a single bar represents 100% and the divisions of the bar represent percentages of the whole. 100% Block Chart.— See 100% square chart. 100% Square Chart. —An area bar chart in which both dimensions are in percentages. See area bar chart. Organization Chart. —Graphic explanation of the structure of a business, government, school, or other unit of operation. Percentage Band Chart. —See percentage curve chart. Percentage Bar Chart. —See 100% bar chart. Percentage Curve Chart. —A component curve chart in which data is presented on the basis of 100%. See component curves chart. Pictogram. —See graphic narrative, and pictorial unit bar chart. Pictorial Map.—See statistical map. Pictorial Unit Bar Chart. —A bar chart in which comparisons are made by using a number of symbols, each of which repre- sents a specific value. Pie Chart. —See sector chart. Pin Map.—See statistical map. Plate. —The composition, whether zinc, lead, etc., which is used to make the printed impression on paper. Plotting (Plotted). —Placing a curve or other representations on a grid. Procedure Chart. —A time study by which procedure in production may be planned and recorded. See progress chart. Process Chart. —A time study by which production may be ana- lyzed, planned, and recorded. See progress chart. Production Control Chart. —A time study by which production may be planned, controlled, and recorded. See progress chart. Progress Chart. —A time study by which production and transpor- tation movements may be planned and recorded. Progressive Average Curve. —A curve in which each value is the average of all the items previously shown. Proportional Map.—See distorted map. Range Bar. —A bar form of high-low chart in which the range of prices of stocks or commodities may be indicated. See high- low chart. Rank Chart. —See rating chart. Rate-of -Change Chart. —See ratio chart. Rating Chart. —The presentation of the rank of items as deter- mined by the quantitative value of each item. Ratio Chart. —A curve chart in which the amount scale rather than an arithmetic scale is so spaced that a straight line diagonally
  437. GLOSSARY ^^^ across the grid represents a unitorni percentage increase

    or decrease. Relationship Chart. —A diagram in which facts, information, etc., are arranged to emphasize tlicir relation. Relative Bar Chart. —See 100% bar chart. Relief Map.—Map showing elevations and surface undulations of a geographical unit. Relief maps may also be used to present statistical data. Route Map. —A map on which point to point movements of ships, airplanes, railroads, electricity, etc.. are given. Scatter Chart. —A chart on which the data has been plotted or distributed as dots on a grid. Schedule Chart. —See progress chart. Screen. —A cross-lined screen, usually glass, through which copy is photographed for reproduction as a halftone. Sector Chart. —The presentation of data in the form of a circle divided so that each sector is proportional to the correspond- ing facts. Semi- Logarithmic Chart. —See ratio chart. Shot-Gun Chart. —See scatter chart. Signature. —A folded printed sheet ready to be assembled with other folded sheets to be bound together. A signature usually consists of 16 pages, but it may be 4, 8. 32, or even 64 pages. Stair Chart. —A chart in which a line plotted on a grid resembles stairs. Staircase Chart. —See stair chart. Statistical Map.—A map on which dots, circles, bars, curves, sym- bols, or crosshatchings have been placed to give the geographic location in accordance with statistical data. Tabulation. —The recording of statistical data in the form of tables. Three-Dimensional Chart. —A graphic presentation with three variables. Three-dimensional charts may be drawings in per- spective or models. Two- Directional Bar Chart. —See bilateral bar chart. Traffic Map.—A flow map showing the flow of automobiles or persons on streets and highways. See How map. Two-Way Bar Chart. —See bilateral bar chart. Zee Chart. —A curve chart presenting periodic (day, week, or month) data, cumulative data, and a moving total on one grid. The positions of the curves form a "Z."
  438. 506 INDEX ITO-ITT, 1<>0, 501 \t» lliU 350 1S6 15B.

    I'VJB, 302A 374B t21l>, 4JKA Ahlioll KJiiraliaiml Co. MX Abtoliilr har rhurl 301 Addrrtunnraiih Nf nil iicra|ili Ciirp. 434 Advrrli>iii|c rliarl . 454 -Idi .rtMinit «nd S.llint 331 Arra l>ar rliarl It<<l52. 501 Arrial: Map I'lioloKraph Agririilliiral Kroiininiri, Hiirraii <if Air brii»h Air rniitr map Alriandrr llaiiiillon Inililuir Allrfirdrr, Thro. & Son* Allrolor Co. Aniriiran A>>o<ialion of l.anditrapr Arrhili-rln 171, 235 Aiiirriran Anaorialion of Slair lliicliwav Ufficiali HVB Ami'riean .4 vitit ion .„ „ 167 Amvrican Hunint'n^ , ., 3HC Anirriran (.'ra>on Co. _____________ 370 Anirriraii Doriiiiiriilalion inaliliilr , 40<* Aiiirririiii (^aa .\»>»rialioii ___^ „. 463 Anirriruii (^i-nrlira A>»urjalioii S4B, 55 Anirriran Oonraphiral Sorirly of Nrw York . 153 Anirriran iron & SirrI Inatiluir 3IIA. 215A, 243. 475, 4H1 B .-Imciirrin Machinist , „ 1511 Anirriran Map Co. _ . . 154 Anirriran Miilual Liability Iniurancc Co 464. 473A, 4114 Anirriran I'rirolruiii IiiMi(.ulr _... 19SA Anirriran KollinK .Mill Co _ 10KB Anirriran SrhooU of Orirnlal Rrtrarch 170 .\iiirriran Sorirl> of .Mrrlianiral Knginrrri (.S«'i> also Timv .SiTii-j (hurls and Coniiiiilire on Kn|;inrrrinK and Srirnlifir (irapbil IIVA, 3lH Anirriran Slandarda Assorialioii (See Timv Svrivs Charts.) Anirriran Slalisliral Asaorialion 323. 325. 326. 333A Anirriran Trirphonr & Trirgraph Co. 21)1 Anirriran T>pr Kniindrrt • 439 Anirriran VI ritinit I'aprr Co 44)1 Anmlral t'lililisliini: & iSupply Co. 57 Arra bar rhart 149-152 Arra roiiiparison (.Si't- ofjo Area bar charl)_ASA, 23H. 457 Aritio Iniporl Co. ..492A Arkin. Hrrbrrt .._ 24,370 Arniilrung Cork Co> Arnold, Bion J. Art Oa^on Co, Aloiii rharl .. ._ Auilralia, Conininnwrallh Autoniobilr Maiiiifarlurrri 117B 74A. 223 - - 370 52A. 52B 159 2HB. 94A. 9H. /4u(ornurirc lndu$lrie» Atrraitr Monnn . _ PruKmiirc Aviation Avrri. Dr. F.dward A. A»rri, I.ronard I'. _ Aiiniulhal projrctioit . Attorialioit 02B. 131A. 29BA. 349A. 479A. *V - SO A. 299 A 107 B 209, 2116, 28HB. 2»9. 291 B. 503 . 2H6. 2HHA .. 45 425 86A, 2SH, 273, 303 B . 176 B & Sont 421' Bainbridgr, Cbarirt T Bahvr,' Helper 460B Balliniorr li Ohio Railway Co. 4H9 Band rharl JOl lOOCc 294. 297B. 503 Bar rhart 106-114, IIS-120. 363. 364. 464. 501 Abiolule 501 Arra 149.152.501 Bilalrral _ 142-14)1. 501 Column , 106. 501 (.niiiponrnl Conip d Ciiiiiiilativr Madr on t>pi 100% 99, 132-141. 2VI. Ml 502 _ _ _ _ 94B 377 51, HH. 92-97. 9)1-105. 123A. 12HA 132. I37A. 139A. 144B, I45A. 152, 294. 297B. 454A, 460A, 476. 504 200 207 _ - 121-131. 211. 365, .504 . 505 2«SA. 2H5H, 504 505 Kriiiforrriiirnti Snivllir-srwrd Stamping %irr«lilrhrd Bint-linm. Kichmond F.- Rinnrv & .Smith Co. Birrrn. Kabrr BitiiKi, I'rrrv A. BIrrd-oul Blork claasifiratioii rhart Blork rnl: l.iliolriiiii Wood Blork diiiKruill Bolicinoff .24, 3098, 333B, 334, 335, 370 370 427, 42)1 : 340 501 49, 50A. 50B Bullun, Joseph R. Borgia map .„ Boston Gtohe Bowrn, M. I.. BoMrrt SavinRt Bank... Bowman, Isaiah ___ Brad>, Dornthy S. __ Brrak-rvrn rhart BrrMrr-tlanlrlnio Co. . Briggs Brinton. Vlillard C 415 415 356B 473B 259A 153 29 B 359R 49)1 162A 323 32HB 451 464 .24, 49, 74B, 124A, 161. 1H6. 192B, 254, 261. 28HA. 293A, 327, 370 Brooks, Biirlrigh 397 K, 397 F Brown. Arthur, & Brolhert 419 Hro«n. Brrtrand . 123A, 124B. 12HA Brown. Throdorr H. 24, 309B. 333B. 334. 335, 370 Burk-shol rharl Burraii of Agrirullurul F.ronomict ,, Burrau of Chrmistr> & Soils Burrau of horrigii Trade k Horl Oovelopmcnl, Charlr.tun, S. C. Burrau of I'ublir Koadt 501 160 160 Burrau o( Krclaiiiation - Burn. Walter P.. & Attociatei Burns 485 ...160. 495 A 156 _242. 401 A 319B
  439. INDEX 507 lllirrouilAf ('Irniinn //out Riiih Trrniinal i.o. Rwiiri. (irnr

    California Job eai* C.inrra Conlai _ - _ ('iirlii Color Sroiil Drvin Tricolor i.rira l.inhof I'rrfu Holl»i(l»« 4Mi(: 4.1S Sprrd («raphir Trirolor Candid ('anirra Corp.—_ — Car!>U, I'aiil Carnrnir Inililiilr of WaihlngtOB- CarlrrS Ink Co, , Cartoiirani ^_—_______ Carlooni. c|iianlilalivo Carlwriithl. Milli H. Caiital rrlalionthip Critiiloid (°orp. - .. .., 397.104 .lOTC ^'^:^ ______ 397 K j«:b 397 K .i<)7n —— ^ .'"H .197 R 4.VI .1S3, 3S6A. .1S9R 427A SOI _______ 464^ 474 4.19 _27S. 282 A. 211)1 R 36H 24 109, Crnlral Statitliral Board (Srr frHrral Charl Book.) Chaddofk. H. K. Chanibrr of Coiunirrrr of llir United Stale* (Thainpinn I'apcr ft F'ihrr (^o. ^_^ 44H Chan, iiiiinrilioni for making 367 1110 Chartmakrri _ _. _ _ 4H1A Chatr National Bank 284B. 330B, 332R, 340 Chrniiilrv ft Soilt. Bureau IftO Chirano Cardboard Co. . 422 Chifago ^rl^un.• 121. 265A. 26SB. 276B Chirano U hrri & Manufacluriog Co. .-. - 372 Chroma (Sre aho Color) 424D. 425C. 427B Chronolony chart 248-255. 501 Churchill Fnitinrrring Corp. 145B. ISO Cincinnati. Ohio. City Manager _ 38B. 65, I25A Circle chart {See also Sector Chart).. On map . .- . - — Civilian ConierTation Corp» _ Clark. Victor M.. and Staff Clark. Wallace _ Clarification chart Block Coait A Geodetic Surrojr Codeii Book Co. ColUrr$ Color _ _ Color*blind .~__«^_.^_.^.. 251. 501 194-199 61 493 B 262 43-52. 501 _ .49, SOA. SOB 156. 1511 56A. 367 . 474 Collon Preti — Colton. Raymond R. Columbia Steel Co.— Column chart —^ -418. 419. 423-428. 453 ^ 426 414. 439. 443 24. 370 494 106, 501 439 Commercial Engraving Publithing Co. Committee on Engineering and Scientific Graphs 381. 40HA, 40HB. 40HC Committee on Standards for Graphic Pretentalion (Srf Timr Srriet Chartt.) Commonwealth Editon Co. 3S4 Component Bar chart 99. 132-141, 294, 502 Curve chaH 294-300, 393. 502 Compound bar chart 502 Compotile chart .- 16fl-.16A Conference roomi. chart! 497-500 Coniolidated Editon Co 496 Contai camera „ .^.^__^______^__^____^-_- ._ 397C Contimotie Salei Co. 407A Contour map 231-237. 502 Control chart (S«« aiao Pro(r*(» chart) S04 Cornell. Grace 427 A Corpi of Engineora . . 156 Correlation *•>*'' Cotmograph - Covert {Srr alto Binding) Cewden. Dudley J. .. _ Coihead. Balph C. Corp. Craftint .Manufacturing C*.. Oayont — Crotthatched nap Creiihatching iSrt alto Skadinf). CroM-teclien paper . . 320-330. 502 73. 7IA. 788. 79. 80A. 80B. 502 451. 453 24. 286 379 419 - - 370 .17S-18«. 270. 502 USA. 178 367 lionietrir Halin Tri...«..l«r r»....lM.«lr (rn.lnii. Irr.lrnrk \. Cruiii, Vlilliuin 1.. (Mininlalivr : Bar chart Curve chart 2T! lrr<|Hrnr> chart Srrlnr chart Ciirlia Color Seoul Camera Curlii. Thoniai S.. Laboratory CurtK I'ubliihing Co. Curxr chart .- .- 1S7B 168 A 159A 21. 286 24 Hrll Coiiipariinni (!iinipnnent Cnrrrlalinn Cumulative l-"Tri|Urnf > CiintI 9tB 279, 281A. 126. H9A. S02 111. 1JJA 91 198 B 198 B 483 261 159. 502 310. 501 275 293 . . 294 300. 391. S02 _ . _ 320 3.10. 502 27S. 279, 28IA. 326. 349A. 502 ._ 310 319. 502 256 262.502 275. 276B. 285 A. 28SB. 104B. 503 lligl. lov Index number*- .1148, 142. 301 109, 347B, 361. 164. 503 l.nreni 331338.503 Moving averaga^ 209. 286. 288B. 289. 291 B. 503 Moving total S03 Ogive 331 118. 501 On map 208-210.261.274 Percentage .. — 504 I'ronrenive averag* 286. 28BA. 504 Ratio 339-353. 504 Cul-nut letter! 37S Darling ___—^_- Dartnell Corp DaiKco Product! Co. Da\i>. Harvey N.-.- , , „ — Da». E. ¥ Decker. Richard Denniton. Henry S. — Drnniton Manufacturing Co.. Dependent variable Detroit Ediion Co Deviation De\in Colorgraph Co_ Devin Tricolor camera.. Dick. A. B.. Co _ -2398 _ 429 -398 _ 34 -4M8 333A 371 .263, S02 3S$8 Diel<|ten. Eugene. Co.. Diniensioni Diorama Corp. ... Diorama! , Disc chart _________ Displays -.^ Dislorird map Ditto. Inc. Divided circle Divine, J. J.. A!!ociate!, In Diton. Joseph. Crucible Co.. Donnant. D. F Dot map ... -. .. Draeger. Lawrence W. Drawing: Roard . Instrtiiiient! Pencils .142. 2718. 324 398A 39HA .432A. 433A 368A. 369A 384 4928 494-496 _ . . . - 502 __293B. 486-493, 497 238-242. 459. 502 429 SOS 169 369B. 370 81 1H7-I93. S02 41S _42eA -369A _369B Dunn. Charle! _ 466A Dun's Review— 116A. I17A. 141A. 141B. USA. 282B. 287C. 297B, 120. 344. 147B. 458 Duplicating machine (.See alto Reproduction) 429 IHipont De Neiiiour!, E. I., t Co. 368 Durost. Walter 3S Eagle Pencil Co. . Eastern Air l.inet Eastern Railroad 370. 372 163A 91. 491A Eastman Kodak Co. _ -368. 399A, 401. 40SA. 40SB. 40SC Eberhard Kaber Pencil Co. 370.372 Kronon.ic rixht price 14S8, ISO Edition binding .. , 4S0 Educational Eihibilion Co. . 1S4. 193. 367. 368 Egyptian l.ari|uer Manufacturing C*. .. 461 ElrrlrUal Borld 239 A. 366 Electric Storage Batlerx Compaajr- Elrttroniet —__ -73. 25S. 4S4A -S8. 263. 347A I
  440. 508 GRAPHIC PRESENTATION al Walcb C*. r.lrrlrnltpi KUin N.I VMlr

    l»pr Knii-nt. Brooks Knrtrlopriiia Anirrirar Knfiinfrrtng K' Mining EnfinrfriniL .V*>u-i Hrro tZl .IThR SI. 20A IS.1. IS4. ISS IIH. I.1H. 3(iO HSB, IhbB. JS4B. 261 2V1A, .137 KnKinrrririK & Srirnlinr (^rapha. Coinniillrr .IHl, 40KA 40HB. 40H(: 372 46S S3, S4A 122 4H6 493 S02 Kratrrt F.tquirr-C.oronvl. Iiir. Kiigrniri KrroriJ Office F.vant, 11 . Sanford ^ . _ _ KihibiU {S,-i- alto Diaplayt) Kklrapolalinn _____ Faclory f'attotj hi annfrmvnt it 257 Miiinlrnanev H2B, K3A, H3B. H7, 134B. 4HHA, 4<»0A Frdrral Riirraii of ln\ rtliftalion 4<'4B Fnd^ral Chan Hook 03A4. <>3A. 938. 93C. 270. 296B. 305 Frdrral I'oxrr Coniiiiittion 3SA. 97, 173B Frdrral Rr.rrvr Board SOOA Frdrral Krtrrvr. Nrw York lOhA, I I4B, 132A. I32B. 142, 269A. 2HSA, 2HSB. 2H7A, 2H7B. 3hlB, SOOA Firld. R. M. 6«A, 6HB. 72. 144A Film (Sfr Canirra.) Kodarhronir ._ 399 Fir»l National Bank of Botloa 179A Fithrr, Ir\ing 340 Fi.alivr 420A Flat binding 4S| FIritrhrr A Co. 492A Florrnrr, I*. Sargent _ S5 Flow charl 73-80. 215-230. 502 Flow map 216 230, 502 Foiiir, F. P 37B. 250, 2SI F'olnirr (>raflrs Food Industiift Foolnotr Ford Motor Co. Forrst Srrvirr .. F'orm (Si-e alio Printing) Forlunr Magazine Frrnch fur\r F'rr€|iirncv : BrII charl Curvr chart ^ Diilribiition . Fri.brr. Ira N. Fuchi & I.ang Manufacturing Co> FunkhouBcr, Gray H ...____ 397D 47 _ 104 160. 490B 156 453. 502 .30.94B, 177 B 369A 310 310-319. 502 _101. 11». IKO _24. 263. 292 453 24 « Co. Ilalllonr llaniillon ManliraclnrinK Co lUtiiillon. \l . C. S Son*.. Ilaininrrniill Paper Co.. Maniniond. C. S., & Co. Ilarri< & Kwing lla.kril. Allan C. Ilrrlograph llrlinhnllr Mrrrdity chart . ._ . „ llrring . Iliggint, Charlr High-low chart Hink«, A. K. Iliilorical map Hoch. Frrd W. Holdrn. Arthur C. (loovrr. John Kdgar //oik.' and Gardvn Hubbard. Hrnrt I). Hiir (». «/«o Color) Hiirricanr niap^ Htdrographir : Map ... Office 113. 416. 417. 419. 420A. 503 438 453 44H 154 SOOA 24. 370 432 B 423 3S6A 423 . 371 27S. 276B. 28SA. 2IISB. 304B. 503 _ _ _ .. _ 204. 205 435 141 _ _ 499B _ _ 31 2. S2A. S2B 42SA. 427 B 218 Hypotrnuir rectangle _ 156 ._ 156 _ 384 I Illustration board. Wolman 421 llliislralions. prrparation ._ 417-422 Impo.ilion (S... aUo Rinding) 450. 4S2A Ind.pendrnI variable _ „ 263.503 Index numbers 1 14R. 142. 301-309, 347B. 363, 364. 503 India ink . 371 Induslrinl & En^int'vrinf Ckrmittry _. 71 Industrial Mana^vmenl .^. ._ 63B Ind-itlrial Tape Corporation .. 371 I nk 373 India . 371 Intrrit (>'<>«• aho Binding) 450 Inlaglio printing . 435. 437. 44IC International Boundary Coniniiltion . _ - 156 International Businrst Machinrt Corp. 40. 7KA. 7HB. 79, HOA. KOB. 377. 37K Intrrnalional Printing Ink Corp 42S. 427B. 42HA Intrrpolation 503 Inlerty pe : Corporation 436 Machine 436 Inverse rrlalionahip 282A. 460C Iron Age- i76A. 350 Isometric 356B Paper 3S7B Protractor 3S7A Gantt chart Cantt. Henry I. Gardner Dinplai Co. Gelatine duplicating machine- Grnrology chart Grnrolngical charl theet General Klertric Co. ___ General I. and Office Genetici churl ._: Geographic map Geologic map Geological Survey Georgian Bay CanaL Grrard. Dave __^_______ Glotiary _ _ Goldrn Gair Fxpoiilion Coodyrar Tirr & Rubber Co.. GoTrrnmrnt mapi Gradr chart, pencil Grafa-lone Co. .. Grain {Sfv alto Paper) Graphic narralite __ Gravure printing Gray. RumcII T.. Inc. Grid Guide map Gulick. I.ulher .._- Gun-thol chart __ 256, 262, 502 262 ...486. 487 A. 487 B . 429 53-58. 502 56A. 57 472 156 S3-S8. 502 156 156 155 122 y2 501-505 494 266A _1SS. 1S6. 160 369B 419 444 2S-32. 455. 502 44 1 C 72. 471 _ 383. 386. 502 .161-169. 456. 503 62, 70 503 Jaeckrl Fur Storage- Johnston. W. IJ.. Jr>. Jonas. S. Theo ^ Jones. Victor O. H. .3S6B. 3S7A. 469 32 29B (;. Kaplan. A. I). KarMen. Karl Kaufmann & Fabry Co.. Krisry Co. KruflTel & F.iier Krp . Map -. KIrppner. Otto KnorpprI, Charlei E_ Kodachrome film Kodak Koh-I-Noor Pencil Co.- Konig 325. 326 24. 263. 286. 343. 370 490B . _ 376A .156. 357B. 3S9A. 36HB, 372. 373 3028. 394. 503 155 421. 454 262 399 398 370 423 HackrInian. Charles W.. I.add-Franklin lag l.at.iiardia. Fiiirello H. I.anslon Monotype Machine Co.. I.anlern slides ______^__ l.a Rose. K. S. l.aughlin. Harry H. Legend _______^__^____ __. 394 423 .276A. 503 499A —437. 438 405-409 329A 356A _302B. 503
  441. INDEX l.rttt Camrr* Manual I. rill. y.. lat. .- -

    l.rrov trllrrinf prn* l.rtlrr. Ilrnr* M. IVni I'halnirnphK l.rllrrpmi prinlin( l.rllrtt, riilniil Lihrtly Maiiaiinr Uh Uima l.c»romolivr H orkt, Inr. I.inhof mmrra l.inolriint lilork I.inolM'' l.tlrrary IttfrtI l.ilhoKraphrri Nalional AMfxialion, Inr. I.ilhniiraphir prinlinn Lilhonraphir Trrliniral Koiindalton i.ilhnprini Compant of Nrx York, Inr. lor«.<. KawKond l.anarilhtiiir tralr .^_^____,_ l.orrni rharl -_____^ l.orrni. M. O. _ Lo* Angrlri: Timrt _^____^___^ I'nion Railroad SlalioB ^—^____^_ l.uckirth. Malthrw _^____ Luminoui paini ^____ . J9:a 404 -IOTA t::. \:\ 404. 400 .riA 3H0 LIS. 44 1 375 2f> 4T0 4s: .1<»7K 4IS 4.16 39A. :.w 437 436 437 433 B 4<»3A S03 331 33H, S03 337 471 -402A. 40JR 42H 489 MarFlwrr & Crandall. In< Marhinr labiilalion Manaiinr of Ball Strrrt- Magnilirr - Manninic, barren H Map: Arrial Air route .^_^^______ Ba>r Chart {Sem mlto Statiatical map). Contour Crot>halche<l Diilorted Dot - . Flow 131 40 .114A. 304A. 30IIB - 41 1 171. 23S Crographic Crologic _ Cuidr - _ Hitlorical . Hurricane .160. 170. 177. SOI 1S6 1S4 S03 - _ 231-237. S02 _17»-1H6. 270. S02 -23H-242. 4SV, S02 _ 1K7-193. S02 216-230. S02 1S6 . 1S6 H«droKraphie Information OBrt Kr. Mraturinic device „ Mechanical inlrnailjr ihadiiiC- Navigation Orangr-pecl Pictorial Pin . a_ Pro)rrlien (See Prajection.) Proporlional . S04 Relief 170-177. 492B. SOS Route 161-169. SOS Statistical 1S3-242. SOS Topographic . _ _ _ . „ 1S6. ISS. 233A TralSr i02B. 219. 222. 223. 224A. 224B, 127. 229. SOS « rather 216A. 216B. 217A. 21H. 232A. 232B. 233B. 234A. 236 161-169. 4S6. S03 204. 20S 218 1S6 ISS ISS 1S6 182B . 1S6 . 1S8 .167. 168. 169. 480B. S04 -187-193, 497. 499B. S04 With bar chart Uilh circle chart Hilh curre chart —— Vilh lector chart , «ilh xmboli Marchand Diorama ^'^ Market batkrt Marki. Lionel S Maitarhuietli inttiiiHa af Tccboalagy Maswell Mead Corp. ^_ _ Mechanical inlenaitjr (kadioc aap Median _ _ . Mcrcator, Ccrardaa 200-207 194-199 196. 197. 2t8-210. 263. 274 194-199 211 2IS 494 J65A. 26SB 39B 1S2 423 -443. 446. 44a. 4S3 IM2B 120. USA ISS Merralnr prnjeelion Mrrediin I'uliliihin* « • Mrlropniilan I ifr III. Ill Mirrnfiln, Mllr.. Kll..e1l \ Mllinn ll.a.llr. I n Mlii.rnir.pl, ni.rhinr Ml>l<eo.c..pe Minite.ftia Mining and Maiiiifariiinitg ( Miniieatila \'alle% (ianning Lniiipati* Mixioippi Hirer Conimiiiinn Monol%pe Mnnianin Chemiril < Moore, i Dnnfor.! Morgan. « ilbr.l l> MnlioM I'irli.rr S,rr.,. Moving average Moting loUl Mlldgell. Briire I). Mnllihlh Multiple Atii eharl Mulliplei Diiplat V,Mu{r Co Miintell. A. II. Mutual Rroailratling (^o. N National Aanociilinn nf (>i>l ArroiinlanI National Amocialiun nf Motor Bui t)p nf Com 4H. S9A, I9B, !IN. 2Hb. 2HhB. 2H9, 2V| rralori ISS I23B S93B 4«« 4)6 i:iR <):a 43JA 171 ISA IS6 437 3hH l-.tB 1. 109 io:<; B. S03 S03 IS. 16 411 10^ B I9IA ;i. 427 4S9 329A 1H2A 2HIB. 286 I90A 4h:b 133B. 27S 480B 32IA Nalinnal Anlnmnbile Chaiiih Nalional Ca.h Kegiiler Cn. Nalional Kdiiralional Aiinrialion Nalinnal Ke*li\al Aiioeialinn Nalinnal Kleelric Light Aiioeialinn Nalinnal Induilrial Conference Bnard III. 119. 146. 117. ISl. 107. 363. 364 Nalinnal Reinurrei Bnard {Sri- alio Ffd>-ral (hart :S. 95. I27B. 110. 16t. 1(,S. l(.hA. 168. 174. 175. 1114. 1H5. 1»H. IW. JIO. 214. 219, 222, 234A. 267. 291B Conwiiilire (Sv National Re- Uook) Nalinnal Reiniircei iniircei Bnard.) Nalinnal Machine Tool Buildrri Aitocialion 493B Nalinnal Tube Co. 486 Naiion't Hutin.,, ._ 466A Navigation map ^ _ 156 Na% igalinnal rharl 1S6 New Jerse\ Deparlmenl of Indilulioni and Agencies 316 New Jeriev Stale Planning Bnard—. 179B New York Building Congrei. 141 New York Cilv Tunnel Aulhnrily 404A. 404B New Y'nrk l'!niplo«ing Prinleri Aiincialion. Inc. 43S New York Federal Heierve lOhA. lUB. I32A, 132B. 112. 269A. 2H5A. 2K5B. 2«7B. 291A. 301A. 30IB. 309A. 36IB New Ynrk H.rald Trihunr _ 41. 43. 1H3A. 2HSC. 46«, 488A. 499A New Ynrk Journal & Amrriean 29A New York Tim.-, 63A. 479B. 480A New York K orldTvlrtram _ 469 New York World'i Fair. 1939 60. 1S9. 207. 279. 29JB. 330A. 492B. 49JA. 495B. 496 466B. 467A 423 3S6B. 3S7A ^7 IB XM Nr'U- Yorker . Newinn Nnlan. T. V Normal, deviation from Nnrnial trend _ — Norlh Jerie> Transit Coniniiitiaa _ J27 OKre of Indian AITairt Olfiel Gravure Corp. OITiet Ink ^ Printing Ogden. r. K. Dgive rharl I00<~^ band chart I00<~( bar chart 32 453 436 26 331 33H, S03 .91. 297 8. S03 51. 88. 92 lOS. 123A. IJ«A. 132. 137A. 139A. 144B. USA. 152. 294. 297B. 4&4A. 560A. S04 Stamp lOCf block chart 100<^ Kjuare chart , _ _ Opacil. (.See alto PaM^)- Optical illuaion 9* 149. 152. S04 .149. IS2. 3*4 444 314
  442. 510 GRAPHIC PRESENTATION Orsn|tr-prrl map ^. Organifilion rharl — .

    Oring. Guy Orthonraphic projeclion- Orlhological Inilitule Odwald ISH ^9-67, 16S, S04 - 4S4 1S4 27 427 Projrrlart {Svv alio l.anlrrn tlidrt) I'rnofrcadrr't niark> . Proportional map „ ____________ I'rolrarlor Itonirlric Public Srrvicr Company of Norlhrrn lllinoit 49H. SOOB, 500C 442 S04 36«B 357A 4bOA Pacific Cat I KIcclric Co. ______________ 3SSA Paprr: Colored 371 Croii-irclion (Sra alio Croi(>icclion paper) 367 Machine - 443 Prriturr bulkrr 444 Sclrclion of - 443-448 L'lilily - . . 367 Paragon Rrvolutr Corporation 411 Paiadrna, California, City Managrr 'i)>, 2<>H Palton. AI«on C. „ _. _. .. . Jl Paullin. Charlri O^ IS3, 204. 205 Pa^nr Fund _ 27 P»ai». C. v.. Co 430.431 Prdigrrr chart (Sur aUo Grneology and Cenetict chartt) 43 Pencil lengthjti^r , J70 Pen. ruling 374B Prrcrntagr chart Band chart Bar chart . Curve chart „ Perfei camera ^94, 29HA 504 504 504 397 B 444 35H _ 35 B I'erkint. B. ¥., & Son*, Inc. Peroiio. I.uigi _. . Philadelphia Evi-ning Bullvlin .— Photo-Kngraveri Board of Trade 416, 417 Photoengra\ ing _. __ „ - 421 Photograph, initrucliont for handling 412. 413 Photomontage 401A Photoniural 498, 490B. 49H Pica type ..376B Piclogram 504 Pictorial chart n4A. 457. 461 Bar charl. 121-131.211.365,504 Map 167. 168. 169. 4H0B. 504 Pie chart 504 Pike, E. W.. ft Company 411 A Pin 192B. 193 Map -- _ 187-193,497.4996.504 Planographic printing Platet [Sff alto Printing)..- Playfair. William Plotting „ Plymouth Motor Corp. Pneumatic Scale Corp., Ltd.. Pogue. Joieph E, Polyconic projection Potter Products. Inc. Potleri. quanlilative- Power Prinler'§ Printing _ Cravure Intaglio /nik. ~43S. 436, 44 IB 504 81. 26bB 504 488A 490A .2848, 330B, 332B. 340 - . 155 371. 375 _ 475-478 86B ..242. 259A 435-442 Letterpreii Lithographic _J OITiet Planographic ._ Preii, portable- Relief Rologravure Probability paper Procedure rhmrt Proceii chart ___________________ Product Enfinevring ______________ Production control chart _ ._.._.__._ Production Yearbook {Set Collen Preil.) Profit graph _ ._. Progreai chart .^_____.___ Progreitive «v»>«g« Protection: Aiiniuthal Map Mercator -_________^_____ 437. 441C _43S, 437. 441C 435. 441 A 436 . 436 _435. 436. 44 IB - 376A 435, 441 A 437 333 B. 338 504 504 i69B 504 ^56-262. 462, 504 _ 286, 288A, 504 Orthographic Polyconic Stercographic 176 171 155 154 155 1S4 Quantitative cartooni Quantitative pottert Rai«i, Krwin _ Rand McNally & Co„ Range bar chart — Rank chart _ — Rale-of-change chart- Rating charl Ratio chart _. ._.. Paper - — — _ — — Reading, Kngland. County Borough of.- Kediciit Letter Co. Reducing glatft - .^-__« Reference symbol _______ Regenaleinrr (]orp. Re^ionul Plan .Association .^-___ Reiiiforcemrntt (St-e alto Binding).-— Relationship charl _ Relative liar charl 464-474 475-478 .153. 231. 238 154 JMSA, 2fl5B. 361 B. 504 504 504 .3h: 129 375 410 , 305 Relief Map Relief printing ____________ Reproduction, methodt Rriifu of Wniru'j Rhode.. Henri J. Rice. John I Richardson. Arthur H Richmond, Leonard ______ Higgleman. John R Risl, Charles ._ ' Roberts, Wridon, Rubber Co_ Rolleiflex camera — Root-two Ross, Charles *J., Co. ________^ Rotogravure printing ____________ Route map Royal Statistical Society of London.. Rubber cement Ruling: Horizontal ________________ _441A, 44IB. 44 1 C 184. 202B 450 68-72. 505 505 .170-177. 492B. 505 441A. 435 429 434 342 B 436 499A 381 475 24, 263. 292 283 ^ 372 397 K 384 420A .161-169. 505 358 368 Vertical Salva \tnnnf(nntg»wai Sampling Sargent, Walter Sasco Photo Products Saturday t'.vtninft Pott Scucheri, .Mario and Mabel- Seale Broken _ ______ 382. 383. 389. 391 -127A, 135A. 173 178. 1H7 428 For area of circle Time 407 B 483 404 385 387 194 392 41 IB .320. 321A, 321B. 505 3SXB 505 Scaling copy _____ Scatter chart Schairer. J. F .. Schedule charl Science Service, Inc. Screen Seattle Star .._______ Sector chart ..._______ ('umulative Made on typewriter- On map .. 194-199 Senii-logarilhmic chart ^ 505 Shading (^rr ufso Halftone and Crosshatching) 98. 100. 116, 180. 186. 278A. 278B. 3S0, 380, 420B. 421. 422 Shading film 419 Shaw Blue Print Machine Co. 431 Shew hart. W. A 381 ._271B. 409 505 _ 183B -81-91, 363. 505 91 378 Shot-gun charl Signature (.See alto PrinllBg). Simondt, Frank __— _ Sinclair, Prior. —___^_.^____ Slide rule U20, SOS SOS _ . 206 _ . 328B 41 IB
  443. INDEX 511 Smith, I.. C, T»pr»«rilrr Cu. Smilh. «. II.

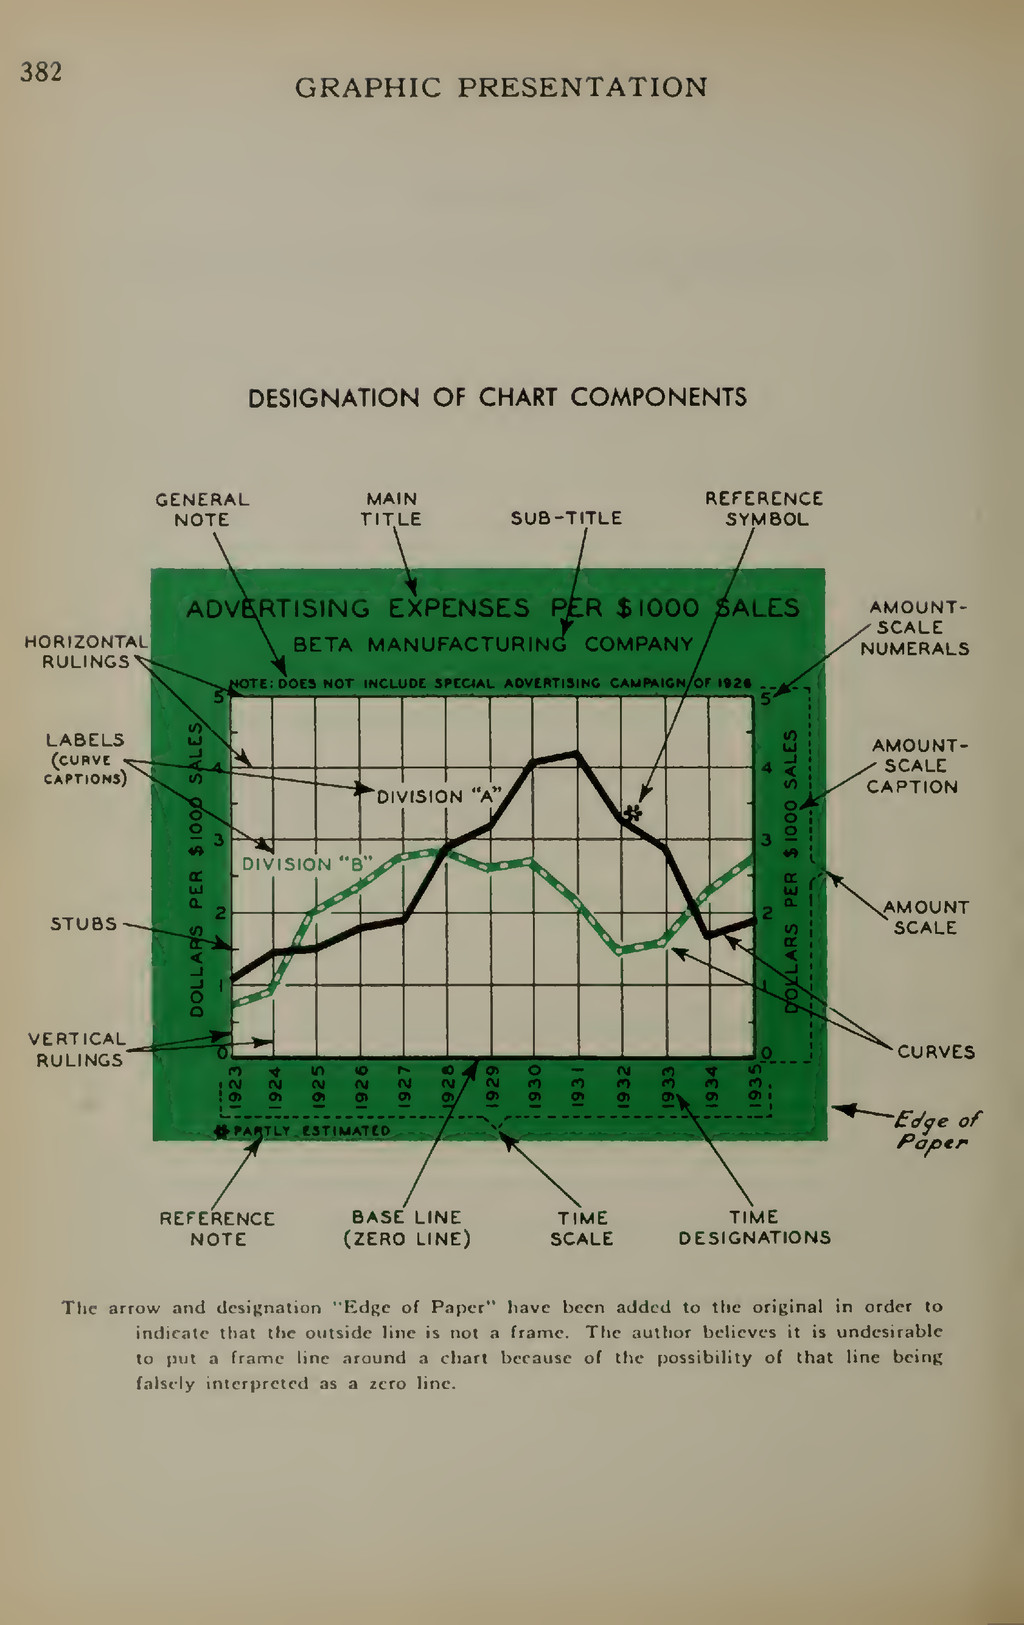
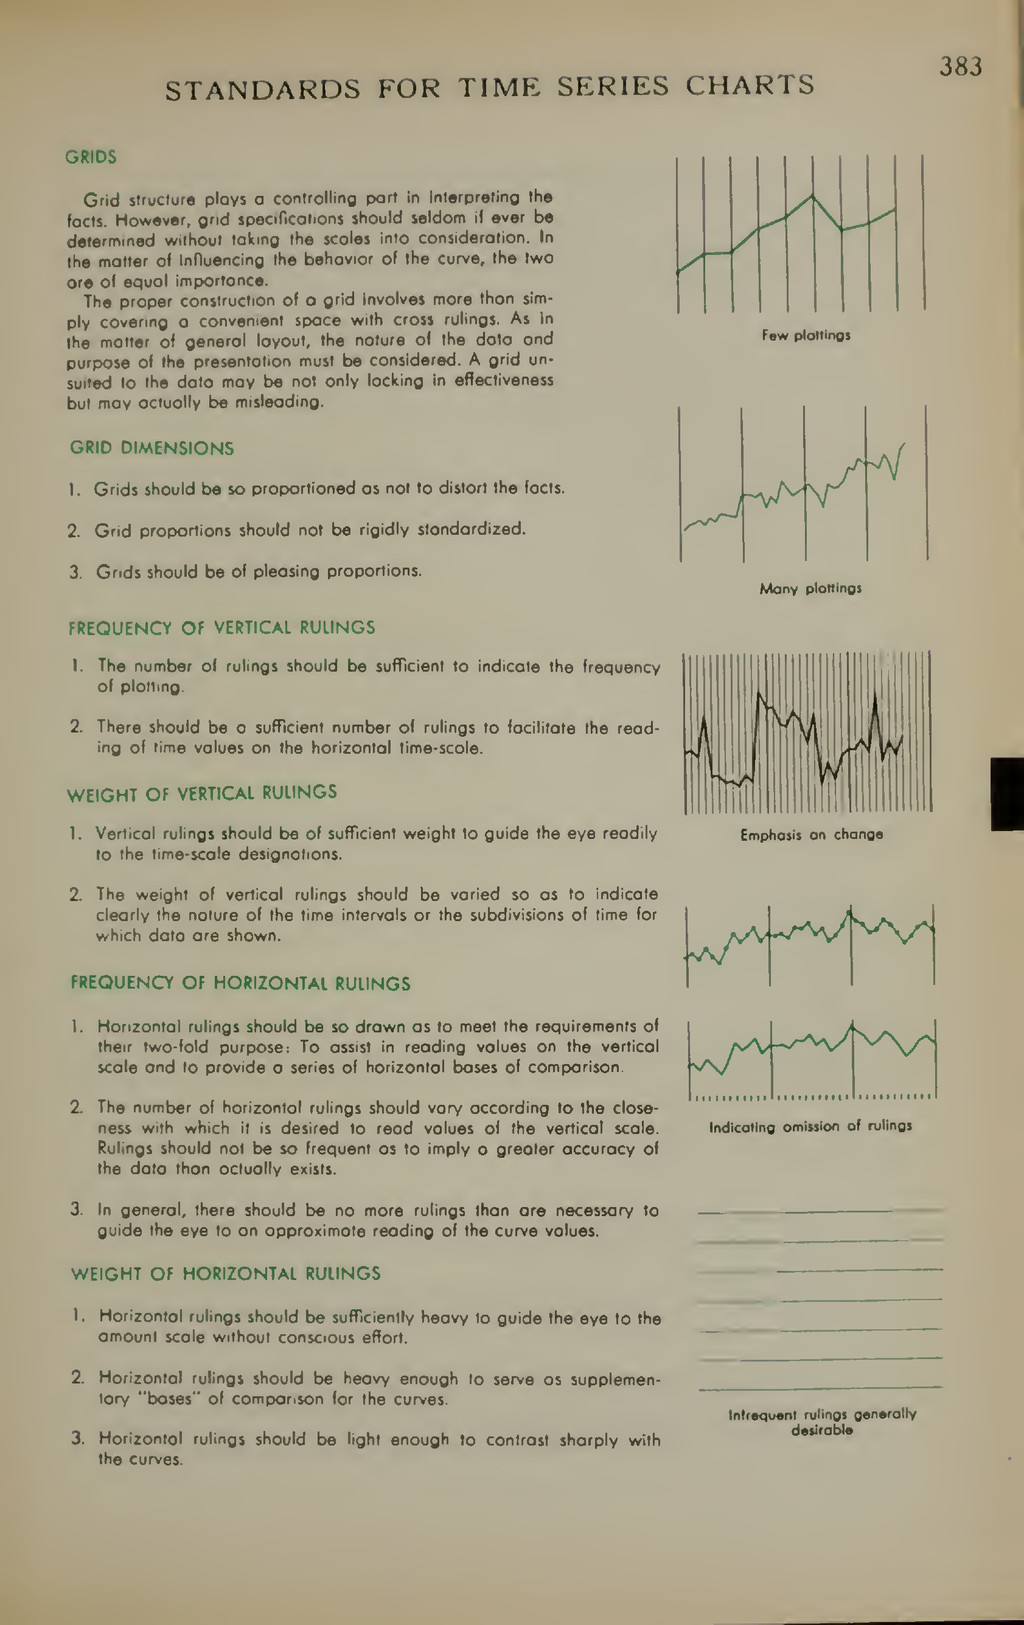
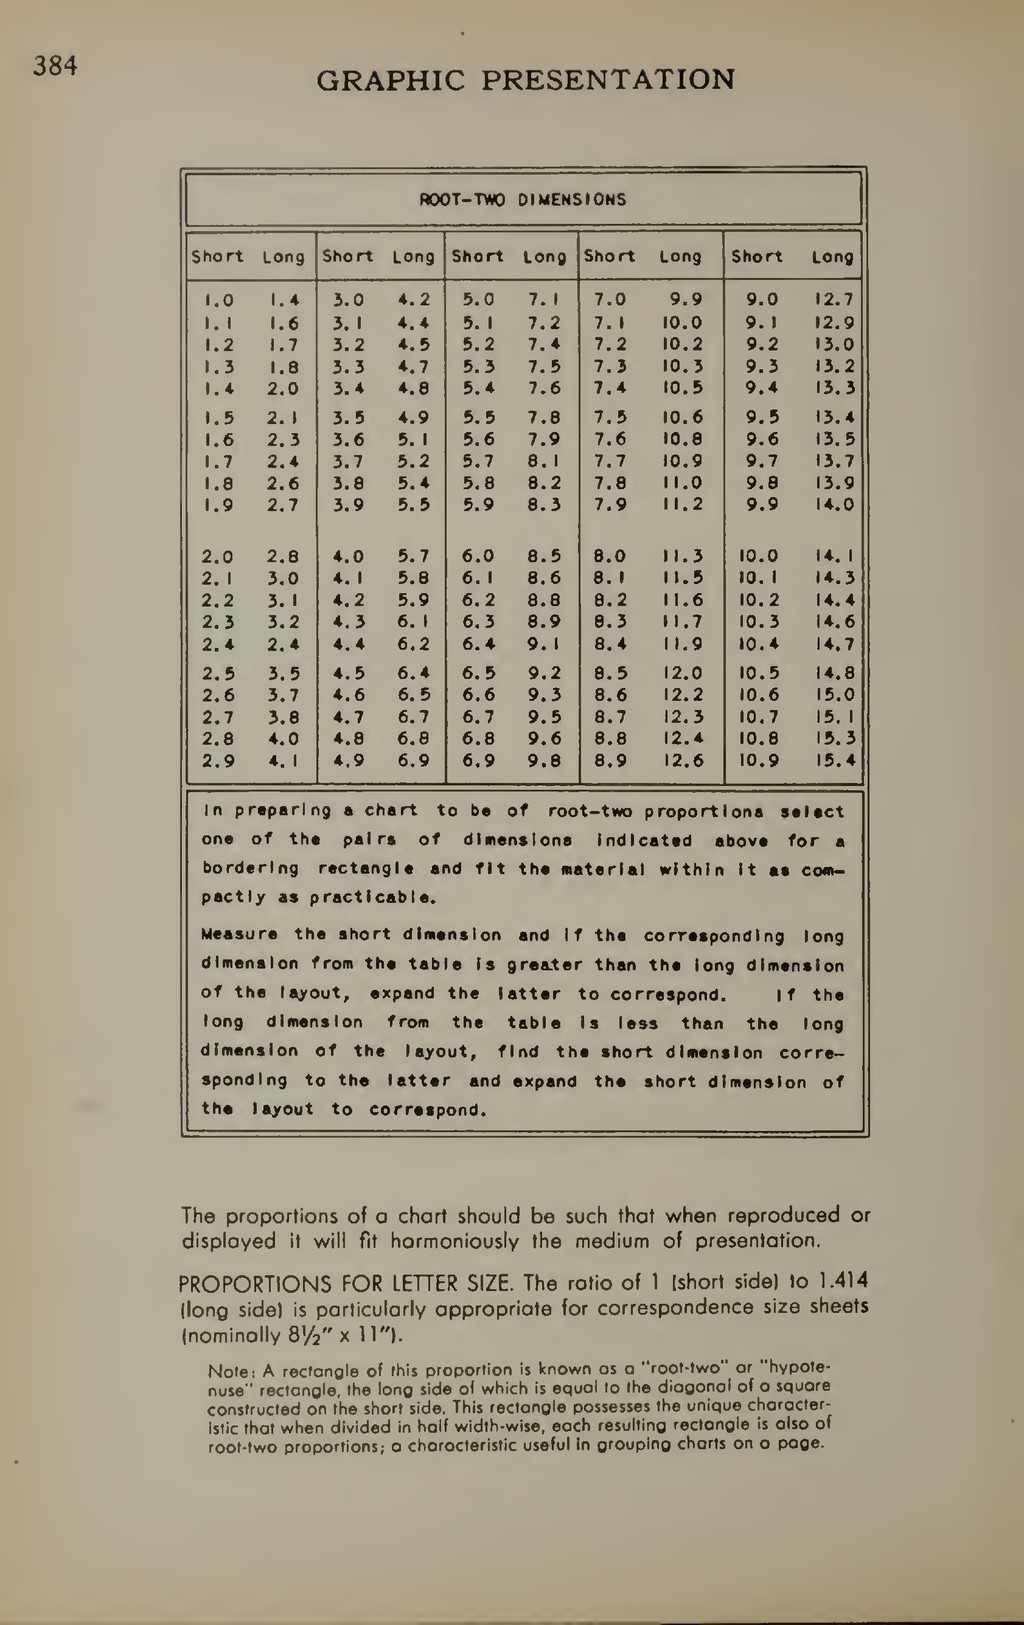
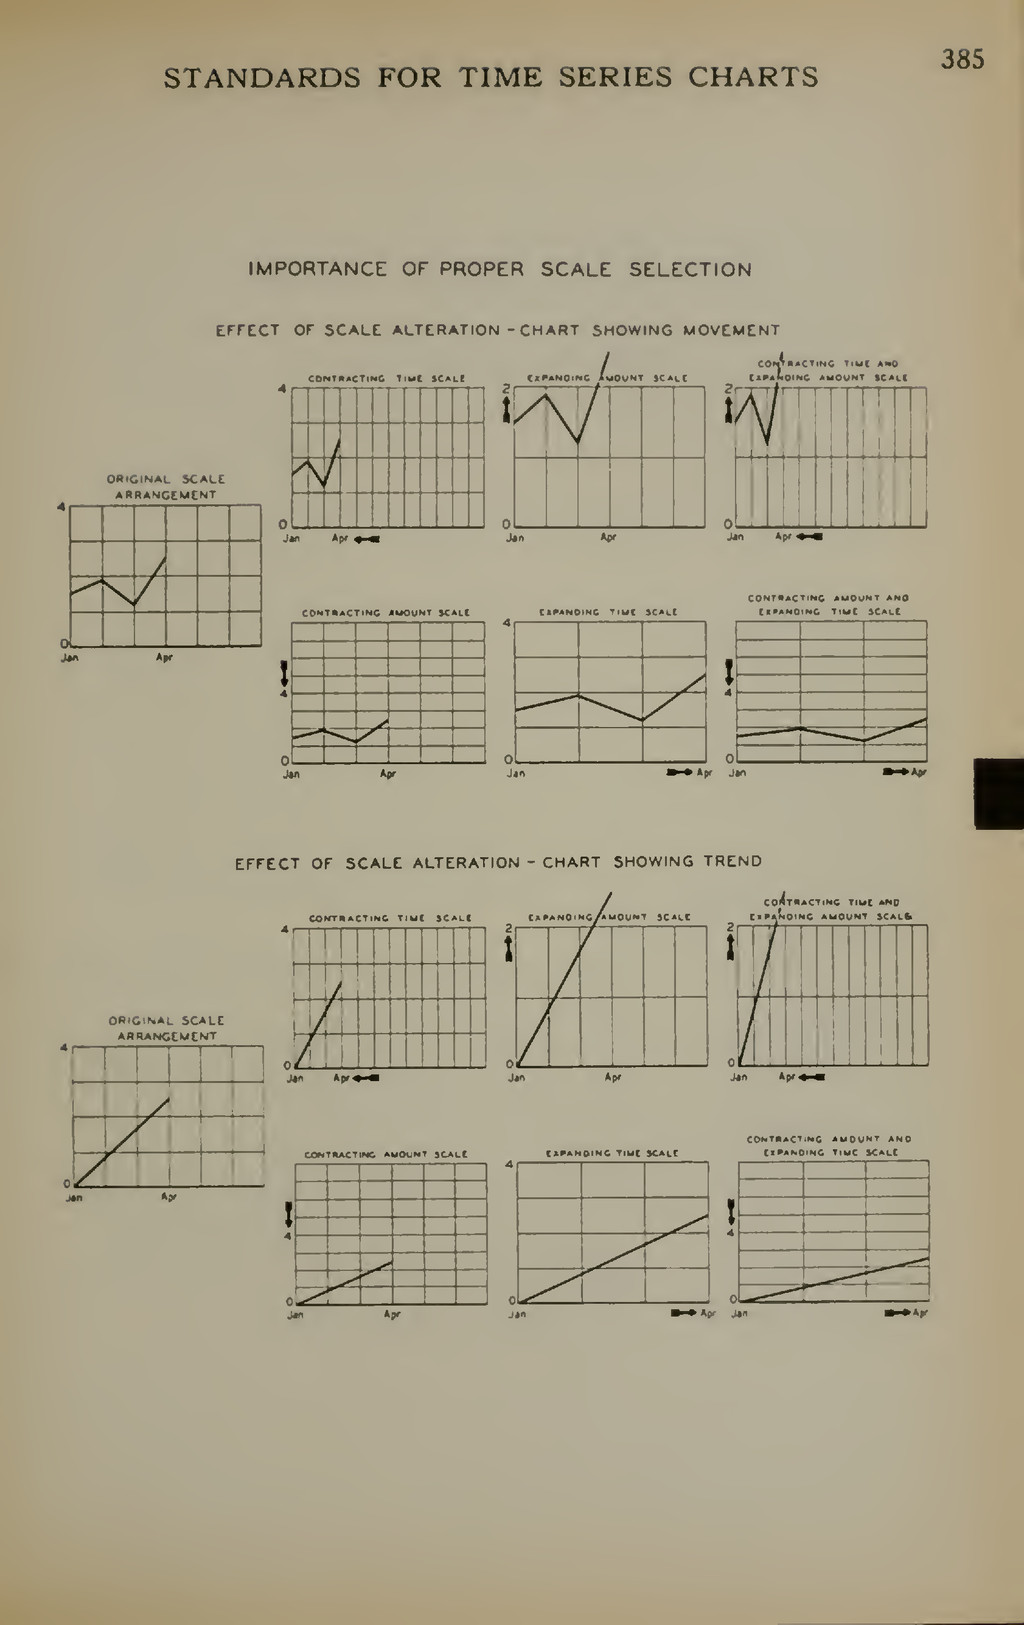
    Stnilhrirwrtl l>lll<llli|| Sodrtalrniii. % alln Soil Ciiiiarrvalian Srrtirr South Mmirhiina H*il»a« Co Sparinii divijrt Sprrd l.taphir ranirra Sprrdnat Maniirarliintif ^o. Spridrl. Cliarlri « .. ( ». SppiM-rr l.rni (!o. Spiridlrr t Sauppr, Inr. Spiral Hindinii Co. Slahl. 4.iiilav K. Stall rliarl Slampinii I >•<• «/•<> Hindinii) Standard Mailing Marliinr Co. . Standard Matnlir.. Inr. SOR. l>ri4A. Standardt (or tiraphir I'rrtrntati IS,;- Timr Srrirt Charuj Stanford I nivrrtil* SlatitlK-al map Slali»tirian** »«alr Sirinrr I'aprr Co. Strrrographir projrrtion Strrrol* pr Strvrni Holrl Stroblilr Co. Sunrav Srratrh board Siirfarr rharl S%nibol . (In map -^^_ Hrfrrrnrr _^ 376R ?f>2 I'.n ii: IhO •<UH \:il< J"<Tlt 491B JT2 insii lOhA IS I JhIA USB. ZMA. 2H7R, SOS _ *%\ 4]:h JHIA. 2H2A. 2V2. .lOoU Comniilirp on J22 IS3-242, SOS JS3 422 IS4 421 45() 422 2'»4. 505 121 215 39S .211 .382. Tabirt S Tirkri C*> Tabulation MrrhanKal Tackf Tallf>. B. B. Talhinn , __ 375 33-42, 3V6, SOS 40 193 170 33. 34 Trl.buii. Arthur R. - 24 Trninomrroff. V. A, 24. 309B. 333B. 334. 33S, 370 Trttilr Kronomict Bureau, '"^ 117 B, 352 Trtiile It arid 27 r/iu U rrk 4738 Thorndikr. Chuck 464 Thrrr-dimrniional nirthodi 354-3S9. SOS Timr >ralr 3'»2 Time Srrir, Chartt 113. 116. 264. 272. 2H0. 2<»H. 2<<'*. 3IH. 349. 3H 1-396. 440. 441 _ _ 1. 247 ISS. 15b. 2.13A Tepiral indrx Topoicraphir map _ - Toronto Indutlrial ConimUtiaD. Trar.. .M. K. Traftr chart {Ser olio TraKr map) TraSc map - 202B. 219. 222. 223. 224A 162B. 190B _ _ . 125B 74A 4B. 227. 229. SOS 462 365 419. 4S3 419. 4S3 32. 36H Trantronlinrnlal and Wrslrrn Air. loc. Traniil Jouiniil ^ Tranfograph Corporation -.^__^.—_-^— Trantoxraph thadinn film .._^_— TrantparrnI iiiatrrial _ Travrlrrt Insurance Company 32, 42, 319A. 47U Trend lilB. 275. :H4B. 2KSC, 2S6. 292. 3H5. 463 Trroholm, J. T.. t Company . _ 3blA TrianRlri '. 369A TrianKular C»ardirtale papar 3S9A Scale 3S3 Tricolor camera 398 Tricolor Hrvin camera - 398A Tnlincar chart 1 JS9A. 3S9B T-».|uarr 369A Turntable 49IB. 4V2A Two-directional bar ''">« SOS Two-. at bar chart 1 SOS T.pc: face 4S3 Siae 4*8. 4S3 Style 439 Typcvrilrr 377 Ucclric 379 Si; lea 176B U t'llra tinlrl paint I ndrrxond Mli»t ( liber ( ompant I moil l<ailrn.id station, l.oi Aniele I ni>ri.il< »l < htrago I're.i I niird state! (.n«ernnieiil : Ariii«, Corpt n( V ngineeri lliiirau o( Acririiltiiral Kronoiiiin Bureau of (.hrniMlrt and Soili Bureau of I'ublic Hoad. Bureau of Kerlaiiiatinii Citilian t~onter«ation Corp« CoatI and t.endrlir Siirvet llepnrtiiirnt of Aki iniltiire H4. Hii \ . m.i It. Departiiiriil of Con Intrtin Jllatirr labor Adii Departlnrlil Itrparlmrnt Drpartiiiriit Kmpl. nl (arm (redit Krdrial linr. federal l'o» lederal lte.< f'orenl Service (ieneral I and Office (ieologira! Surve> I'nited States (.o\ ernnieni—Conlinucd Map> of IlltrtligMll Board 489 476 402A. 402B 439 156 160 160 I'lU. I9SA IS6 61A '. ISH . I > .H. IHI, 191. |><5. 202A. 27«. 277, 27HB, 2H«B. 7n'l. .'US. 302B, 313, 314, .l.'lll. 321, 362. 422. 495 r 76. i:ilB, I.I9A, I39B, 271A, 29:A. JOJA. 32HA. JJ6. 33H ^ .. 44. 46. 69 . 499B i7A. 67, 86L', t06B. UO. 308A 290 ion 2H4A 499 B 3SA, 97. i73B SOOA 1S6 1S6 ISS _ISS. 1S6, 160 National Kraourcet Board (jie« Nalional Kriourcet Hoard) Affair. 1$6 I Ser»icc liO Office of liidi Soil Conierva Work. ProKrr • Adiiiinitlralion 6IB, 82A, 96. 99, 102A. lOIA. iniR. 104, 105, I07A, lOKA, 110. IIJ. II3B. UO. IJJA. 134A. 136, 137A, 1.1:B, lllH, nil. 149, 177A, I7H, IHO, III2B, 1117, IHIIA, IHHB, IH9. 211. 230. 2.HB. 2711. 290A. 300. 304B. 306A, 310. 311. 312. 315. 317,341, 342A, 343, 34S, 346 Slatet G>ptuni Company . . 477 I'n'ilrd Slatrs .\<'u« tniled Slalei Steel Conipaoy-. Utility paper 28A -494. 49SB 367 Value (.Si'f n{jo Color)- Van Cleef Broa Variable _ .. , Dependent -^_»_». Independent VariTvper .42SB. 427B . 371 320 263. S02 Vioual caplioni 263. SOS ._ 379 _3HA. 3HB. 39, «. 129, 131A. 249, 263. 26SA, 265B. 266A. 267, 36S w \lalker Kngraving Corporation— 2S Walker. Ileirn M. ^ _ 24,35 Ward. Robert _ ^ 231 Vlarren, 1- . I).. Company 440 Weather map 2I6A. 216B. 217A. 218. 232A. 232B, 233B. 234A. 236 Weber, Martin J. 380,4018 Welch, U. M., Mauiifacluring Company S2A, S2B Uelp, (;eor|;c 427B Wen.el, J. 343 Writinghouie Ktrelrie Manufarluring Campaajr 64 WheeUrigbt, William Bond 443 W biting- I'loter I'aper Company Wirettllched binding *ood block _-__- Vood- Began Initrumrnt Compaa; Horld'$ Uork .. _ \(olnian illuttration b*ar4_^_— U ricQ lettering pen Wycr, S. S. —^-^^—.^—^.^ - 426 - 4S0 - 41S . S74A . 342B - 411 . S74A - IN Young, Charle* M. -332A. 423 Zee chart Zeita, (Jarl. Inc. Zero line Zip-a-Tonc Compaay Ml, 3M. 317. 4Sa 41t I
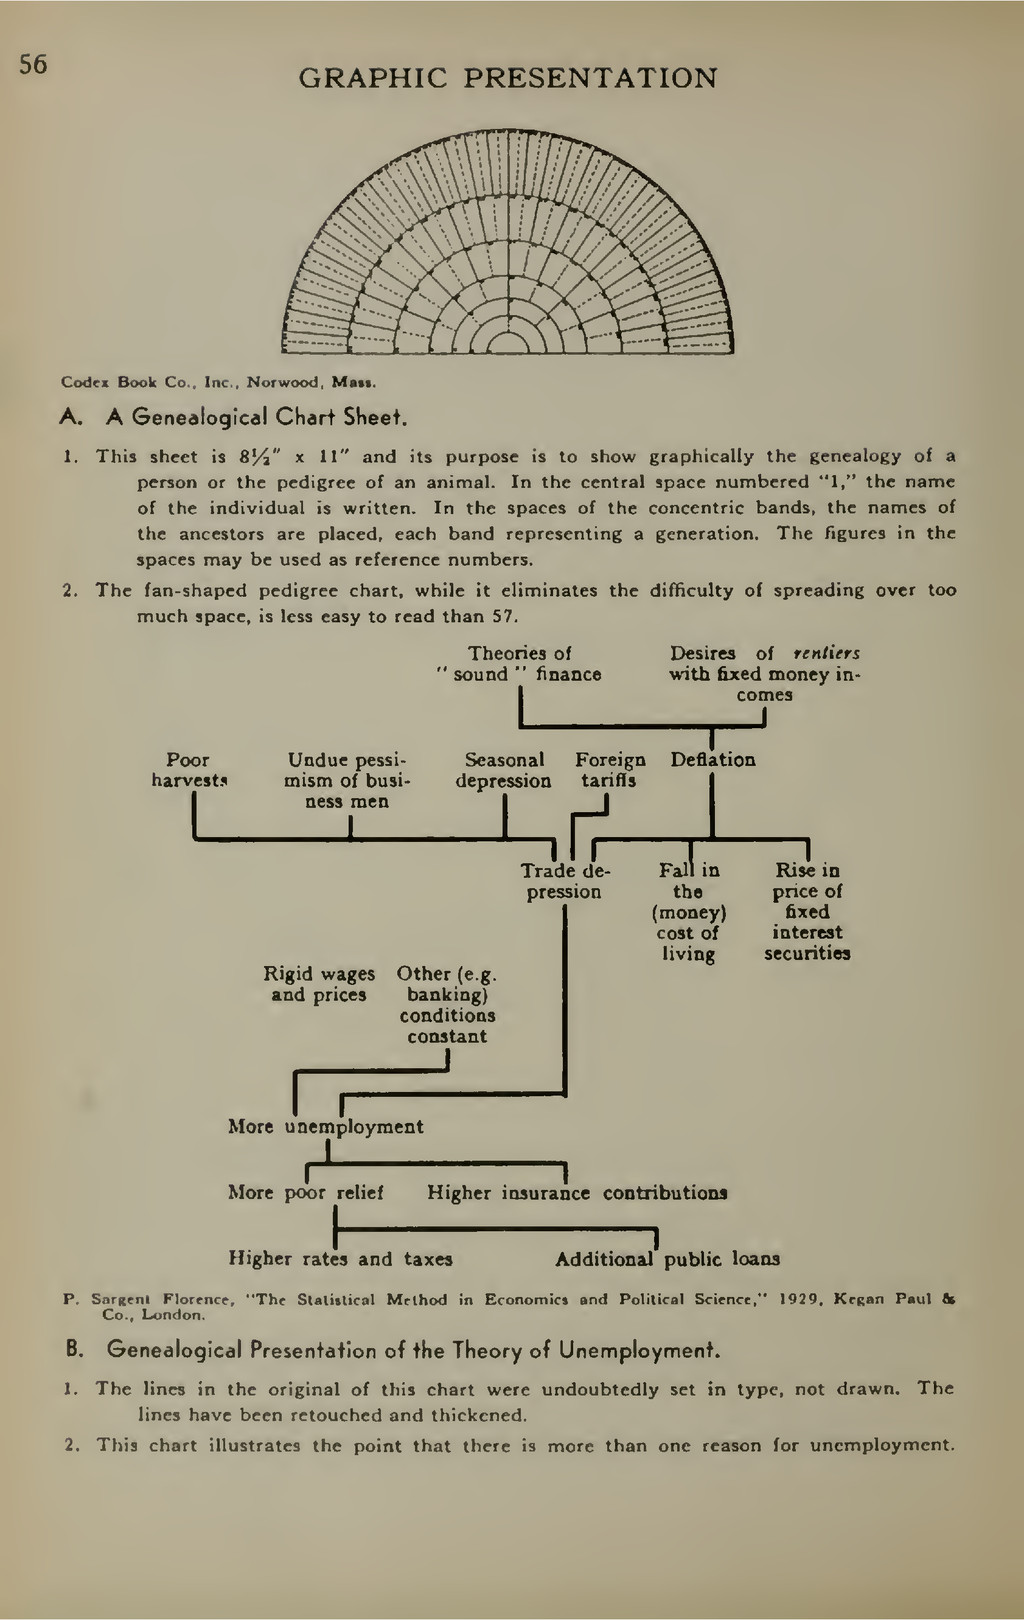
  444. Uniud %<«u of Afn«rtc • llllliir From Frontispiece of Book

    by WILLIAM PLAYFAIR. An Inquiry Into the Permanent Causes of the Decline and Fall of Powerful and Wealthy Nations. London, 1805.