Upgrade to Pro — share decks privately, control downloads, hide ads and more …

Serverless Analytics and Monitoring

Serverless Analytics and Monitoring

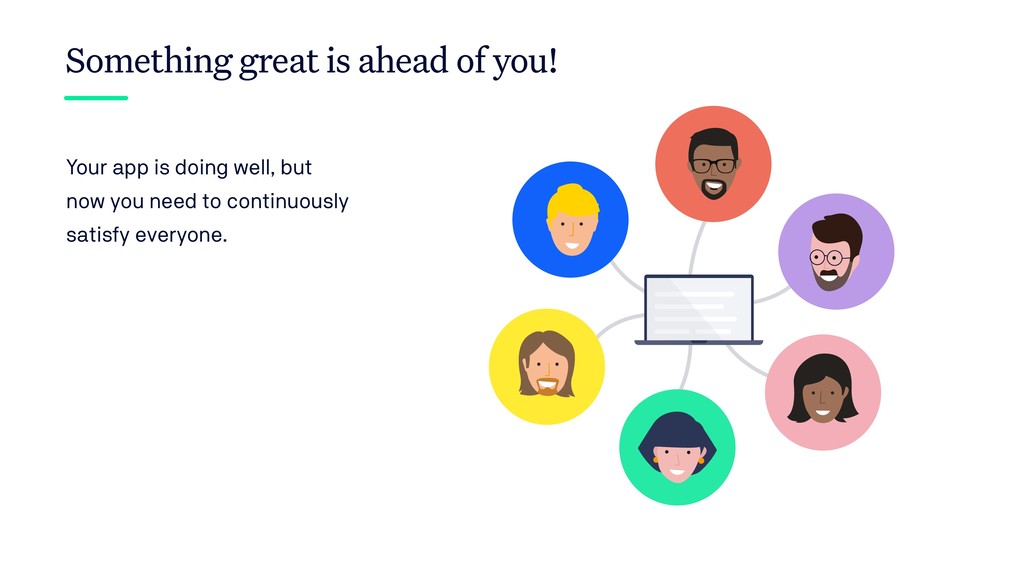
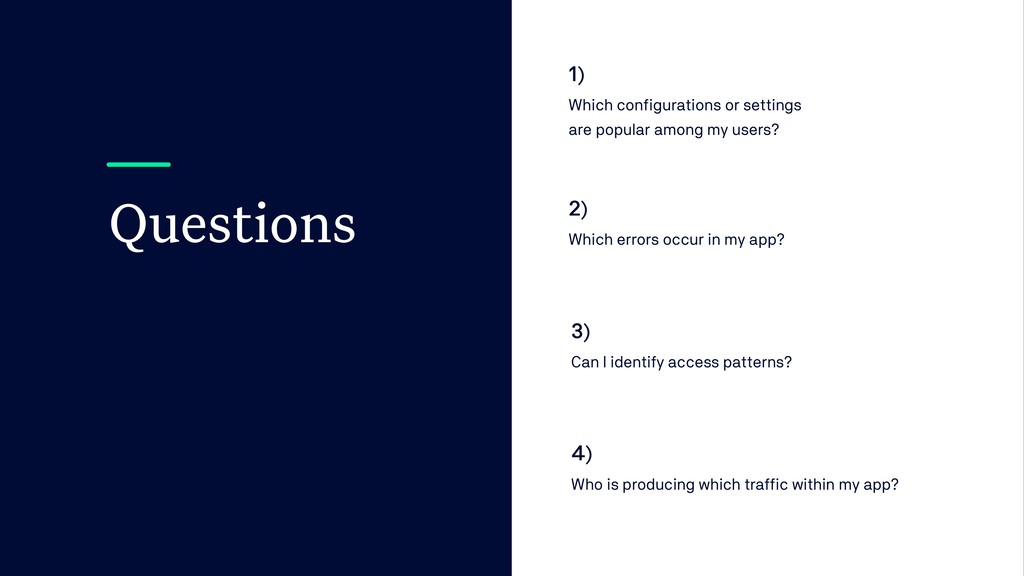
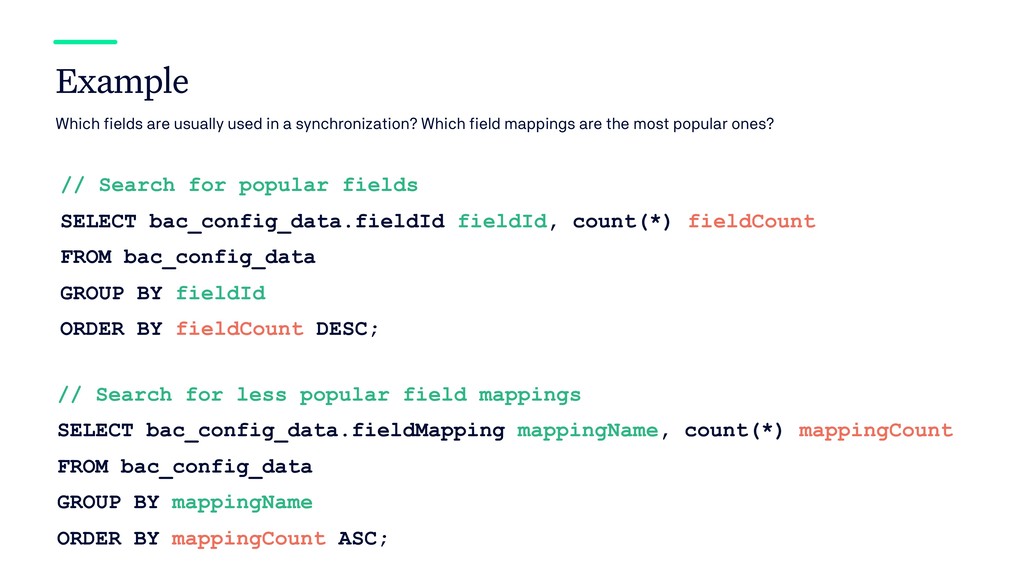
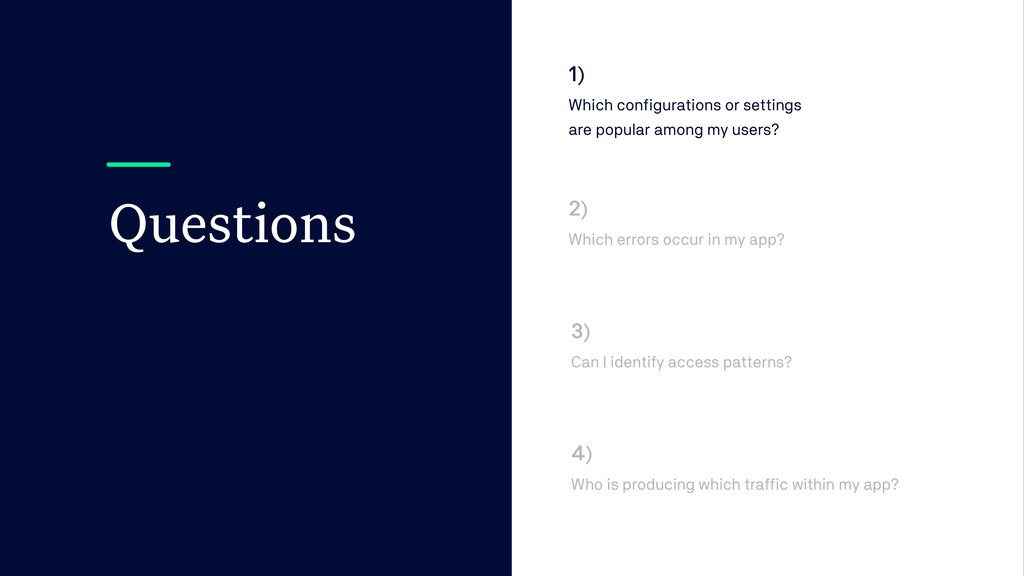
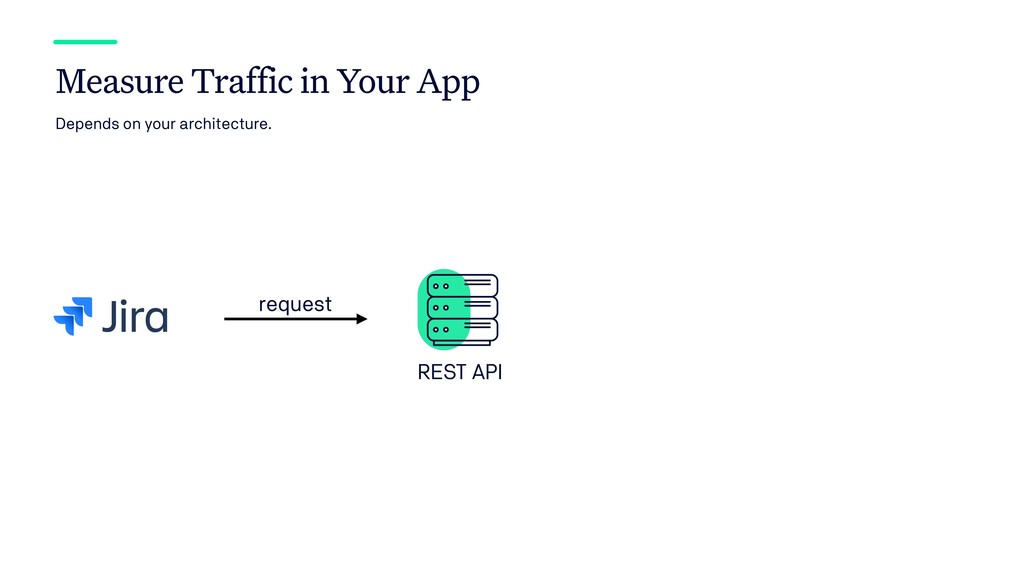
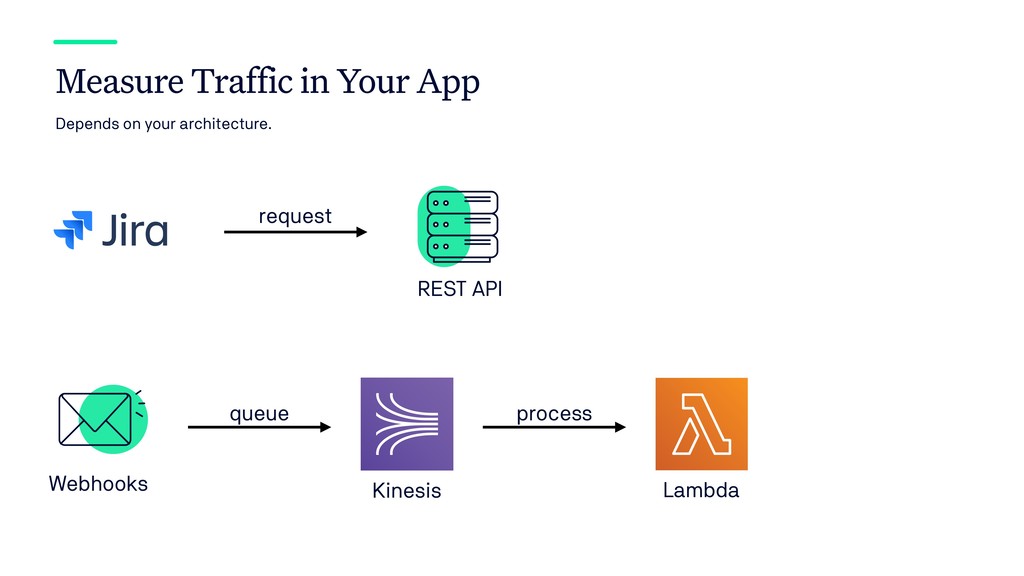
Are you running a cloud app and struggling to get the right information out of your app and cloud infrastructure? A majority of third-party apps in the Atlassian Marketplace run on AWS, but they don't use it to its full potential in analyzing their data. For example, do you know which customer is producing the biggest traffic within your app? How well is your app performing? Do you know which features of your app are the most popular ones? This talk will help you to find low-cost options available to analyze and monitor data of your app and cloud infrastructure. There are many services which you can already use without even changing your existing app or infrastructure and without running any servers by yourself. Sebastian Hesse of K15t will give you tips and tricks for retrieving the information you need - surprises included!

Find the recording here: https://www.youtube.com/watch?v=4_4IOFhhHYY

sebastianhesse

September 11, 2019
Tweet

More Decks by sebastianhesse

Other Decks in Programming

Transcript

  1. You run it. “As long as I can use the

    app, everything is fine.”
  2. Your app is doing well, but now you need to

    continuously satisfy everyone. Something great is ahead of you!
  3. Monitoring Get insights how your app is performing. Identify bottle

    necks and improve your architecture. Analytics Know how your app is used. Make informed decisions about your next steps and evaluate the previous ones. Next
  4. Raise your hands if you are using AWS! Compare Cloud

    Services: http://comparecloud.in/
  5. Even big companies fail. 2019: Google recovers from outage that

    took down YouTube, Gmail and Snapchat. https://www.theverge.com/2019/6/2/18649635 2019: Azure global outage: Our DNS update mangled domain records, says Microsoft https://www.zdnet.com/article/azure-global-outage-our-dns-update-mangled-domain-records-says-microsoft/ 2017: AWS's S3 outage was so bald Amazon couldn't get into its own dashboard to warn the world. https://www.theregister.co.uk/2017/03/01/aws_s3_outage/
  6. Example: AWS Lambda Invocations The number of times a function

    is invoked. Errors The number of failed invocations, e.g. due to errors. Duration The elapsed time from function start until the execution ends. Throttles The number of throttled Lambda invocations. http://bit.ly/aws-lambda-metrics
  7. Focus Start to monitor your key app metrics. Then monitor

    everything else. Webhook
 Processing REST API Frontend files
  8. Number of (un-)successful syncs If we have a high percentage

    of unsuccessful syncs, this is an indicator that there is something wrong. Duration of a synchronization If it takes too much time to synchronize data, our customers are not satisfied. Response time of HTTP requests If communication to Jira or other AWS services is too high, it will influence the duration of a sync. Example: Backbone Issue Sync
  9. Events Listen to events in your AWS account. Logs Write

    and view log messages of your services. Metrics Use metrics to describe the (health) status of your services. Alarms Get notified if metrics are crossing defined thresholds Amazon CloudWatch
  10. Standard Metrics Custom Metrics Use if... They already reflect your

    key app metrics. For example, if webhook processing is done by two contiguous Lambda functions. Use if... You can not make use of the standard ones. For example, if you have custom error reports in your app.
  11. CloudWatch: Custom Metrics // create metric data MetricDatum datum =

    new MetricDatum() .withMetricName("sync_error") .withUnit("Count") .withValue(1) .withTimestamp(new Date());
  12. CloudWatch: Custom Metrics // create metric data MetricDatum datum =

    ...; // prepare request to CloudWatch PutMetricDataRequest request = new PutMetricDataRequest() .withNamespace("Backbone Issue Sync") .withMetricData(datum); // send request cloudWatchClient.putMetricData(request);
  13. Add Widgets Present the most important numbers. Dynamic Metrics Add

    mathematical expressions to your widgets. Custom Dashboard
  14. CloudWatch Alarms Create alarms for the metrics you have created.

    Think about good thresholds. Send alert via SNS Then, configure notifications to be sent out to your developers or operations team using SNS. Infrastructure as Code Add the alarm configuration to your Infrastructure as Code template, e.g. CloudFormation. Configure Alarms
  15. Add to CloudFormation TooManyErrorsAlarm: Type: AWS::CloudWatch::Alarm Properties: AlarmName: "TooManyErrorsAlarm" ActionsEnabled:

    true AlarmActions: - SnsAlarmTopic Namespace: "Backbone Issue Sync" MetricName: "sync_error" ComparisonOperator: GreaterThanThreshold Statistic: p95 Threshold: 100 # ...
  16. Enable X-Ray Tracing // AWS Lambda in CloudFormation SAM template

    MyFunction: Type: AWS::Serverless::Function Properties: Handler: index.myFunction Runtime: nodejs10.x CodeUri: target Tracing: 'Active'
  17. X-Ray in your code // automatic tracing for AWS SDK

    AmazonDynamoDBClientBuilder .standard() .withRequestHandlers(new TracingHandler()) .build();
  18. X-Ray in your code // custom tracing, e.g. when requesting

    Jira AWSXRayRecorder xrayRecorder = ...; String segmentName = "sendJiraRequest ..."; Subsegment subsegment = xrayRecorder.beginSubsegment(segmentName); try { // send request to Jira } catch (Exception ex) { subsegment.addException(ex); subsegment.setError(true); } finally { xrayRecorder.endSubsegment(); }
  19. Caution! Keep an eye on the pricing and the artifact

    size of your Lambda function. Pricing: 5$ / 1m traces
  20. Check APIs Schedule a Lambda function to regularly call your

    own APIs and check that your service is available. Endless Options
  21. Check APIs Schedule a Lambda function to regularly call your

    own APIs and check that your service is available. Check X-Ray data You can access the X-Ray API and check if traces reached a certain threshold or the error rate is higher than expected. Endless Options
  22. GetServiceGraph Retrieve per service: - Error statistics - Fault statistics

    - Ok count - Total count http://bit.ly/xray-getservicegraph
  23. Check APIs Schedule a Lambda function to regularly call your

    own APIs and check that your service is available. Check X-Ray data You can access the X-Ray API and check if traces reached a certain threshold or the error rate is higher than expected. Check CloudWatch logs Attach a Lambda function to different CloudWatch log streams and analyze them - or send them to another service. Endless Options
  24. CloudWatch Logs to Lambda Lambda triggers based on new CloudWatch

    logs CloudWatch Log Event Problem: One log group per Lambda function. Solution: Listen to multiple log groups.
  25. Select Sources Select source log groups which you want to

    query. Write Filter Write a filter query to retrieve the data you want. Matching Messages View all messages matching the filter query. Query Log Messages
  26. Example Filter Queries // Filter Expression Using a Trace Key

    fields @message | filter @message like "MyTraceKey" | sort @timestamp ASC // Auto JSON Detection fields @message | filter data.clientKey = "123-abc-..." | sort @timestamp ASC
  27. Monitoring - Monitor app metrics - Get notified about alarms

    - Further investigation possible Checklist Status - Serverless - Low-cost - Without code changes
 (if you want)
  28. Descriptive Describe your data with statistics and reports. Diagnostic Investigate

    your data and look for reasons. Predictive Identify patterns and prepare for the future. Prescriptive Optimize your actions and find new approaches. Types of Analytics
  29. Web Analytics Analyze user interactions with your app, for example

    using Google Analytics. Business Analytics Find out about business statistics like sales numbers and similar. Data Analytics Investigate the data you have stored - configuration data, processing data and more. Thousands of Tools
  30. Questions 2) Which errors occur in my app? 3) Can

    I identify access patterns? 4) Who is producing which traffic within my app? 1) Which configurations or settings are popular among my users?
  31. Questions 1) Which configurations or settings are popular among my

    users? 2) Which errors occur in my app? 3) Can I identify access patterns? 4) Who is producing which traffic within my app?
  32. Pros Cons Scan operations cost a lot! It's time consuming

    - Lambda functions can timeout. You don't want to do this on your production database. It's easy to setup. You are flexible. Serverless.
  33. Naive Approach #2 DynamoDB Lambda stream Your Lambda function is

    invoked for each updated entry in your database table. Then simply analyze it.
  34. Pros Cons Only a few database updates per function call.

    No negative impact on database. Serverless.
  35. Amazon Athena "Start querying data instantly. Get results in seconds.

    Pay only for the queries you run." A serverless service to run SQL queries on your S3 data.
  36. Source Define a source bucket or bucket folder to scan

    your data from. Schema Define the schema of your data. This data will be used to create your data table. Query Now you can query your data based on the defined schema. Athena - How It Works
  37. Normalize Data Lambda function normalize(config) { let entries = '';

    for (...) { entries += item1 + ';' + item2 + ... + '\n'; } s3.putObject({ Body: entries, // ... }); }
  38. Questions 1) Which configurations or settings are popular among my

    users? 2) Which errors occur in my app? 3) Can I identify access patterns? 4) Who is producing which traffic within my app?
  39. Which fields are usually used in a synchronization? Which field

    mappings are the most popular ones? Example // Search for popular fields SELECT bac_config_data.fieldId fieldId, count(*) fieldCount FROM bac_config_data GROUP BY fieldId ORDER BY fieldCount DESC; // Search for less popular field mappings SELECT bac_config_data.fieldMapping mappingName, count(*) mappingCount FROM bac_config_data GROUP BY mappingName ORDER BY mappingCount ASC;
  40. Questions 1) Which configurations or settings are popular among my

    users? 2) Which errors occur in my app? 3) Can I identify access patterns? 4) Who is producing which traffic within my app?
  41. Depends on your architecture. Measure Traffic in Your App Kinesis

    Webhooks Lambda queue process REST API request
  42. How It Works Kinesis Webhooks Lambda queue Lambda Kinesis Data

    Analytics Run SQL queries on your streaming data. process process analyze
  43. How It Works Kinesis Webhooks Lambda queue Lambda Kinesis Data

    Analytics process process analyze Lambda forward S3 Bucket forward
  44. How It Works Kinesis Webhooks Lambda queue Lambda Kinesis Data

    Analytics process process analyze Lambda forward S3 Bucket Athena forward query
  45. Pricing Kinesis is a service where you pay a price

    per hour. Kinesis Data Streams: >10$/month/shard Kinesis Data Analytics: >80$/month
  46. Analytics - Get app data insights - Answer your custom

    questions - Further optimization possible Checklist Status - Serverless - Pay as you go - Additional code required
  47. Stakeholders Customer I love your product! Can you add a

    feature for me? Customer #2 THIS S#!T IS NOT WORKING!!!! Developer We need to scale the system! Management Was it worth to spend three months on it?
  48. Monitoring - (Customer) - Customer #2 - Developer - Management

    Analytics - Customer - (Customer #2) - Developer - Management Goal Check
  49. Serverless No need to manage anything by yourself. Pay as

    you go and if you do not use it, you will not pay. S3 = Key Service S3 is a key service in the AWS ecosystem. If you have data there, you can use it almost everywhere. Extend It You know the basics now. Use your data and add sugar services like Machine Learning to be one step ahead. Take Aways