Upgrade to Pro — share decks privately, control downloads, hide ads and more …

Business Intelligence In Excel 2013

Business Intelligence In Excel 2013

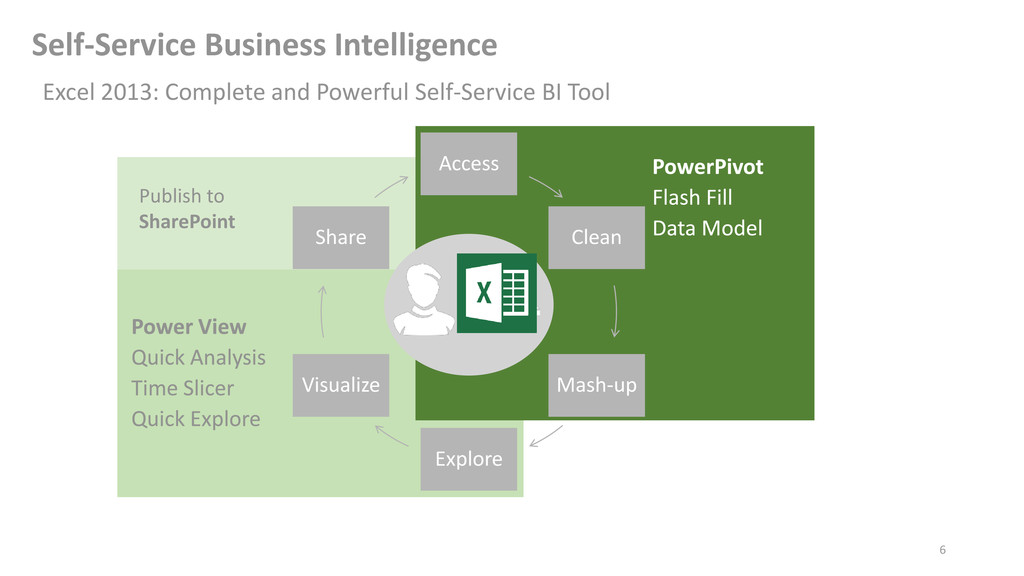
The next release of Excel enables business users to do self-service Business Intelligence directly in the client, which now becomes a complete and powerful self-service BI tool - Basically users have all they need in one familiar environment in order to do data modeling, exploration and visualization of the data.

Stéphane Fréchette

January 25, 2013
Tweet

More Decks by Stéphane Fréchette

Other Decks in Technology

Transcript

  1. Who am I? My name is Stéphane Fréchette I’m a

    Database & Business Intelligence Professional and CEO | Founder of I have a passion for architecting, designing and building solutions that matter. Self proclaimed Open Data Hacker/Advocate I founded Gatineau Ouverte a citizen led initiative which aims to promote open access to civic data of the city of Gatineau. Twitter: @sfrechette Email: [email protected] Blog: stephanefrechette.com
  2. Session Outline • Microsoft Business Intelligence (The Stack) • Self-Service

    Business Intelligence • Excel 2013 (Key new features and demos) • Excel • PowerPivot • Power View • Upgrading from earlier versions • Data Explorer and GeoFlow • Summary • Resources
  3. Analysis Services Reporting Services Integration Services Master Data Services SharePoint

    Collaboration Excel Workbooks PowerPivot Applications SharePoint Dashboards & Scorecards Data Quality Services OData Feeds Line of Business Applications Hadoop Big Data Microsoft Business Intelligence
  4. 5 Access Clean Mash-up Explore Visualize Share Challenges: • Multiple

    BI tools • High learning curve • “Spreadmarts”/Silos • Not scalable What Do Users want to Do? Self-Service Business Intelligence
  5. 6 Excel 2013: Complete and Powerful Self-Service BI Tool Access

    Clean Mash-up Explore Visualize Share Self-Service Business Intelligence Publish to SharePoint
  6. Self-Service BI in Excel 2013 • Advances Data Modeling, rich

    interactive reporting capabilities • In a single Workbook you can develop a Data Model; • Integrate multiple data sources and different source types • Encapsulate Hierarchies, Calculations and KPIs • Reports can be based on that same data model • Power View • PivotTables, PivotCharts • CUBE Functions • Published to SharePoint • Schedule automatic Data Refresh • Share embedded Data Model and Reports
  7. Excel 2013 – Key New Features • Analyze Data in

    Real-Time Using Quick Analysis • Flash Fill: Intelligently Organize Your Data • Follow the Excel Recommendations • Chart Formatting Control • Slicer and Timeline • Extensive List of Data Sources
  8. Self-Service BI in Excel 2013 - PowerPivot • PowerPivot enriches

    Excel by compressing storage and provide fast querying and reporting from tabular data • xVelocity in-memory analytics engine (formerly VertiPaq) • Highlights; • Load data from a variety of sources • Extremely large volumes can be stored • Data Analysis Expressions (DAX) • Can be enriched with Hierarchies, KPIs, Perspectives and Reporting metadata • First introduced as an add-in with SQL Server 2008 R2
  9. 12 Access and mashup data from virtually any source to

    create powerful reports PowerPivot in Excel 2013
  10. PowerPivot in Excel 2013 – Key New Features • No

    longer requires separate install add-in • Basic data model functionality now built in Excel 2013 • Calculated fields (‘Measures’) created automatically when field is numeric • In-memory analytics engine native to Excel • Excel and PowerPivot now have a single, uniform Field List • Data categorization and suggestions from DataMarket • Support for more languages (40 languages) • Support for larger file sizes in 64-bit Excel (*unlimited)
  11. PowerPivot in Excel 2013 – Advanced modeling capabilities • Optional

    PowerPivot add-in for advanced modeling capabilities • Filter data when importing • Rename tables and columns as you import data in PowerPivot • Manage the model and create relationships with the Diagram View • Apply formatting for Power View and PivotTable reports • Define Calculated Fields and advanced DAX calculations • Define Key Performance Indicators (KPIs) • Create User-defined Hierarchies • Define Perspectives • Advanced formulas that use the Data Analysis Expression (DAX)
  12. Creating a Workbook Data Model • Two integration points; •

    Implicit – with native Excel capabilities • Based on internal Workbook tables, and/or external data sources  PowerPivot add-in is not required to be enabled  Manage Data Model (limited) with the PivotTable Field List (Relationships, implicit Calculated Fields) • Explicit – with the PowerPivot add-in enabled (Data Modeling Window) • Data Model is managed with the PowerPivot Window  PowerPivot add-in must be enabled  Can be based on existing implicit Data Model
  13. Self-Service BI in Excel 2013 – Power View • Power

    View provides an interactive data exploration, visualization and presentation experience • Strong visual design experience (WYSIWYG) • Rich meta-driven interactions • First introduced with SQL Server 2012 Reporting Services in SharePoint Mode (BI and Enterprise editions) • Now part of Excel 2013 (need to enable add-in) • Power View sheets can be added to Workbook • Can be based on a Workbook Data Model, or SSAS Tabular Data Model (currently not possible for Multidimensional Model) • Requires Silverlight 5 to be installed
  14. 18 Visually discover and share insight across all levels of

    the organization Power View in Excel 2013
  15. Power View in Excel 2013 – Key New Features •

    Power View sheets can connect to different data models in one workbook • Modify the internal Data Model without leaving the Power View sheet • Power View in Excel Services, Excel Web App and Office 365 • SharePoint Server • Pie charts • Maps • Key Performance Indicators (KPIs) • Hierarchies • Drill up and drill down • Hyperlinks
  16. Upgrading from earlier versions • Prior versions of PowerPivot Workbooks

    must be upgraded if they are to be queried or managed using Excel 2013 • Will be prompted to upgrade the embedded Data Model when: • A new Report (PivotTable, PivotChart) is created • Existing Report need to be refreshed • A CUBE Function attempts to connect to the Data Model • Need to manage the Data Model • Once the Workbook is upgraded it cannot be opened by a previous version of PowerPivot * KPIs not migrated need to be redefined
  17. Data Explorer “Data Explorer" is an Excel add-in that enhances

    the self-service Business Intelligence experience in Excel by simplifying data discovery and access. Enable self-service data discovery, query, transformation and mashup experiences for Information Workers, via Excel and PowerPivot • Discovery and connectivity to a wide range of data sources, spanning volume as well as variety of data. • Highly interactive and intuitive experience for rapidly and iteratively building queries over any data source, any size. • Consistency of experience, and parity of query capabilities over all data sources. • Joins across different data sources; ability to create custom views over data that can then be shared with team/department. https://www.microsoft.com/en-us/download/details.aspx?id=36803 *Requires Microsoft Excel 2013
  18. GeoFlow Project codename “GeoFlow” Preview for Excel 2013 allows you

    to plot geographic and temporal data visually, analyze that data in 3D, and create interactive tours to share with others. https://www.microsoft.com/en-us/download/details.aspx?id=38395 *Requires Microsoft Office Professional Plus 2013 or Office 365 ProPlus.
  19. Summary • Excel 2013 delivers both advanced Data Modeling and

    Reporting capabilities • Data Modeling features and capabilities are delivered with the xVelocity in-memory analytics engine • Power View sheets extend the Reporting capabilities of Excel 2013 • Many new features are available in both PowerPivot and Power View
  20. Resources • PowerPivotPro http://www.powerpivotpro.com/ • Analysis Services & PowerPivot Blog

    (MSDN) http://blogs.msdn.com/b/analysisservices/ • Kasper de Jonge PowerPivot Blog http://www.powerpivotblog.nl/ • Chris Webb’s BI Blog https://cwebbbi.wordpress.com/category/powerpivot/ • SQLBI – Marco Russo http://www.sqlbi.com/ • PowerPivot-info.com http://powerpivot-info.com/