Upgrade to Pro — share decks privately, control downloads, hide ads and more …

Power BI

Power BI

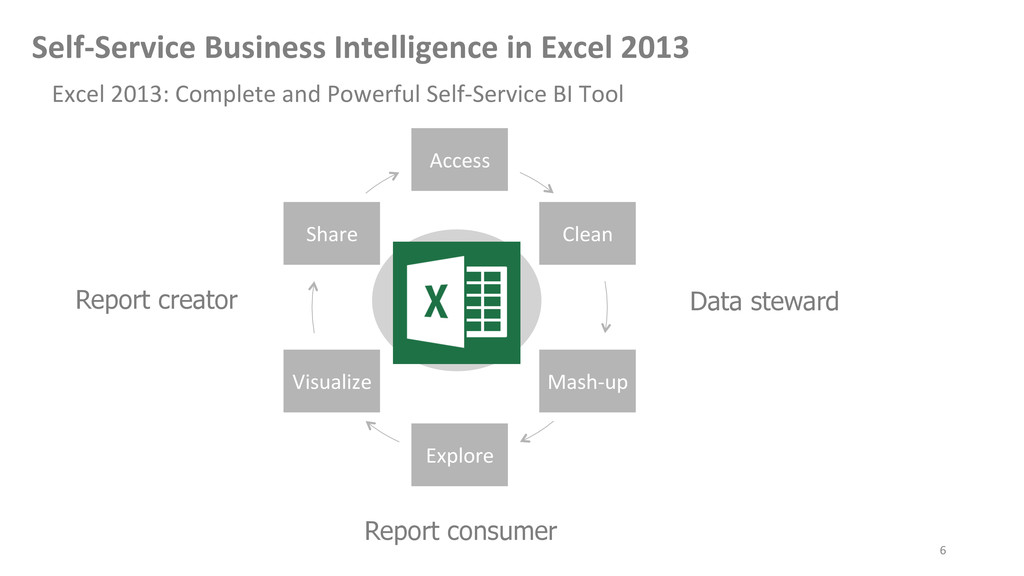
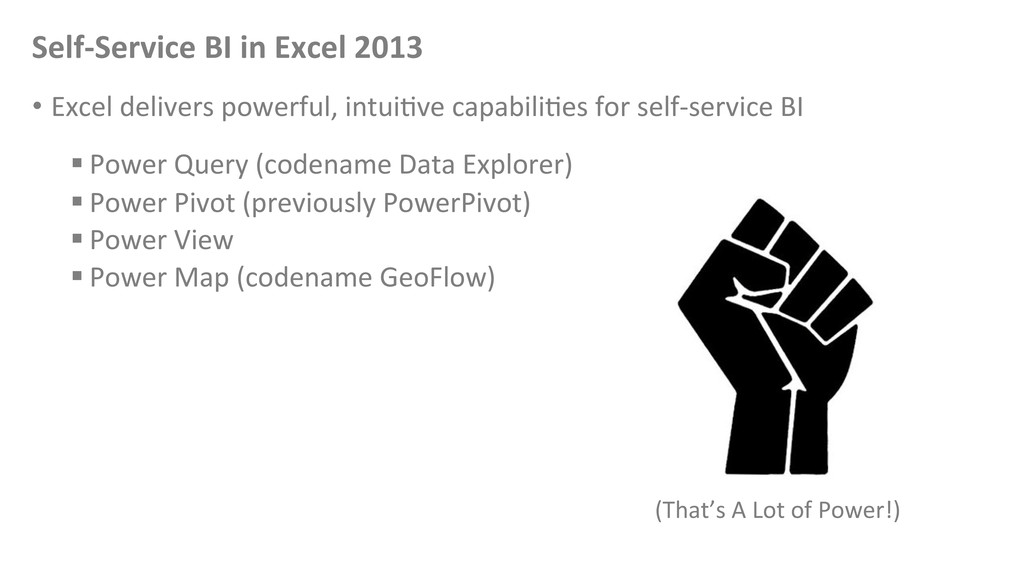
Powerful Self-Service BI in Excel 2013 - Data search and discovery with Power Query (formerly "Data Explorer"), analyzing and modeling with Power Pivot, visualizing and exploring with Power View and Power Map (formerly codename "GeoFlow")

Focused on demos...

Stéphane Fréchette

September 19, 2013
Tweet

More Decks by Stéphane Fréchette

Other Decks in Technology

Transcript

  1. Power  BI   Power  Query,  Power  Pivot,  Power  View,  Power

     Map                 Stéphane  Fréche:e   Thursday  Septembre  19,  2013  
  2. Who  am  I?   My  name  is  Stéphane  Fréche2e  

      I’m  a  Database  &  Business  Intelligence  Professional  and  Founder  |  CEO  of       I  have  a  passion  for  architecEng,  designing  and  building  soluEons  that  ma2er.     Self  proclaimed  Open  Data  Hacker/Advocate  I  founded  GaEneau  Ouverte  a  ciEzen  led   iniEaEve  which  aims  to  promote  open  access  to  civic  data  of  the  city  of  GaEneau.       Twi2er:  @sfreche2e   Blog:  stephanefreche2e.com   Email:  [email protected]        
  3. Session  Outline   •  MicrosoR  Business  Intelligence  (The  Stack)  

    •  Self-­‐Service  Business  Intelligence  in  Excel  –  Power  BI   •  Power  Pivot,  Power  Query,  Power  View,  Power  Map   •  Demos   •  Power  BI  for  Office  365   •  Power  BI  Sites   •  Data  Management   •  Power  BI  for  Mobile   •  Summary   •  Resources    
  4. Analysis     Services   ReporEng Services   IntegraEon  

      Services   Master  Data     Services   SharePoint Collaboration Excel Workbooks Power Pivot Applications SharePoint Dashboards & Scorecards   The image cannot be displayed. Your computer may not have enough memory to open the image, or the Data  Quality   Services   OData   Feeds   Line  of  Business   ApplicaEons   Hadoop Big Data MicrosoI  Business  Intelligence  
  5. 5   Access   Clean   Mash-­‐up   Explore  

    Visualize   Share   What  Do  Users  want  to  Do?   Self-­‐Service  Business  Intelligence  
  6. 6   Access   Clean   Mash-­‐up   Explore  

    Visualize   Share   Excel  2013:  Complete  and  Powerful  Self-­‐Service  BI  Tool   Self-­‐Service  Business  Intelligence  in  Excel  2013     Report creator Data steward Report consumer
  7. Self-­‐Service  BI  in  Excel  2013   •  Excel  delivers  powerful,

     intuiEve  capabiliEes  for  self-­‐service  BI     § Power  Query  (codename  Data  Explorer)   § Power  Pivot  (previously  PowerPivot)     § Power  View     § Power  Map  (codename  GeoFlow)     (That’s  A  Lot  of  Power!)  
  8. Power  Query   Power  Query  Preview  for  Excel  is  an

     add-­‐in  that  enhances  the  self-­‐service  Business   Intelligence  experience  in  Excel  by  simplifying  data  discovery  and  access.       Enable  self-­‐service  data  discovery,  query,  transformaEon  and  mashup  experiences  for   InformaEon  Workers,  via  Excel  and  Power  Pivot     •  Discovery  and  connecEvity  to  a  wide  range  of  data  sources,  spanning  volume  as  well  as   variety  of  data.     •  Highly  interacEve  and  intuiEve  experience  for  rapidly  and  iteraEvely  building  queries  over   any  data  source,  any  size.   •  Consistency  of  experience,  and  parity  of  query  capabiliEes  over  all  data  sources.   •  Joins  across  different  data  sources;  ability  to  create  custom  views  over  data  that  can  then   be  shared  with  team/department.        
  9. 9       Access  and  mashup  data  from  virtually

     any  source  to  create  powerful   reports   Power  Pivot  
  10. Power  Pivot   •  Power  Pivot  enriches  Excel  by  compressing

     storage  and  provide  fast  querying   and  reporEng  from  tabular  data   •  xVelocity  in-­‐memory  analyEcs  engine  (formerly  VerEPaq)   •  Highlights;   •  Load  data  from  a  variety  of  sources   •  Extremely  large  volumes  can  be  stored   •  Data  Analysis  Expressions  (DAX)   •  Can  be  enriched  with  Hierarchies,  KPIs,  PerspecEves  and  ReporEng  metadata   •  First  introduced  as  an  add-­‐in  with  SQL  Server  2008  R2  
  11. Power  Pivot  –  Key  New  Features   •  No  longer

     requires  separate  install  add-­‐in   •  Basic  data  model  funcEonality  now  built  in  Excel  2013   •  Calculated  fields  (‘Measures’)  created  automaEcally  when  field  is  numeric   •  In-­‐memory  analyEcs  engine  naEve  to  Excel     •  Excel  and  PowerPivot  now  have  a  single,  uniform  Field  List   •  Data  categorizaEon  and  suggesEons  from  DataMarket   •  Support  for  more  languages  (40  languages)   •  Support  for  larger  file  sizes  in  64-­‐bit  Excel  (*unlimited)  
  12. 12   Visually  discover  and  share  insight  across  all  levels

     of  the  organizaEon       Power  View  
  13. Power  View   •  Power  View  provides  an  interacEve  data

     exploraEon,  visualizaEon  and   presentaEon  experience   •  Strong  visual  design  experience  (WYSIWYG)   •  Rich  meta-­‐driven  interacEons   •  First  introduced  with  SQL  Server  2012  ReporEng  Services  in  SharePoint  Mode   (BI  and  Enterprise  ediEons)   •  Now  part  of  Excel  2013  (need  to  enable  add-­‐in)   •  Power  View  sheets  can  be  added  to  Workbook   •  Can  be  based  on  a  Workbook  Data  Model,  or  SSAS  Tabular  Data  Model,      *SSAS  MulEdimensional  Model  (SQL  Server  2012  SP1  CTP3)   •  Requires  Silverlight  5  to  be  installed  
  14. Power  View  –  Key  New  Features   •  Power  View

     sheets  can  connect  to  different  data  models  in  one  workbook   •  Modify  the  internal  Data  Model  without  leaving  the  Power  View  sheet   •  Power  View  in  Excel  Services,  Excel  Web  App  and  Office  365   •  SharePoint  Server   •  Pie  charts           •  Maps   •  Key  Performance  Indicators  (KPIs)   •  Hierarchies   •  Drill  up  and  drill  down   •  Hyperlinks    
  15. Power  Map   Power  Map  Preview  for  Excel  2013  allows

     you  to  plot  geographic  and  temporal  data   visually,  analyze  that  data  in  3D,  and  create  interacEve  tours  to  share  with  others.                         h#ps://www.microso/.com/en-­‐us/download/details.aspx?id=38395   *Requires  Microso/  Office  Professional  Plus  2013  or  Office  365  ProPlus.  
  16. Power  BI  for  Office  365   •  Power  BI  Sites

        •  Quickly  create  a  collaboraEon  hub  to  share  workbooks.  Create,  and  enable  users  to   take  full  advantage  of  the  Power  BI  for  Office  365  collecEon  of  online  offerings.     •  A  Visual  Home  for  Workbooks   •  Large  Workbooks  –  up  to  250MB   •  Sites  without  Power  BI  are  limited  to  10MB   •  Share  Your  Work   •  Built-­‐in  from  the  beginning   •  Share  Power  Query  (queries)   •  Manage  Data   •  Track  and  analyze  share  queries  and  data  sets   •  Go  anywhere  with  the  Power  BI  App  
  17. Summary   Self-­‐service  BI  in  Excel,  Power  BI  provides  the

     tools  you  need  to   find  data,  shape  and  filter  it  how  you  want,  model  it,  and  visualize   it.    
  18. Resources   •  Power  BI  for  Office  365    

    h2ps://office.microsoR.com/en-­‐us/excel/power-­‐bi-­‐FX104080667.aspx   Register  and  read  the  Power  BI  –  Geung  Started  Guide   •  PowerPivotPro  h2p://www.powerpivotpro.com/   •  Analysis  Services  &  PowerPivot  Blog  (MSDN)  h2p://blogs.msdn.com/b/analysisservices/   •  Kasper  de  Jonge  PowerPivot  Blog  h2p://www.powerpivotblog.nl/   •  Chris  Webb’s  BI  Blog  h2ps://cwebbbi.wordpress.com/category/powerpivot/   •  SQLBI  –  Marco  Russo  h2p://www.sqlbi.com/   •  PowerPivot-­‐info.com  h2p://powerpivot-­‐info.com/