Upgrade to Pro — share decks privately, control downloads, hide ads and more …

Developing with MapStore; creating a custom dashboard to map crime data

Developing with MapStore; creating a custom dashboard to map crime data

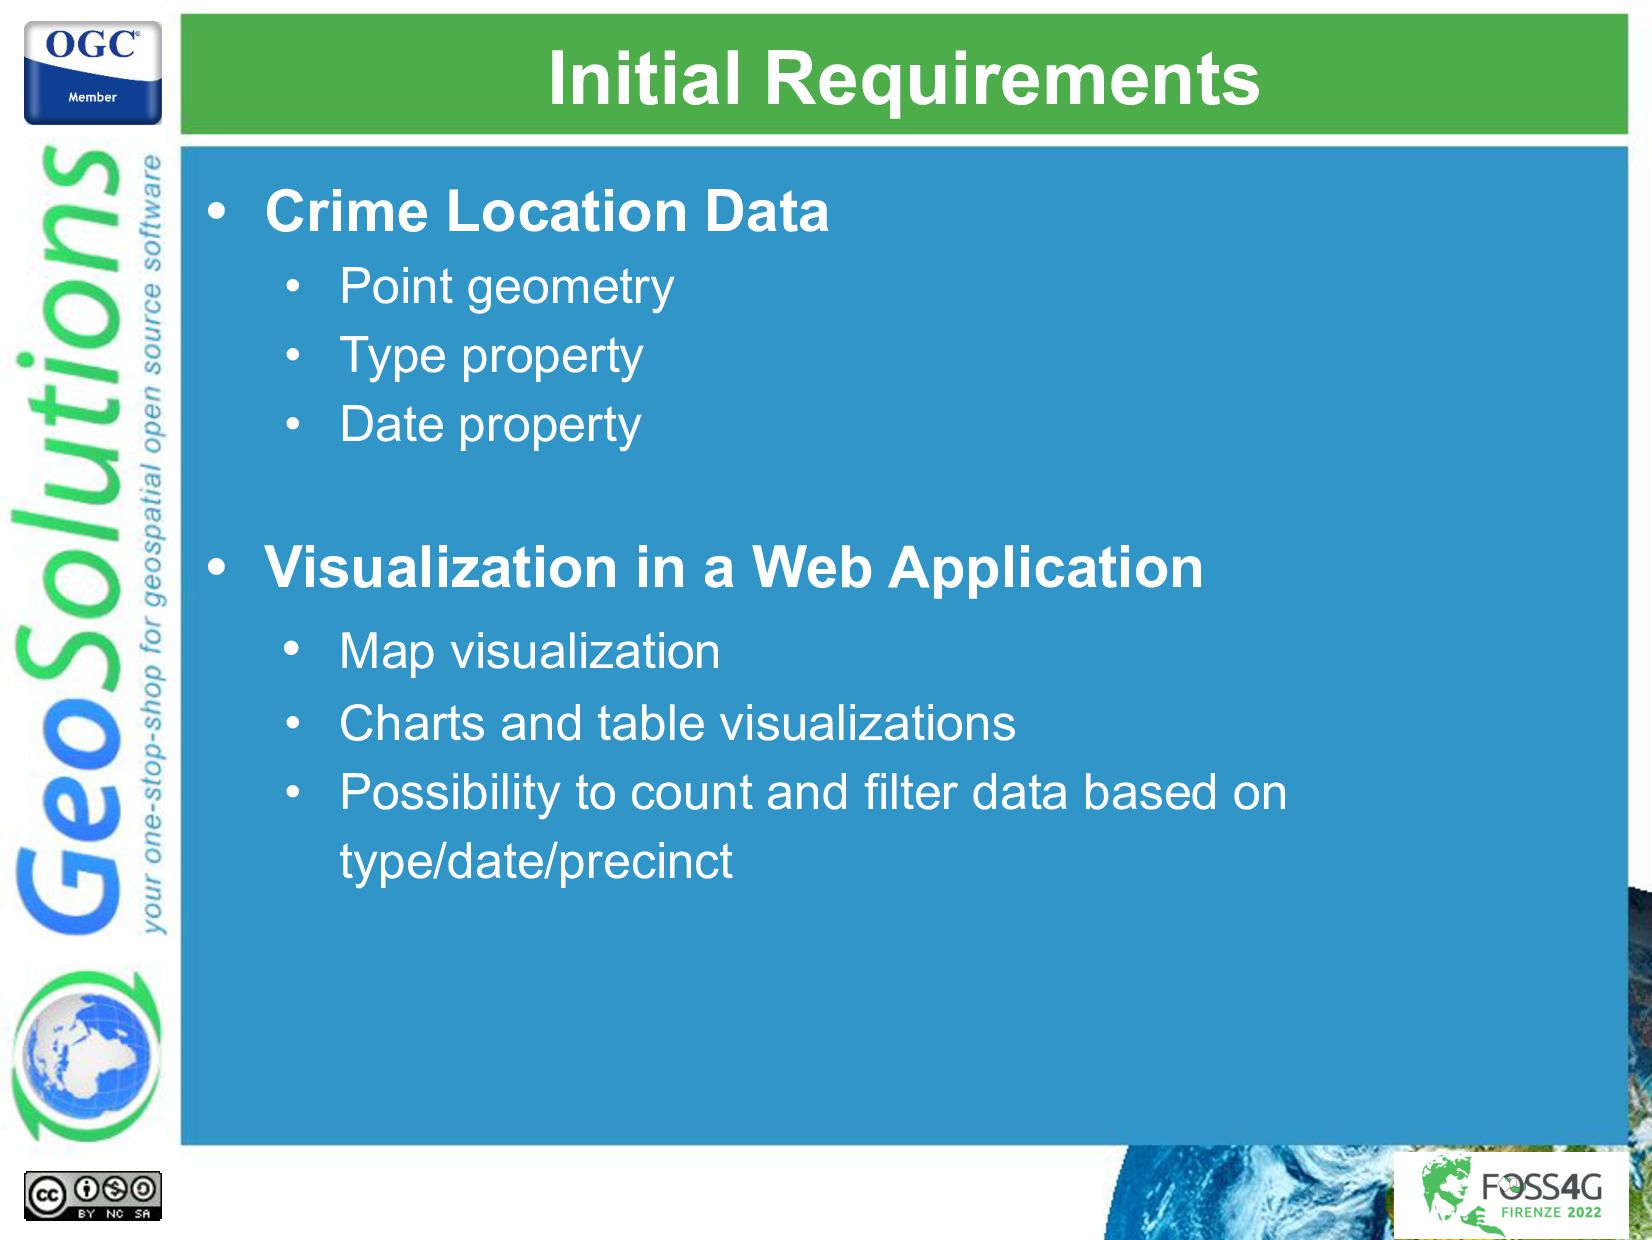
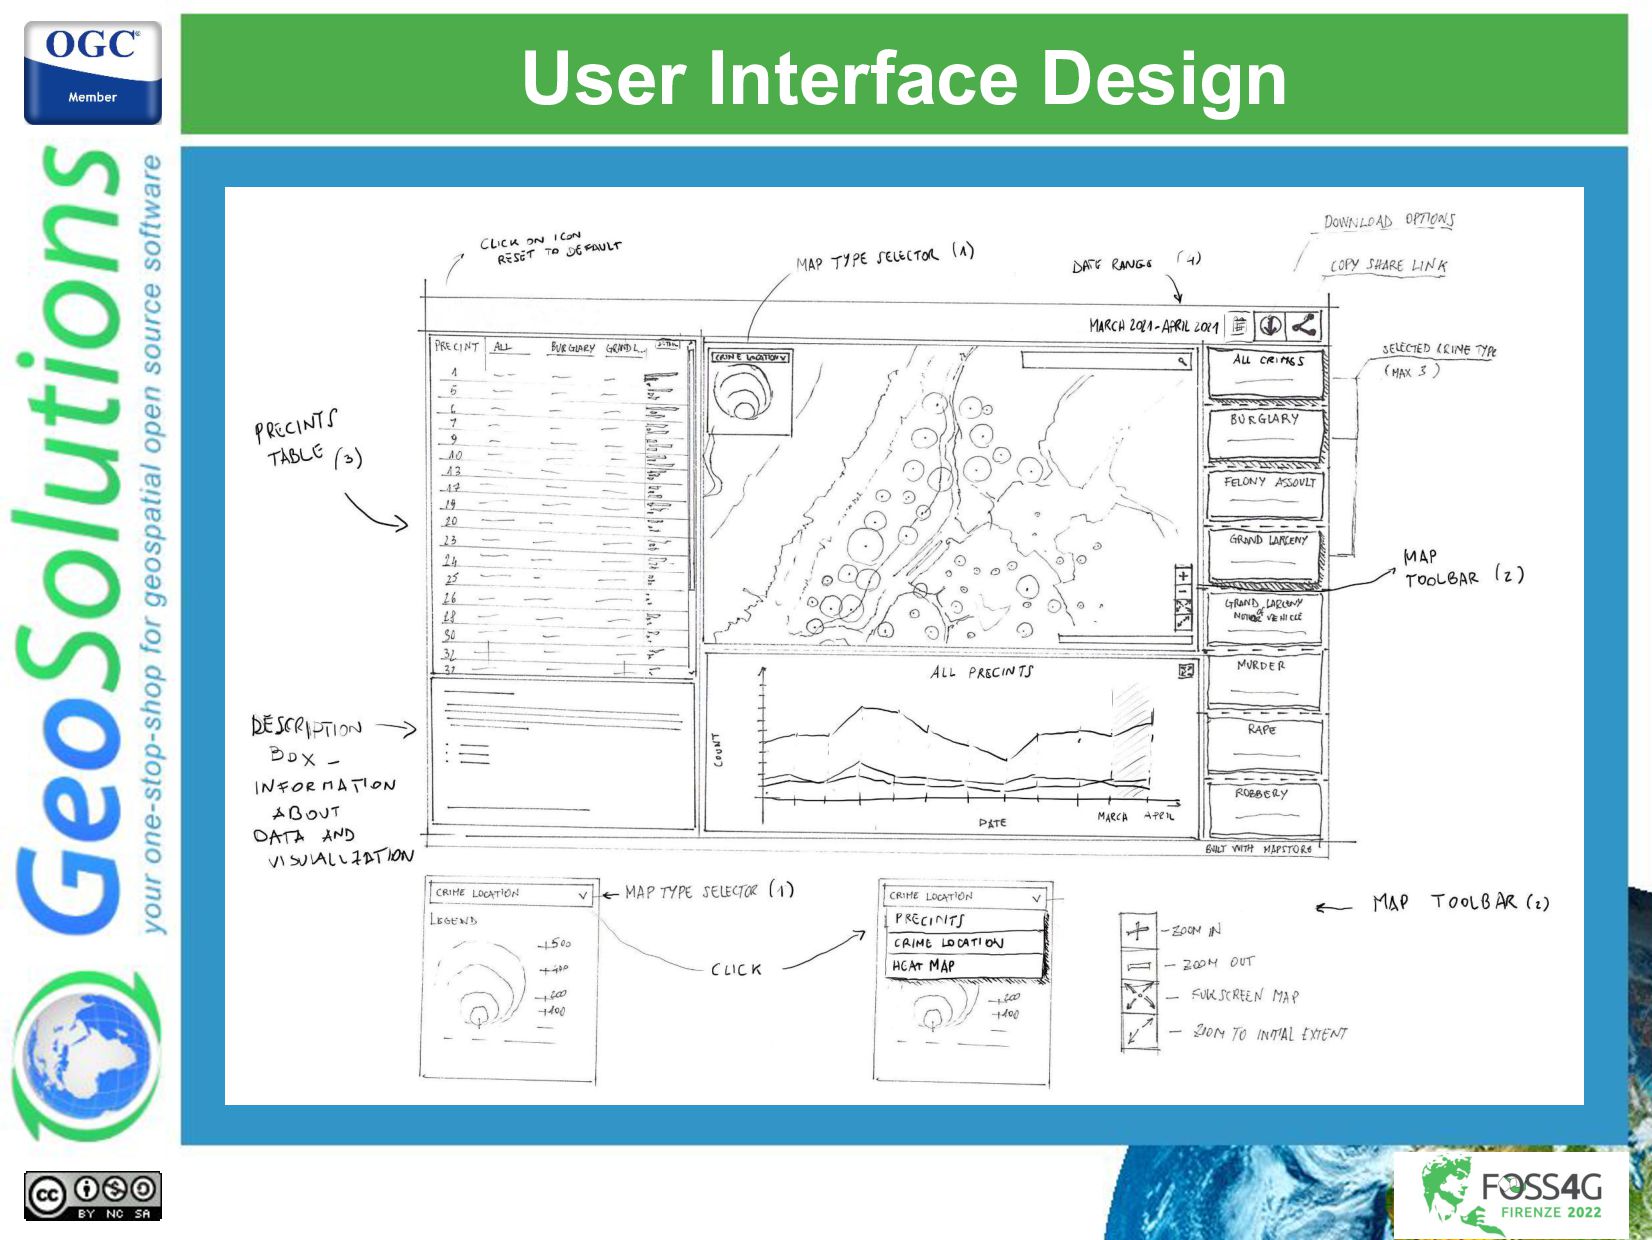
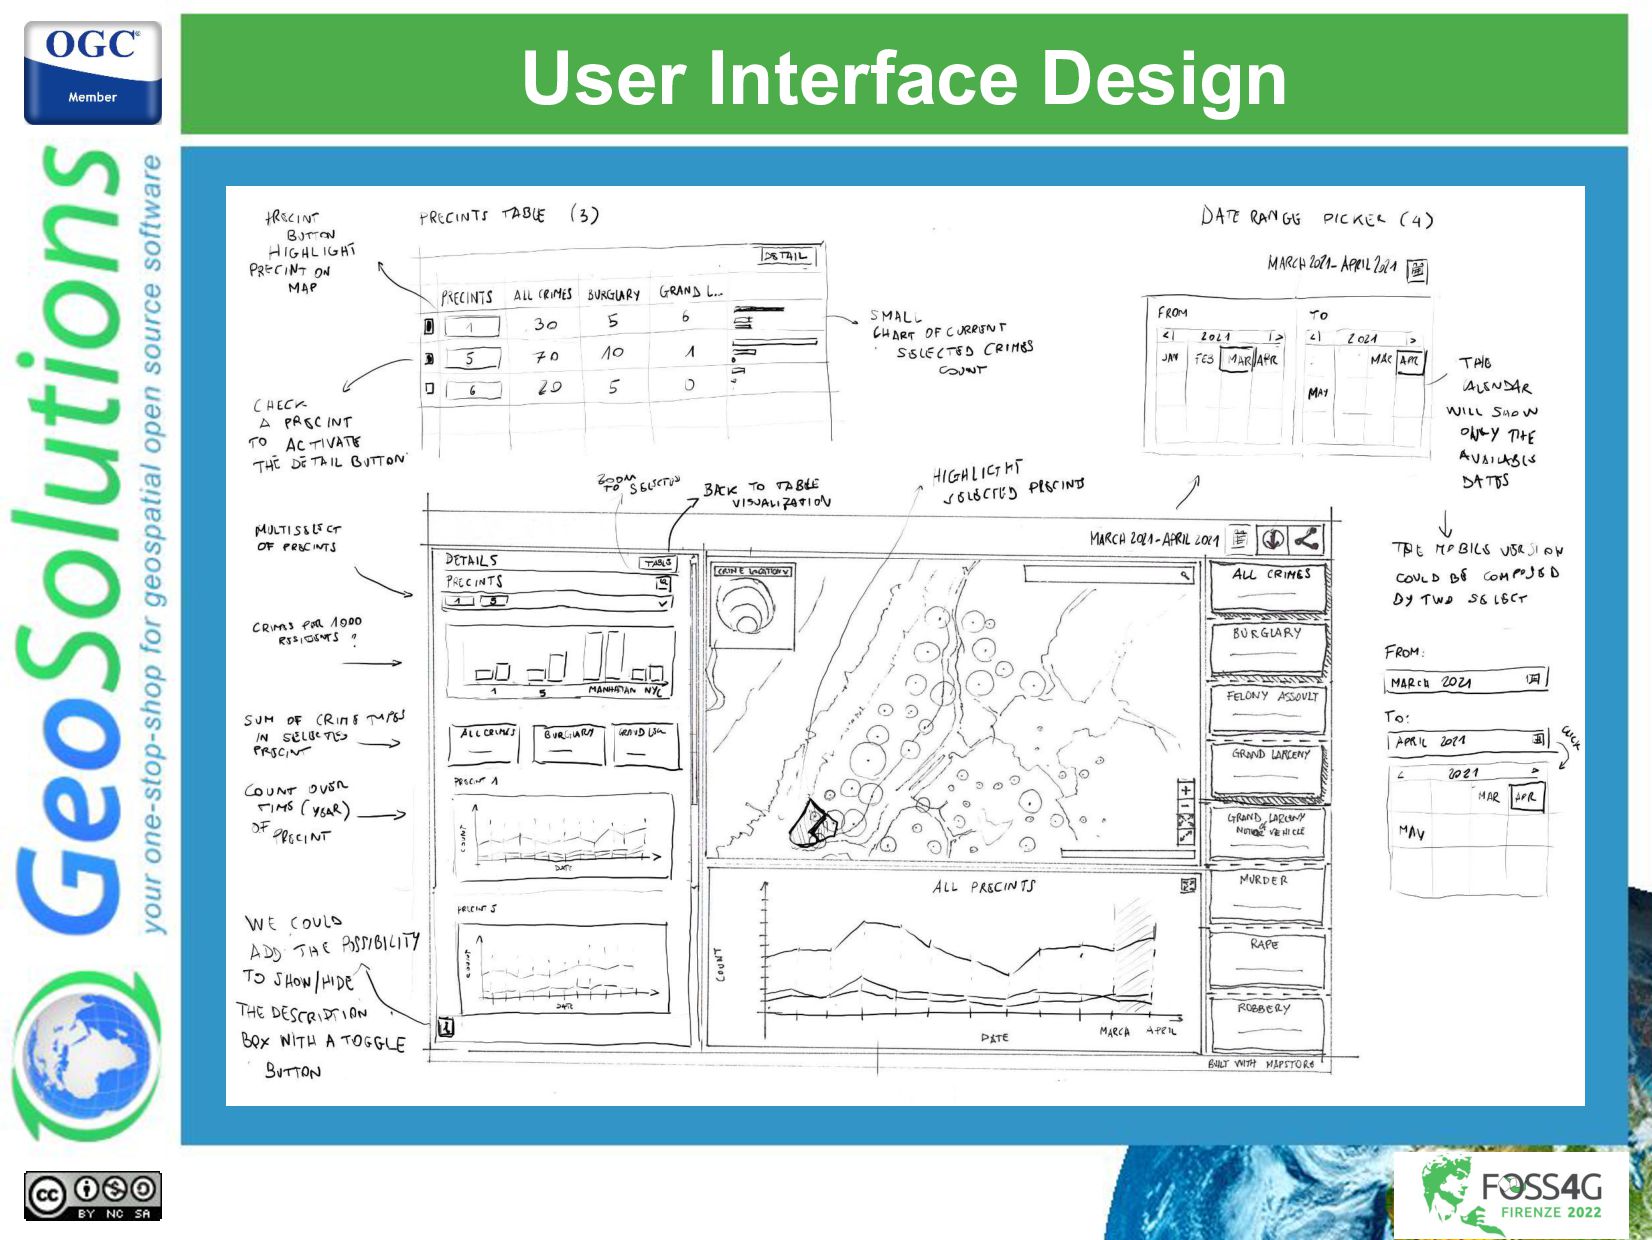
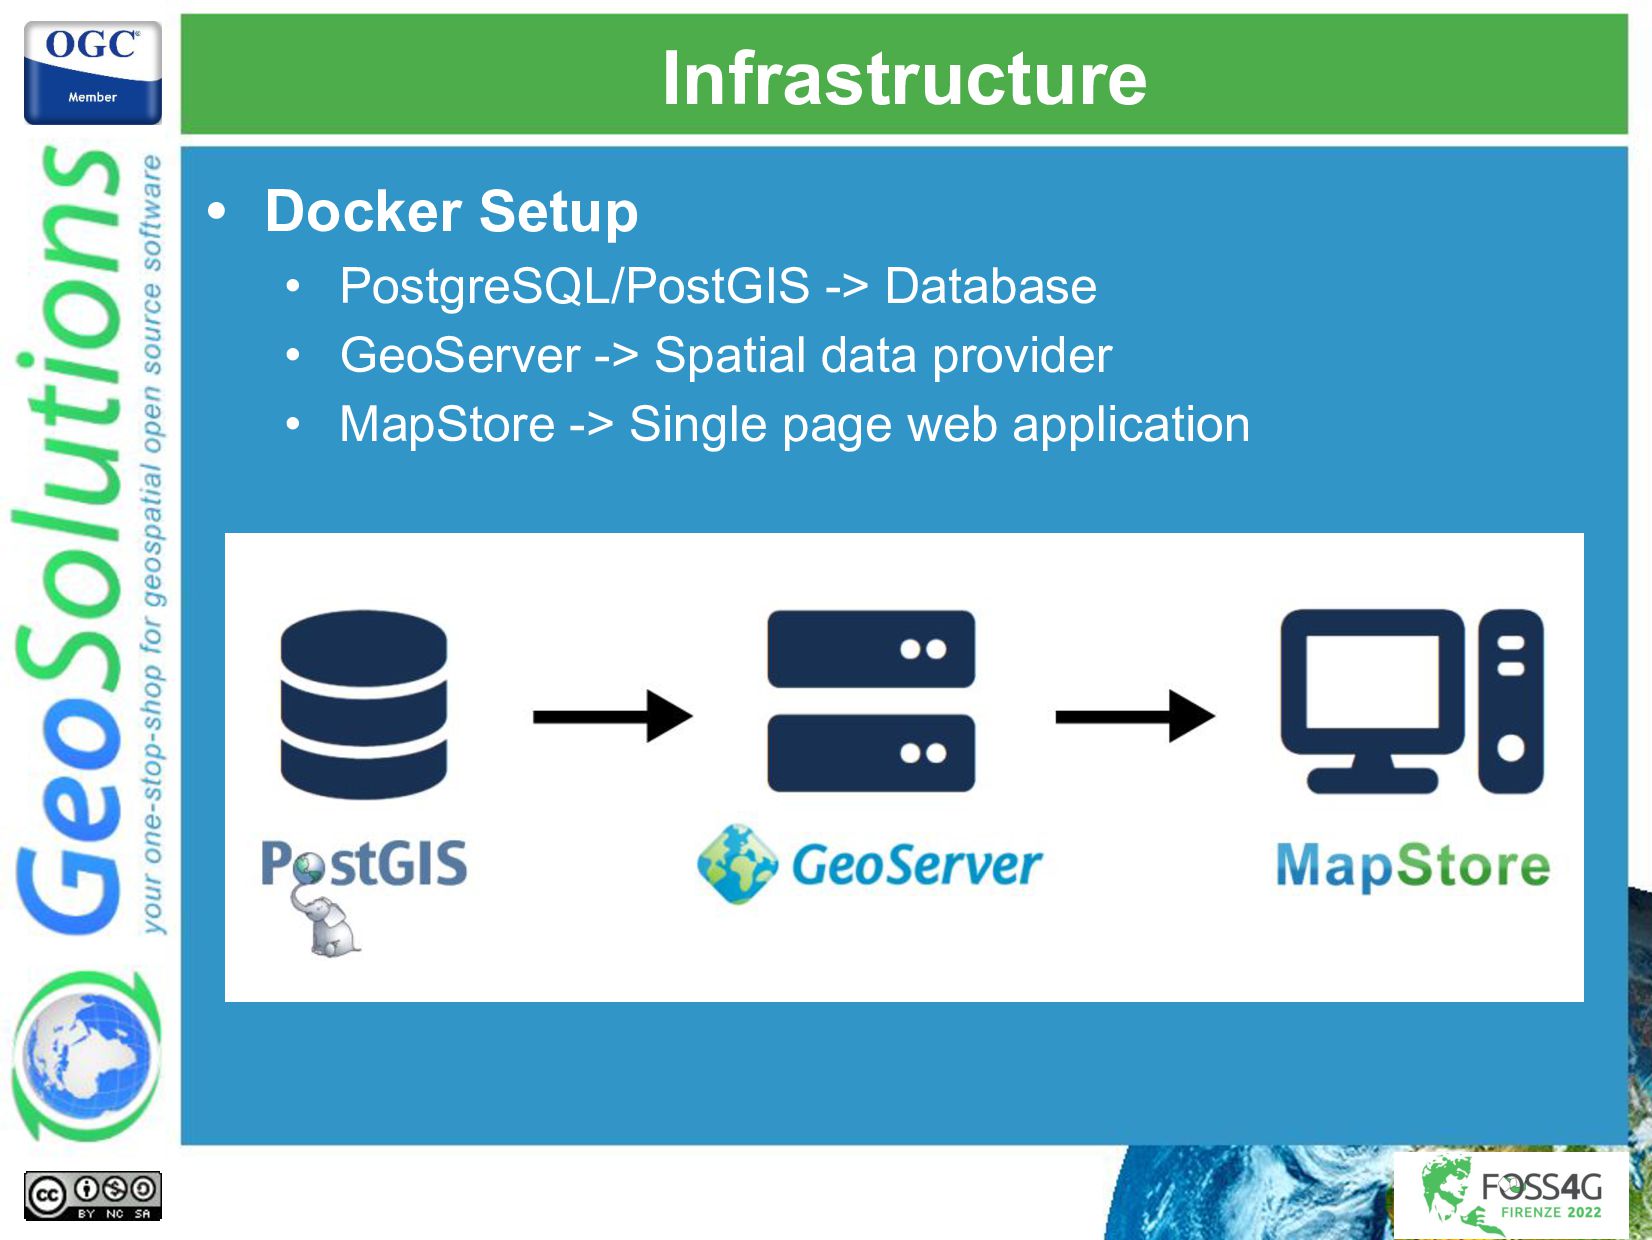
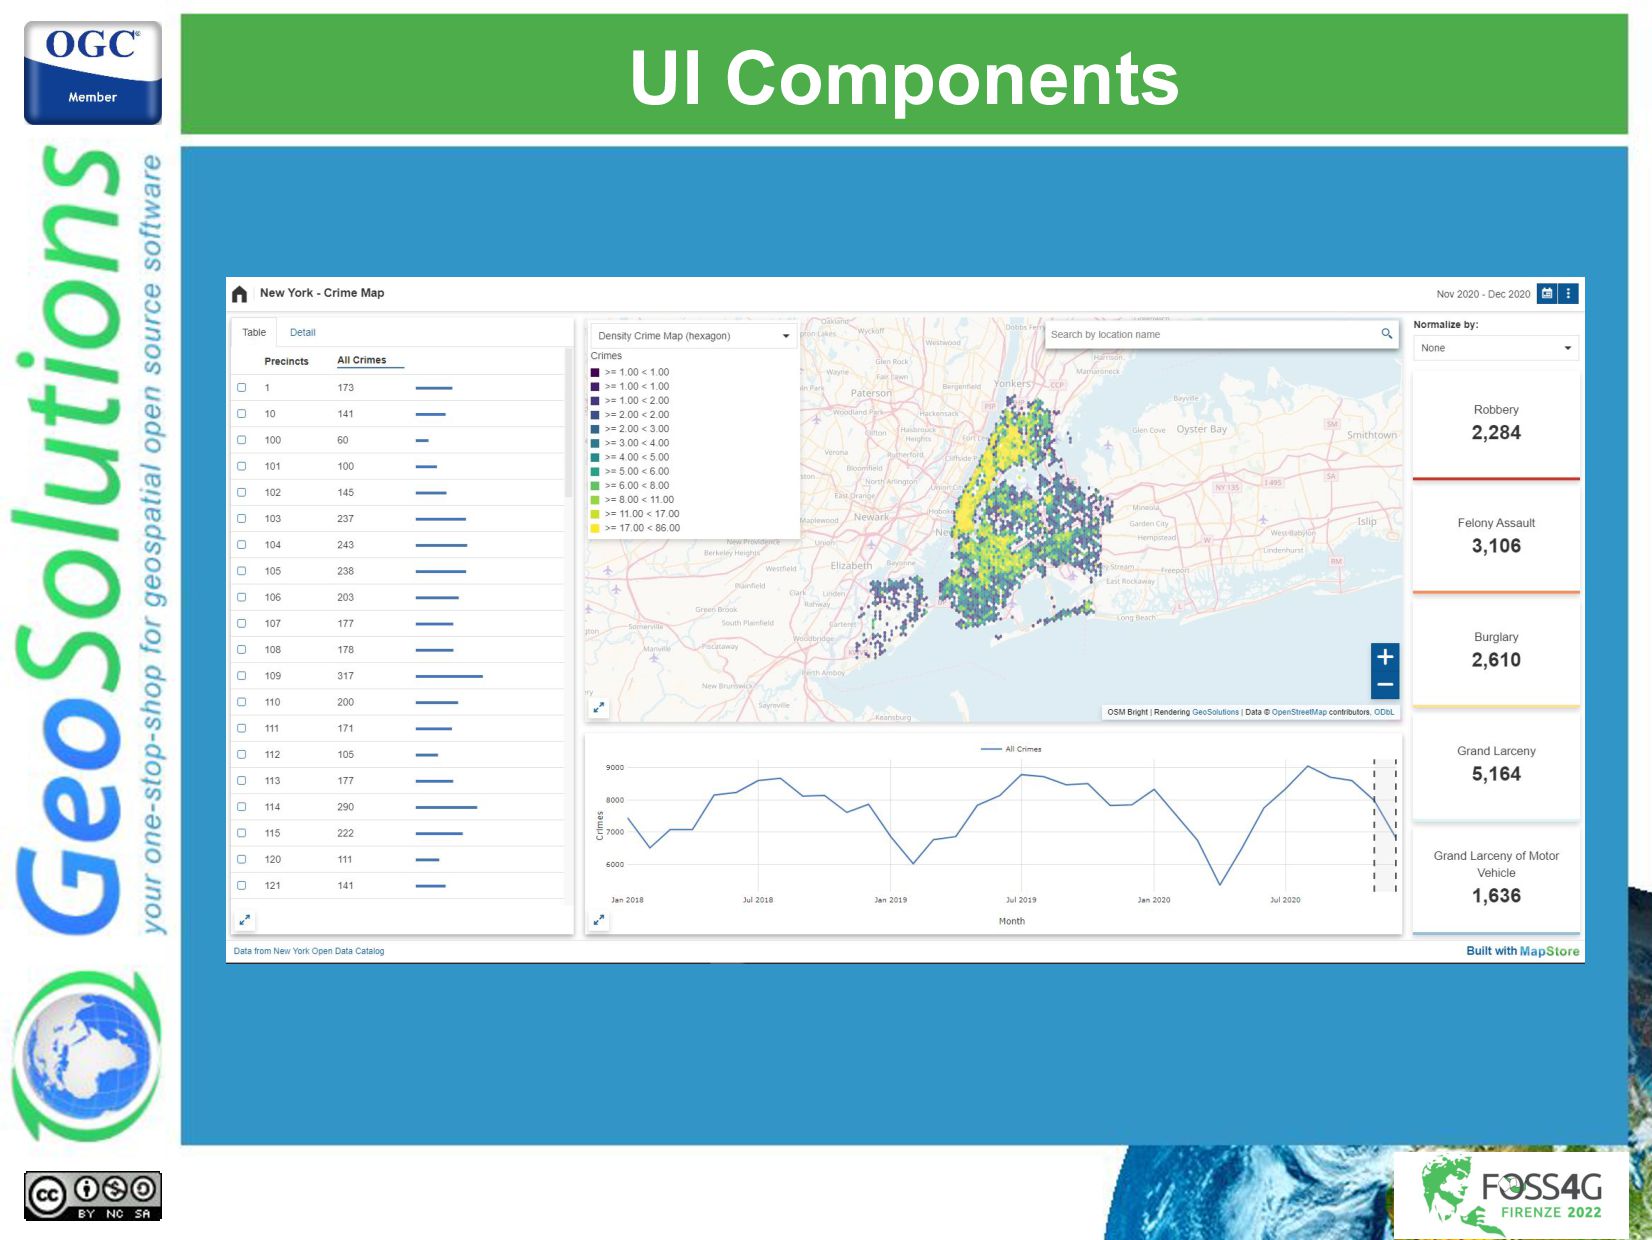
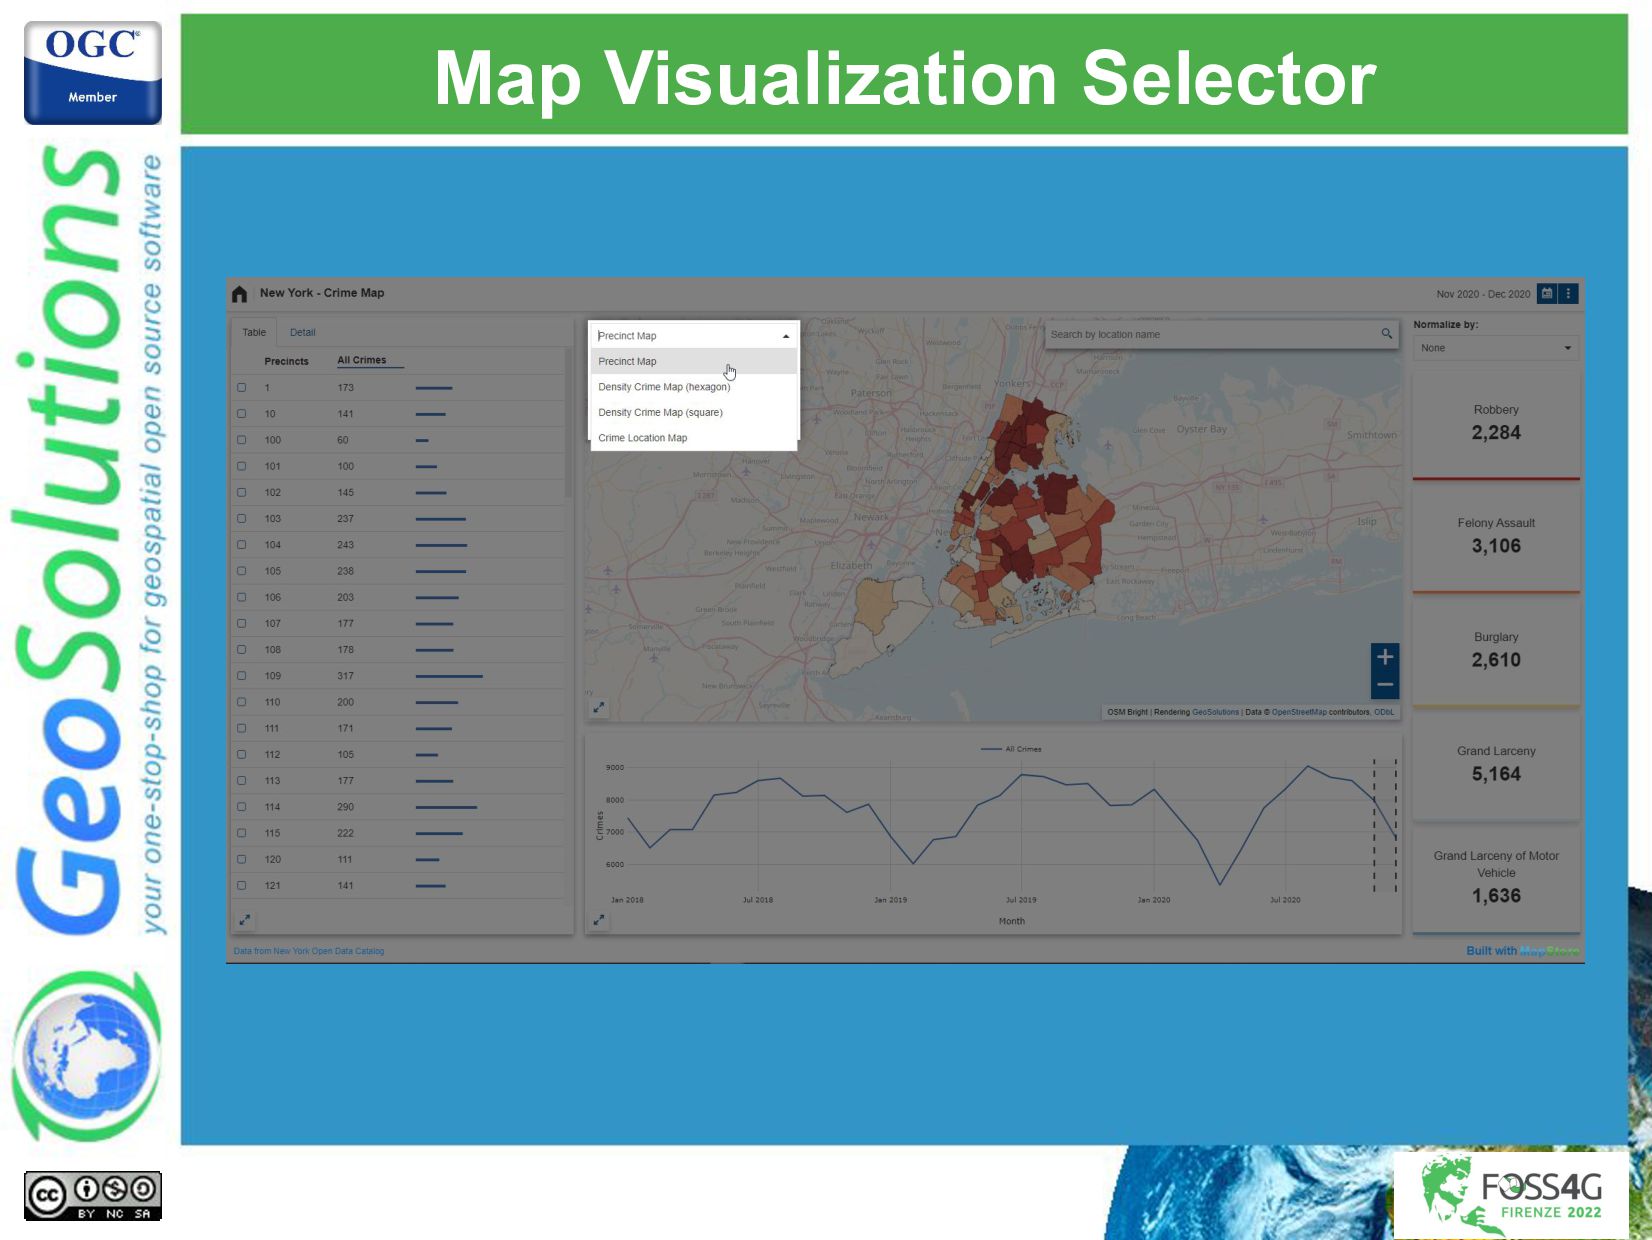
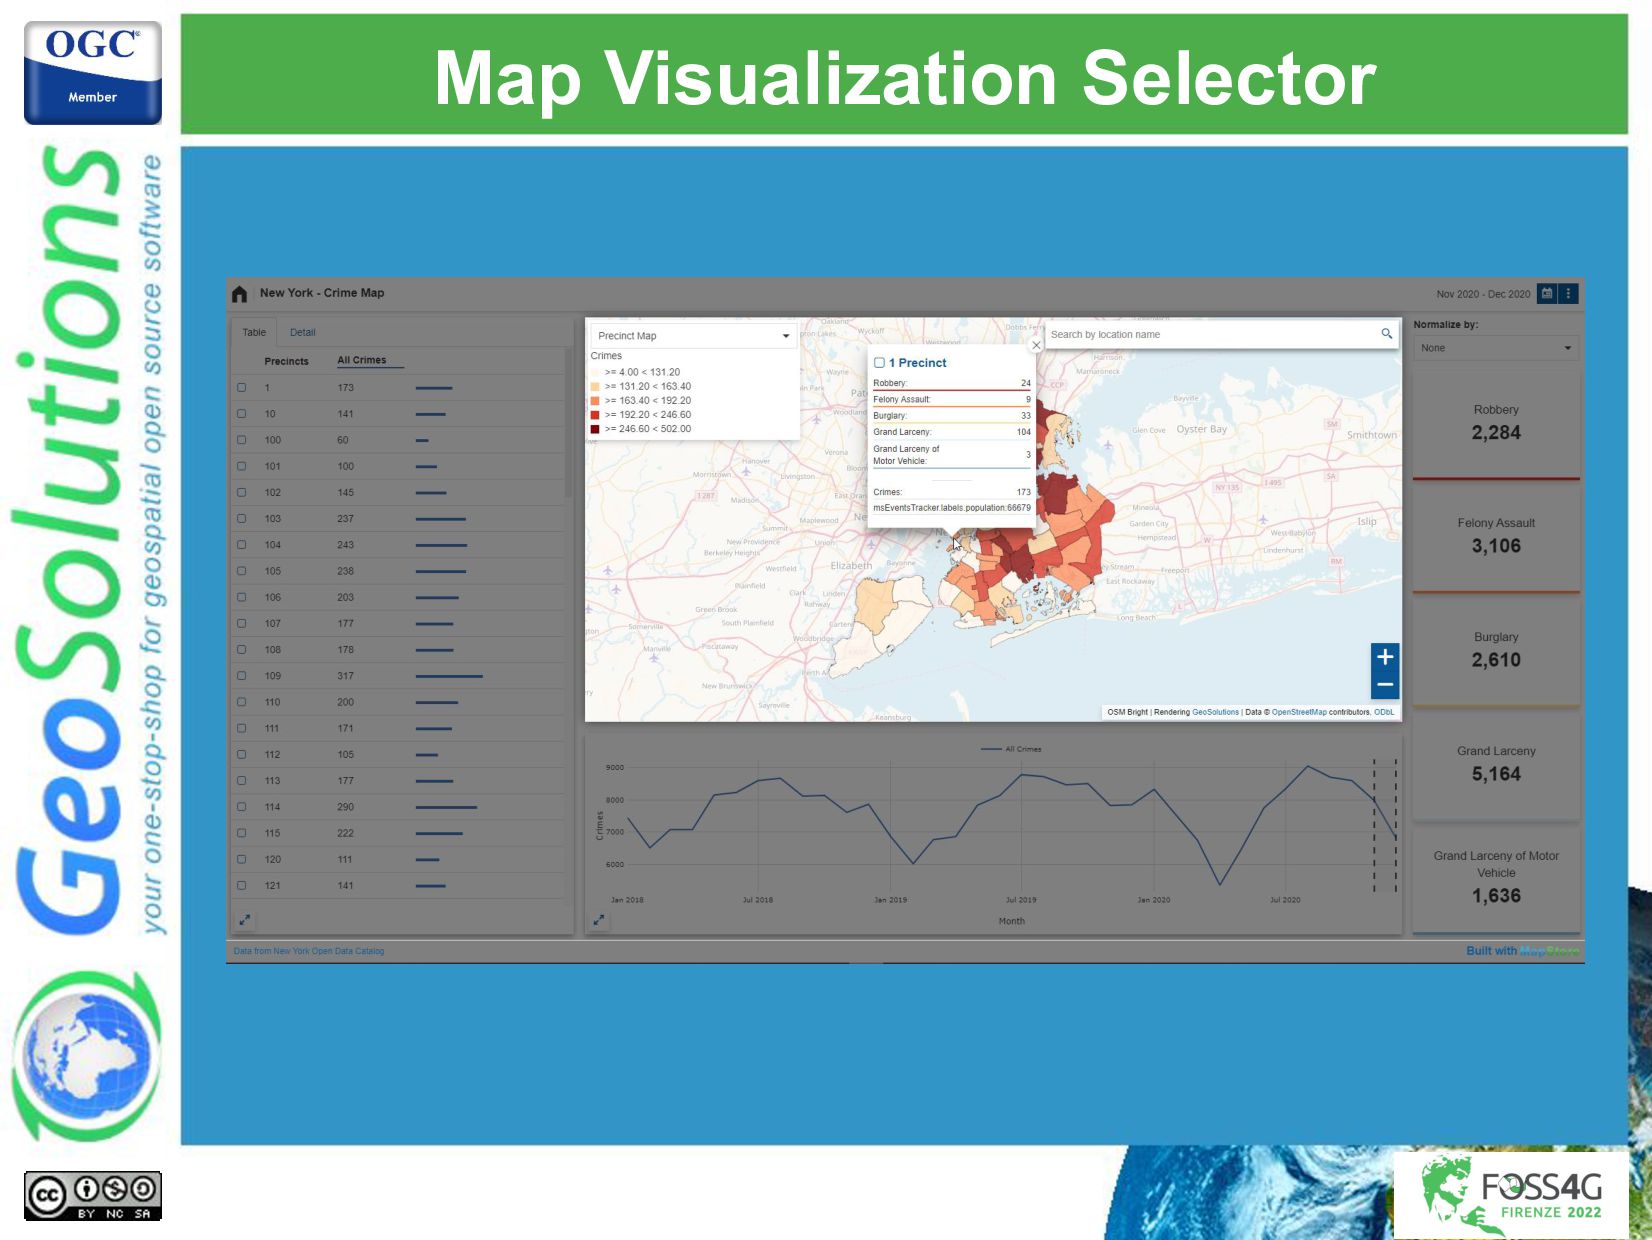
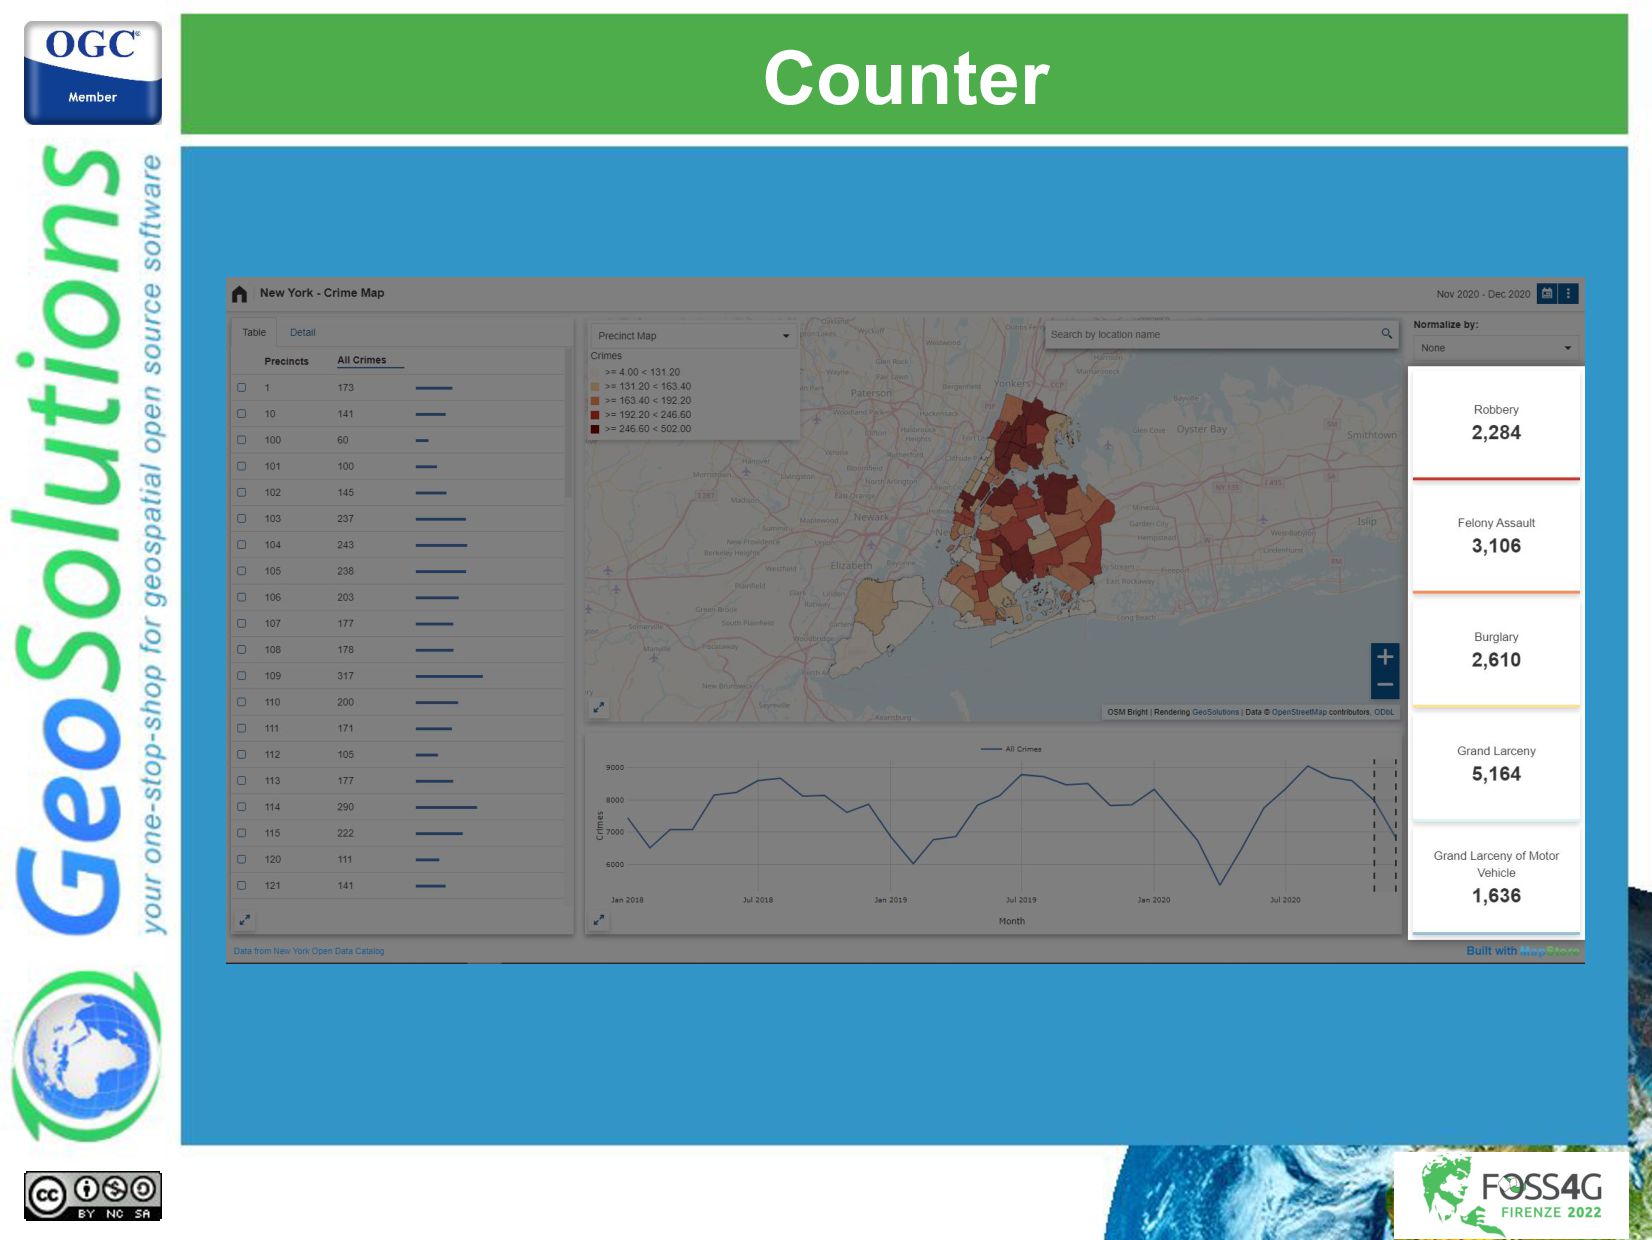
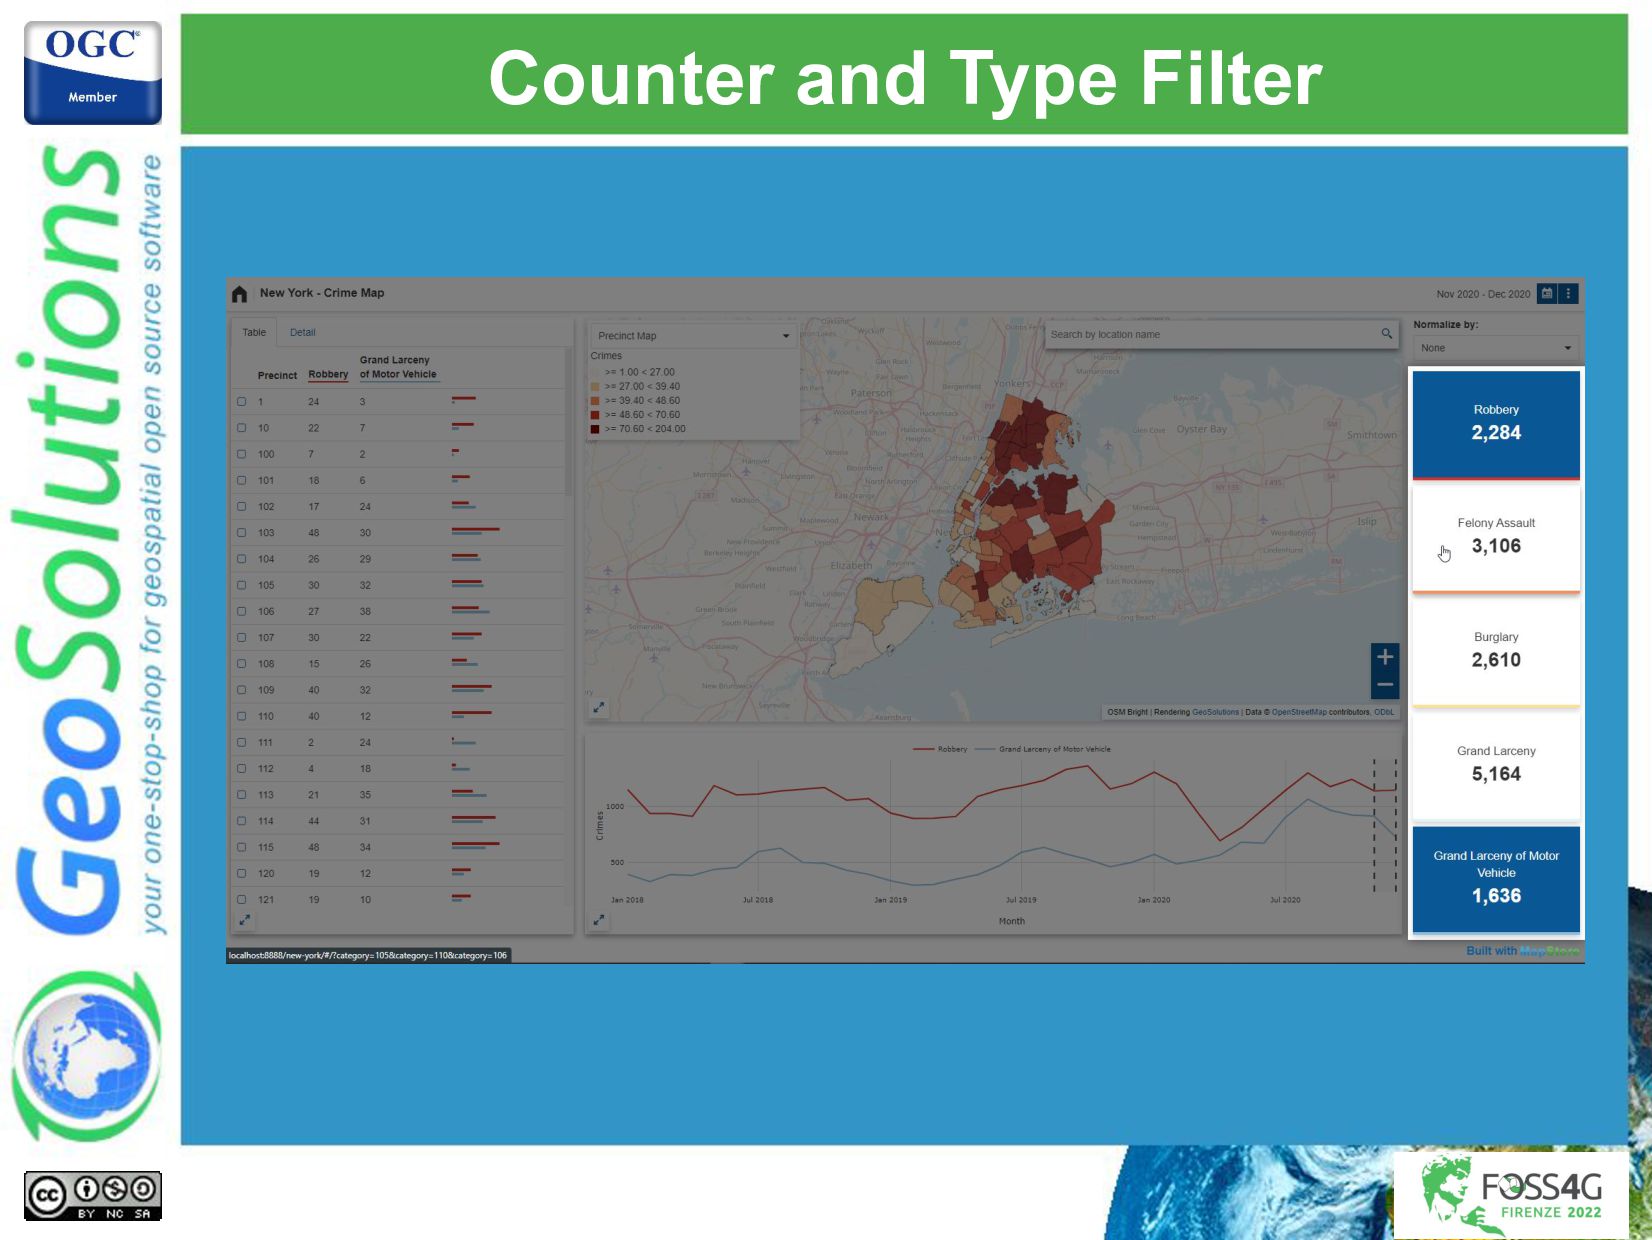
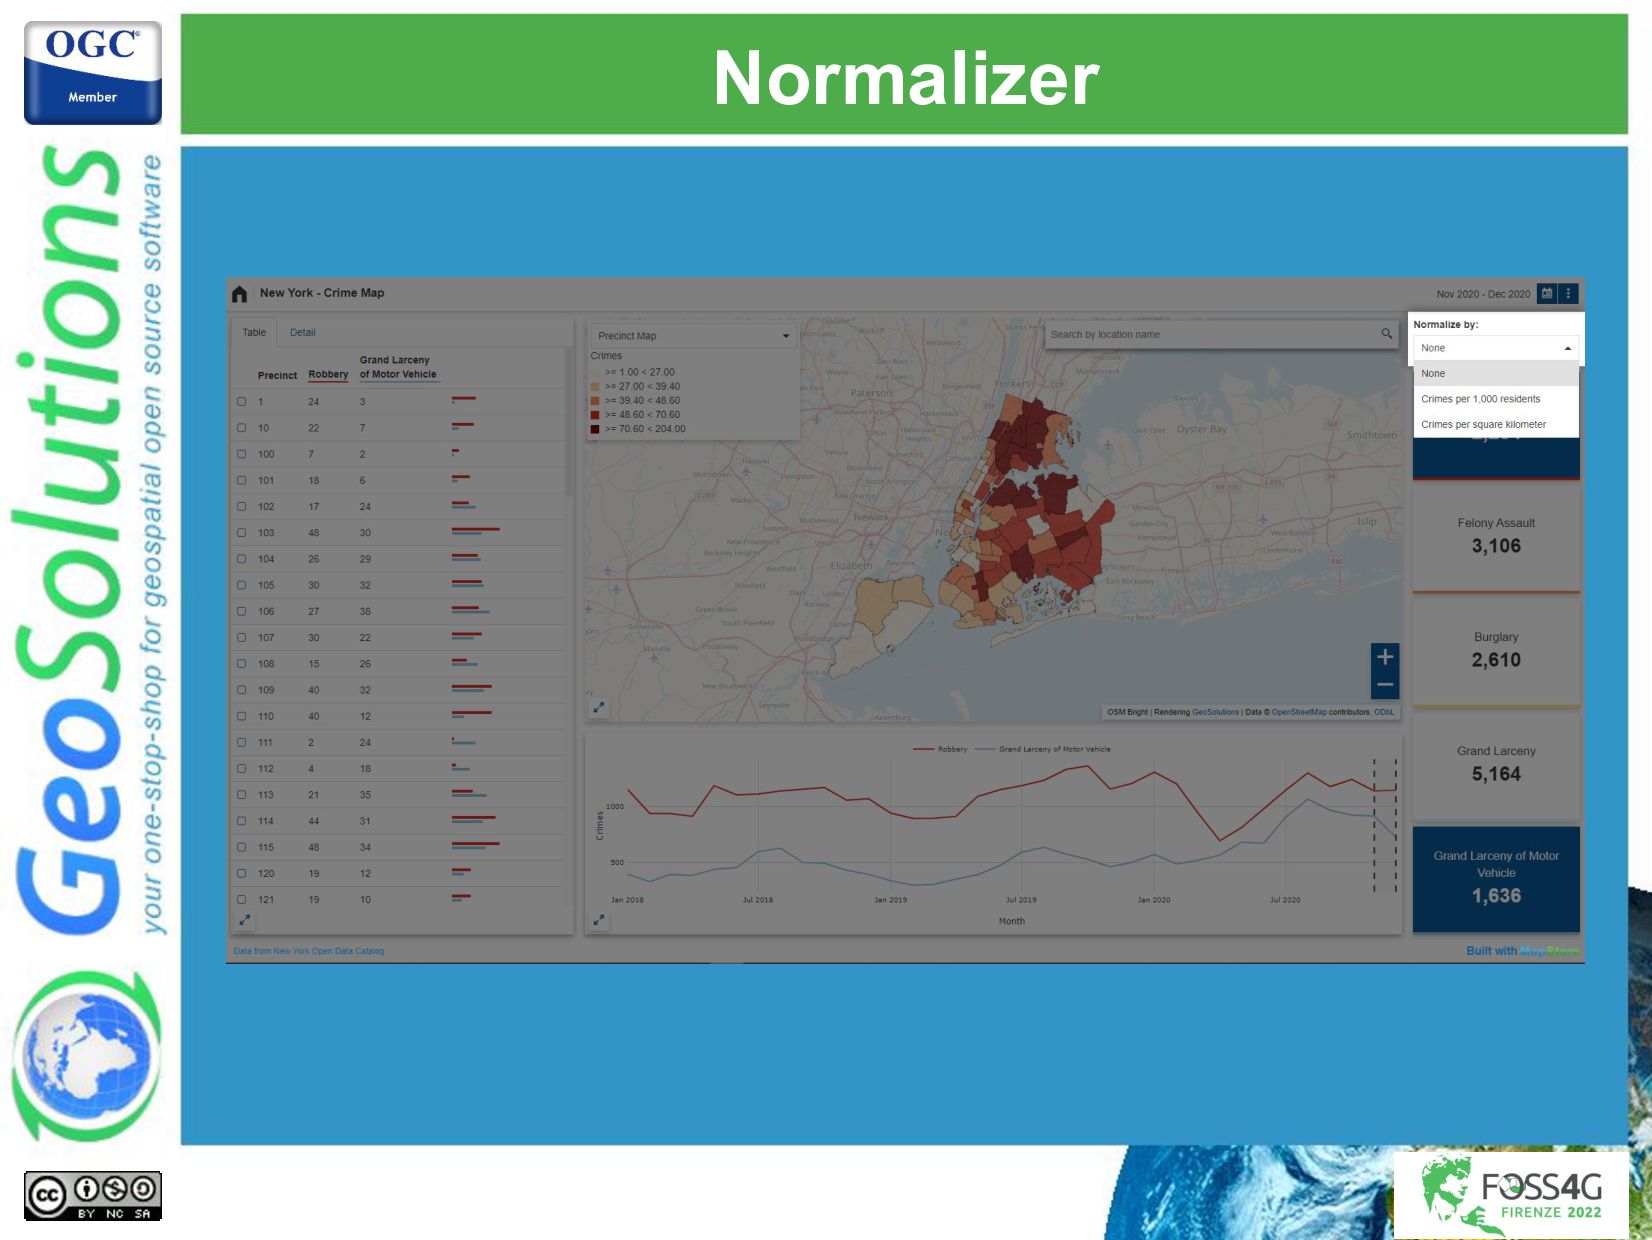
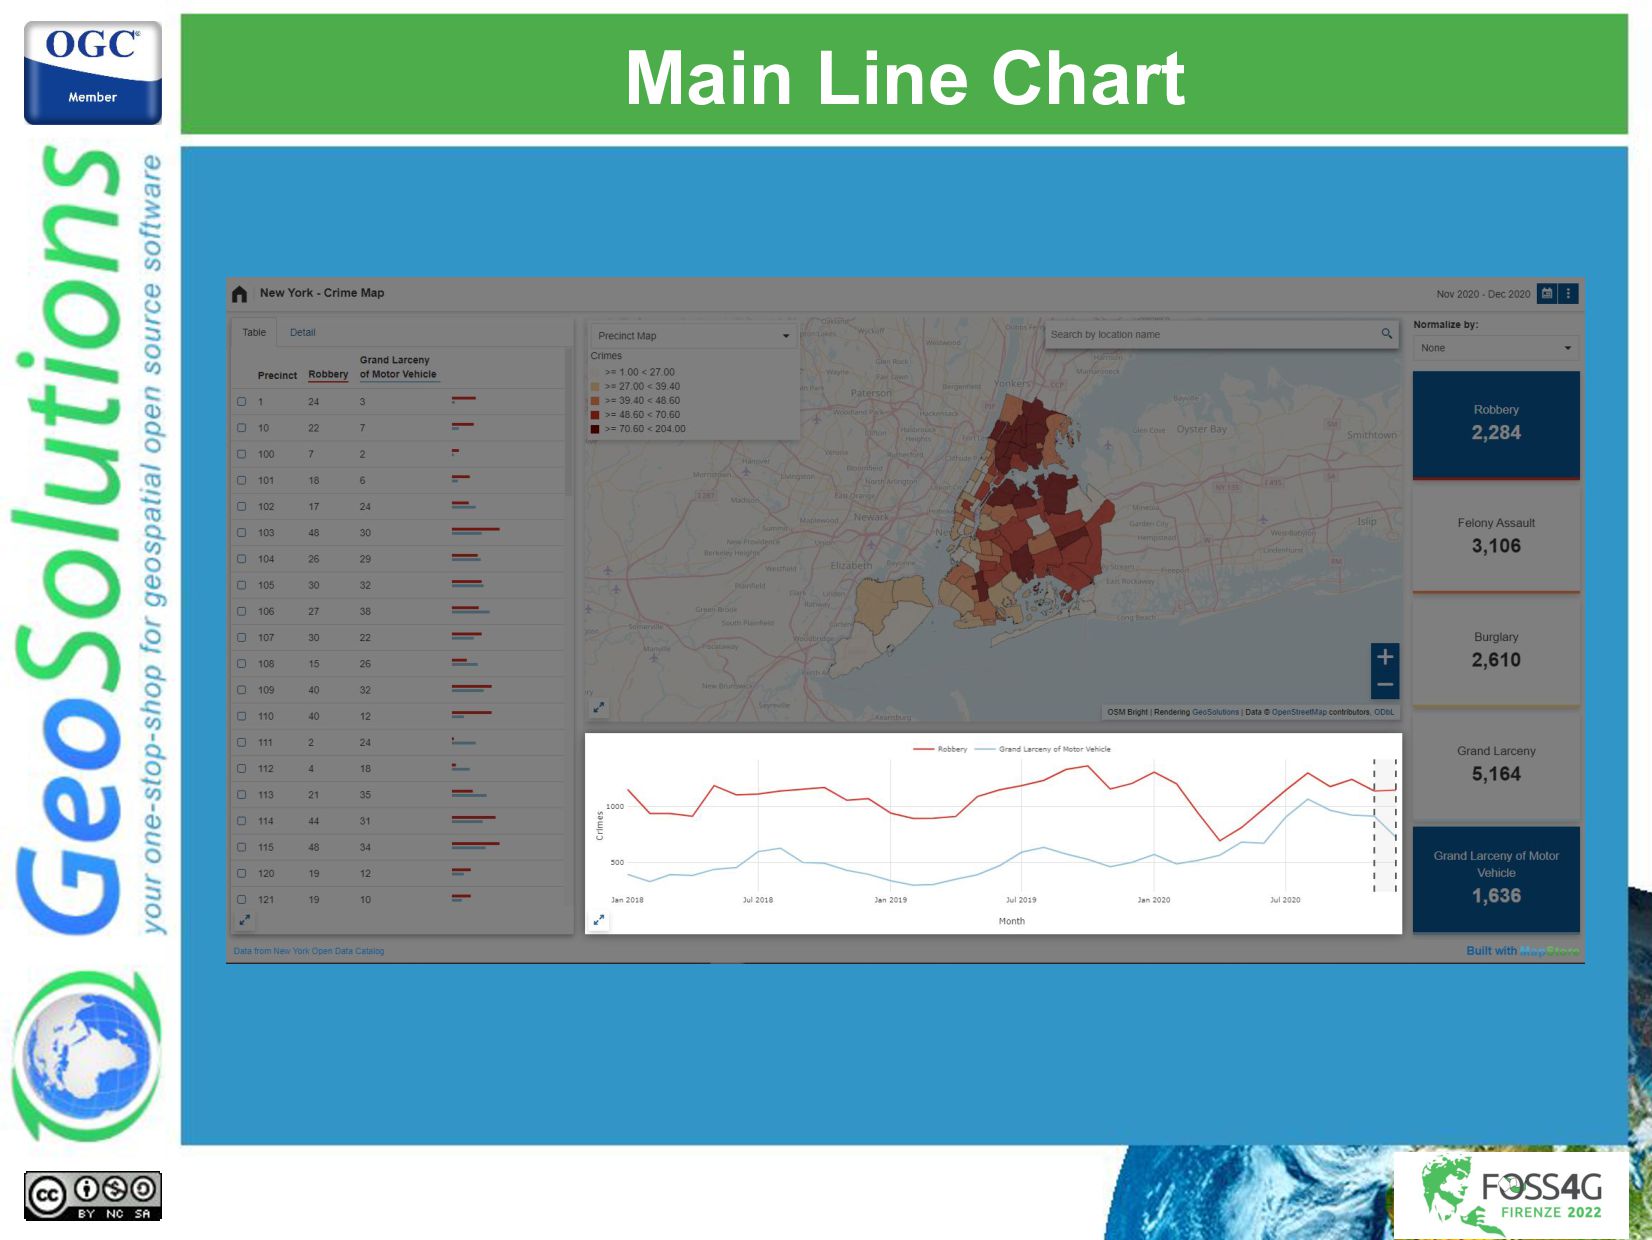
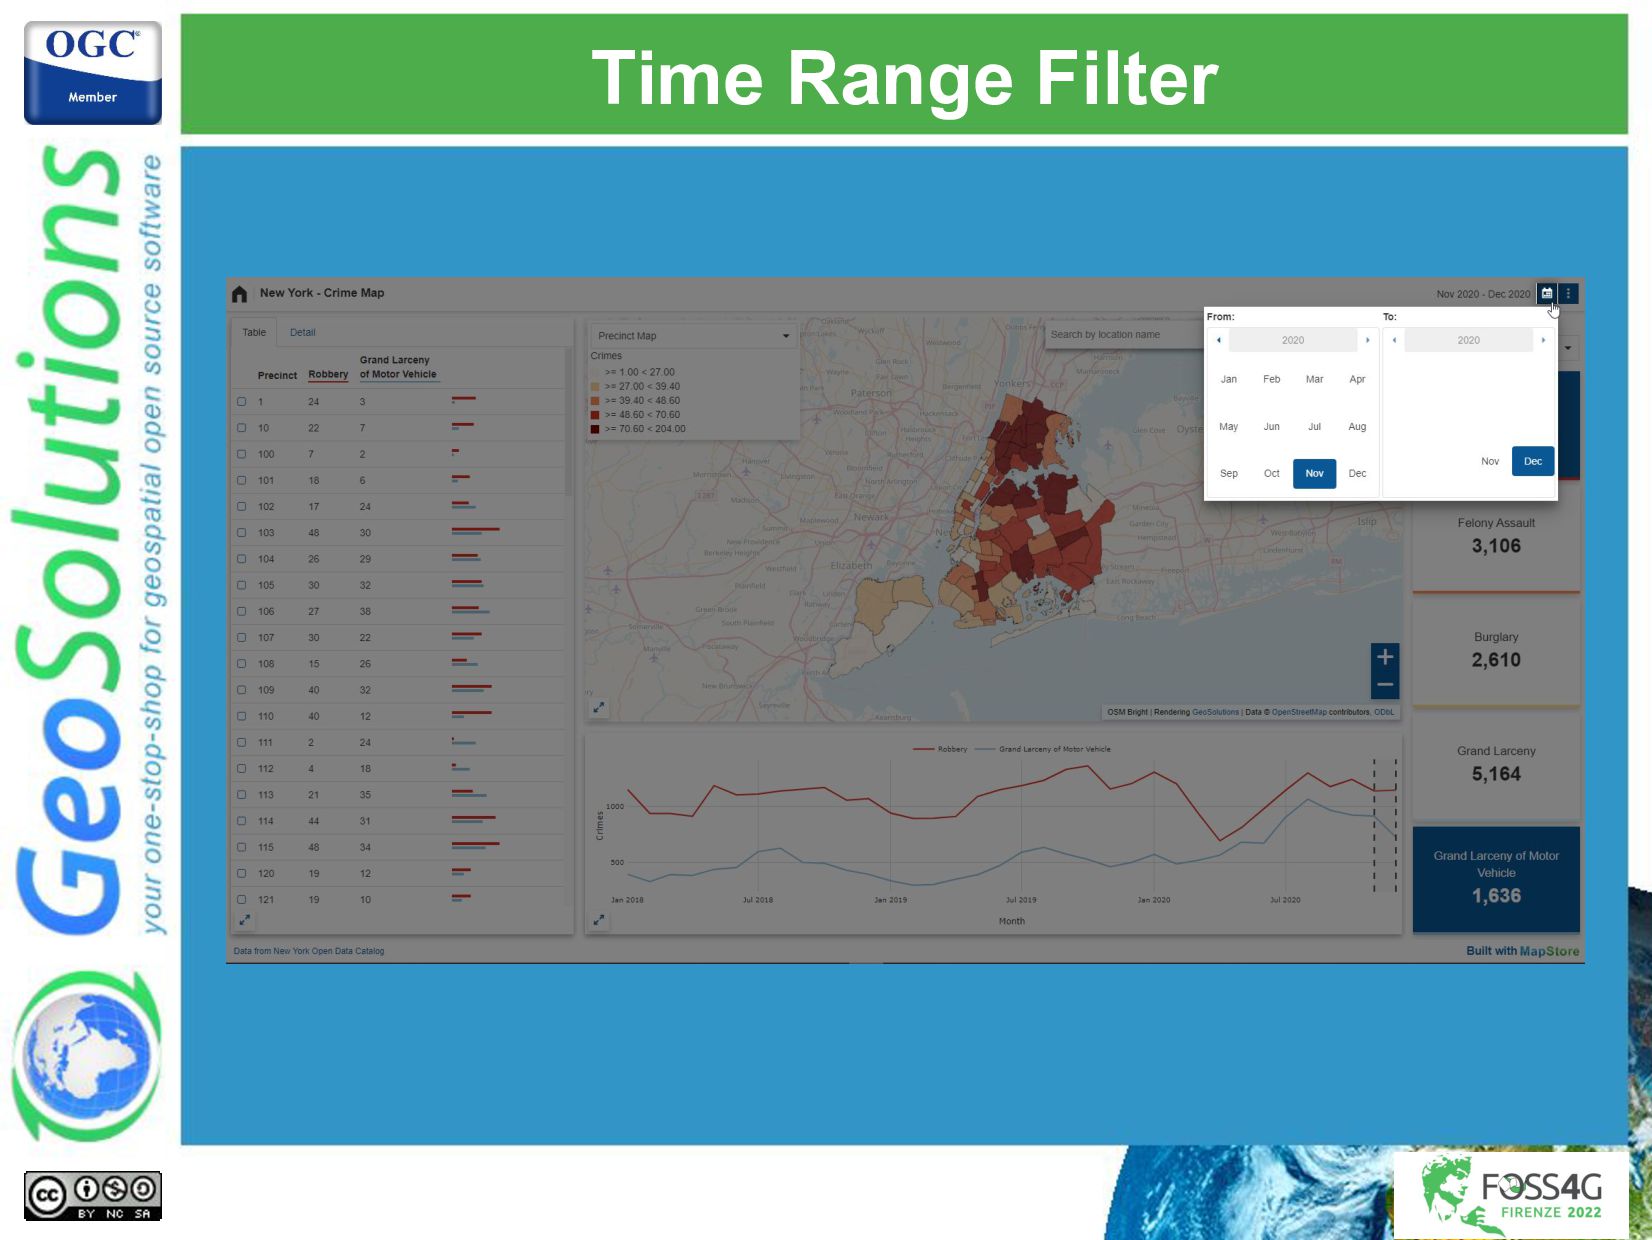
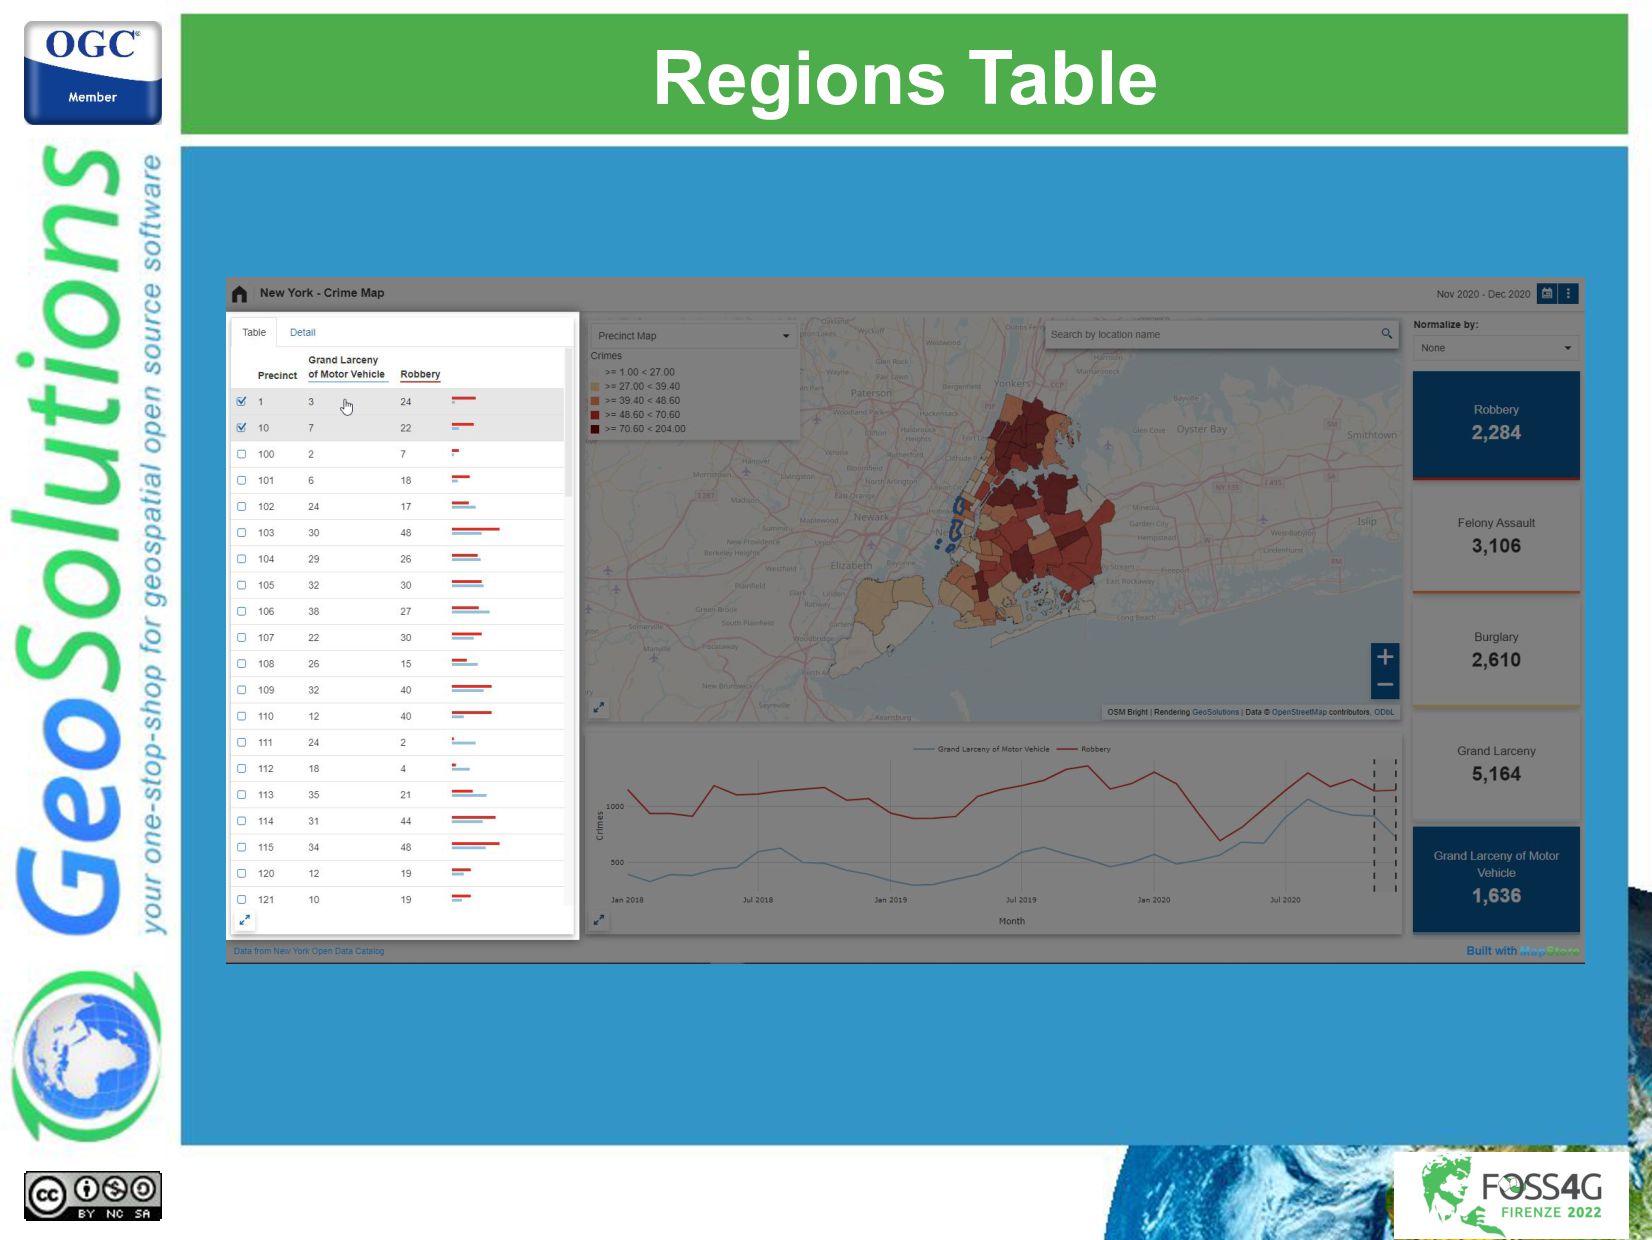
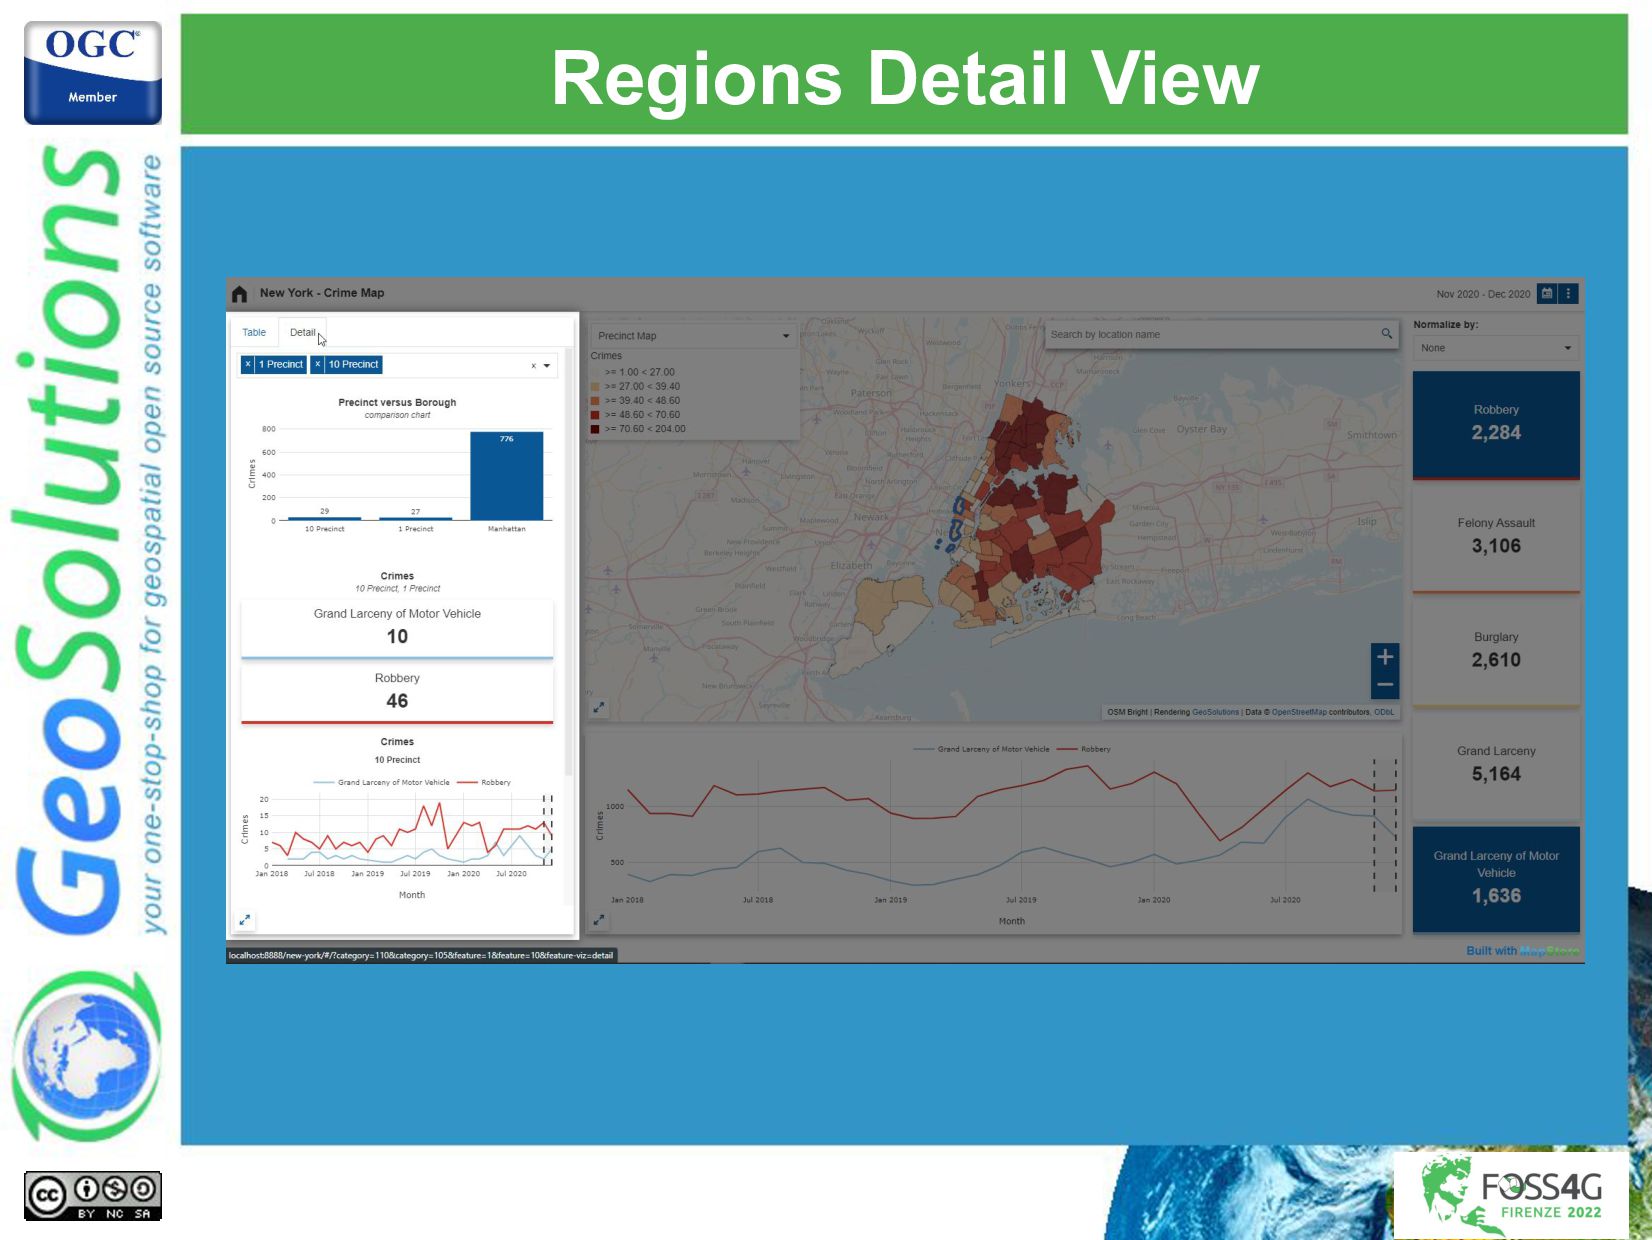
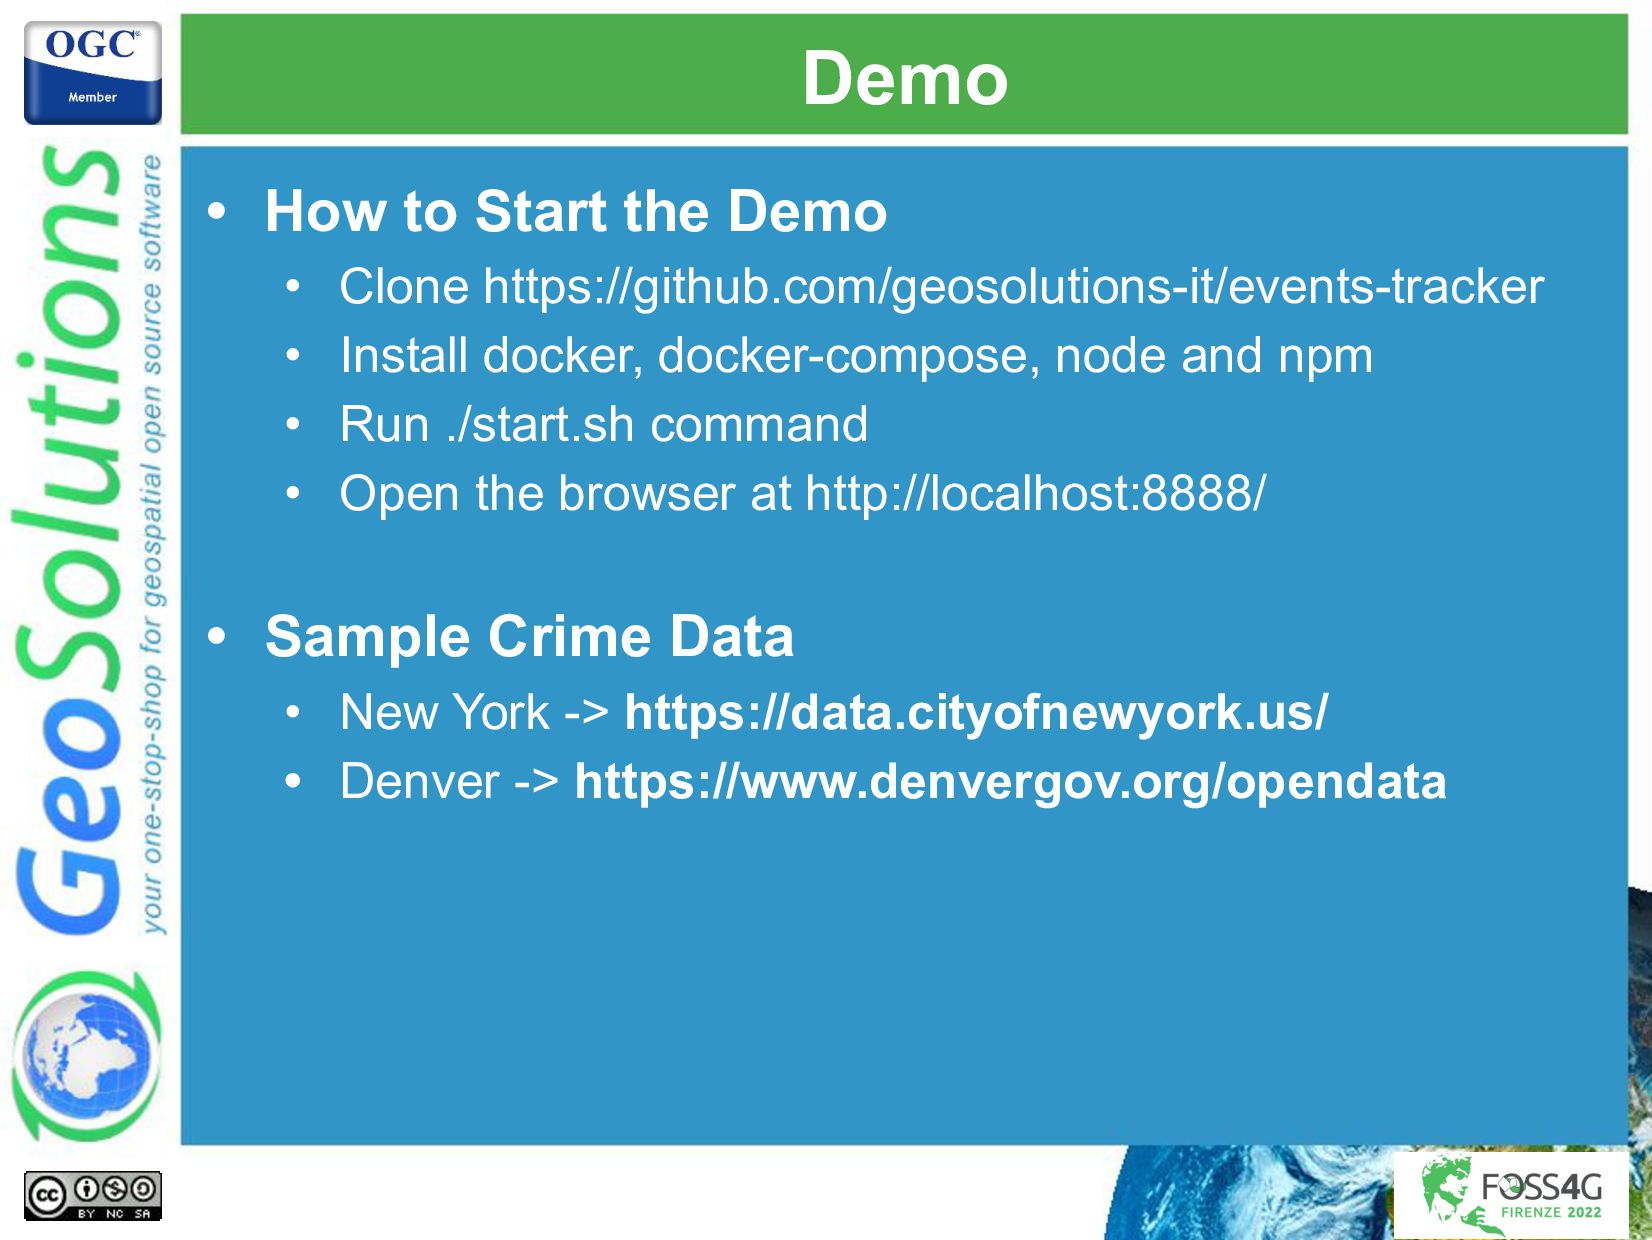
The presentation will focus on the use of MapStore as web gis framework to create a modular, reproducible, simple yet powerful dashboard to visualize crime data (but in reality many different types of location based data) leveraging on GeoServer and PostGIS advanced functionalities. We will describe the main steps for creating such an infrastructure leveraging on the MapStore components and framework then we will cover how the existing dashboard template can be configured to work with your own data sources (eventually touching the needed processing steps for the data itself) including GeoServer and PostGIS advanced functionalities.
We will eventually discuss further improvements and new features to evolve the current capabilities to capture new and emerging requirements.

The goal of this presentation is twofold, on one side we are addressing developers in order to show them advanced usage of MapStore to develop compelling applications on the other side we will be addressing power users and system administrators willing to deploy the Crime Mapping dashboard to make their own data available without writing code.

Simone Giannecchini

August 31, 2022
Tweet

More Decks by Simone Giannecchini

Other Decks in Technology

Transcript

  1. GeoSolutions • Offices in Italy & US, Worldwide clients •

    30+ collaborators, 25+ Engineers • Our products • Our Offer Enterprise Support Services Deployment Subscription Professional Training Customized Solutions GeoNode
  2. Affiliations We strongly support Open Source, it Is in our

    core We actively participate in OGC working groups and get funded to advance new open standards We support standards critical to GEOINT
  3. • Crime Location Data • Point geometry • Type property

    • Date property • Visualization in a Web Application • Map visualization • Charts and table visualizations • Possibility to count and filter data based on type/date/precinct Initial Requirements
  4. • Interaction with GeoServer OGC Services • WFS + SQL

    Views -> GeoJSON layer • WPS -> Chart/Table data • WMS -> Background layer Initial Test and Experimentations
  5. • MapStore Framework • Map component (OpenLayers, Leaflet and Cesium)

    • Configurable plugins container architecture User Interface https://github.com/geosolutions-it/mapstore-covid-us
  6. • Docker Setup • PostgreSQL/PostGIS -> Database • GeoServer ->

    Spatial data provider • MapStore -> Single page web application Infrastructure
  7. • Event • it has an identifier • it is

    categorized by different types • it has a date time information • it is associated with a region with identifier (eg. precinct) • it is a point geometry • Region • it has an identifier • it is a polygon geometry • it could be included in an higher administrative level • it could be associated with a population count Event and Region Data
  8. • Access to an Open Data Portal (eg. NYC) •

    Search a dataset (eg. NYPD-Complaint-Data-Historic) • Filter data by categories and time range • Finally export as CSV Download Event Data
  9. • Access to an Open Data Portal (eg. NYC) •

    Search a region dataset (eg. Police-Precincts) • Download as format that support spatial data Download Region Data
  10. • Create an SQL Script • Rename columns to normalize

    properties • Conversion of latitude and longitude to point geometry • Include new month properties generated from date formatted as YYYYMM to events • Include missing properties (eg. population) • Setup events-tracker docker compose • Add the new script in the sql/ folder • Edit docker-compose.yml and add a new sql entry to the postgres volumes Data Conversion
  11. • Initial Datastore Layers • event • region • Generated

    SQL Views Layers • extended events with region group name and population • extended regions with events count • hexagon cluster with events count • square cluster with events count • point cluster with events count Generated Layers
  12. • Generated New Layers Based on Event and Regions Table

    with SQL Statements via GeoServer SQL View Layers
  13. • Generated New Layers Based on Event Table with SQL

    Statements via GeoServer SQL View Layers
  14. mapstore-events-tracker is a MapStore downstream project that: • has been

    implemented on top of @mapstore/project experimental package • uses the frontend framework only • adds custom plugin for the specific use case • publishes custom bundles via npm package MapStore Events Tracker
  15. • Initialize a new client project template with npx mapstore-events-tracker

    create ./my-project • The script provides • Static assets such as css, js files, images, … • Configurations files • localConfig.json • map.json • viewerConfig.json • Translations files Client Configurations
  16. • localConfig.json • generic configuration properties (locales, translations paths, …)

    • plugins components enabled in the viewer • map.json • background layers • map center, zoom, … • viewerConfig.json • endpoints and layers for charts, tables, … • map visualizations types • normalizer options Client Configurations
  17. • How to Start the Demo • Clone https://github.com/geosolutions-it/events-tracker •

    Install docker, docker-compose, node and npm • Run ./start.sh command • Open the browser at http://localhost:8888/ • Sample Crime Data • New York -> https://data.cityofnewyork.us/ • Denver -> https://www.denvergov.org/opendata Demo
  18. • Extend visualizations types including 3D views • Improve request

    of vector data • Experiment with different layer types • Improve components UX (eg. include time range filter in the main chart) Further Improvements Proposals