Upgrade to Pro — share decks privately, control downloads, hide ads and more …

State of MapStore Q1 2021

State of MapStore Q1 2021

Webinar from GeoSolutions on the recent MapStore 2021.01.00 release. Learn about enhancements related to annotations, visual style editor, asynchronous export, map comparison tools, dashboards, charts, extensions, and more.
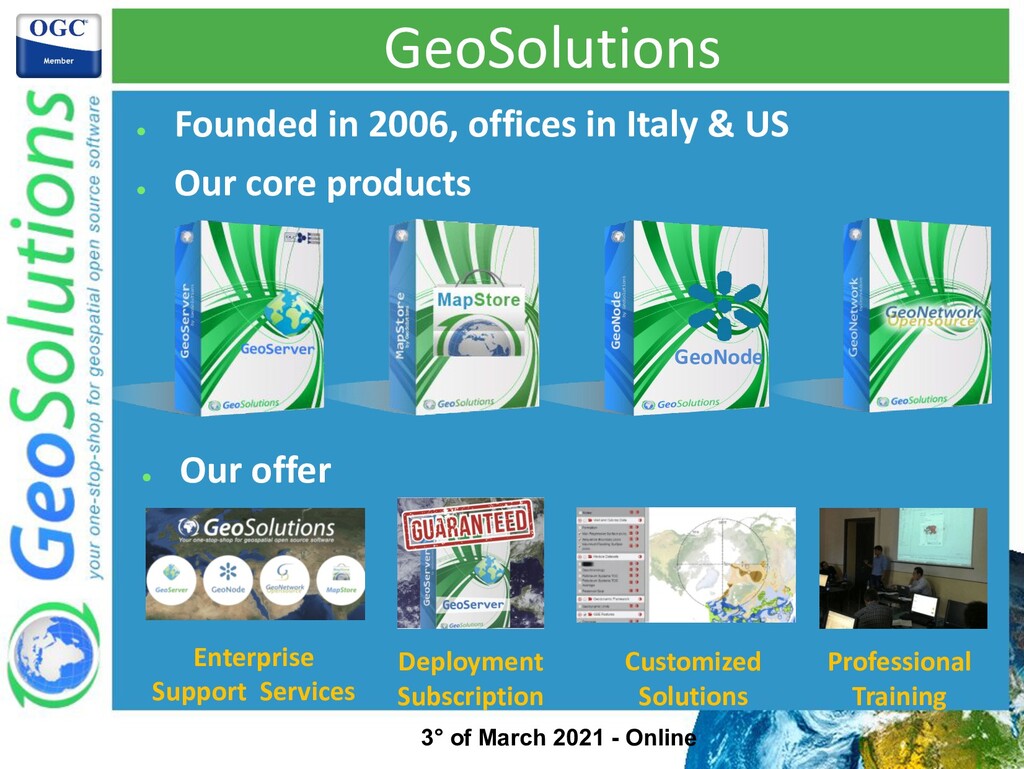
Simone Giannecchini
PRO

March 04, 2021
Tweet

More Decks by Simone Giannecchini

Other Decks in Technology

Transcript

  1. What’s new in MapStore
    Release 2021.01.00
    Tobia Di Pisa
    Lorenzo Natali
    Luis E. Bermudez
    GeoSolutions

    View Slide

  2. GeoSolutions

    Founded in 2006, offices in Italy & US

    Our core products

    Our offer
    Enterprise
    Support Services
    Deployment
    Subscription
    Professional
    Training
    Customized
    Solutions
    GeoNode
    3° of March 2021 - Online

    View Slide

  3. Trusted by more than 200 clients
    • UN FAO (CIOK, FIGIS, NRL, FORESTRY, ESTG), UN WFP, World Bank, DLR, EUMETSAT,
    JRC, ARPAT, NATO CMRE, UNESCO, IGAD, UNEP, etc..
    • BAYER, BASF, DigitalGlobe, MDA, TOPCON, SwissRE, e-GEOS, Halliburton, etc..
    3° of March 2021 - Online

    View Slide

  4. Industries
    Smart
    Cities
    Space MetOcean Defense
    Natural
    Resources
    OpenData Utilities
    Research
    Emergency
    Response
    Government
    3° of March 2021 - Online

    View Slide

  5. Associations
    We strongly support Open
    Source, it Is in our 
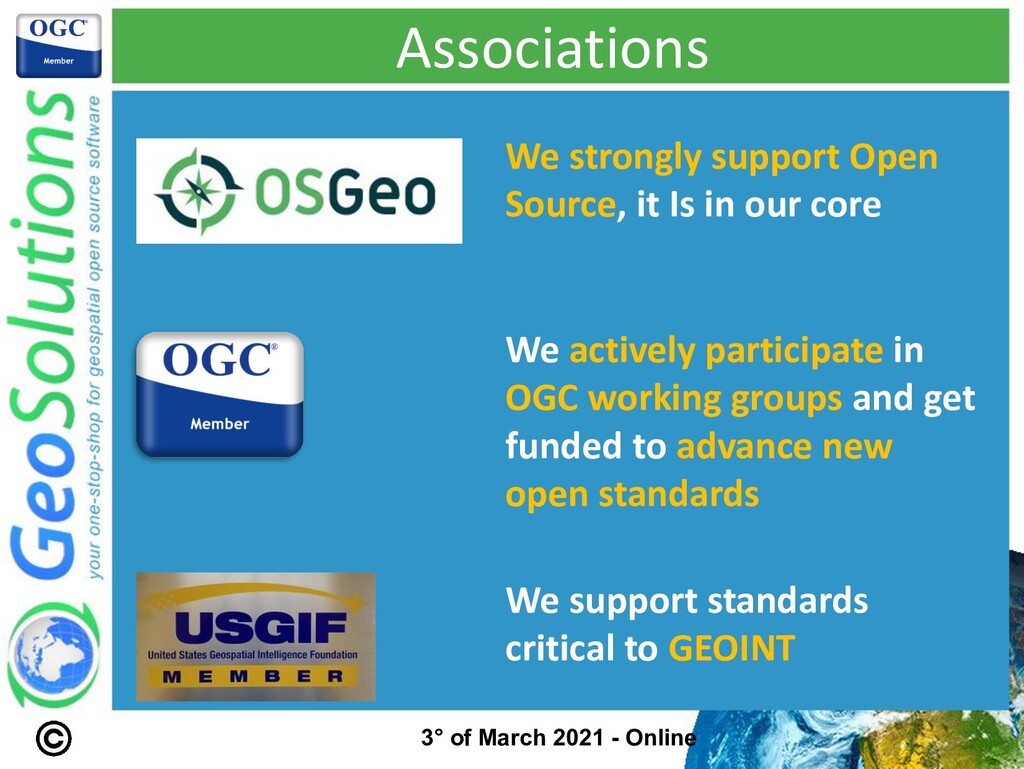
core
    We actively participate in
    OGC working groups and get
    funded to advance new
    open standards
    We support standards
    critical to GEOINT
    3° of March 2021 - Online
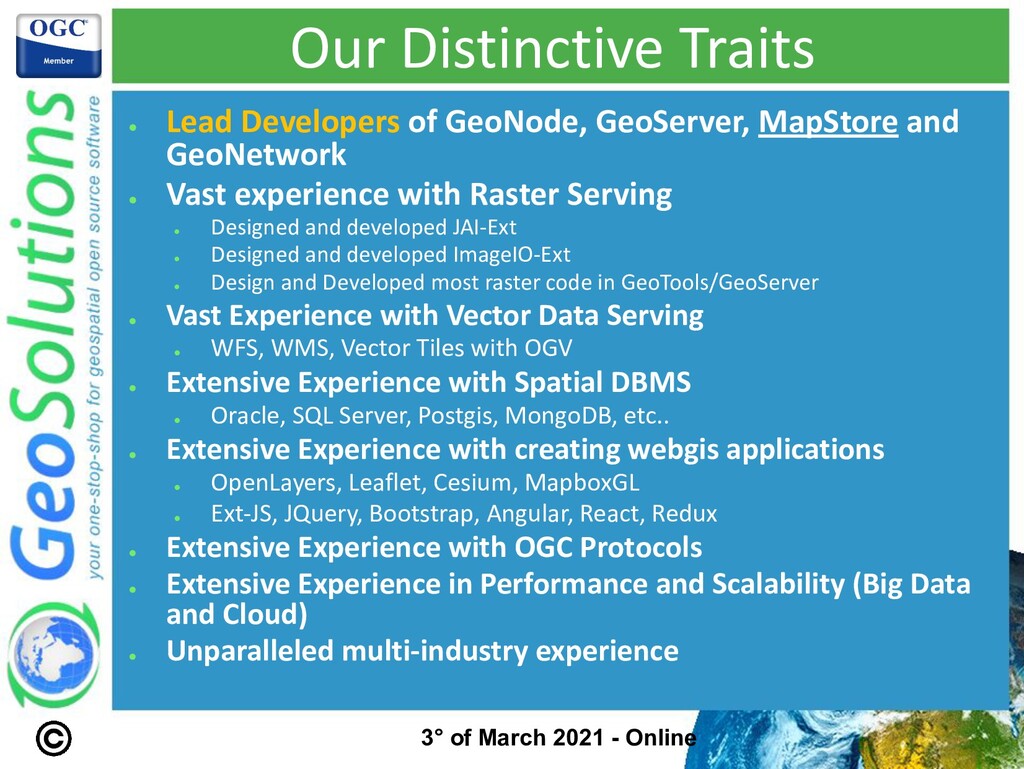
    View Slide

  6. Our Distinctive Traits

    Lead Developers of GeoNode, GeoServer, MapStore and
    GeoNetwork

    Vast experience with Raster Serving

    Designed and developed JAI-Ext

    Designed and developed ImageIO-Ext

    Design and Developed most raster code in GeoTools/GeoServer

    Vast Experience with Vector Data Serving

    WFS, WMS, Vector Tiles with OGV

    Extensive Experience with Spatial DBMS

    Oracle, SQL Server, Postgis, MongoDB, etc..

    Extensive Experience with creating webgis applications

    OpenLayers, Leaflet, Cesium, MapboxGL

    Ext-JS, JQuery, Bootstrap, Angular, React, Redux

    Extensive Experience with OGC Protocols

    Extensive Experience in Performance and Scalability (Big Data
    and Cloud)

    Unparalleled multi-industry experience
    3° of March 2021 - Online
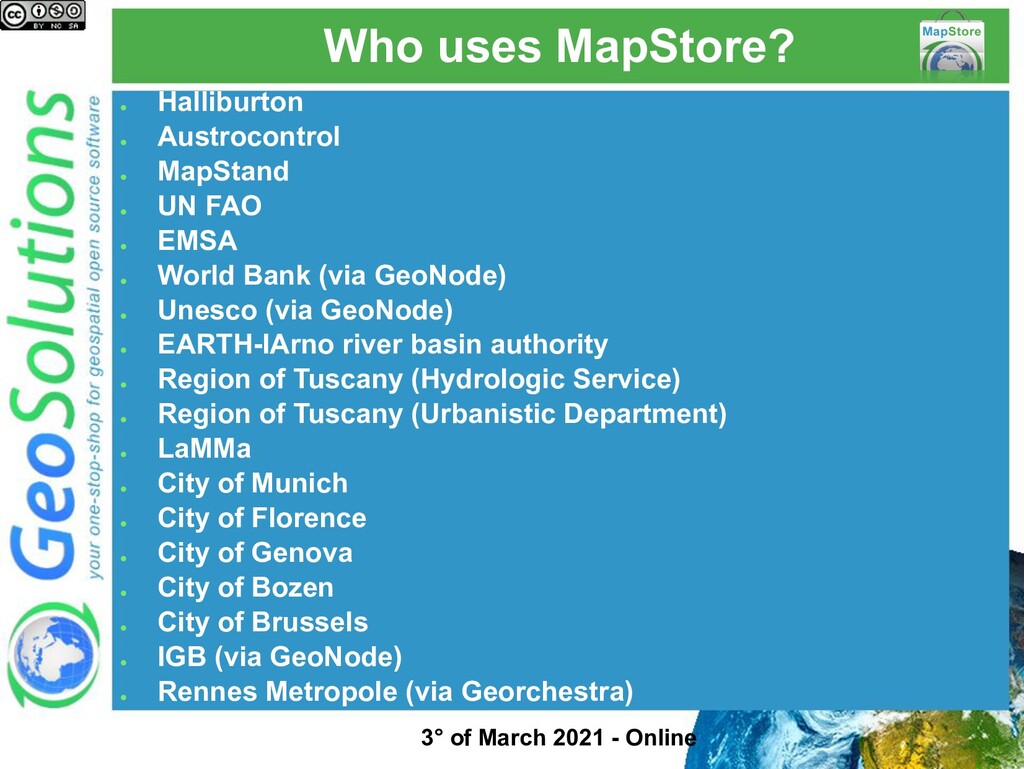
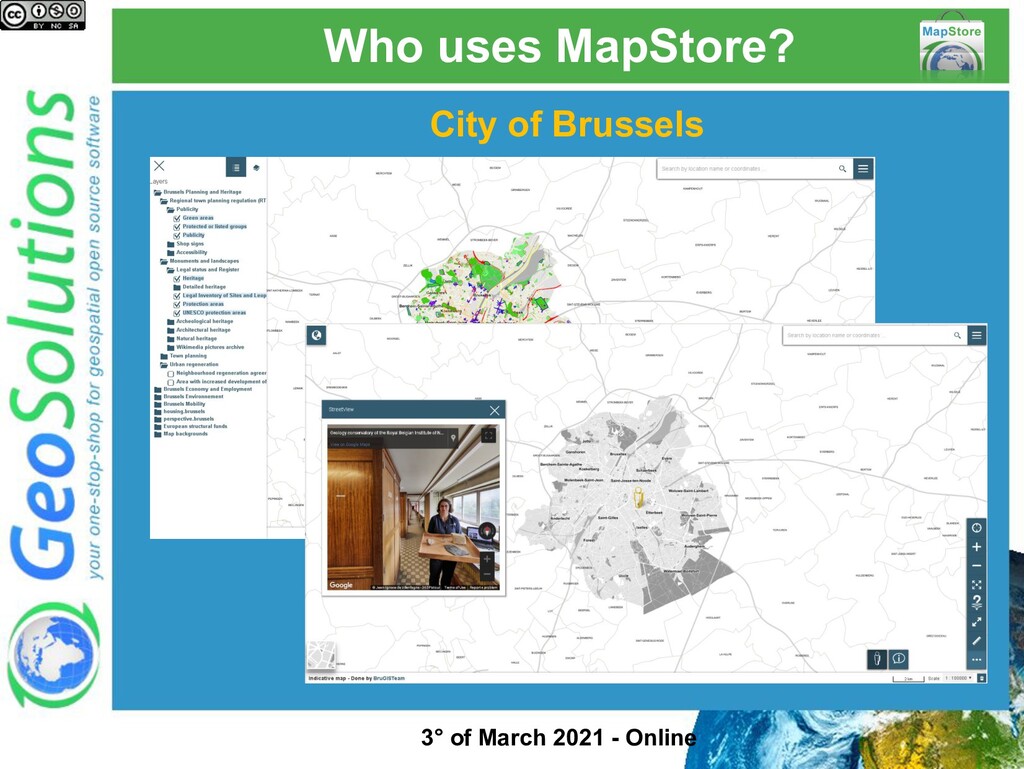
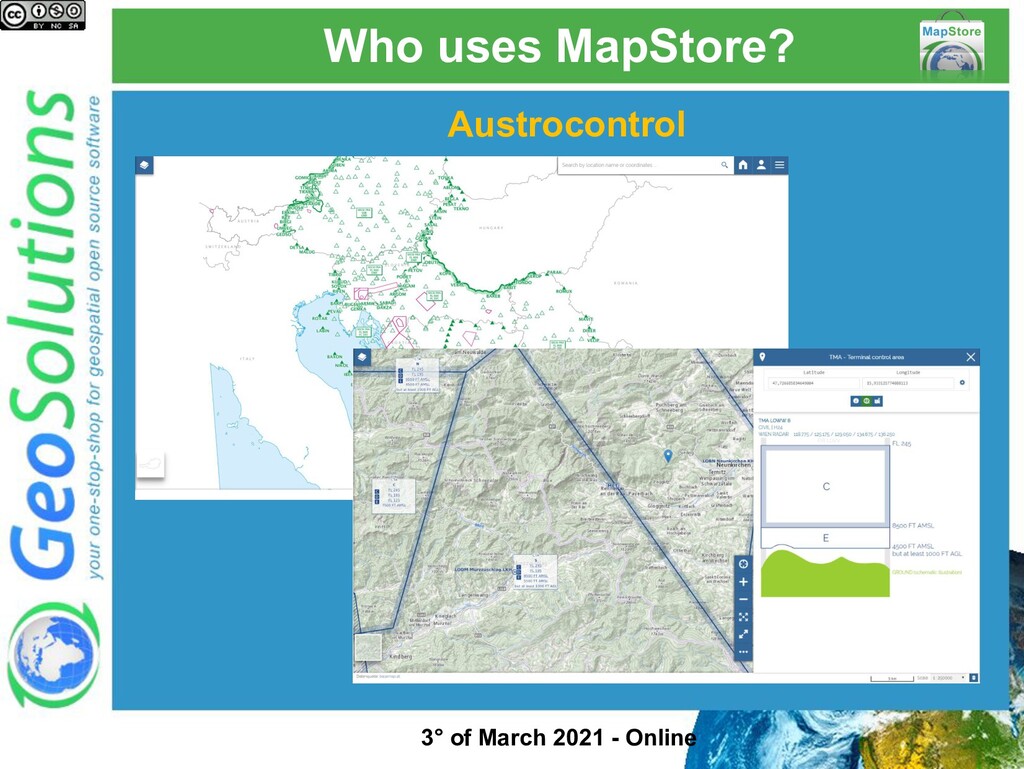
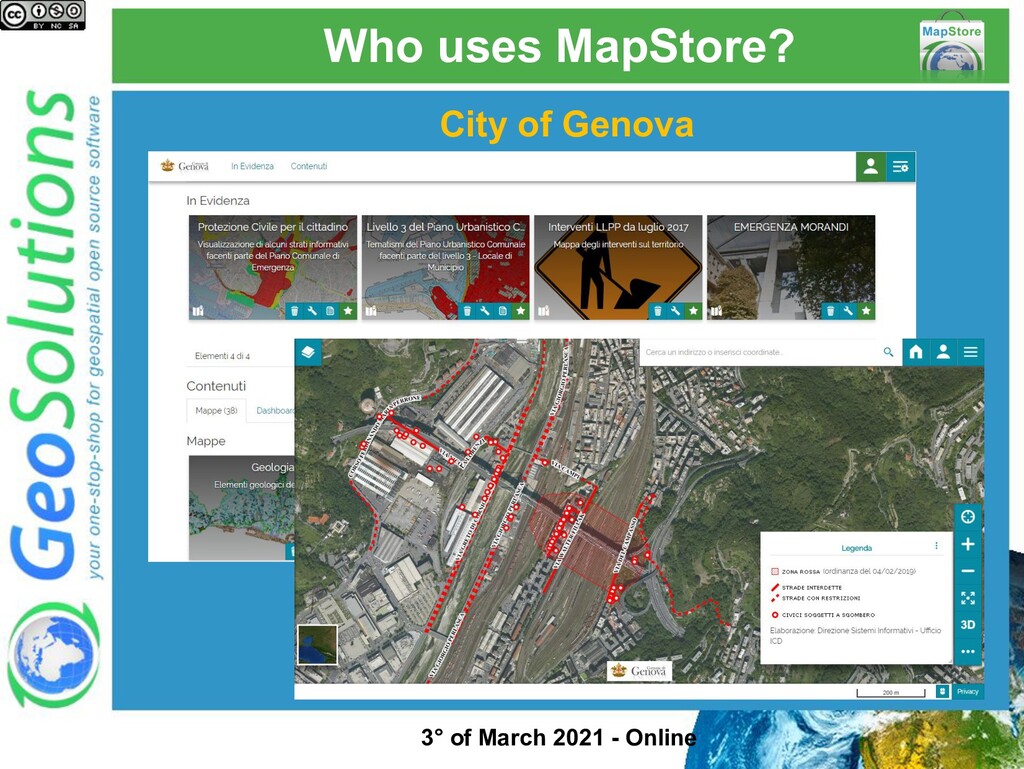
    View Slide

  7. Team – Key Members
    25+ Staff Members, 15+ Software Engineers

    Andrea Aime: GeoServer Project Steering Committee, GeoTools PMC,
    JAI-Tools Lead, ImageIO-Ext committer

    Simone Giannecchini: Founder, GeoServer PSC, GeoTools PMC,
    ImageIO-Ext Architect, JAI-Tools founder

    Luis E. Bermudez: US CEO since 2020. 2010-2020 OGC Exec, Director of
    the Innovation and Compliance Programs.

    Giovanni Allegri: Senior Project Manager, QGIS, GeoNode

    Alessio Fabiani: Founder, GeoServer PSC, GeoTools Committer, MapStore
    Committer

    Emanuele Tajariol: GeoServer Committer, GeoTools Committer,
    GeoNetwork PSC

    Mauro Bartolomeoli: GeoServer Committer, GeoTools Comitter, GeoBatch
    Committer, MapStore Architect

    Lorenzo Natali: MapStore2 Technical Lead
    3° of March 2021 - Online

    View Slide

  8. What is MapStore?
    3° of March 2021 - Online

    View Slide

  9. What is MapStore?

    Create and share maps, charts, dashboards and
    stories online

    Mobile first | Responsive

    Mapping engine agnostic

    OpenLayers|Leaflet|Cesium

    Leveraging React ecosystem

    Pluggable Look & Feel

    Consume data from many sources

    OSM, Bing, WFS, CSW, WMS, WMTS

    License is Simplified BSD

    Commercial friendly!
    3° of March 2021 - Online

    View Slide

  10. What is MapStore?
    It is a Product
    Use it as is and customize the look&feel
    3° of March 2021 - Online

    View Slide

  11. What is MapStore?
    It is a Framework
    You can build many different applications with
    its plugins (and by developing your own)
    covidtrackingmap
    3° of March 2021 - Online

    View Slide

  12. Who uses MapStore?

    Halliburton

    Austrocontrol

    MapStand

    UN FAO

    EMSA

    World Bank (via GeoNode)

    Unesco (via GeoNode)

    EARTH-IArno river basin authority

    Region of Tuscany (Hydrologic Service)

    Region of Tuscany (Urbanistic Department)

    LaMMa

    City of Munich

    City of Florence

    City of Genova

    City of Bozen

    City of Brussels

    IGB (via GeoNode)

    Rennes Metropole (via Georchestra)
    3° of March 2021 - Online

    View Slide

  13. Who uses MapStore?
    MapStand
    3° of March 2021 - Online

    View Slide

  14. Who uses MapStore?
    City of Brussels
    3° of March 2021 - Online

    View Slide

  15. Who uses MapStore?
    Austrocontrol
    3° of March 2021 - Online

    View Slide

  16. Who uses MapStore?
    Arno river basin authority
    3° of March 2021 - Online

    View Slide

  17. Who uses MapStore?
    City of Genova
    3° of March 2021 - Online

    View Slide

  18. More Info

    Demo

    User Docs

    GitHub Repo

    Dev Docs

    Youtube Videos

    Mailing Lists
    3° of March 2021 - Online

    View Slide

  19. MapStore release v2021.01.00
    3° of March 2021 - Online

    View Slide

  20. MapStore v2021.01.00

    Released January 25th 2021

    First Release of the 2021.01.xx series

    2021.01.xx get 2 more releases mostly with bug
    fixes
    3° of March 2021 - Online

    View Slide

  21. Annotations
    Main Features of this release are
    ● Annotation tool: the Annotation tool has been re-designed to
    provide an improved user interface
    Check out the blog post too!
    3° of March 2021 - Online

    View Slide

  22. Annotations

    More functionalities are available
    Turn on and off visibility of a
    single annotation or zoom to it
    directly from the annotations
    main view!
    3° of March 2021 - Online

    View Slide

  23. Annotations

    Everything in the same view
    Add
    geometries
    Edit title and
    description
    Edit geometry
    coordinates from a side
    panel (or map).
    Styling the annotation
    all in the same view
    3° of March 2021 - Online

    View Slide

  24. Visual Style Editor
    Main Features of this release are
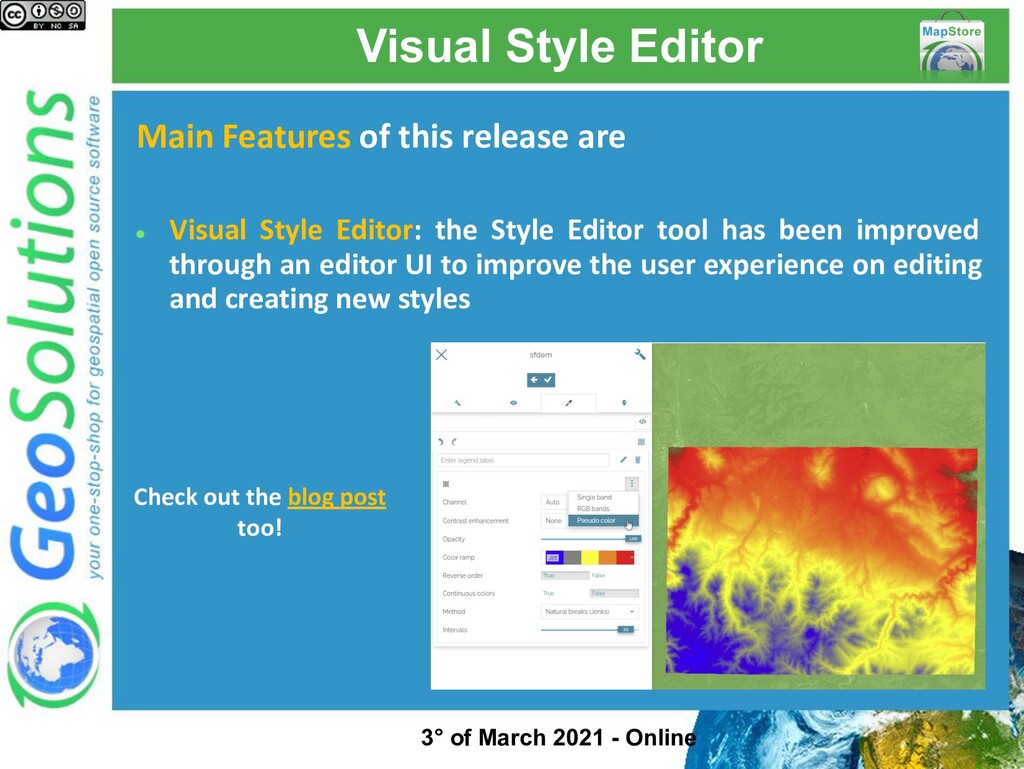
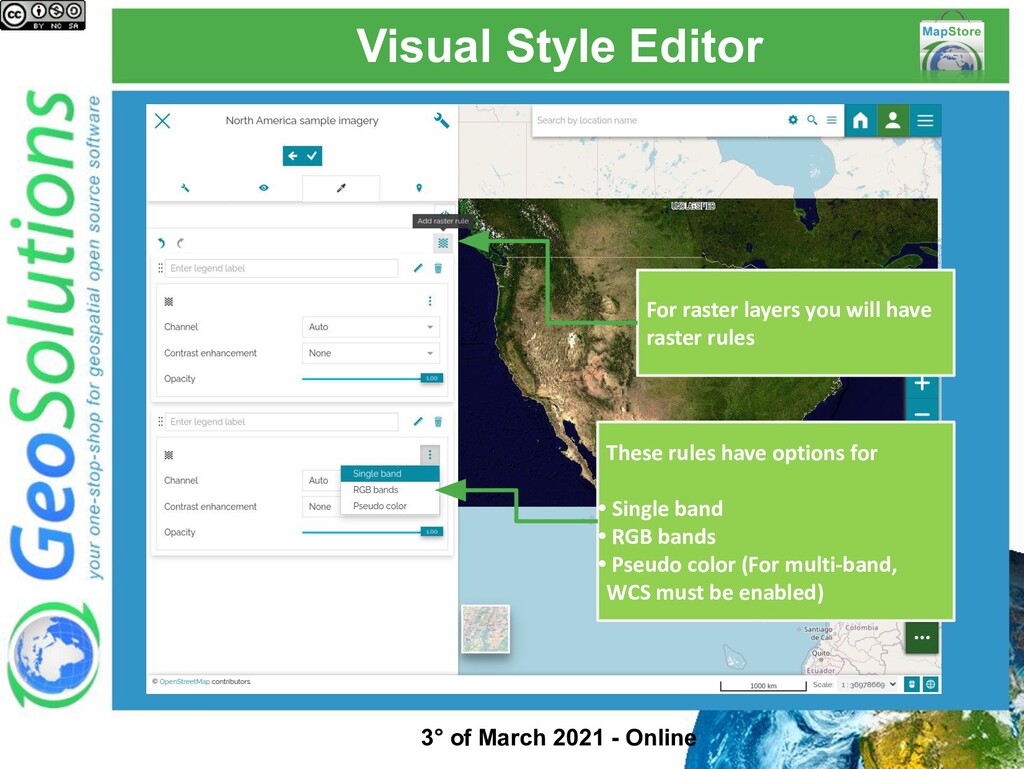
    ● Visual Style Editor: the Style Editor tool has been improved
    through an editor UI to improve the user experience on editing
    and creating new styles
    Check out the blog post
    too!
    3° of March 2021 - Online

    View Slide

  25. Visual Style Editor
    Switch to SLD/CSS
    textual editor, for
    refinements
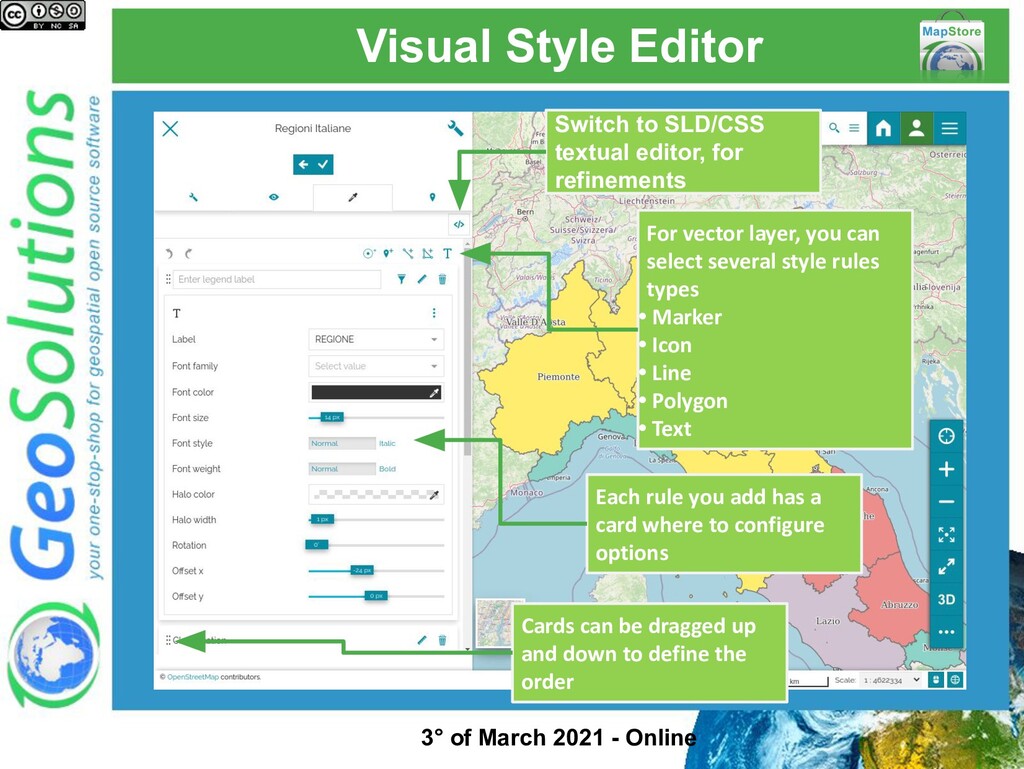
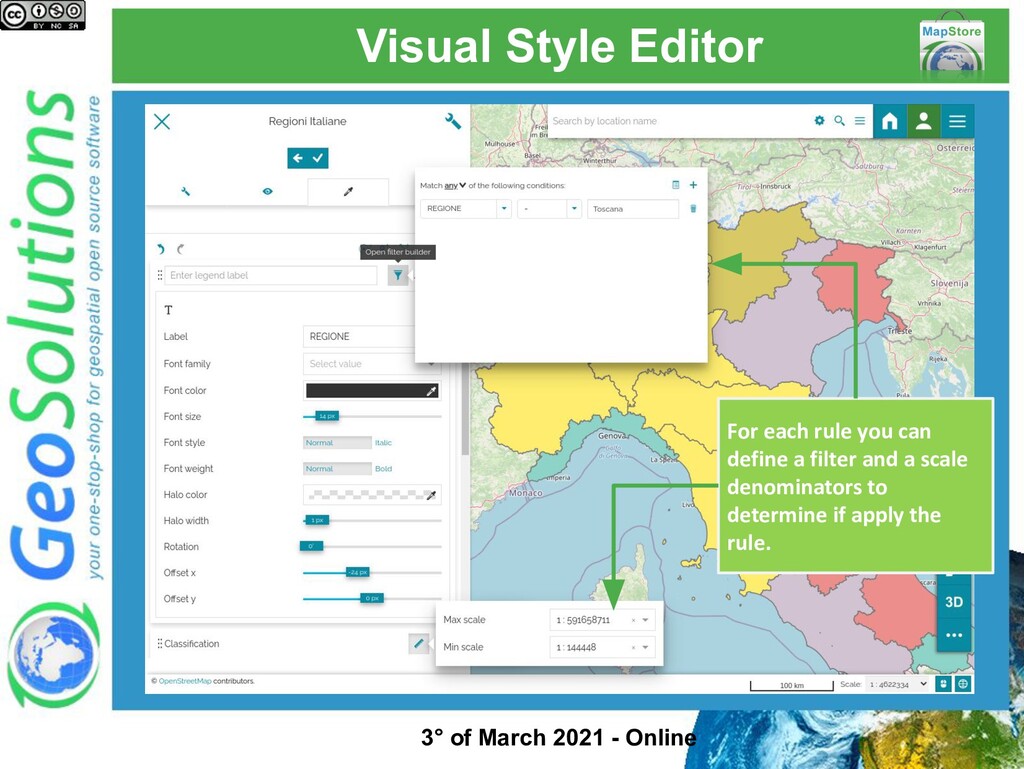
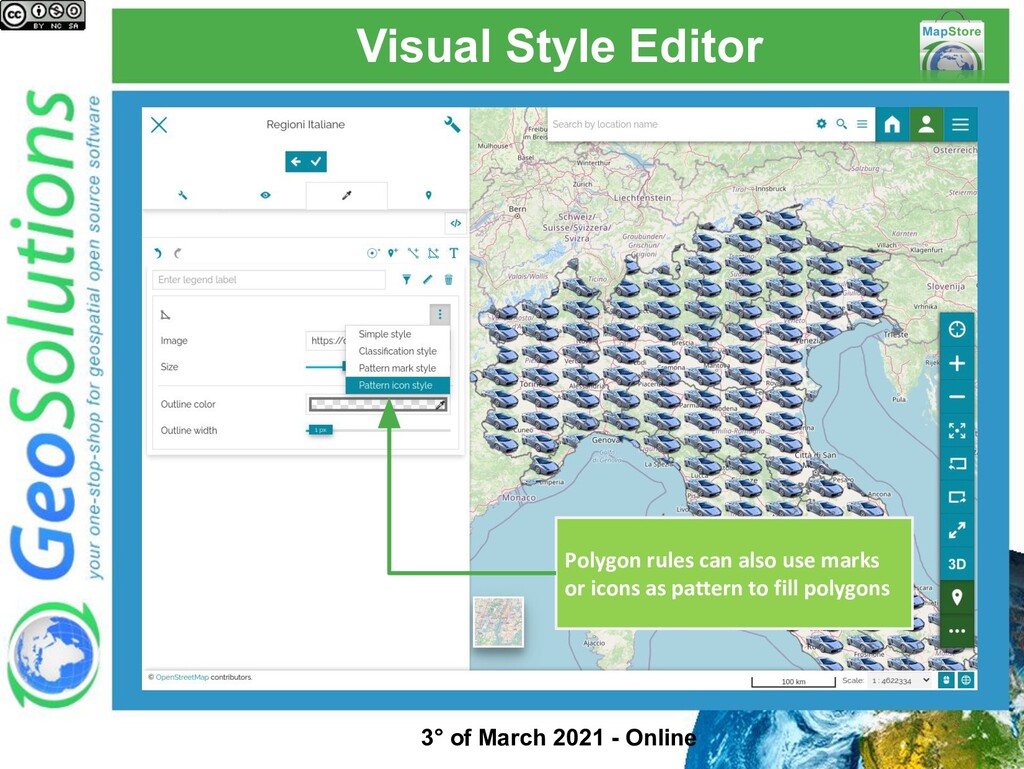
    For vector layer, you can
    select several style rules
    types
    • Marker
    • Icon
    • Line
    • Polygon
    • Text
    Each rule you add has a
    card where to configure
    options
    Cards can be dragged up
    and down to define the
    order
    3° of March 2021 - Online

    View Slide

  26. Visual Style Editor
    For each rule you can
    define a filter and a scale
    denominators to
    determine if apply the
    rule.
    3° of March 2021 - Online

    View Slide

  27. Visual Style Editor
    Each Rule has several
    options (depending on 
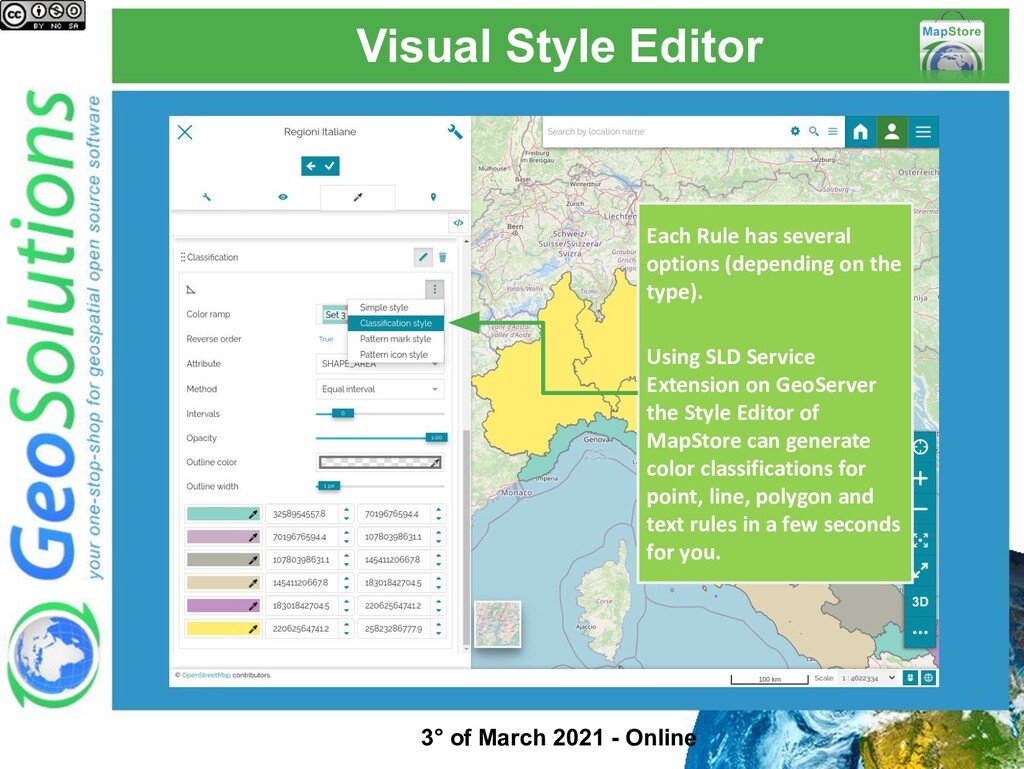
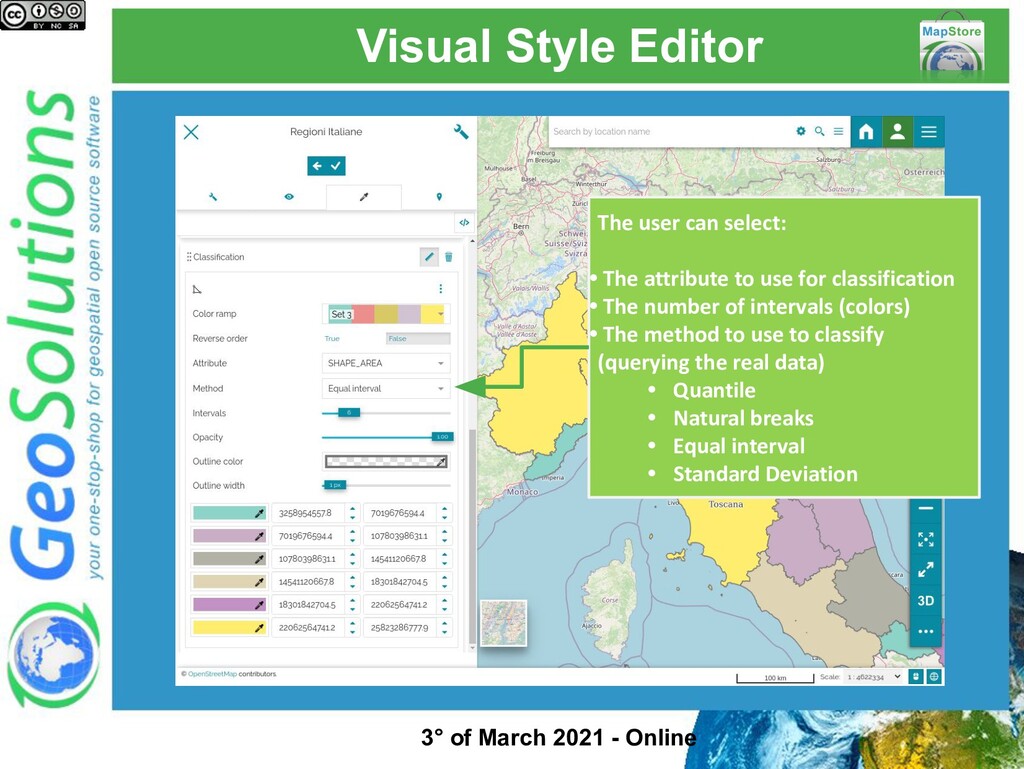
the
    type).
    Using SLD Service
    Extension on GeoServer
    the Style Editor of
    MapStore can generate
    color classifications for
    point, line, polygon and
    text rules in a few seconds
    for you.
    3° of March 2021 - Online

    View Slide

  28. Visual Style Editor
    The user can select:
    • The attribute to use for classification
    • The number of intervals (colors)
    • The method to use to classify
    (querying the real data)
    • Quantile
    • Natural breaks
    • Equal interval
    • Standard Deviation
    3° of March 2021 - Online

    View Slide

  29. Visual Style Editor
    Colors for classification can be
    selected from 
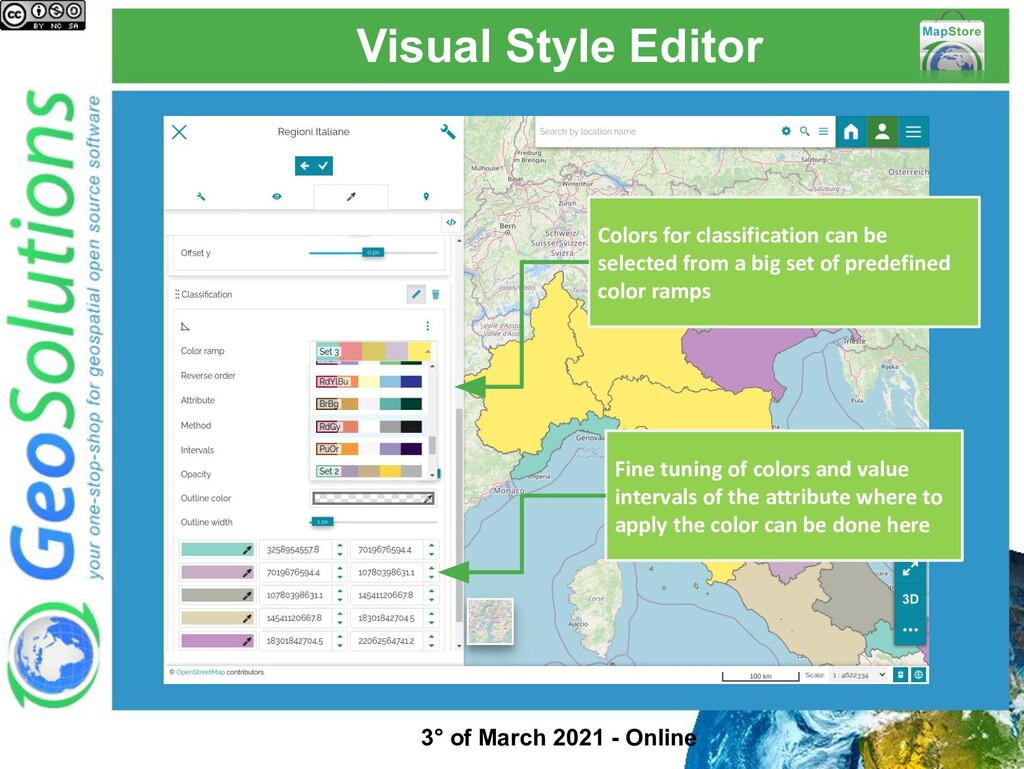
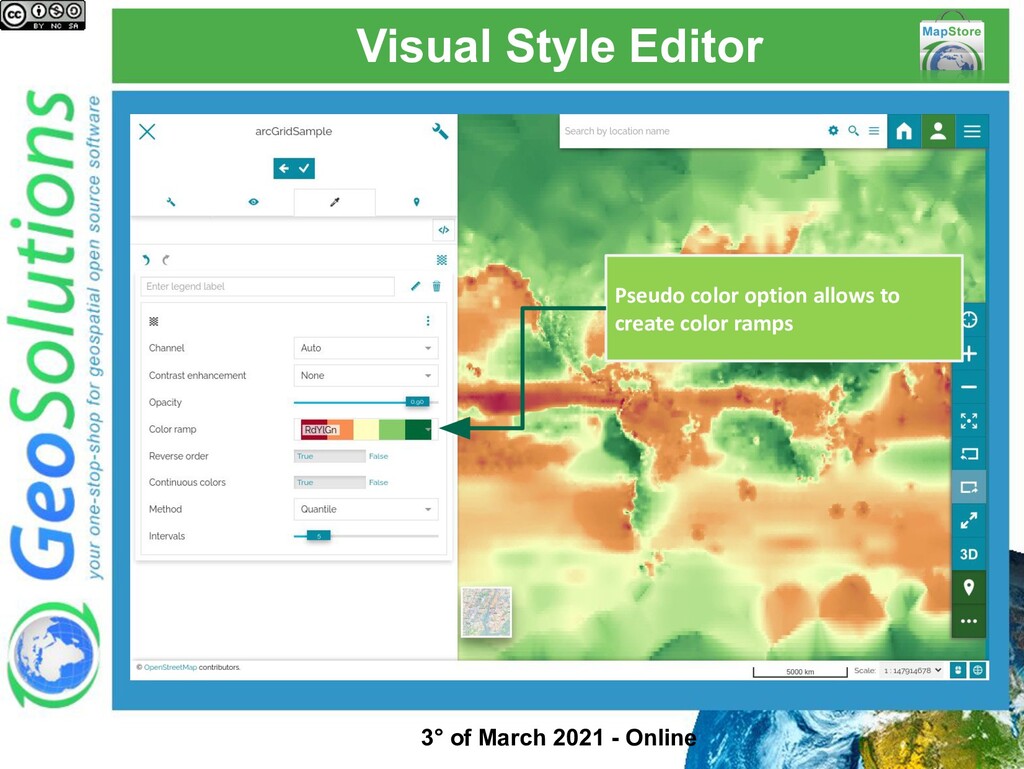
a big set of predefined
    color ramps
    Fine tuning of colors and value
    intervals of the attribute where to
    apply the color can be done here
    3° of March 2021 - Online

    View Slide

  30. Visual Style Editor
    Icon (image from the web) rules allow
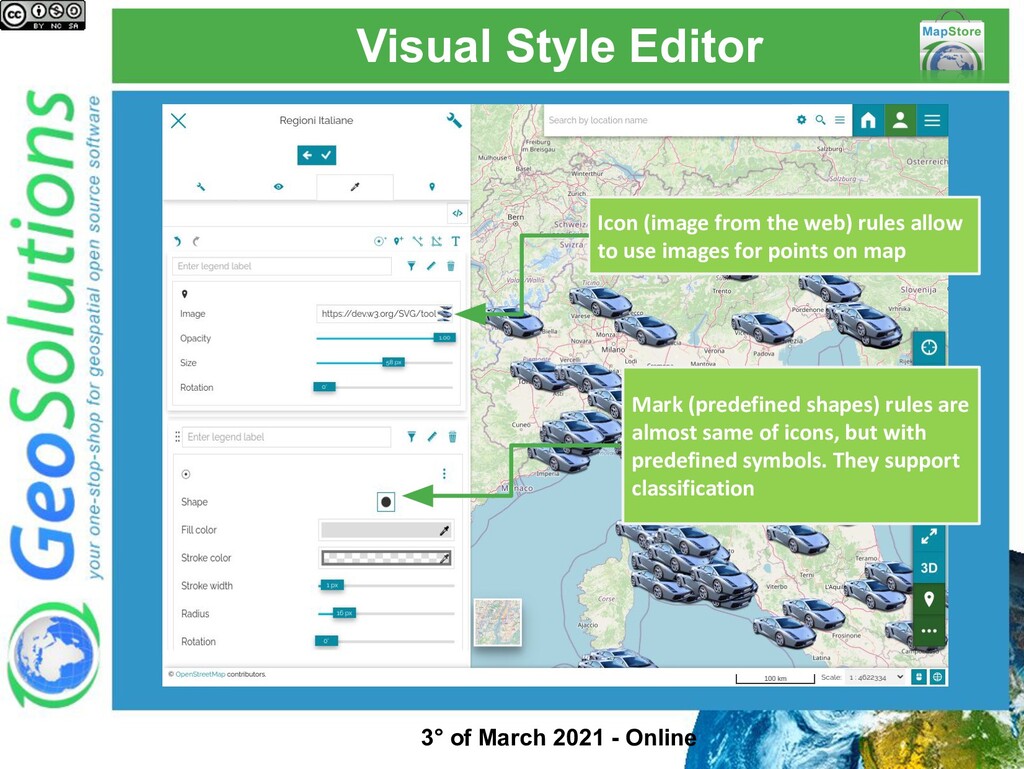
    to use images for points on map
    Mark (predefined shapes) rules are
    almost same of icons, but with
    predefined symbols. They support
    classification
    3° of March 2021 - Online

    View Slide

  31. Visual Style Editor
    Polygon rules can also use marks
    or icons as pattern to fill polygons
    3° of March 2021 - Online

    View Slide

  32. Visual Style Editor
    Text rules allow to add labels
    (custom or from an attribute) and
    define various options, like color,
    fonts...
    3° of March 2021 - Online

    View Slide

  33. Visual Style Editor
    For raster layers you will have
    raster rules
    These rules have options for
    • Single band
    • RGB bands
    • Pseudo color (For multi-band,
    WCS must be enabled)
    3° of March 2021 - Online

    View Slide

  34. Visual Style Editor
    Pseudo color option allows to
    create color ramps
    3° of March 2021 - Online

    View Slide

  35. Asynchronous Export
    Export tool allow to export raster
    and vector data from the layer.
    Selecting the layer in TOC and
    clicking on this button the tool will
    open
    3° of March 2021 - Online

    View Slide

  36. Asynchronous Export
    If the WPS Download Service is
    available in 
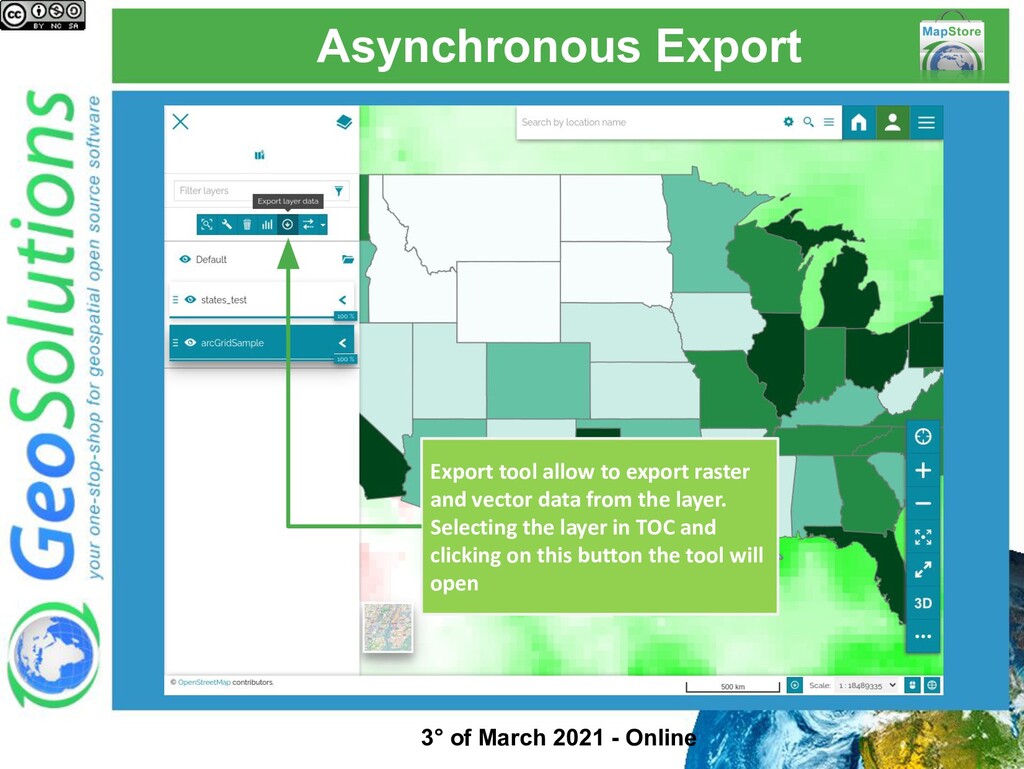
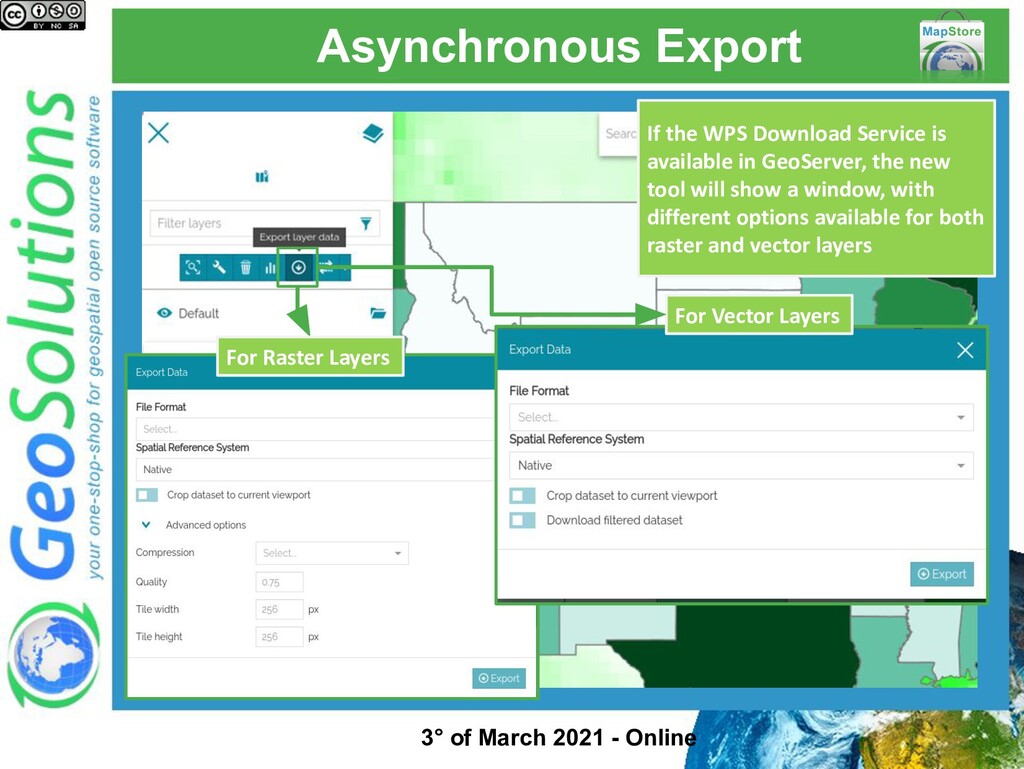
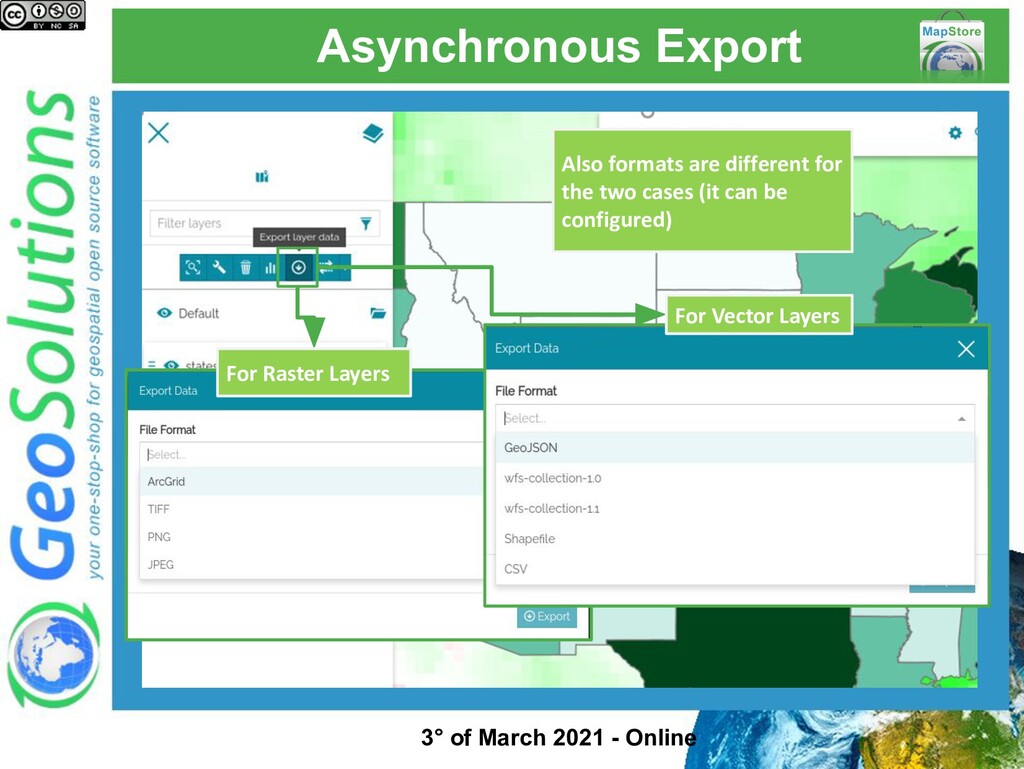
GeoServer, the new
    tool will show a window, with
    different options available for both
    raster and vector layers
    For Raster Layers
    For Vector Layers
    3° of March 2021 - Online

    View Slide

  37. Asynchronous Export
    For Raster Layers
    For Vector Layers
    Also formats are different for
    the two cases (it can be
    configured)
    3° of March 2021 - Online

    View Slide

  38. Asynchronous Export
    The Download service will
    prepare the data. The List of
    pending and complete exports
    is available from this button in
    the footer
    3° of March 2021 - Online

    View Slide

  39. Compare Tool
    The Compare tool allows to
    compare layers. You can activate
    it selecting one layer in TOC and
    clicking on the Compare tool
    button
    3° of March 2021 - Online

    View Slide

  40. Compare Tool
    On the right you can see the
    layer selected, on the left the
    other layers available in
    map.
    You can drag the slider to
    resize the two sections
    3° of March 2021 - Online

    View Slide

  41. Compare Tool
    From the menu you can switch
    to Spyglass 
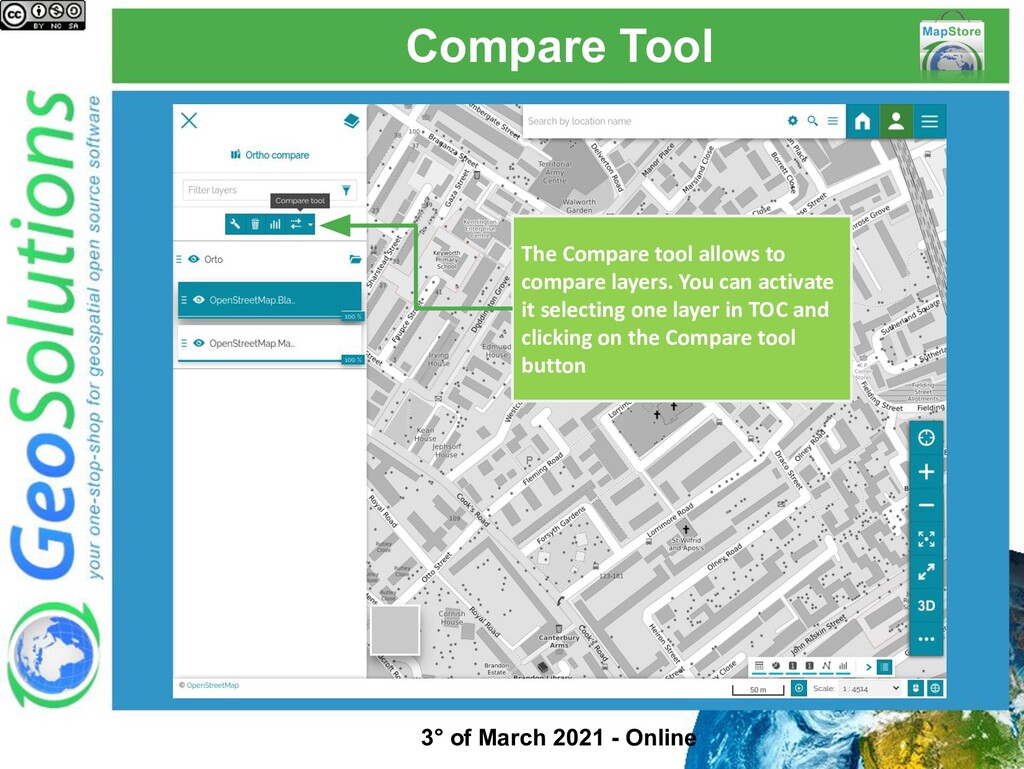
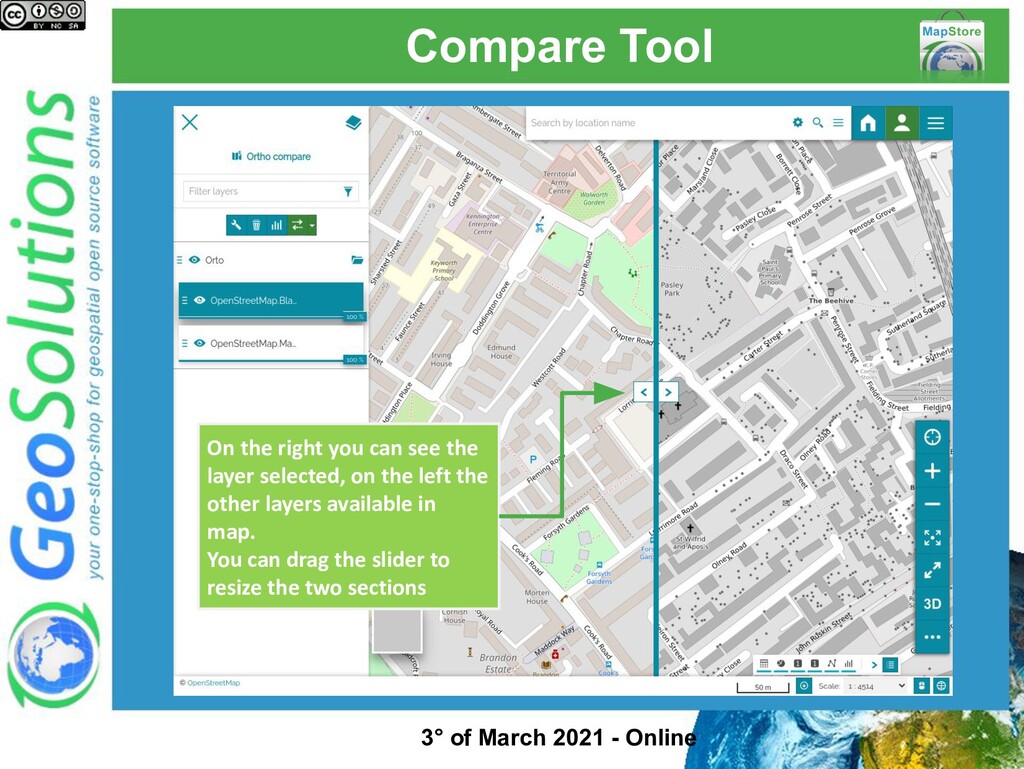
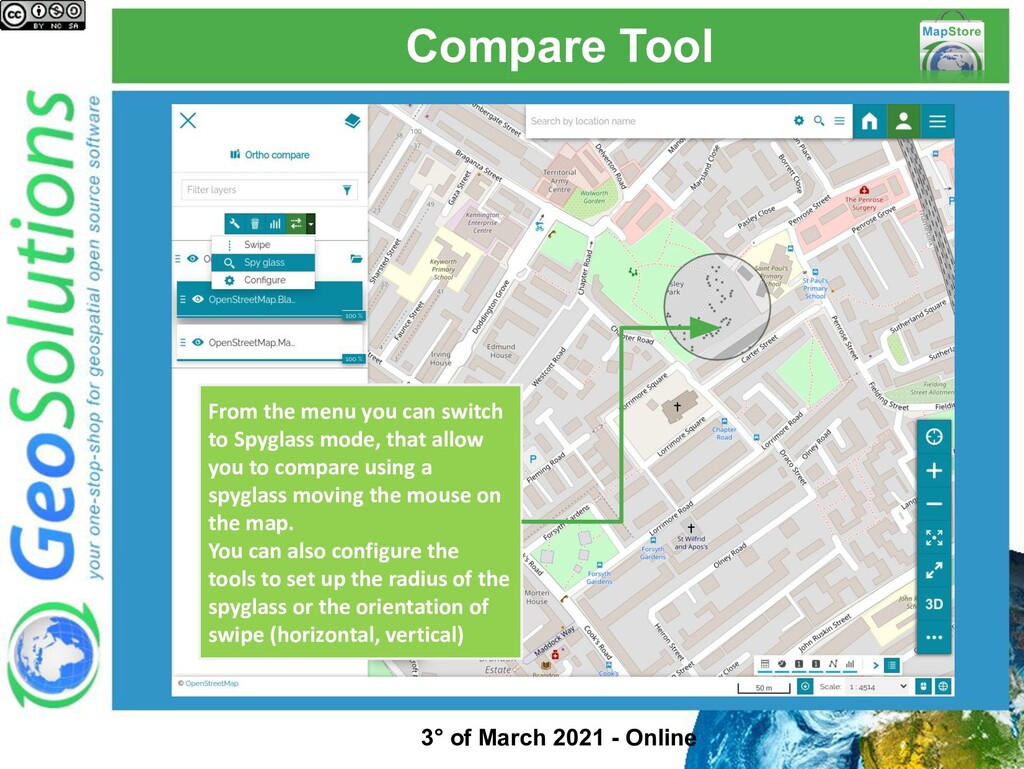
mode, that allow
    you to compare using a
    spyglass moving the mouse on
    the map.
    You can also configure the
    tools to set up the radius of the
    spyglass or the orientation of
    swipe (horizontal, vertical)
    3° of March 2021 - Online
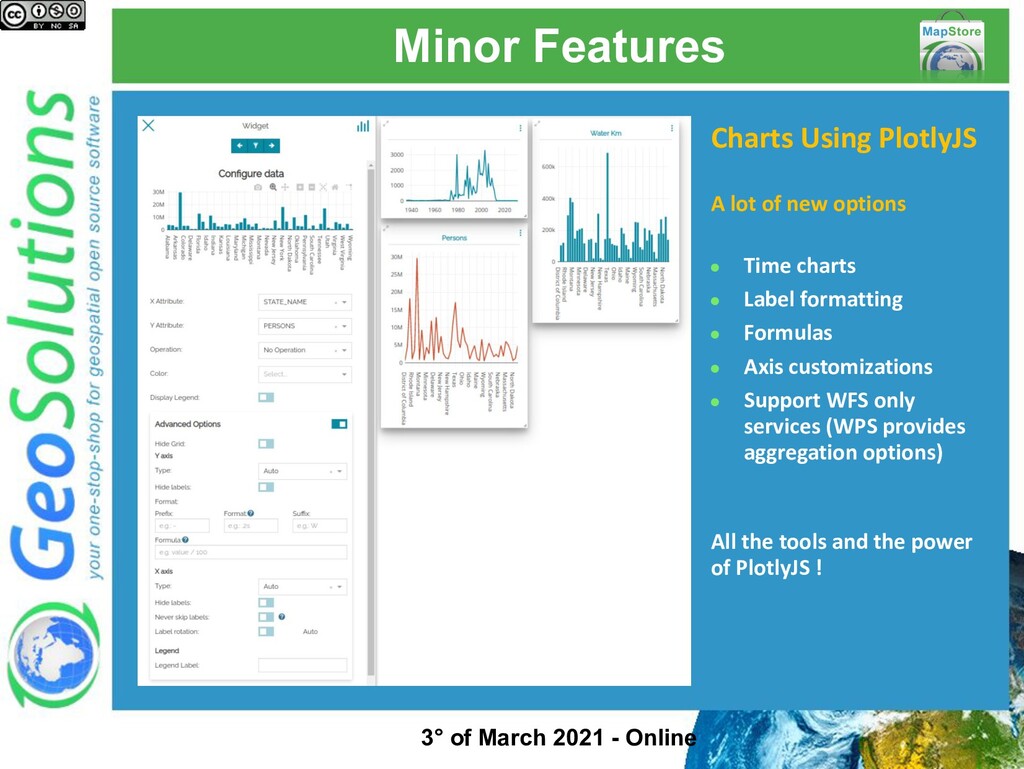
    View Slide

  42. Minor Features
    3° of March 2021 - Online
    Charts Using PlotlyJS
    A lot of new options
    ● Time charts
    ● Label formatting
    ● Formulas
    ● Axis customizations
    ● Support WFS only
    services (WPS provides
    aggregation options)
    All the tools and the power
    of PlotlyJS !

    View Slide

  43. Minor Features
    Identify tool available for Map
    widgets
    3° of March 2021 - Online

    View Slide

  44. Minor Features
    Multiple selection:
    • Append to selection using CTRL + click
    • Drag selection using ALT + drag
    • Append with drag selection with CTRL + ALT
    + drag
    Editing multiple lines at the
    same time
    3° of March 2021 - Online
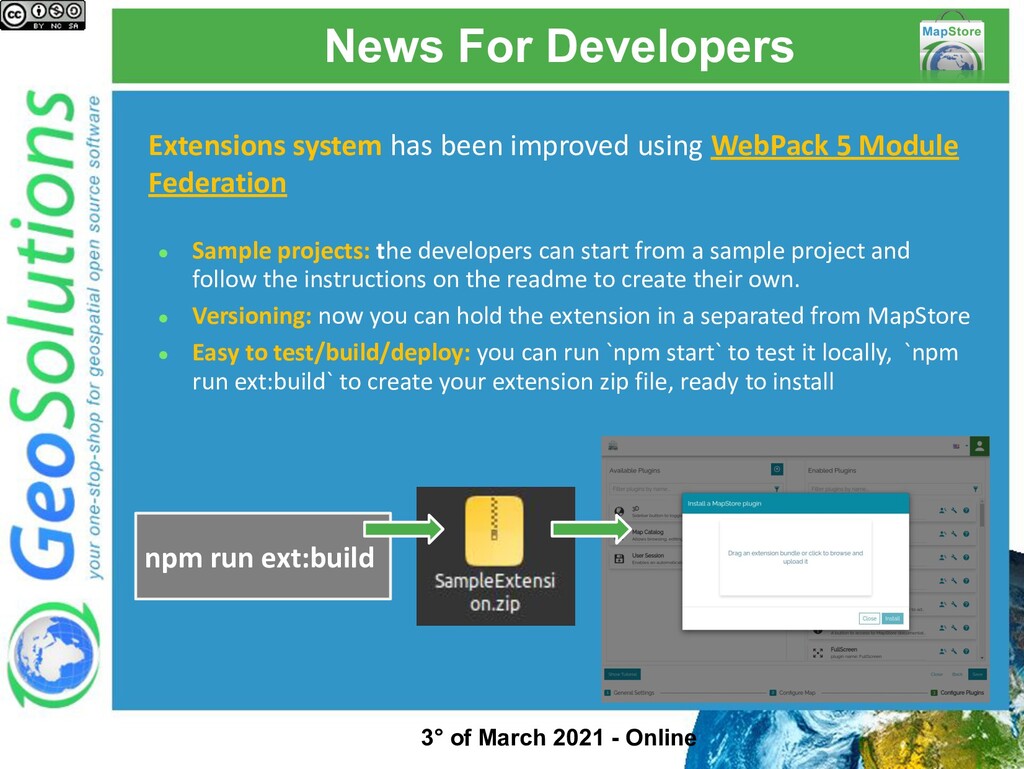
    View Slide

  45. Minor Features
    Bookmarks
    ● Edit bookmarks for relevant map
    locations! You can quickly search
    and configure them using the
    user interface
    3° of March 2021 - Online

    View Slide

  46. Minor Features
    Identify tool
    ● Look and Feel improved
    ● You can select the layer
    from the dropdown menu
    to see related Info
    3° of March 2021 - Online

    View Slide

  47. Minor Features
    Layer Settings
    • Configure WMS Layer
    tile size and legend size
    3° of March 2021 - Online

    View Slide

  48. Minor Features
    Map Details
    Allow to show descriptive text
    on map. It is possible to choose
    between two view modes: side
    panel or modal window
    3° of March 2021 - Online

    View Slide

  49. Minor Features
    Share Tool
    More options to share a point,
    with a placemark
    3° of March 2021 - Online

    View Slide

  50. News For Developers
    Extensions system has been improved using WebPack 5 Module
    Federation
    ● Sample projects: the developers can start from a sample project and
    follow the instructions on the readme to create their own.
    ● Versioning: now you can hold the extension in a separated from MapStore
    ● Easy to test/build/deploy: you can run `npm start` to test it locally, `npm
    run ext:build` to create your extension zip file, ready to install
    npm run ext:build
    3° of March 2021 - Online

    View Slide

  51. News For Developers
    Some notes on Extensions:
    ● Extensions allow to develop a single plugin to be deployed in
    a running instance. They need the data directory (supported
    only by custom projects now) to keep the extension a cross
    updates. They include their own translations files and images
    See the README of the MapStore Extension project
    for more info.
    https://github.com/geosolutions-it/MapStoreExtension
    3° of March 2021 - Online

    View Slide

  52. News For Developers
    Check out the updated User and Developer 
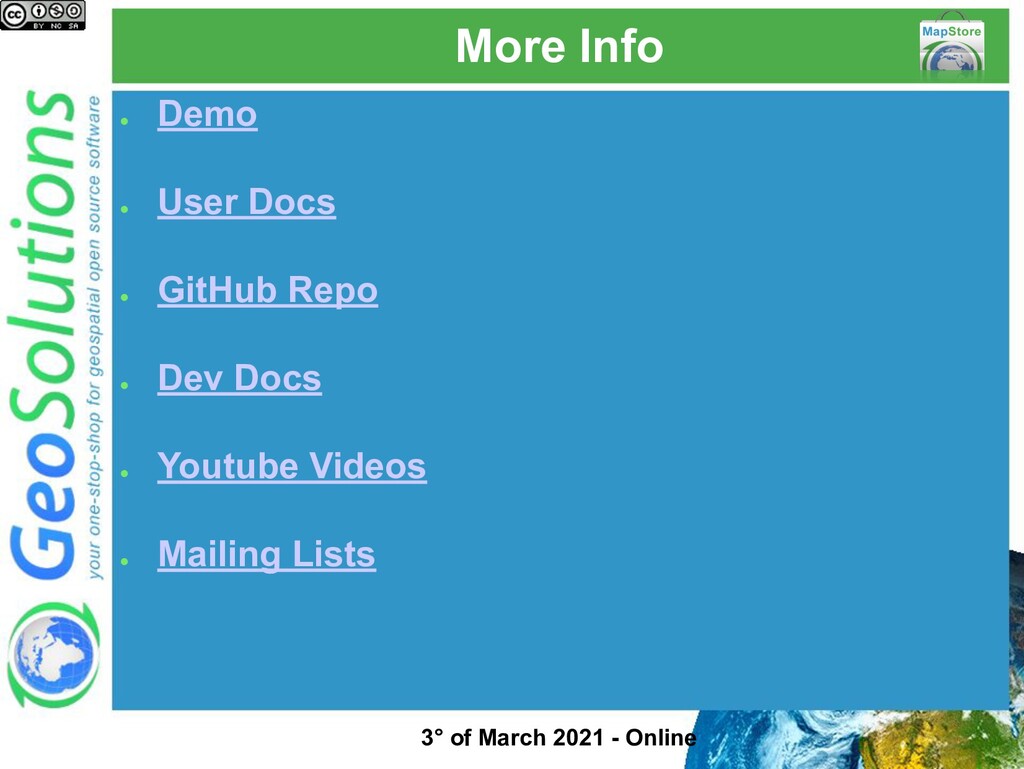
guides of
    the release v2021.01.00
    https://mapstore.readthedocs.io/en/v2021.01.00/user-guide/
    home-page/
    https://mapstore.readthedocs.io/en/v2021.01.00/developer-
    guide/requirements/
    3° of March 2021 - Online

    View Slide

  53. Ongoing work
    For the next major release we are working on the following
    main improvements
    • Downstream projects: we are working on a new project
    system that helps to maintain and update existing projects
    and new ones. We are going to separate gradually the core
    from the product to have the core library in npm package(s)
    • Performances: we want to reduce the loading time at startup
    by reviewing and reducing the bundle size. We also want to
    optimize build time and resource consumption
    3° of March 2021 - Online

    View Slide

  54. That’s all folks!
    Questions?
    [email protected]
    3° of March 2021 - Online

    View Slide