Upgrade to Pro — share decks privately, control downloads, hide ads and more …

The State of Alternative Lending in Canada 2019 - Study by Smarter Loans

Smarter Loans
December 31, 2019

The State of Alternative Lending in Canada 2019 - Study by Smarter Loans

Smarter Loans, Canada's online loan directory, gathered the feedback of 2,415 Canadian alternative lending customers and published an insightful study on the state of the alternative lending industry in Canada.

Go to the study: https://smarter.loans/smarter-loans-alternative-lending-canada-study-2019.pdf

Smarter Loans

December 31, 2019
Tweet

Other Decks in Research

Transcript

  1. This year the industry responded to customer needs, and Canadians

    are noticing As Canada’s alternative lending industry continues to mature Canadians are gradually becoming more comfortable utilizing its services. According to Smarter Loans’ “State of Alternative Lending in Canada” 2019 Study, which gathered the feedback of 2,415 Canadian alternative lending customers, many of the country’s providers continue to receive top marks for their services. Some products, services and providers, however, are much further along than others. Nearly 70% of respondents agreed or strongly agreed that they are well informed about the options available to them, that the online application process is fast and easy to complete, that borrowing from online lenders is safe and that lenders are transparent about their fees, terms and conditions. Overall Canadians were slightly more approving of the online lending industry this year, ranking it 3.4 stars out of a possible five, up from 3.2 stars in 2018. 3.4 AVERAGE RATING QUESTION: How would you rate the Online Lending Industry in Canada today? Consider factors such as ease of getting a loan, access to information, quality of products and services, responsible lending practices and customer service. 0.2 improvement from 2018
  2. Did you seek a loan with a traditional financial institution,

    such as a bank? Before you applied for a loan, what additional research did you do, if any? (check all that apply) How did you discover the company or companies that you ultimately applied for a loan with? (check all that apply) Before you applied with a company, did you feel like you had enough information about their products, services, interest rates and reputation? How would you rate the Online Lending Industry in Canada today? (out of 5) Did you apply with multiple companies? NO 2018: 44% 2019: 47% 2018: 61% 2019: 66% 2018: 33% 2019: 29% Online Search 2018: 63% 2019: 63% Other 2018: 15% 2019: 15% Recommended by a Friend 2018: 10% 2019: 11% Social Media 2018: 12% 2019: 11% 2018: 6% 2019: 5% YES 2018: 56% 2019: 53% How satisfied were you with the loan application process? In total, how long did it take to receive your loan once you applied? How many lenders did you research before applying for a loan? 3.2 in 2018 3.4 in 2019 Same Day 43% 39% 8% 3% 3% 4% 2-3 Days 1 Week 1-2 Weeks 2-4 Weeks Over a Month 48% 38% 6% 3% 1% 3% 2018 2019 2019 2018 YES 30% YES 28% NO 70% NO 72% Annual comparison, at a glance 2018: 29% 2018: 71% 29% 2019 71% 2019 2018 2019 1 to 2 27% 29% 3 to 5 46% 48% 6 to 9 14% 12% 10+ 13% 11% Asked a friend or family member 2018: 11% 2019: 11% Read online articles and reports 2018: 23% 2019: 26% Looked through their website 2018: 61% 2019: 60% Called them to ask questions 2018: 20% 2019: 20% None 2018: 13% 2019: 14% Read reviews 2018: 44% 2019: 44%
  3. 2019 Study The second iteration of the annual study found

    that alternative lending’s popularity in Canada continues to increase overall, albeit in small increments. Roughly 21% of respondents sought their first loan from an online provider in 2019, compared with 17% in 2018 and 13% in 2017. This year 30% of respondents said they first approached a traditional financial institution before seeking an alternative provider, up slightly from 29% in 2018. Last year 46% of applicants researched between three and five companies, compared with 48% in 2019. Furthermore, 22% considered more than six options, compared with 25% last year. The remainder looked into just one or two lenders. Only 15% of respondents spent more than 6 hours conducting research, 30% spent less than one, and the remaining 55% spent between one and five, the same proportion as in 2018. That research process continues to be dominated by online searches, which is what inspired 63% of respondents to apply for a loan. Another 11% discovered the providers they applied with through a recommendation, and the same amount found them through social media. Overall, more Canadians were very satisfied with their loan providers this year than last, with 40% ranking the service they received as “great,” compared with only 35% last year. Furthermore, while 13% were not satisfied with their provider last year, that number dropped to just 10% in 2019. This year 30% of alternative lending customers sought a loan with a traditional financial institution, such as a bank, prior to applying with an alternative lender, up from 28% in 2019. Though Canadians are becoming more comfortable with alternative providers many still prefer utilizing the services of a traditional financial institution. QUESTION: Did you seek a loan with a traditional financial institution, such as a bank? YES 30% NO 70%
  4. The proportion of Canadians seeking their first alternative loan continues

    to grow year over year, implying the providers are doing a good job of attracting first time customers. They may also be benefiting from a growing awareness and trust of alternative lending in Canada more broadly. The majority of Canadian alternative lending customers surveyed considered more than three options before submitting an application, and nearly 50% have considered between three and five. Though the industry continues to consolidate the data suggests a market leader is yet to corner the market. 2019 2018 2017 2016 2015 2014 2013 2012 2011 or earlier I Never Did 30% 20% 10% 0% QUESTION: How many lenders did you research before applying for a loan? QUESTION: In what year did you first apply for a loan with a non-traditional or alternative lender (i.e. not a bank) ? 3 to 5 48% 6 to 9 12% 10+ 11% 1 to 2 29%
  5. Despite a relatively brief research process, 71% felt confident that

    they had sufficient information about a lender before submitting an application, suggesting that the information they’re seeking is readily available. Overall, the majority of customers spend less than two hours researching lenders before submitting their application, and nearly 30% spend less than one. QUESTION: How long did you spend researching lenders before applying? QUESTION: Before you applied with a company, did you feel like you had enough information about their products, services, interest rates and reputation? YES, I felt comfortable that I knew enough about the provider before I applied NO, I wish there was more information available to make the decision YES 71% NO 29% 30% 40% 20% 10% 0% Less than 1 hour 1 to 2 hours 3 to 5 hours 6 to 9 hours 10 hours or more
  6. Providers are doing a slightly better job of providing a

    positive application process, with 66% confirming their satisfaction this year, up from 61% last year. Roughly 53% of respondents submitted an application with more than one provider this year, down from 56% in 2018. QUESTION: Did you apply with multiple companies? QUESTION: How satisfied were you with the loan application process? YES 53% 66% SATISFIED Applying for the loan was fast and easy to follow 29% NOT SATISFIED It was frustrating/confusing and took a long time 5% OTHER NO 47%
  7. For those who are getting approved, the process is smooth

    and fast. Providers seem to be making good on promises of same or next day approval, with nearly half of all respondents receiving funds the vast majority receiving their loan within three. Less than 40%, however, felt that it was easy to get approved, with a nearly equal proportion agreeing that it was not easy or very difficult. The remainder were not approved for a loan. If the industry intends to set itself apart from traditional financial institutions for its ease of getting approved, it may need to improve its approvals process in the future. Same Day 2 to 3 Days 2 to 4 Weeks 1 to 2 Weeks 1 Week Over a Month 48% 39% 26% 12% 23% 38% 6% 3% 1% 3% QUESTION: In total, how long did it take to receive your loan once you applied? QUESTION: How easy was it to get approved for your loan? FAST & EASY It was a smooth process to get approved NOT EASY I had to provide a lot of additional information after I applied VERY DIFFICULT I had to apply with several companies to finally get approved NOT APPROVED I did not get approved for a loan
  8. Canadians continue to prioritize interest rates and terms above all

    other factors, but this year customer service was neck in neck with speed of getting the loan, whereas speed was slightly more important to borrowers than customer service last year. Both ranked only slightly above ease of application process, followed by transparency and track record. Alternative lenders are doing a good job of maintaining customer satisfaction, and Canadians are noticing, with nearly 90% confirming that are satisfied or very satisfied with their provider. QUESTION: Overall, how satisfied are you with your loan provider? QUESTION: When dealing with a loan company, rank the following factors by how important they are to you (1 = most important, 6 = least important) VERY SATISFIED They are honest and treat me with respect and great service Interest rates and terms of the loan Customer service and support Speed of getting the loan 17% 20% 25% 17% 12% 10% 13% 17% 20% 29% 13% 8% 7% 12% 12% 17% 39% 14% 7% 8% 8% 10% 15% 52% * Percentages are rounded to the nearest whole number 16% 24% 20% 17% 12% 10% 40% 19% 15% 11% 8% 6% 1 Total Score 2 3 4 5 6 Easy application and process to get the loan Transparent fees and responsible lending practices Track record and reputation SATISFIED They got me the loan and that’s good enough NOT SATISFIED I would not choose this company again or recommend them to friends 50% 40% 10% 4.52 3.83 3.85 3.64 2.90 2.26
  9. Similar to 2018’s findings, about 44% of respondents would still

    go back to a traditional financial institution in the future. This year 18% of online borrowers said they would not return to a traditional financial institution, and 38% remain unsure. More than 30% of Canadians do not feel that borrowing from an alternative lender is safe and that providers are transparent about their fees, interest rates, terms and loans. Rouhgly 80%, however, felt informed about the options available to them and found the application process fast and easy. QUESTION: After dealing with an alternative lender, would you consider going back to a financial institution, such as a bank, in the future? YES 44% NO 18% NOT SURE 38% I feel informed on the different options available to me for loans and financing of any kind Overall, borrowing money from online lenders in Canada feels safe and scam-free Online loan providers are transparent about their fees, interest rates, terms and conditions The online application processes used by lending companies are fast and easy to complete STRONGLY AGREE STRONGLY DISAGREE AGREE DISAGREE 23% 16% 16% 23% 54% 51% 53% 56% 18% 25% 25% 17% 5% 7% 6% 3% * Percentages are rounded to the nearest whole number
  10. Some parts of the industry are farther along than others

    The online lending market continues to be dominated by personal installment cash loans which comprised the vast majority of loan activity in 2019. Canadians, according to the data, are still more likely to seek a mortgage or business loan from a traditional financial institution, such as a bank. Furthermore, roughly half of those seeking home equity loans, truck and trailer financing and other equipment financing approached a bank prior to approaching an online lender. QUESTION: Did you seek a loan with a traditional financial institution, such as a bank? Personal Installment Cash Loan Payday Loan Home Equity Loan Mortgage Business Loan Auto Loan Truck & Trailer Loan Other Equipment Loan 0% 10% 20% 30% 40% 50% 60% 70% 80% 90% 100% YES YES YES YES YES YES YES YES NO NO NO NO NO NO NO NO
  11. The most popular loan types in 2019 also had the

    most satisfied customers. The most satisfied customers were payday loan applicants, followed by personal installment cash loan seekers, then auto loan applicants. Canadians ranked payday loans as having the easiest and smoothest approval process overall, followed by personal instalment loans. The least satisfied borrowers were those seeking an equipment loan; followed by business loan applicants, then home equity loan seekers. Payday loan and mortgage borrowers were also most satisfied with their individual providers, while home equity loan providers received the lowest approval rating. Home equity, business and truck and trailer loan financing applicants were most likely to give the industry two or less stars out of five. Borrowers seeking payday loans, personal instalment loans and auto loans were most likely to give the industry 4 or 5 stars out of 5. Personal installment and payday loan applicants were also most likely to feel informed about their options, feel that the online application process is fast and easy, that online providers are safe and reliable, and that they’re transparent about their fees. Lowest marks in almost every category went to equipment lenders, though business loan applicants largely felt less informed and confident with online providers. The high marks given to payday and personal installment cash loans is indicative of the service Canadians report receiving from those providers. For example, Payday loans were most likely to be provided the same day, followed by personal installment loans. On the other hand Truck and Trailer financing took the longest, with 22% of applicants waiting over a month to receive financing, and nearly half waiting a week or more. QUESTION: How easy was it to get approved for your loan? Personal Installment Cash Loan Payday Loan Home Equity Loan Mortgage Business Loan Auto Loan Truck & Trailer Loan Other Equipment Loan 0% 10% 20% 30% 40% 50% 60% 70% 80% 90% 100% FAST & EASY, it was a smooth process to get approved I did not get approved for a loan NOT EASY, I had to provide a lot of information when I applied VERY DIFFICULT, I had to apply with several companies to finally get approved
  12. Service is getting better, and Canadians are noticing This year

    48% of all applicants received their loan the day they applied, up from 43% in 2018. Furthermore, 86% of applicants saw funds deposited within three days of submitting their application, up from 82% in 2018. Perhaps that’s why Canadians were slightly more satisfied with the loan application process this year overall, with 66% finding it fast and easy to follow, compared with 61% of respondents in 2018. Those aged 44 and younger were more likely to be satisfied with the application process, with 70% of those aged 35-44 expressing satisfaction, compared with 61% of those between 55 and 64 and 53% of those over 65. Research Efforts, Priorities and Satisfaction Vary Across Demographic Groups As with last year we see research strategies and priorities varying widely across geographic, gender and age groups. While research priorities were largely consistent across the country, some demographics had different concerns than others. Furthermore, with speed and availability varying across provinces and loan types, there were significant discrepancies in alternative lending experiences.
  13. Between loan types The amount of time and effort Canadians

    are dedicating to research activities varies widely between loan types. Business loan applicants were most likely to investigate a wider array of lenders before applying, with 44% of customers considering six or more options, followed by home equity loan seekers. Truck and trailer financing applicants considered the fewest options, with half investigating two or less during their research. Mortgage seekers, however, were the most likely to dedicate significant time to their search, with 32% dedicating more than 6 hours and the majority dedicated more than three. Payday loan and auto loan applicants were the most likely to spend less than one hour conducting research, with the majority dedicating less than two. Overall home equity loan applicants were most concerned with interest rates and terms, truck and trailer financing applicants were the most concerned with customer service and support, business loan applicants expressed the most concern over the speed of getting a loan and mortgage seekers were the most concerned with brand reputation. QUESTION: How many lenders did you research before applying for a loan? Personal Installment Cash Loan Payday Loan Home Equity Loan Mortgage Business Loan Auto Loan Truck & Trailer Loan Other Equipment Loan 0% 10% 20% 30% 40% 50% 60% 70% 80% 90% 100% 1 to 2 3 to 5 6 to 9 10+
  14. Between genders Men were slightly more likely to spend just

    an hour or two conducting research, while women were slightly more likely to spend more than 10. While their priorities were generally the same men were slightly more concerned with customer service, support and fee transparency, while women were more interested in track record and the speed of getting a loan. Those extra hours were primarily spent on the company’s website and reading online reviews, or discussing lenders with friends and family, which women were more likely to do than men. Perhaps as a direct result, women were more likely to feel like they had enough information about their provider’s products, services, interest rates and reputation before submitting an application. Female applicants were more likely to find the application process smooth and easy, though slightly less likely to be approved for a loan. They were also much more likely to receive funds on the day they applied, with 52% receiving same day funding, compared with just 42% of men. As a result, 68% of women were satisfied with the loan application process, compared with 63% of men, and 42% were satisfied with their individual provider, compared with 36% of men. Half of all male respondents are interested in approaching a traditional financial institution for their loan products in the future, compared with just 39% of female respondents, a higher proportion of whom remained unsure. Overall, 20% of men ranked the industry two stars or less out of five, compared with only 17% of women. QUESTION: How easy was it to get approved for your loan? MEN MEN WOMEN WOMEN 0% 0% 10% 10% 20% 20% 30% 30% 40% 40% 50% 50% 60% 60% 70% 70% 80% 80% 90% 90% 100% 100% FAST & EASY, it was a smooth process to get approved Recommended by a friend Social Media Online Search Other I did not get approved for a loan NOT EASY, I had to provide a lot of information when I applied VERY DIFFICULT, I had to apply with several companies to finally get approved QUESTION: How did you discover the company or companies that you ultimately applied for a loan with? (Check all that apply)
  15. Between age groups Online search is by far the most

    popular form of research across all age groups, though younger applicants were much more likely to depend on personal recommendations. The older cohorts were most likely to consult social media, not including those over the age of 65. Nearly two thirds of all age groups looked through their prospective provider’s website, but only 55% of those aged 25-35 checked out their website before applying. Furthermore, the older the applicant the less likely they were to read online reviews. More than 62% of those aged 18-24 consulted online reviews, as well as about half of those between 25 and 44, compared with only 39% of those between 55 and 64, and 29% of those above 65. The youngest borrowers were also the most likely to read online articles and reports, with 43% doing so before submitting their application, compared with about a quarter of those in all other age groups. They were also most likely to ask a friend or family member for advice. About 30% of all applicants sought a loan through a traditional financial institution prior to seeking out an alternative lender. About half considered three to five alternative providers before submitting an application, though 18 to 24 year olds were the most likely to research 10 or more, while those above 65 were much more likely to only consider just one or two. More than one third of those aged 25 to 34 and a third of those over 65 spent less than an hour conducting research into their lender of choice, compared with just over a quarter of all other age groups. Perhaps unsurprisingly, they were also the least likely to feel like they had enough information about the provider before applying. QUESTION: How long did you spend researching lenders before applying? 18 to 24 25 to 34 35 to 44 45 to 54 55 to 64 65+ 0% 10% 20% 30% 40% 50% 60% 70% 80% 90% 100% Less than an hour 1 to 2 hours 3 to 5 hours 6 to 9 hours 10 or more hours
  16. Those between 55 and 64 were most likely to spend

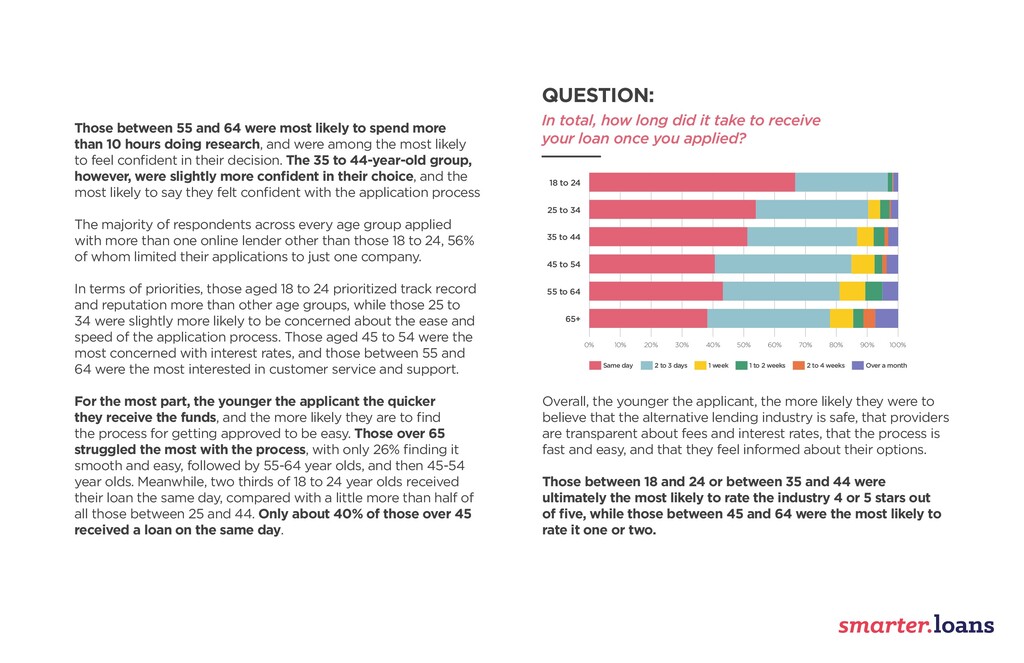
    more than 10 hours doing research, and were among the most likely to feel confident in their decision. The 35 to 44-year-old group, however, were slightly more confident in their choice, and the most likely to say they felt confident with the application process The majority of respondents across every age group applied with more than one online lender other than those 18 to 24, 56% of whom limited their applications to just one company. In terms of priorities, those aged 18 to 24 prioritized track record and reputation more than other age groups, while those 25 to 34 were slightly more likely to be concerned about the ease and speed of the application process. Those aged 45 to 54 were the most concerned with interest rates, and those between 55 and 64 were the most interested in customer service and support. For the most part, the younger the applicant the quicker they receive the funds, and the more likely they are to find the process for getting approved to be easy. Those over 65 struggled the most with the process, with only 26% finding it smooth and easy, followed by 55-64 year olds, and then 45-54 year olds. Meanwhile, two thirds of 18 to 24 year olds received their loan the same day, compared with a little more than half of all those between 25 and 44. Only about 40% of those over 45 received a loan on the same day. Overall, the younger the applicant, the more likely they were to believe that the alternative lending industry is safe, that providers are transparent about fees and interest rates, that the process is fast and easy, and that they feel informed about their options. Those between 18 and 24 or between 35 and 44 were ultimately the most likely to rate the industry 4 or 5 stars out of five, while those between 45 and 64 were the most likely to rate it one or two. QUESTION: In total, how long did it take to receive your loan once you applied? 18 to 24 25 to 34 35 to 44 45 to 54 55 to 64 65+ 0% 10% 20% 30% 40% 50% 60% 70% 80% 90% 100% Same day 2 to 3 days 1 week 1 to 2 weeks 2 to 4 weeks Over a month
  17. Between provinces Those based in PEI were by far the

    most likely to spend six hours or more doing research, while those based in Saskatchewan were most likely to dedicate two or less. PEI residents were also much more likely to rely on the recommendation of a friend, while every other province relied most heavily on online research. They were also the most likely to spend under an hour conducting research, of which half did, and almost all spent less than three. By contract, almost half of those in Newfoundland and 58% of those in New Brunswick spent more than three. Despite less robust research efforts residents of Prince Edward Island were most likely to feel confident in their decision, followed by those in Ontario and Manitoba. Those based in Prince Edward Island were also the least interested in terms and interest rates, and most likely to value reputation and track record. They, along with residents of Quebec, were also the most likely to prioritize speed, while those in Manitoba and Newfoundland were most likely to prioritize ease. Residents of Quebec and Ontario ultimately felt the most informed about their options, while Manitobans were the most likely to strongly agree that the industry in Canada is safe and scam free, and that providers are transparent about their fees. Residents of Quebec and New Brunswick are the most likely to approach a traditional lender in the future. QC & NB Most likely to approach a traditional lender in the future ON & QC Felt the most informed about their options PEI Most likely to value reputation and track record MB Most likely to strongly agree that the industry in Canada is safe and scam free, and that providers are transparent about their fees
  18. Where the Industry is Heading Next? Business loans saw the

    highest proportion of first-time borrowers this year, with a third seeking their first loan from alternative lenders in 2019. On the opposite end of the spectrum, only 16% of auto loan seekers submitted their first application with an alternative lender in the past 12 months. The biggest provincial market for all loan types in 2019 was Ontario, followed by Alberta and then British Columbia. Despite its size Quebec punches well below its weight class, likely due to more restrictive regulations. The province is home to less than 8% of the national market for alternative lending products, despite being home to roughly 24% of the country’s overall population. The highest proportion of first time customers, meanwhile, is in the Maritimes, with half of PEI based respondents and over a quarter of Manitobans seeking their first loan with an alternative provider in 2019. The biggest market for first time borrowers are on the highest and lowest ends of the age spectrum, with 38% of those between 18 and 24 and 30% of those over 65 seeking their first loan from an alternative lender in 2019. Women appear to be the primary customer for home equity loans, payday loans and personal instalment cash loans, comprising over 60% of those markets. Men were more likely than women to seek a loan for truck and trailer financing, equipment financing or business loans. QUESTION: Please select your gender Personal Installment Cash Loan Payday Loan Home Equity Loan Mortgage Business Loan Auto Loan Truck & Trailer Loan Other Equipment Loan 0% 10% 20% 30% 40% 50% 60% 70% 80% 90% 100% MALE FEMALE OTHER
  19. Research methodology In November of 2019 Smarter.Loans conducted a study

    of 2,415 of its users based across Canada about their experience with alternative lending providers over the previous 12 months. Participants were asked a total of 23 questions using the SurveyMonkey online polling platform, including multiple choice, ranking, and select all that apply questions. Respondent’s location: Ontario – 41% Alberta – 21% BC – 12% Saskatchewan – 6.5% Manitoba – 4.5% Nova Scotia 5% Quebec – 3% New Brunswick – 3.5% Newfoundland – 2% Prince Edward Island – .3% Respondent’s age: 18 to 24 years old: 4.7% 25 to 34 years old: 22% 35 to 44 years old: 30% 45 to 54 years old: 26% 55 to 64 years old: 14% 65 years and older: 4% Respondent’s Gender: Male: 40% Female: 60%