Verifying the Forecast: How Climate Models are Developed and Tested
Keynote Talk given at the ESEC/FSE-2017, the 11th joint meeting of the European Software Engineering Conference and the ACM SIGSOFT Symposium on the Foundations of Software Engineering.
Paderborn, Germany, Sept 7, 2017
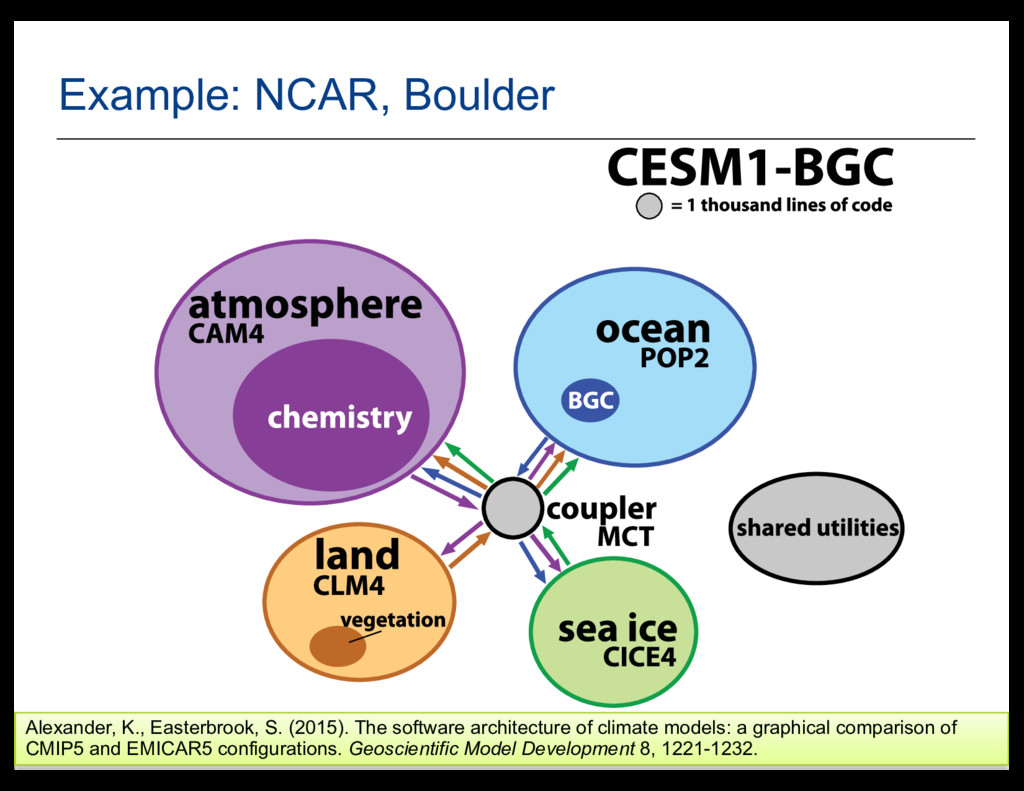
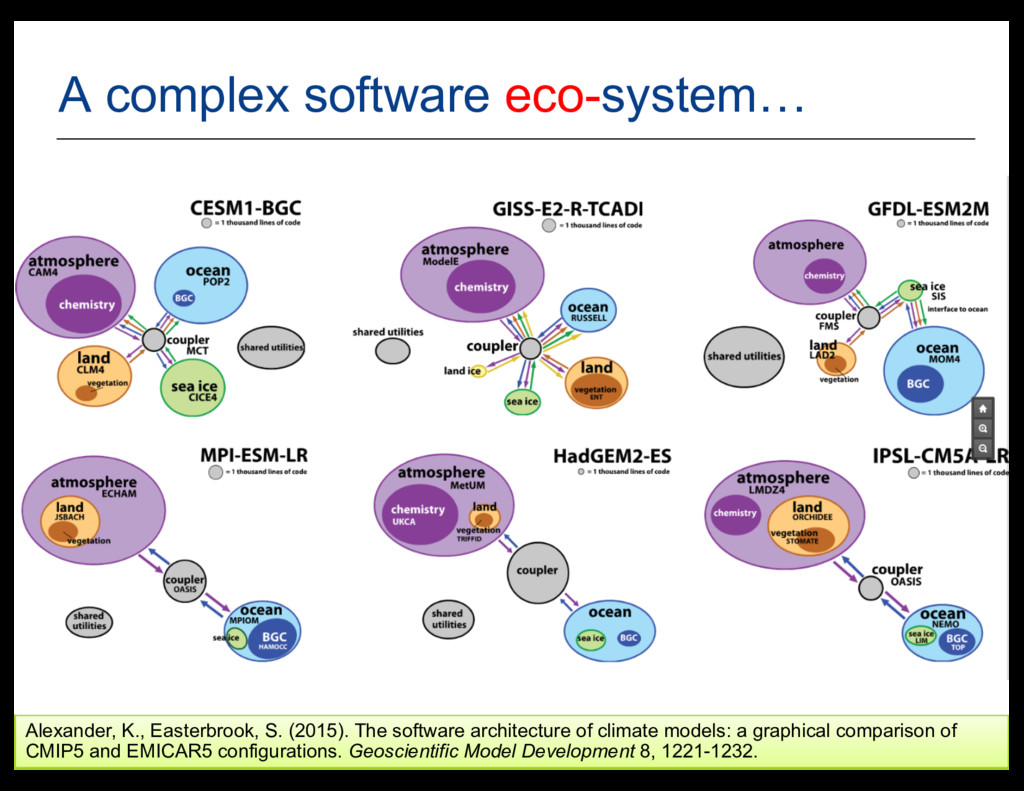
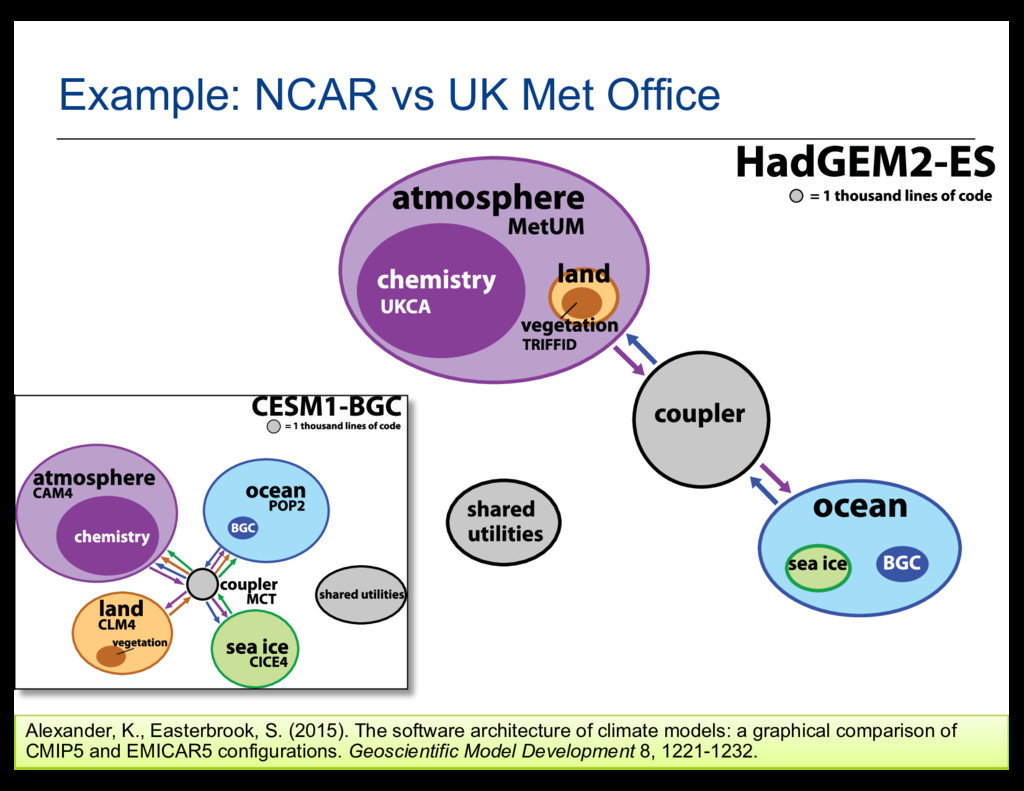
The software architecture of climate models: a graphical comparison of CMIP5 and EMICAR5 configurations. Geoscientific Model Development 8, 1221-1232.
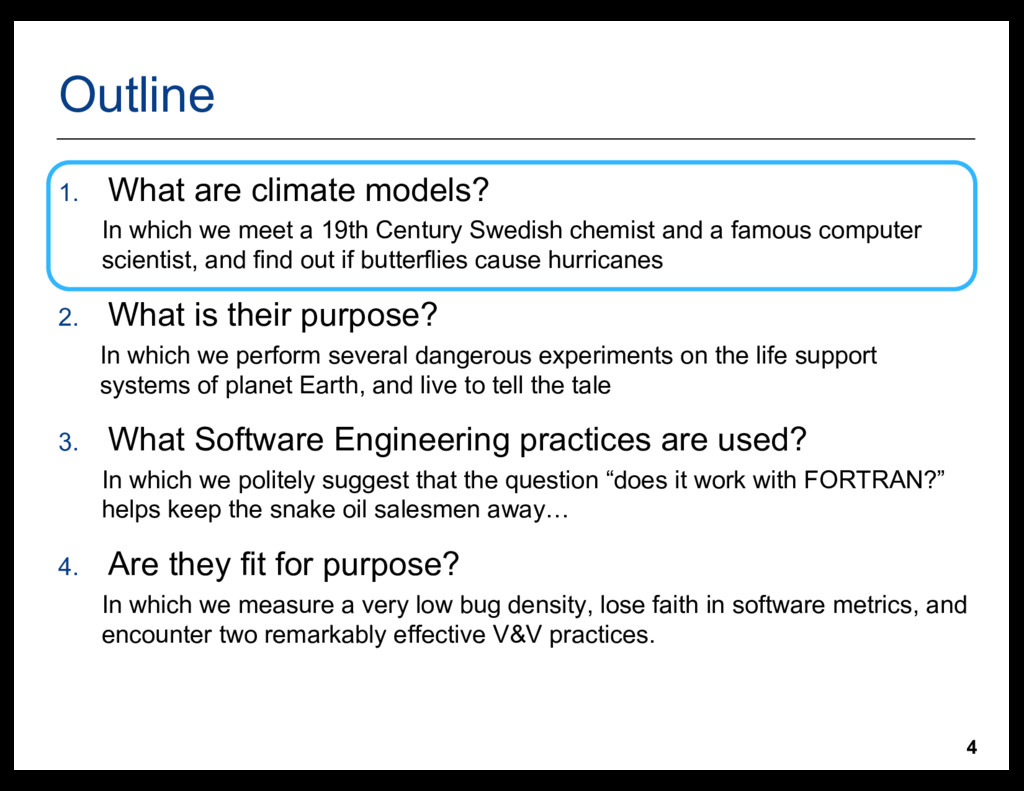
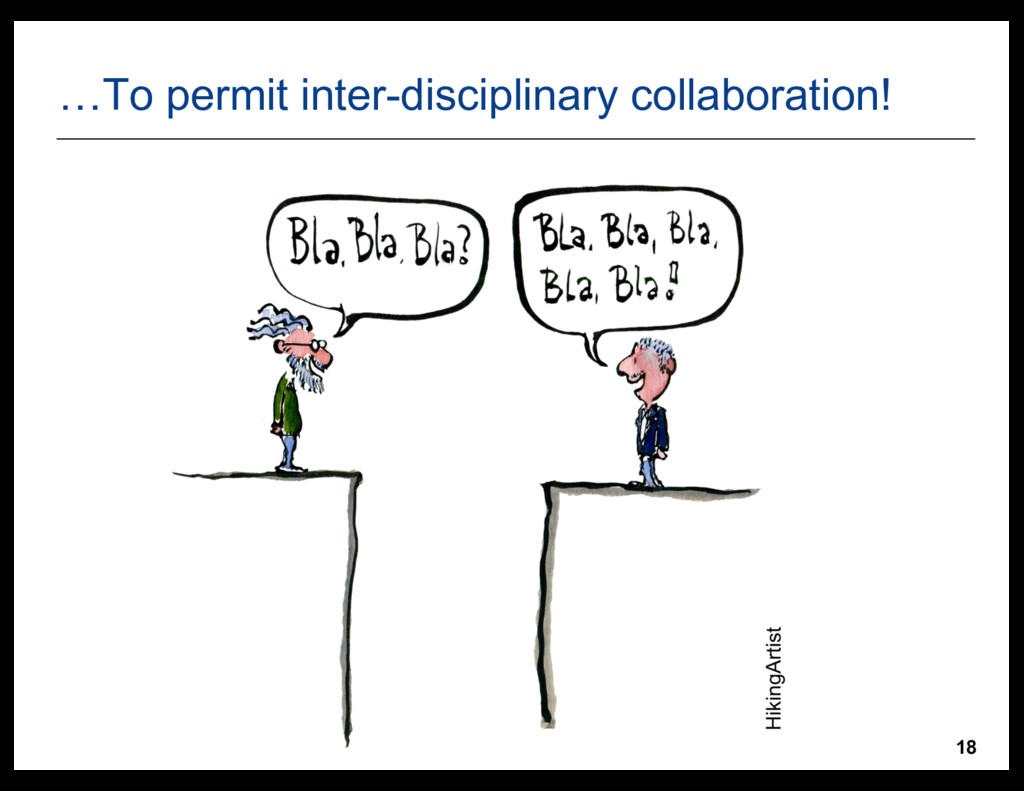
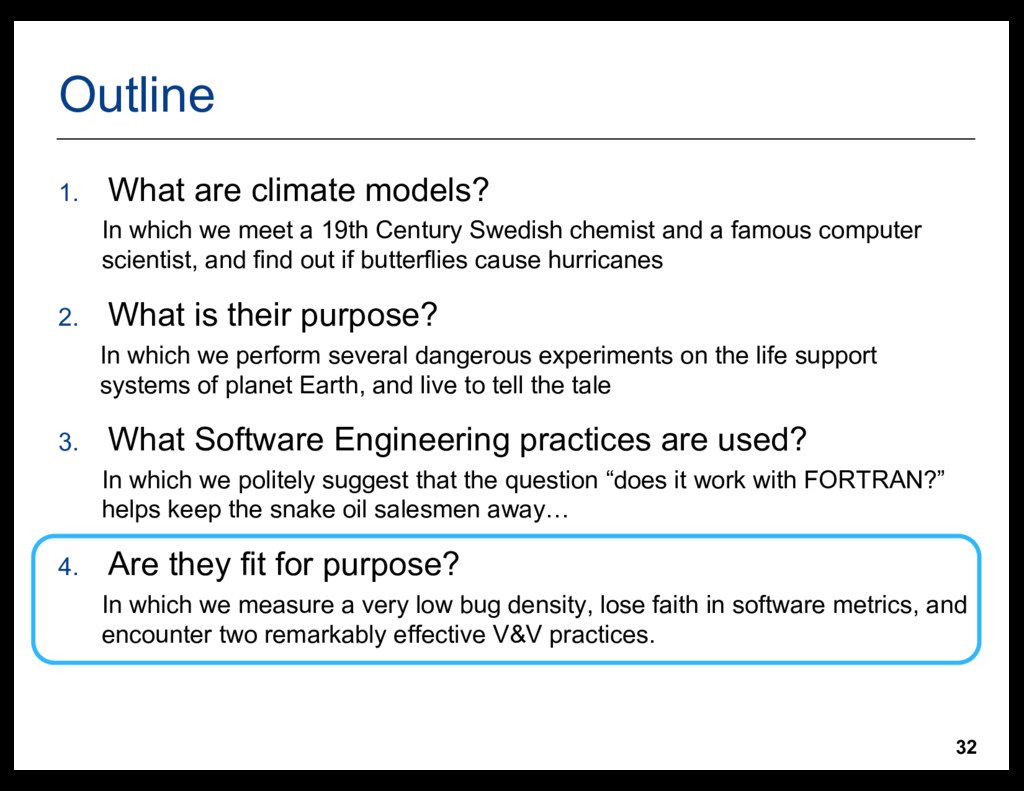
meet a 19th Century Swedish chemist and a famous computer scientist, and find out if butterflies cause hurricanes 2. What is their purpose? In which we perform several dangerous experiments on the life support systems of planet Earth, and live to tell the tale 3. What Software Engineering practices are used? In which we politely suggest that the question “does it work with FORTRAN?” helps keep the snake oil salesmen away… 4. Are they fit for purpose? In which we measure a very low bug density, lose faith in software metrics, and encounter two remarkably effective V&V practices.
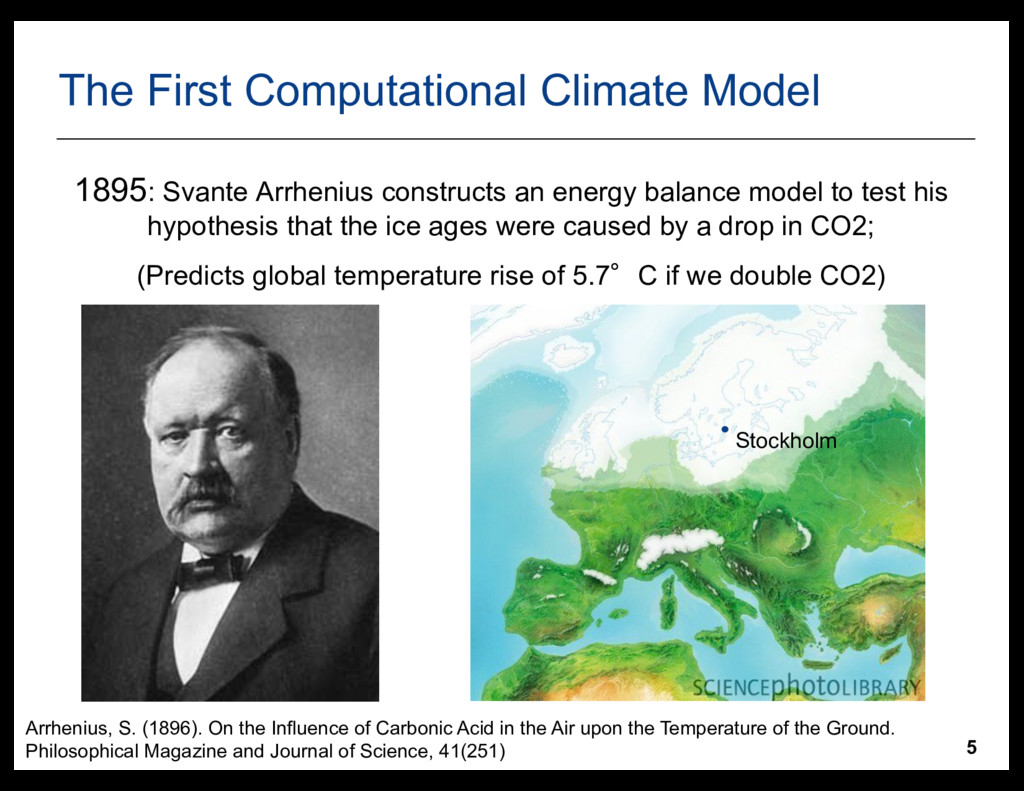
an energy balance model to test his hypothesis that the ice ages were caused by a drop in CO2;; (Predicts global temperature rise of 5.7°C if we double CO2) •Stockholm Arrhenius, S. (1896). On the Influence of Carbonic Acid in the Air upon the Temperature of the Ground. Philosophical Magazine and Journal of Science, 41(251)
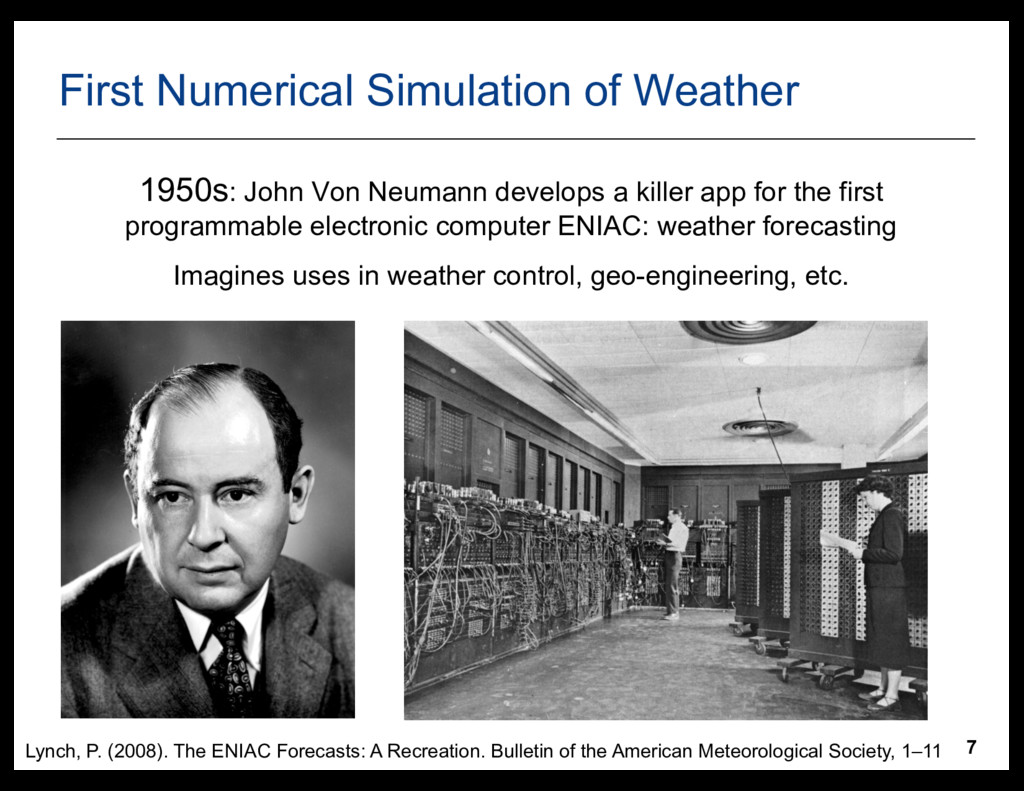
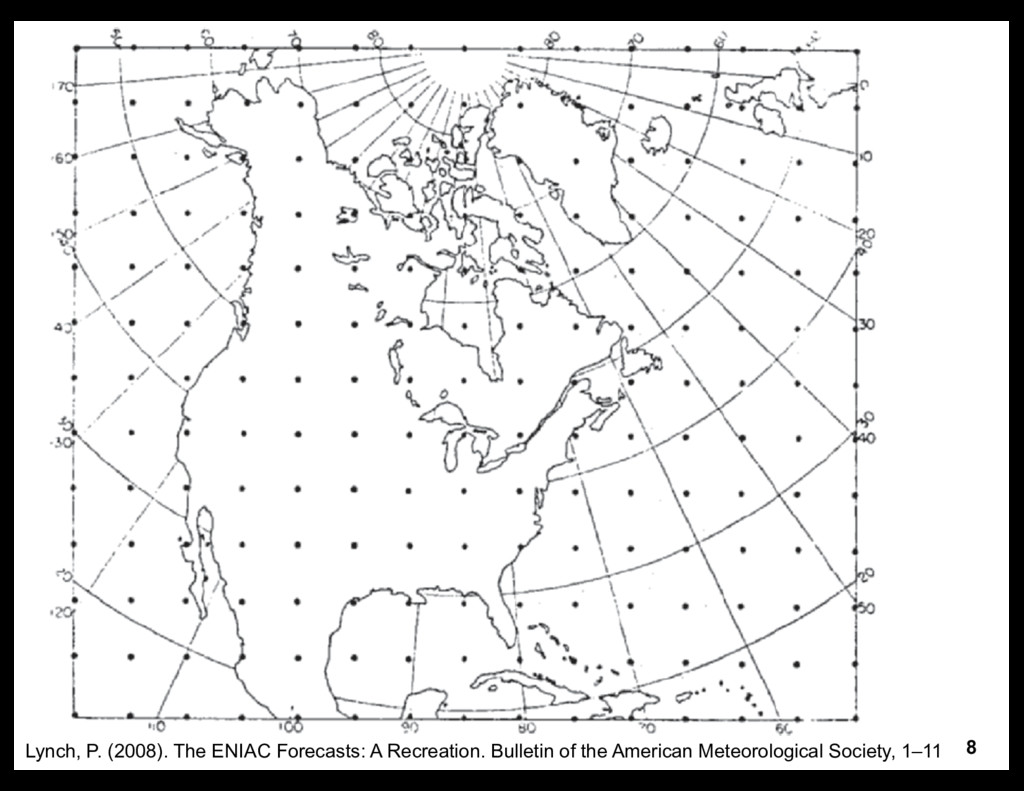
develops a killer app for the first programmable electronic computer ENIAC: weather forecasting Imagines uses in weather control, geo-engineering, etc. Lynch, P. (2008). The ENIAC Forecasts: A Recreation. Bulletin of the American Meteorological Society, 1–11
meet a 19th Century Swedish chemist and a famous computer scientist, and find out if butterflies cause hurricanes 2. What is their purpose? In which we perform several dangerous experiments on the life support systems of planet Earth, and live to tell the tale 3. What Software Engineering practices are used? In which we politely suggest that the question “does it work with FORTRAN?” helps keep the snake oil salesmen away… 4. Are they fit for purpose? In which we measure a very low bug density, lose faith in software metrics, and encounter two remarkably effective V&V practices.
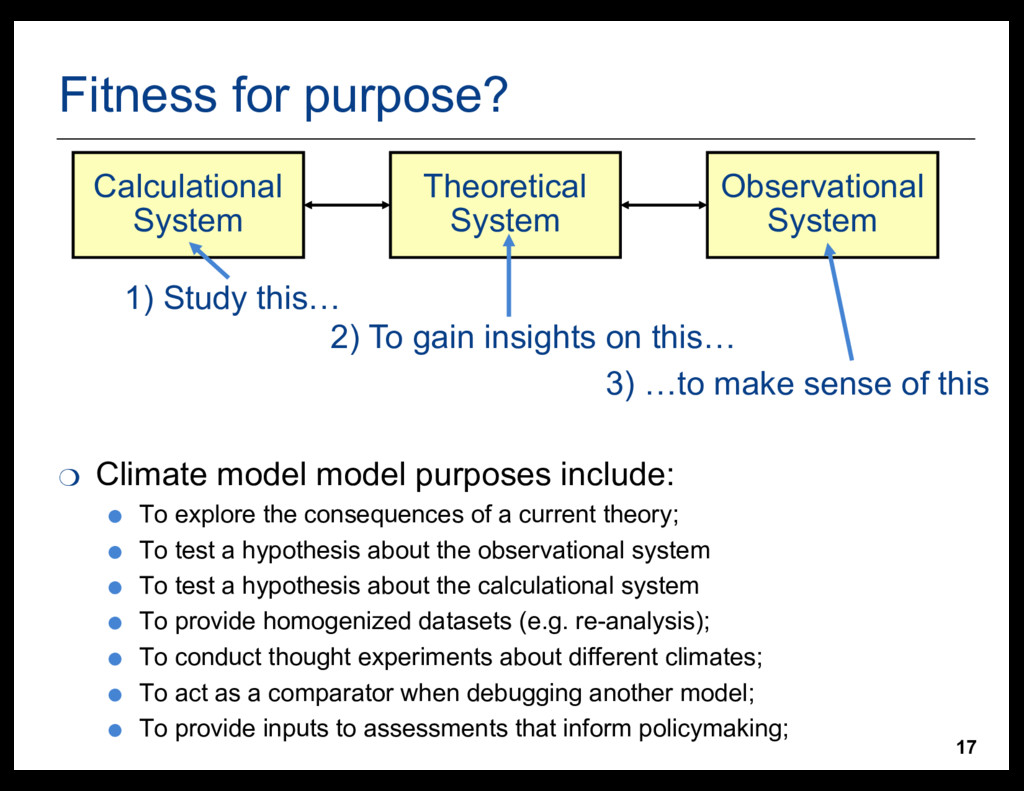
• To explore the consequences of a current theory;; • To test a hypothesis about the observational system • To test a hypothesis about the calculational system • To provide homogenized datasets (e.g. re-analysis);; • To conduct thought experiments about different climates;; • To act as a comparator when debugging another model;; • To provide inputs to assessments that inform policymaking;; Calculational System Theoretical System Observational System 1) Study this… 2) To gain insights on this… 3) …to make sense of this
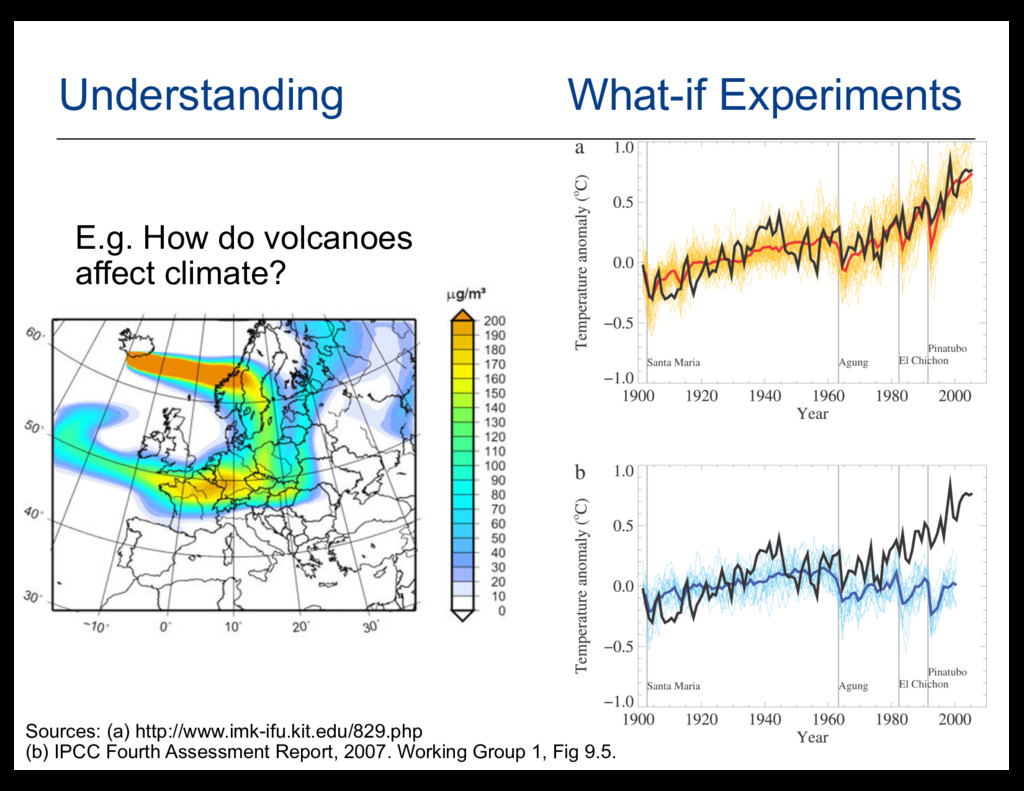
et al. (2014). Arctic cryosphere response in the Geoengineering Model Intercomparison Project G3 and G4 scenarios. Journal of Geophysical Research: Atmospheres, 119(3), 1308–1321. •Global average near- surface temperature (°C) •Artic Sea Ice Extent (millions of km2)
meet a 19th Century Swedish chemist and a famous computer scientist, and find out if butterflies cause hurricanes 2. What is their purpose? In which we perform several dangerous experiments on the life support systems of planet Earth, and live to tell the tale 3. What Software Engineering practices are used? In which we politely suggest that the question “does it work with FORTRAN?” helps keep the snake oil salesmen away… 4. Are they fit for purpose? In which we measure a very low bug density, lose faith in software metrics, and encounter two remarkably effective V&V practices.
The software architecture of climate models: a graphical comparison of CMIP5 and EMICAR5 configurations. Geoscientific Model Development 8, 1221-1232.
S. (2015). The software architecture of climate models: a graphical comparison of CMIP5 and EMICAR5 configurations. Geoscientific Model Development 8, 1221-1232.
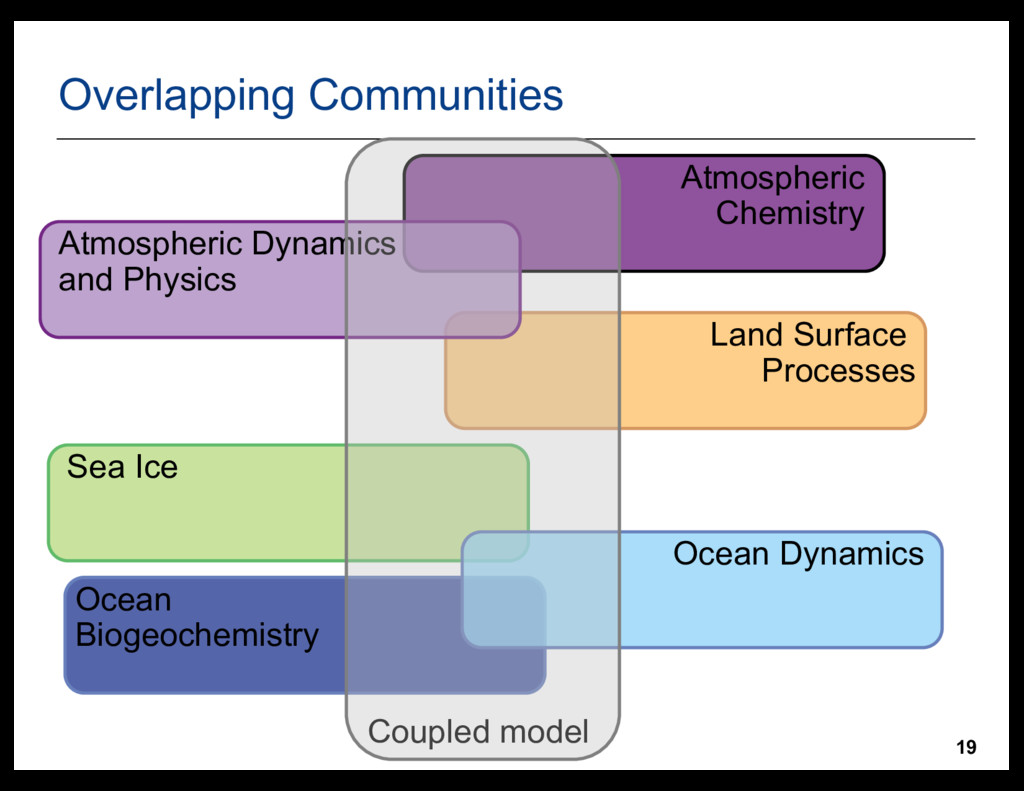
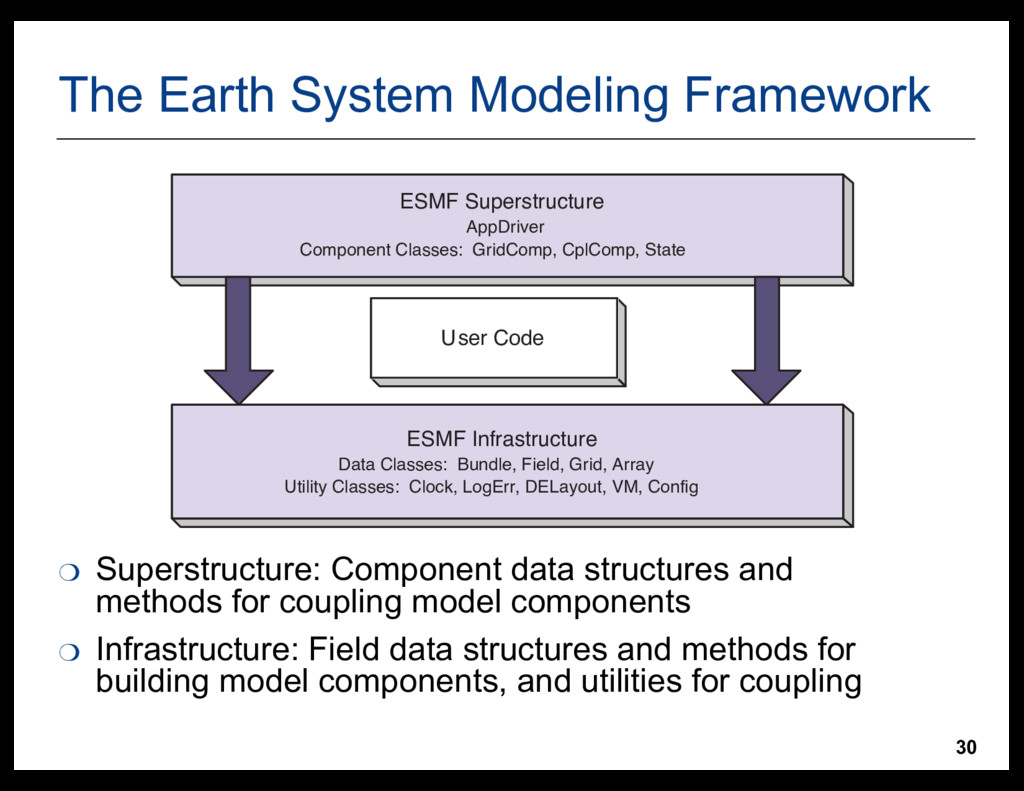
structures and methods for coupling model components ❍ Infrastructure: Field data structures and methods for building model components, and utilities for coupling Time ESMF Superstructure AppDriver Component Classes: GridComp, CplComp, State Time ESMF Infrastructure Data Classes: Bundle, Field, Grid, Array Utility Classes: Clock, LogErr, DELayout, VM, Config Time U ser Code
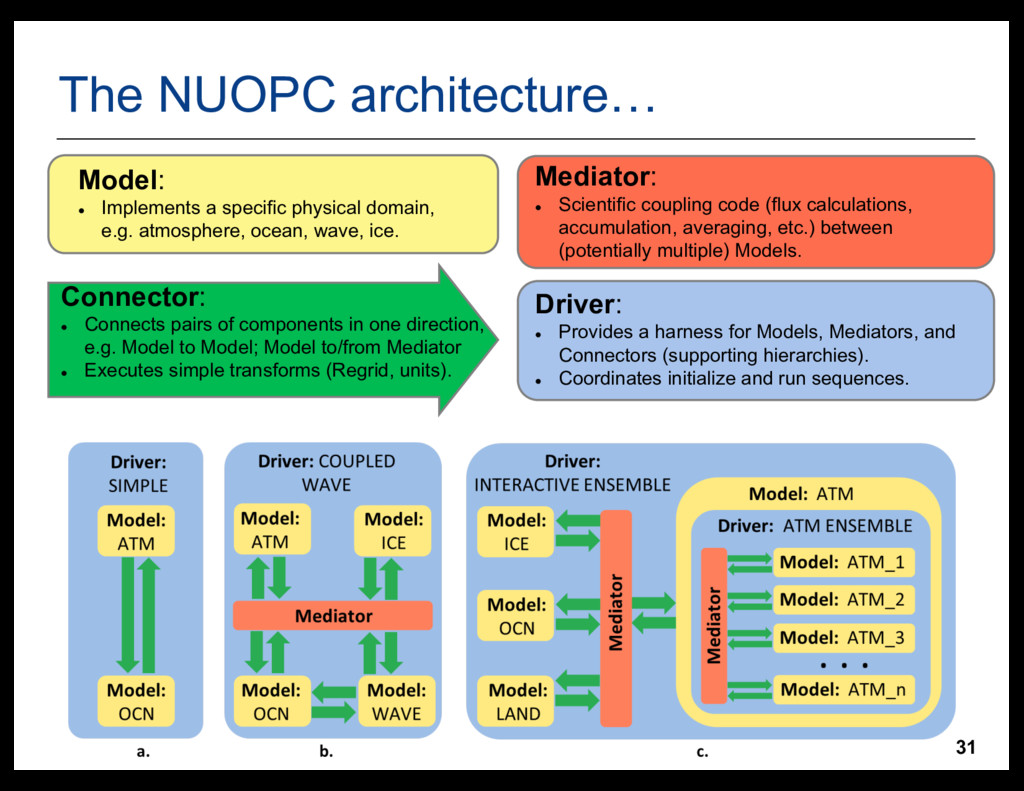
domain, e.g. atmosphere, ocean, wave, ice. Mediator: l Scientific coupling code (flux calculations, accumulation, averaging, etc.) between (potentially multiple) Models. Connector: l Connects pairs of components in one direction, e.g. Model to Model;; Model to/from Mediator l Executes simple transforms (Regrid, units). Driver: l Provides a harness for Models, Mediators, and Connectors (supporting hierarchies). l Coordinates initialize and run sequences.
meet a 19th Century Swedish chemist and a famous computer scientist, and find out if butterflies cause hurricanes 2. What is their purpose? In which we perform several dangerous experiments on the life support systems of planet Earth, and live to tell the tale 3. What Software Engineering practices are used? In which we politely suggest that the question “does it work with FORTRAN?” helps keep the snake oil salesmen away… 4. Are they fit for purpose? In which we measure a very low bug density, lose faith in software metrics, and encounter two remarkably effective V&V practices.
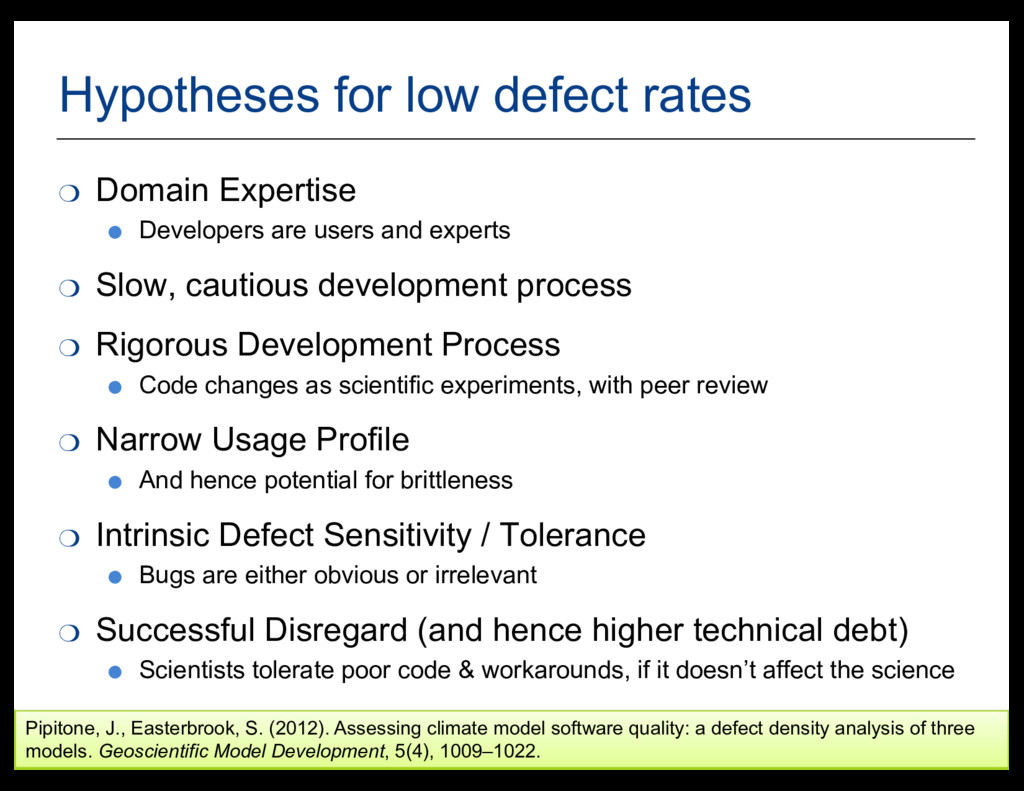
• Developers are users and experts ❍ Slow, cautious development process ❍ Rigorous Development Process • Code changes as scientific experiments, with peer review ❍ Narrow Usage Profile • And hence potential for brittleness ❍ Intrinsic Defect Sensitivity / Tolerance • Bugs are either obvious or irrelevant ❍ Successful Disregard (and hence higher technical debt) • Scientists tolerate poor code & workarounds, if it doesn’t affect the science Pipitone, J., Easterbrook, S. (2012). Assessing climate model software quality: a defect density analysis of three models. Geoscientific Model Development, 5(4), 1009–1022.
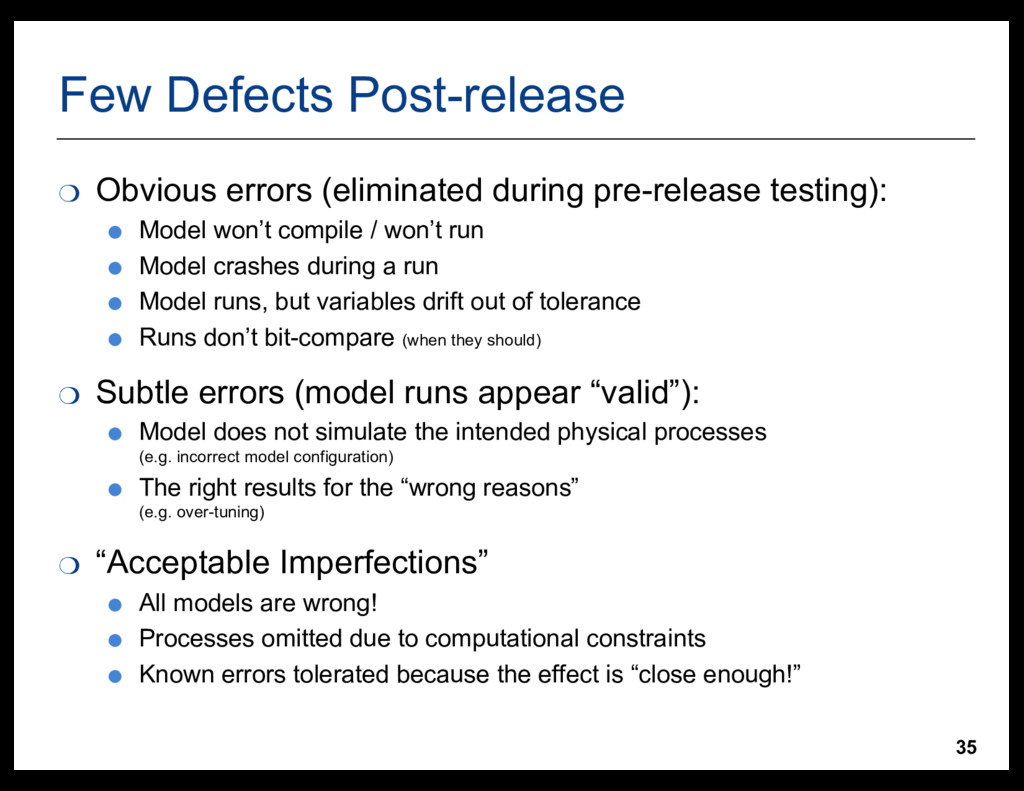
testing): • Model won’t compile / won’t run • Model crashes during a run • Model runs, but variables drift out of tolerance • Runs don’t bit-compare (when they should) ❍ Subtle errors (model runs appear “valid”): • Model does not simulate the intended physical processes (e.g. incorrect model configuration) • The right results for the “wrong reasons” (e.g. over-tuning) ❍ “Acceptable Imperfections” • All models are wrong! • Processes omitted due to computational constraints • Known errors tolerated because the effect is “close enough!”
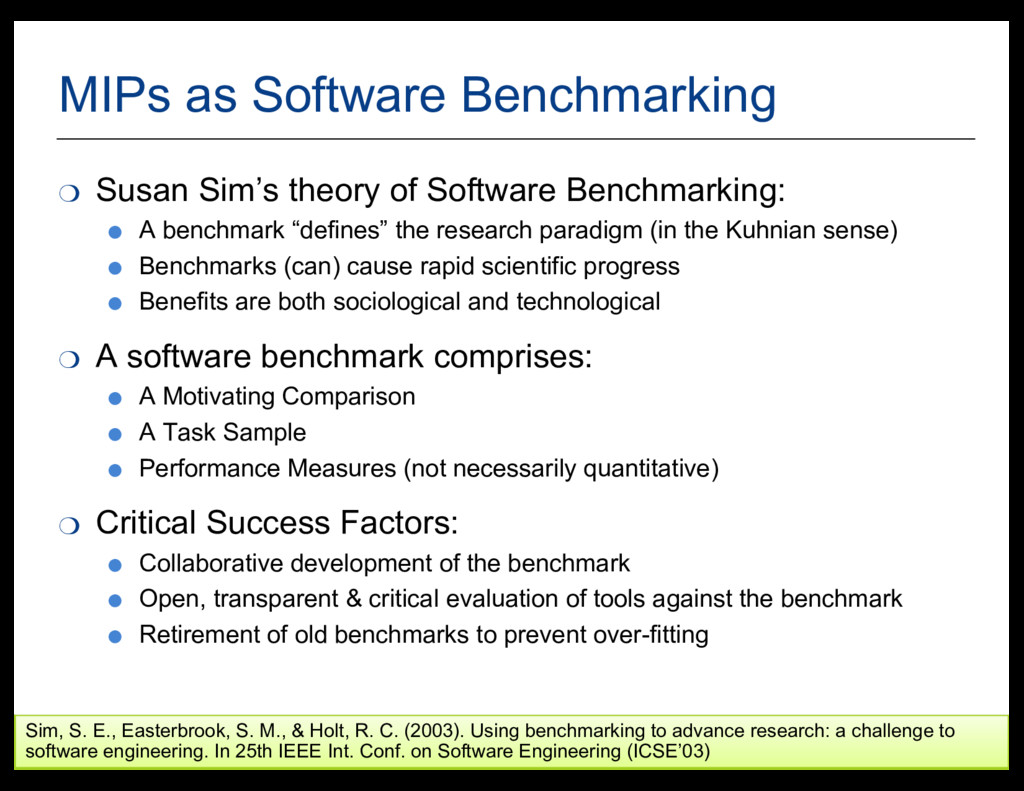
Software Benchmarking: • A benchmark “defines” the research paradigm (in the Kuhnian sense) • Benchmarks (can) cause rapid scientific progress • Benefits are both sociological and technological ❍ A software benchmark comprises: • A Motivating Comparison • A Task Sample • Performance Measures (not necessarily quantitative) ❍ Critical Success Factors: • Collaborative development of the benchmark • Open, transparent & critical evaluation of tools against the benchmark • Retirement of old benchmarks to prevent over-fitting Sim, S. E., Easterbrook, S. M., & Holt, R. C. (2003). Using benchmarking to advance research: a challenge to software engineering. In 25th IEEE Int. Conf. on Software Engineering (ICSE’03)
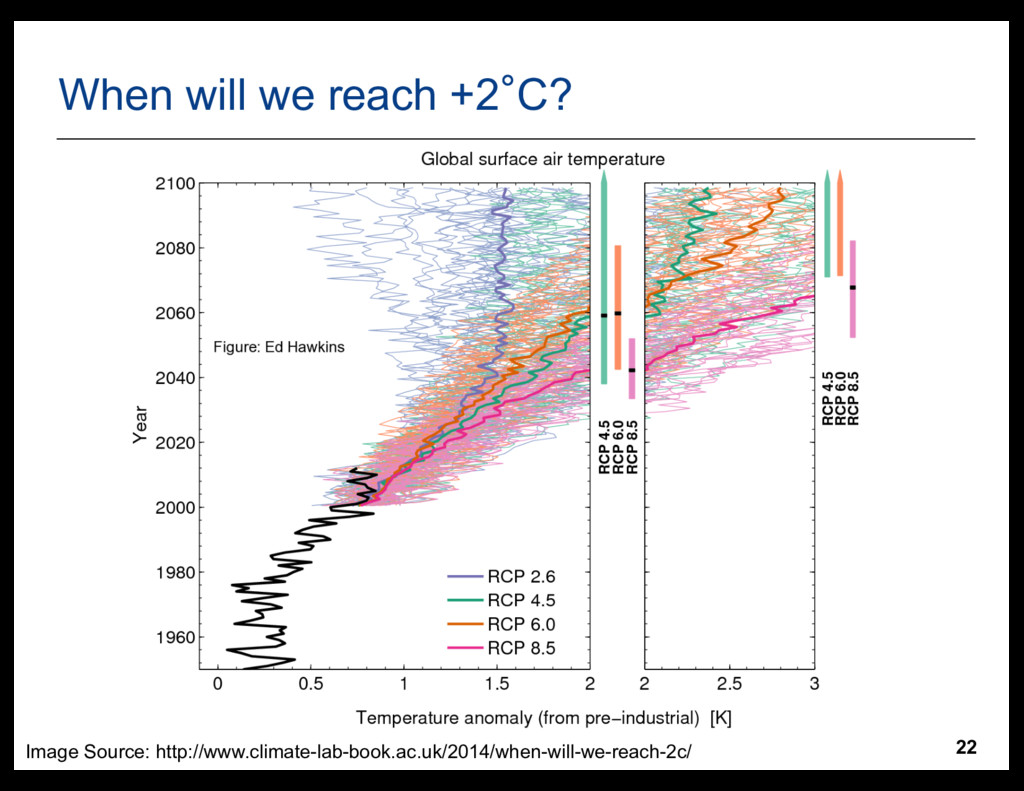
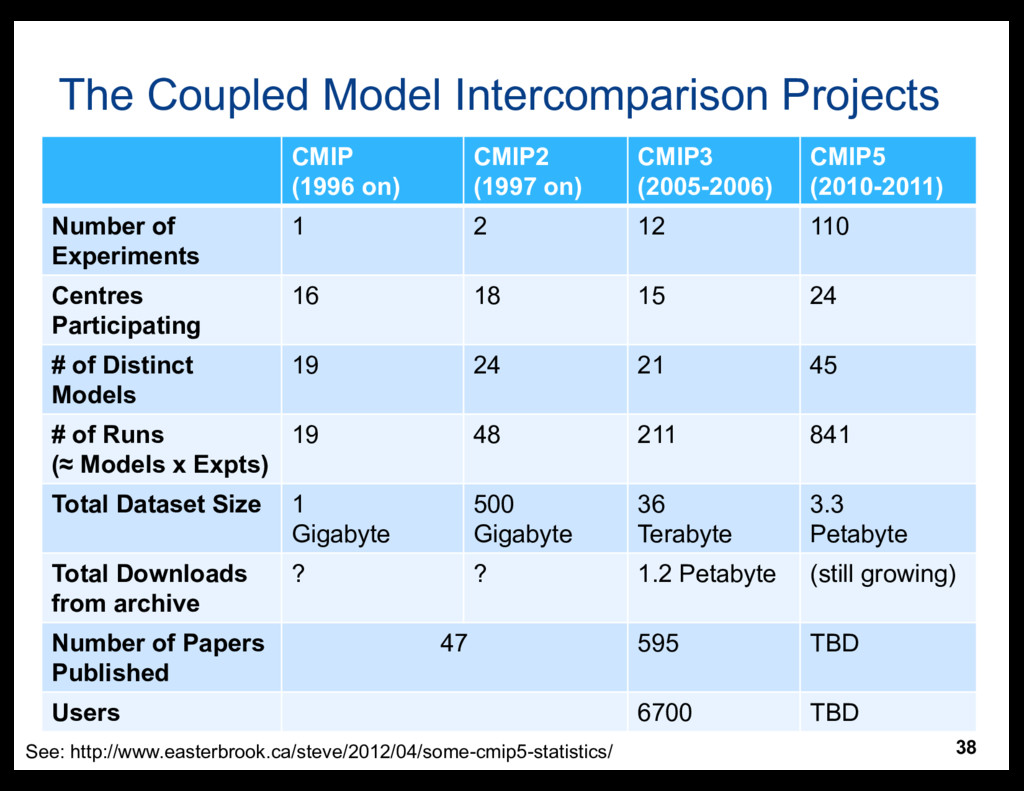
J. (2008). How Well Do Coupled Models Simulate Today’s Climate? Bulletin of the American Meteorological Society, 89(3), 303–311. For more MIPs see: http://www.clivar.org/clivar-panels/former-panels/aamp/resources/mips
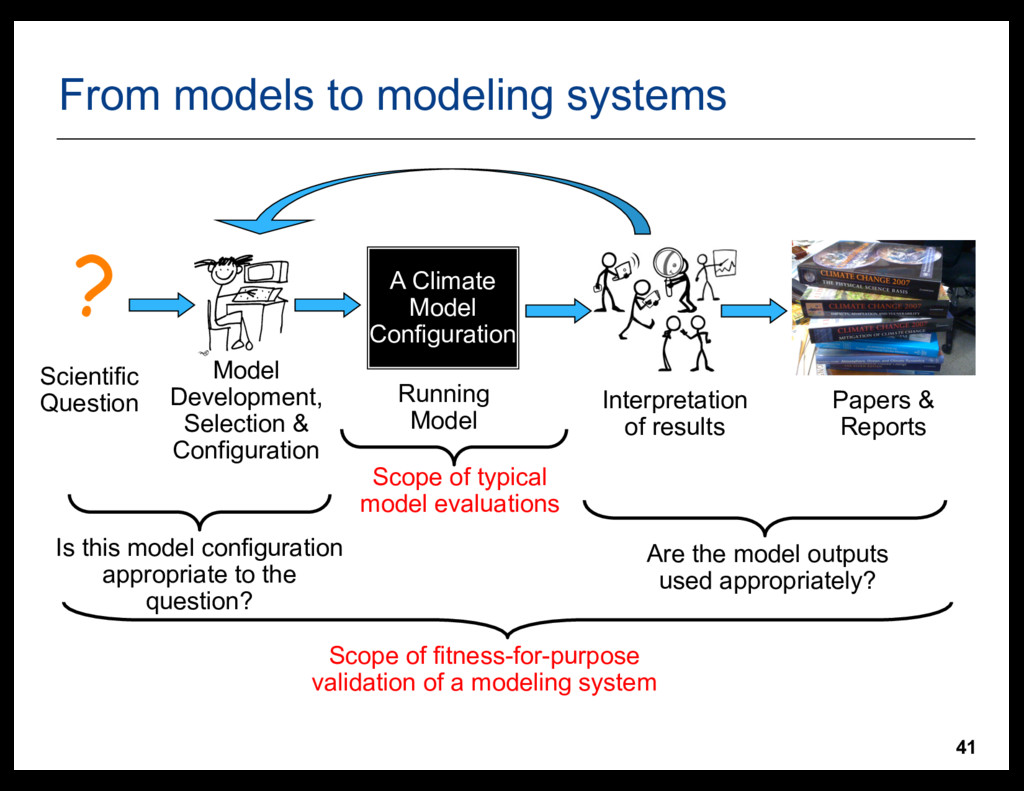
Selection & Configuration Running Model Interpretation of results Papers & Reports Scope of typical model evaluations Scope of fitness-for-purpose validation of a modeling system Is this model configuration appropriate to the question? Are the model outputs used appropriately? From models to modeling systems
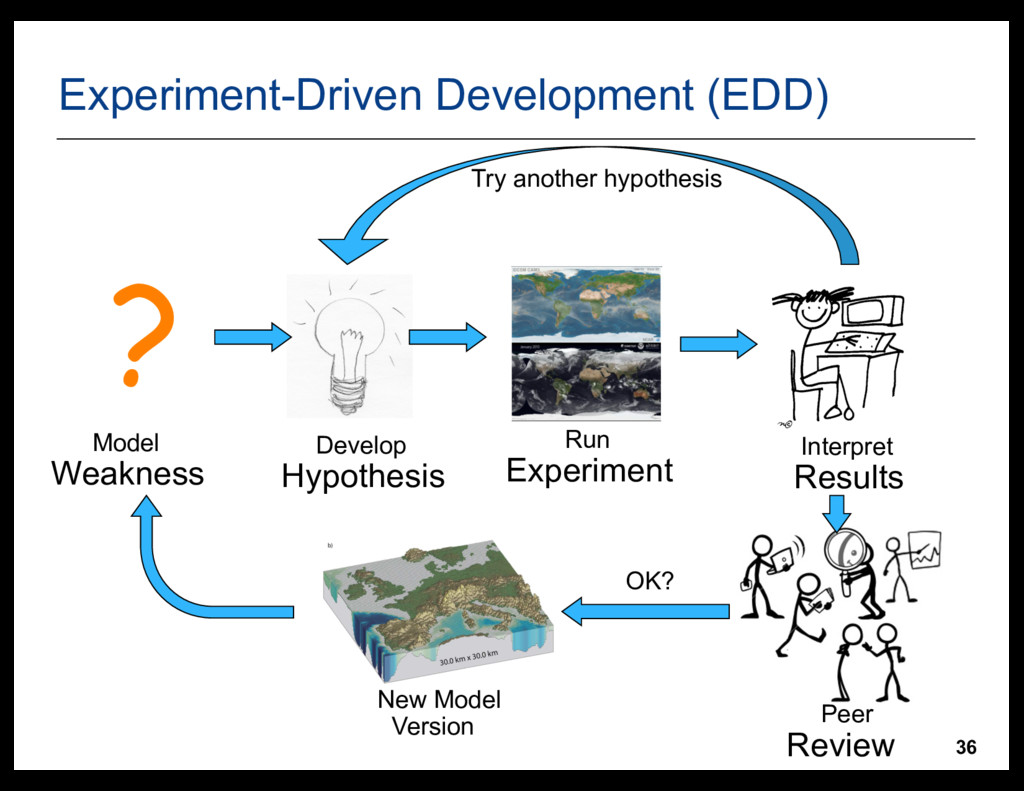
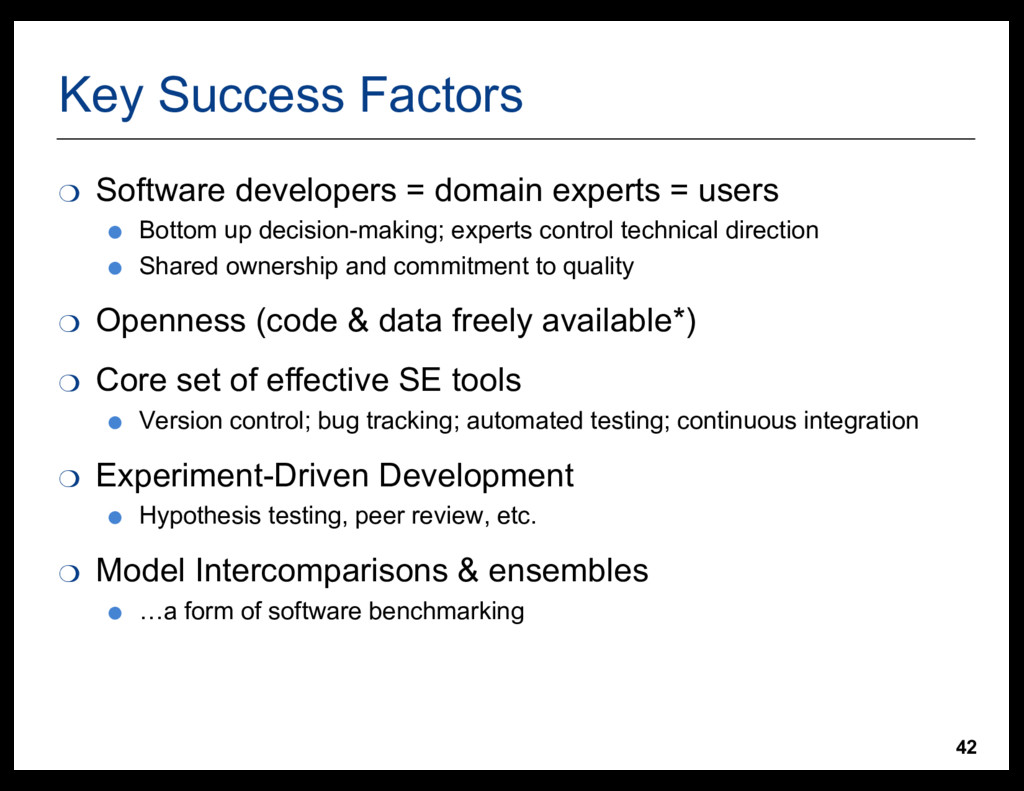
= users • Bottom up decision-making;; experts control technical direction • Shared ownership and commitment to quality ❍ Openness (code & data freely available*) ❍ Core set of effective SE tools • Version control;; bug tracking;; automated testing;; continuous integration ❍ Experiment-Driven Development • Hypothesis testing, peer review, etc. ❍ Model Intercomparisons & ensembles • …a form of software benchmarking