Business Overview for Investors [August 2026 Ed...

Avatar for SORACOM(ソラコム) SORACOM(ソラコム) PRO
August 12, 2026
Private link
33

Business Overview for Investors [August 2026 Edition]

This document is intended to help investors understand Soracom’s vision as well as the strengths and future potential of SORACOM as AI / IoT Connectivity Platforms. [August 2026 Edition]

1. Company Overview
2. Service Overview
3. Earnings Structure
4. Technological Edge
5. Market Size
6. Expected Revenue Range
7. Case Studies
8. Appendix

Avatar for SORACOM(ソラコム)

SORACOM(ソラコム) PRO

August 12, 2026

More Decks by SORACOM(ソラコム)

Transcript

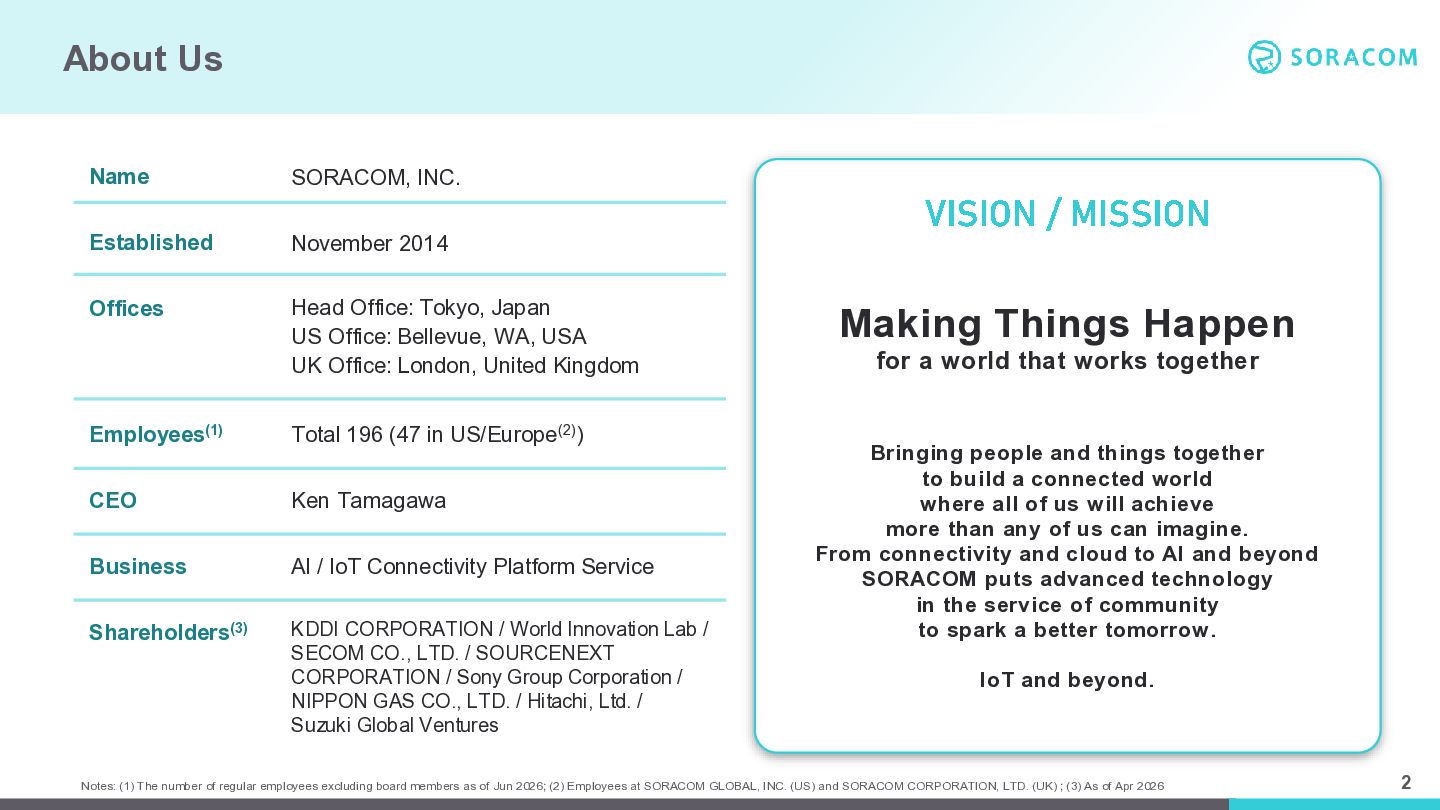
  1. About Us Name SORACOM, INC. Established November 2014 Offices Head

    Office: Tokyo, Japan US Office: Bellevue, WA, USA UK Office: London, United Kingdom Employees(1) Total 196 (47 in US/Europe(2)) CEO Ken Tamagawa Business Al / IoT Connectivity Platform Service Shareholders(3) KDDI CORPORATION / World Innovation Lab / SECOM CO., LTD. / SOURCENEXT CORPORATION / Sony Group Corporation / NIPPON GAS CO., LTD. / Hitachi, Ltd. / Suzuki Global Ventures VISION / MISSION Making Things Happen for a world that works together Bringing people and things together to build a connected world where all of us will achieve more than any of us can imagine. From connectivity and cloud to AI and beyond SORACOM puts advanced technology in the service of community to spark a better tomorrow. IoT and beyond. Notes: (1) The number of regular employees excluding board members as of Jun 2026; (2) Employees at SORACOM GLOBAL, INC. (US) and SORACOM CORPORATION, LTD. (UK) ; (3) As of Apr 2026 2
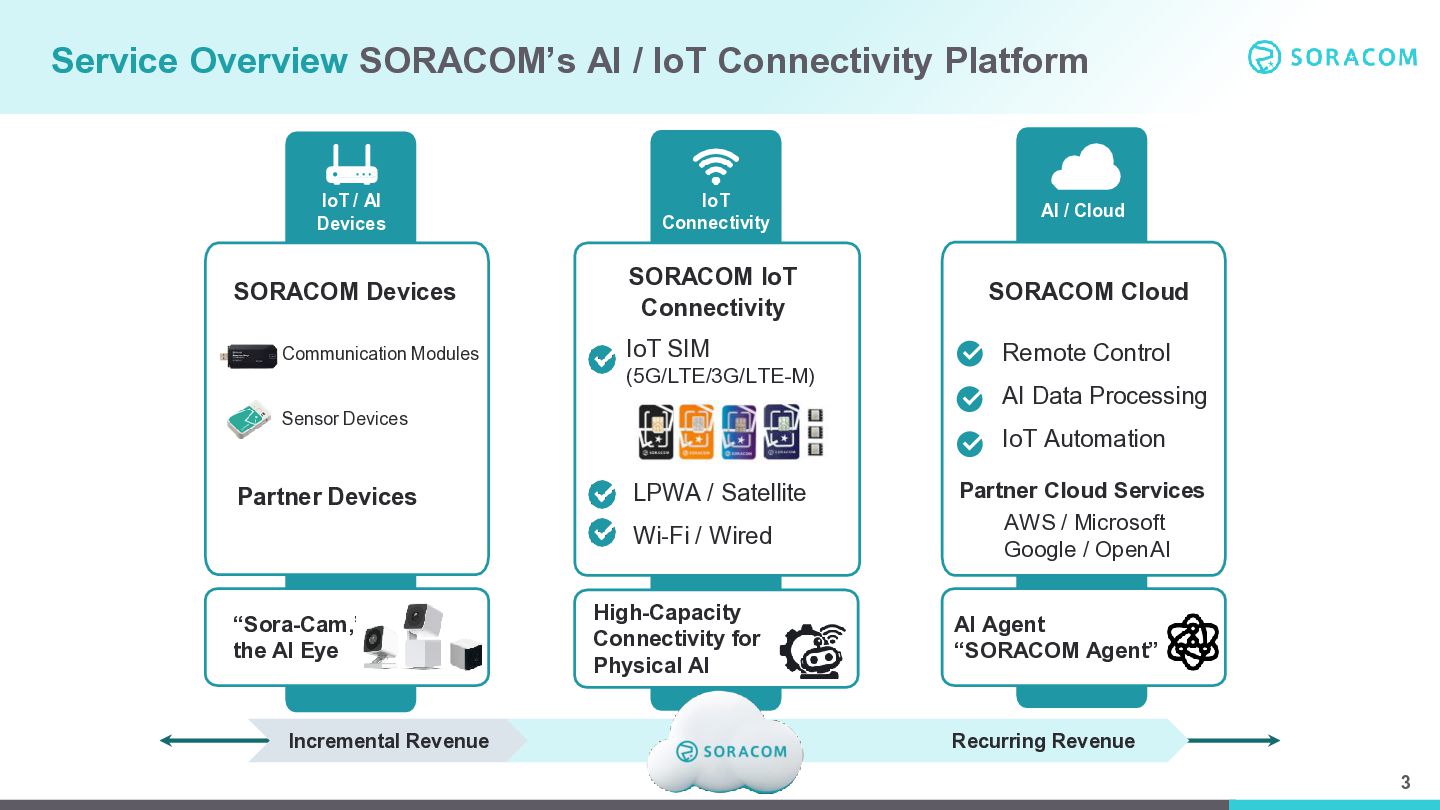
  2. Service Overview SORACOM’s AI / IoT Connectivity Platform IoT /

    AI Devices IoT Connectivity AI / Cloud SORACOM Devices SORACOM IoT Connectivity SORACOM Cloud IoT SIM Remote Control Communication Modules (5G/LTE/3G/LTE-M) Sensor Devices Partner Devices IoT Automation LPWA / Satellite Wi-Fi / Wired “Sora-Cam,” the AI Eye Incremental Revenue AI Data Processing High-Capacity Connectivity for Physical AI Partner Cloud Services AWS / Microsoft Google / OpenAI AI Agent “SORACOM Agent” Recurring Revenue 3
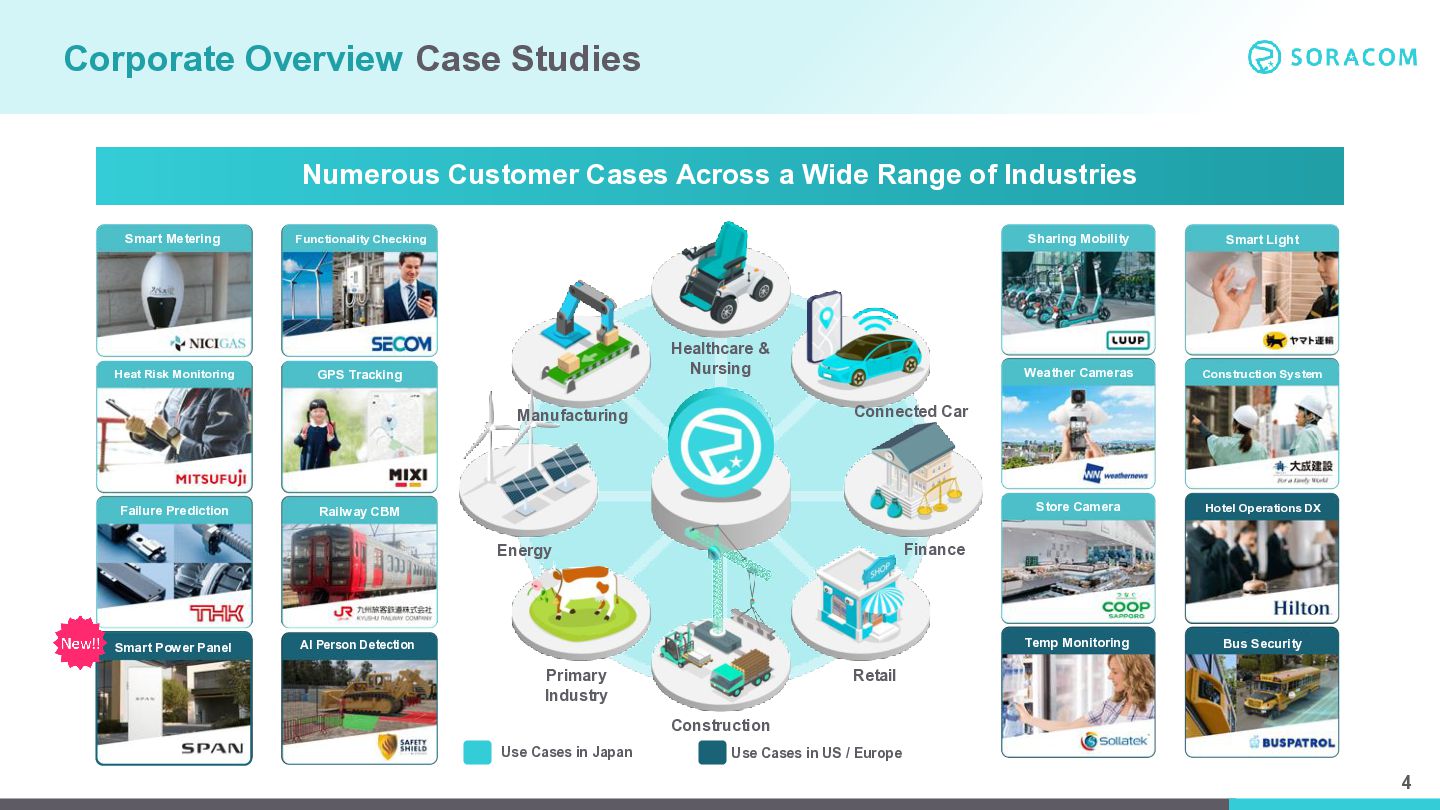
  3. Corporate Overview Case Studies Numerous Customer Cases Across a Wide

    Range of Industries Smart Metering Functionality Checking Heat Risk Monitoring GPS Tracking Healthcare & Nursing Railway CBM Weather Cameras Construction System Store Camera Hotel Operations DX Temp Monitoring Bus Security Finance Energy Smart Power Panel Smart Light Connected Car Manufacturing Failure Prediction Sharing Mobility AI Person Detection Primary Industry Retail Construction Use Cases in Japan Use Cases in US / Europe 4
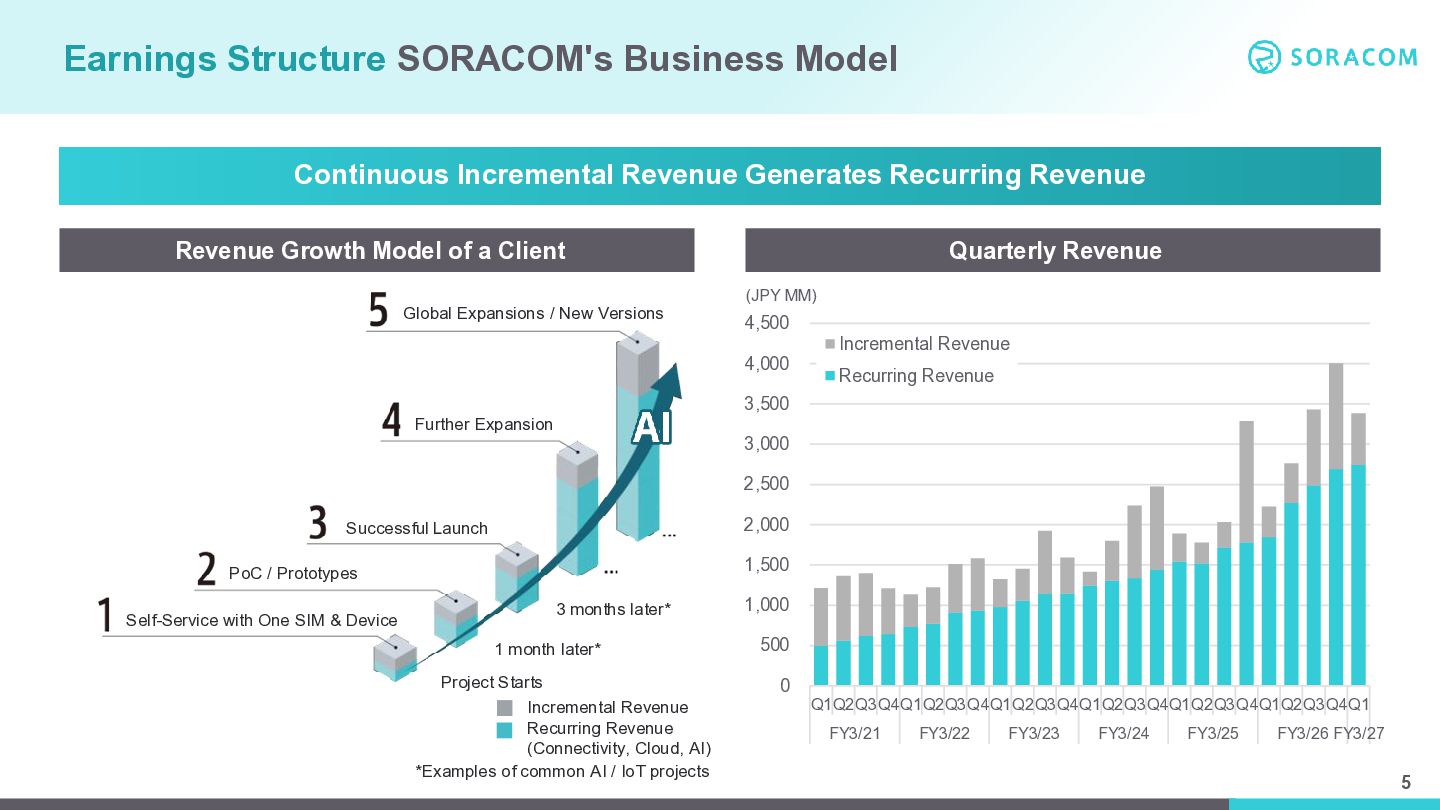
  4. Earnings Structure SORACOM's Business Model Continuous Incremental Revenue Generates Recurring

    Revenue Revenue Growth Model of a Client Global Expansions / New Versions Quarterly Revenue (JPY MM) 4,500 4,000 Incremental Revenue Recurring Revenue 3,500 Further Expansion 3,000 2,500 2,000 Successful Launch 1,500 PoC / Prototypes Self-Service with One SIM & Device 3 months later* 1 month later* Project Starts Incremental Revenue Recurring Revenue (Connectivity, Cloud, AI) *Examples of common AI / IoT projects 1,000 500 0 Q1Q2Q3Q4Q1Q2Q3Q4Q1Q2Q3Q4Q1Q2Q3Q4Q1Q2Q3Q4Q1Q2Q3Q4Q1 FY3/21 FY3/22 FY3/23 FY3/24 FY3/25 FY3/26 FY3/27 5
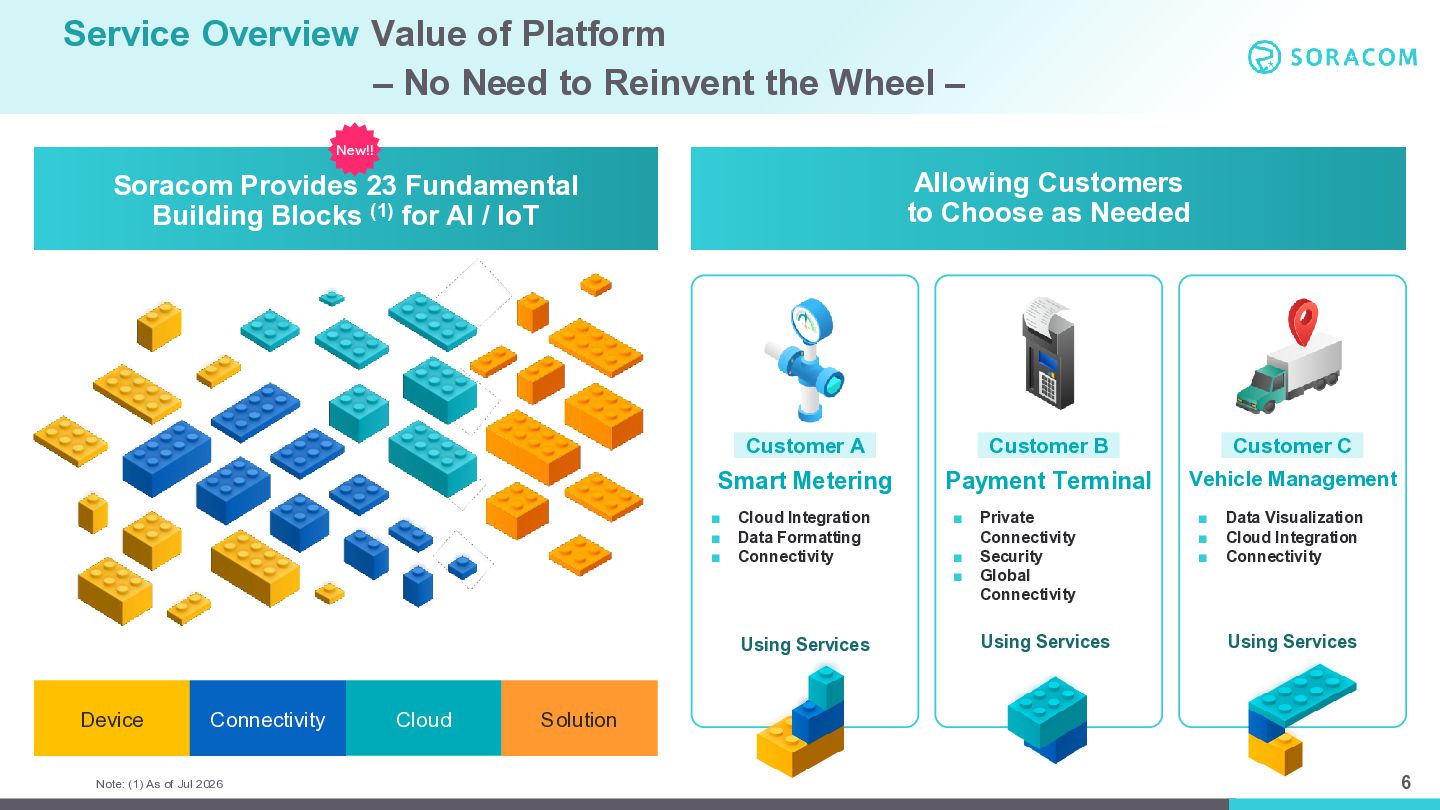
  5. Service Overview Value of Platform – No Need to Reinvent

    the Wheel – Allowing Customers to Choose as Needed Soracom Provides 23 Fundamental Building Blocks (1) for AI / IoT Customer A Customer B Customer C Smart Metering Payment Terminal Vehicle Management ▪ ▪ ▪ ▪ ▪ ▪ ▪ Cloud Integration Data Formatting Connectivity Using Services Device Connectivity Note: (1) As of Jul 2026 Cloud ▪ ▪ Private Connectivity Security Global Connectivity Using Services Data Visualization Cloud Integration Connectivity Using Services Solution 6
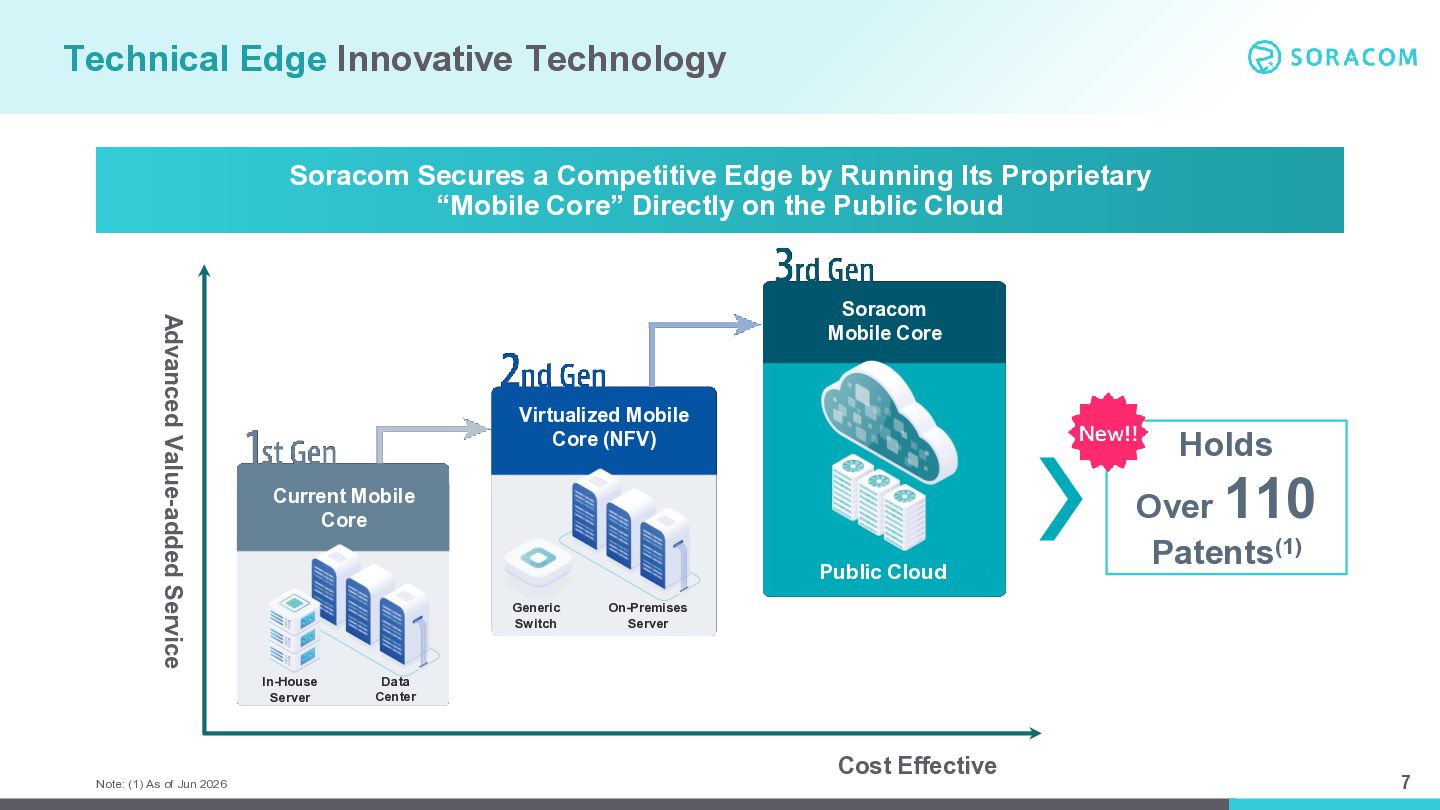
  6. Technical Edge Innovative Technology Soracom Secures a Competitive Edge by

    Running Its Proprietary “Mobile Core” Directly on the Public Cloud Advanced Value-added Service Soracom Mobile Core Virtualized Mobile Core (NFV) 110 Current Mobile Core Public Cloud Generic Switch In-House Server Note: (1) As of Jun 2026 Holds Over Patents(1) On-Premises Server Data Center Cost Effective 7
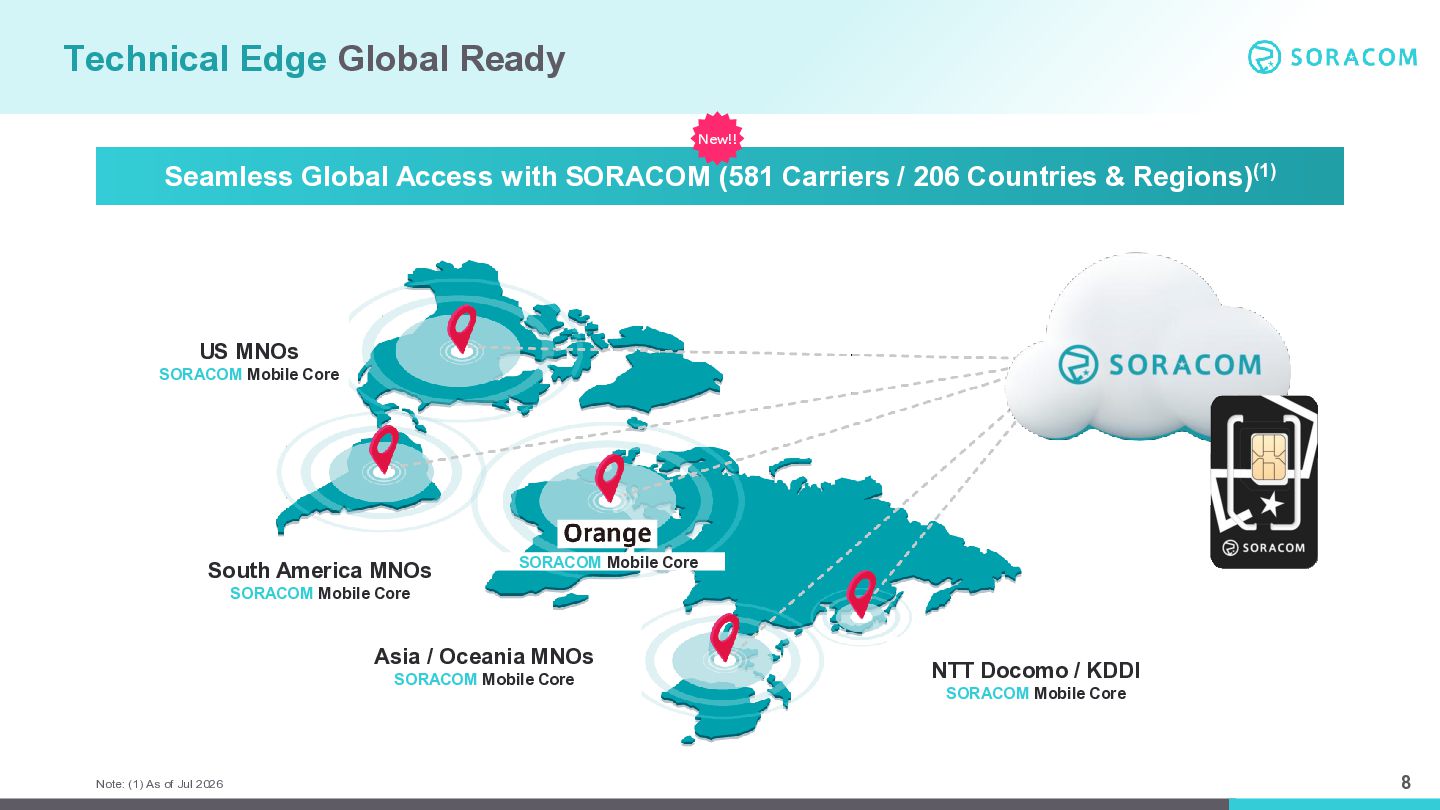
  7. Technical Edge Global Ready Seamless Global Access with SORACOM (581

    Carriers / 206 Countries & Regions)(1) US MNOs SORACOM MobileCore US MNOs SORACOM Mobile Core South America MNOs SORACOM Mobile Core SORACOM Mobile Core Asia / Oceania MNOs SORACOM Mobile Core Note: (1) As of Jul 2026 NTT Docomo / KDDI SORACOM Mobile Core 8
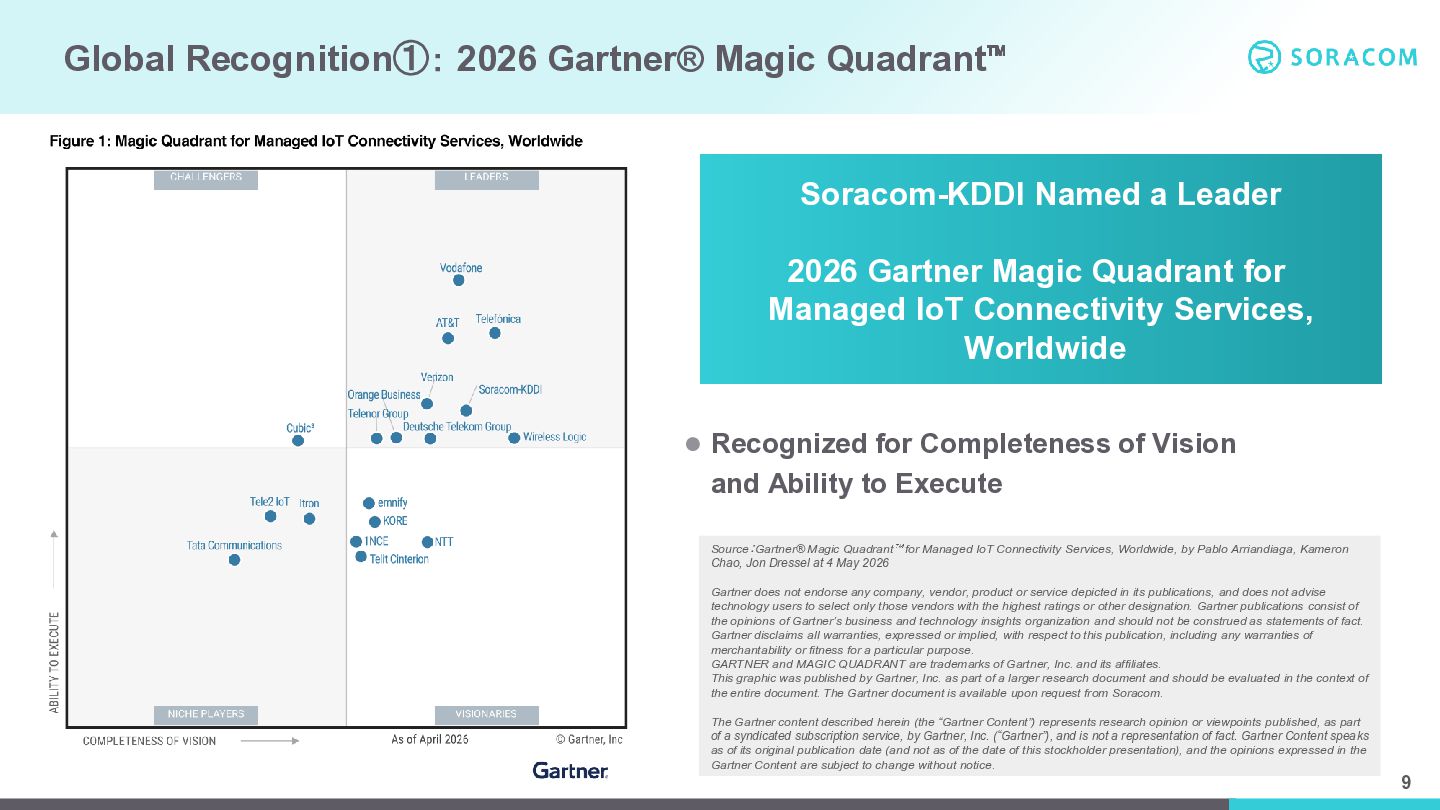
  8. Global Recognition①: 2026 Gartner® Magic Quadrant Soracom-KDDI Named a Leader

    2026 Gartner Magic Quadrant for Managed IoT Connectivity Services, Worldwide ⚫ Recognized for Completeness of Vision and Ability to Execute Source:Gartner® Magic Quadrant for Managed IoT Connectivity Services, Worldwide, by Pablo Arriandiaga, Kameron Chao, Jon Dressel at 4 May 2026 Gartner does not endorse any company, vendor, product or service depicted in its publications, and does not advise technology users to select only those vendors with the highest ratings or other designation. Gartner publications consist of the opinions of Gartner’s business and technology insights organization and should not be construed as statements of fact. Gartner disclaims all warranties, expressed or implied, with respect to this publication, including any warranties of merchantability or fitness for a particular purpose. GARTNER and MAGIC QUADRANT are trademarks of Gartner, Inc. and its affiliates. This graphic was published by Gartner, Inc. as part of a larger research document and should be evaluated in the context of the entire document. The Gartner document is available upon request from Soracom. The Gartner content described herein (the “Gartner Content”) represents research opinion or viewpoints published, as part of a syndicated subscription service, by Gartner, Inc. (“Gartner”), and is not a representation of fact. Gartner Content speaks as of its original publication date (and not as of the date of this stockholder presentation), and the opinions expressed in the Gartner Content are subject to change without notice. 9
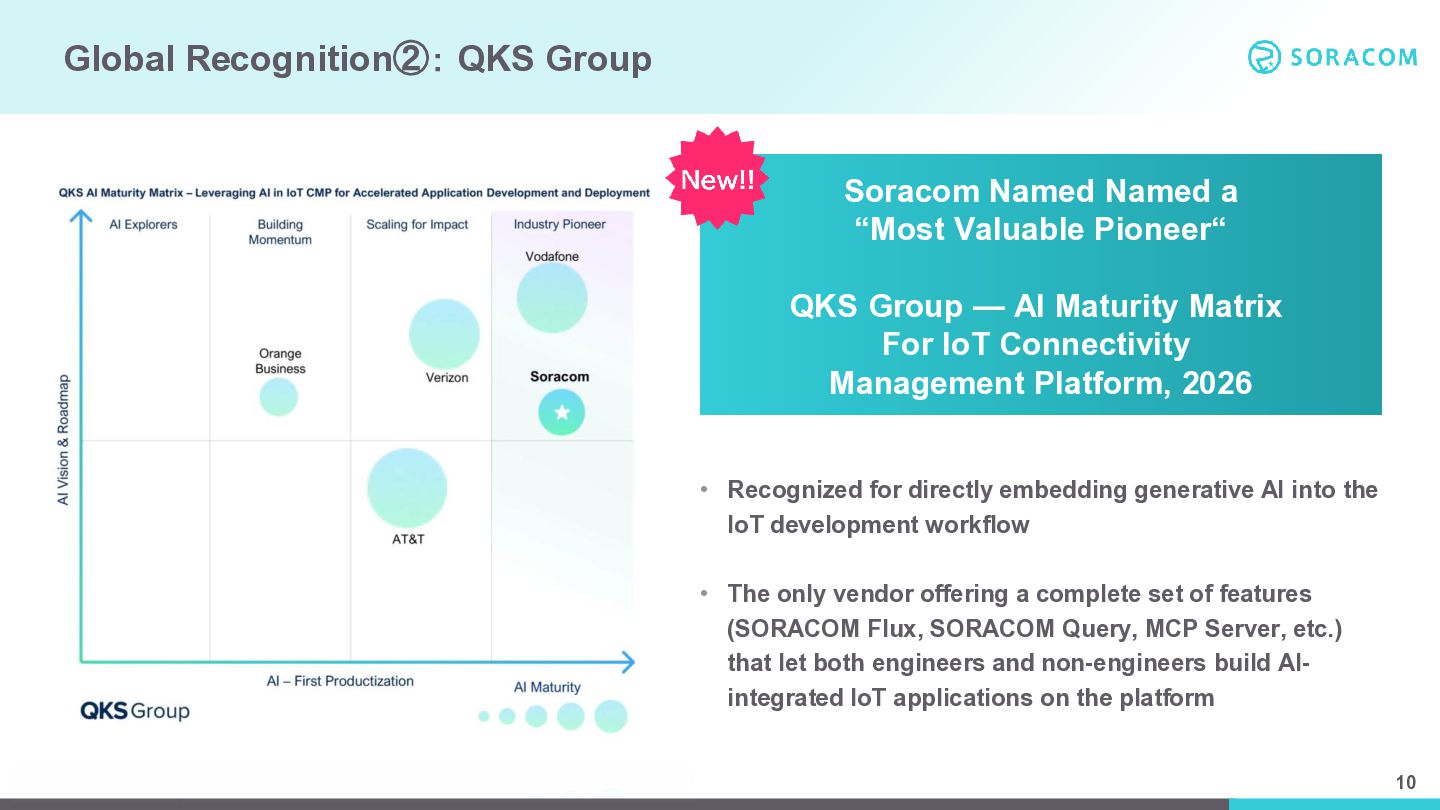
  9. Global Recognition②: QKS Group Soracom Named Named a “Most Valuable

    Pioneer“ QKS Group — AI Maturity Matrix For IoT Connectivity Management Platform, 2026 • Recognized for directly embedding generative AI into the IoT development workflow • The only vendor offering a complete set of features (SORACOM Flux, SORACOM Query, MCP Server, etc.) that let both engineers and non-engineers build AIintegrated IoT applications on the platform 10
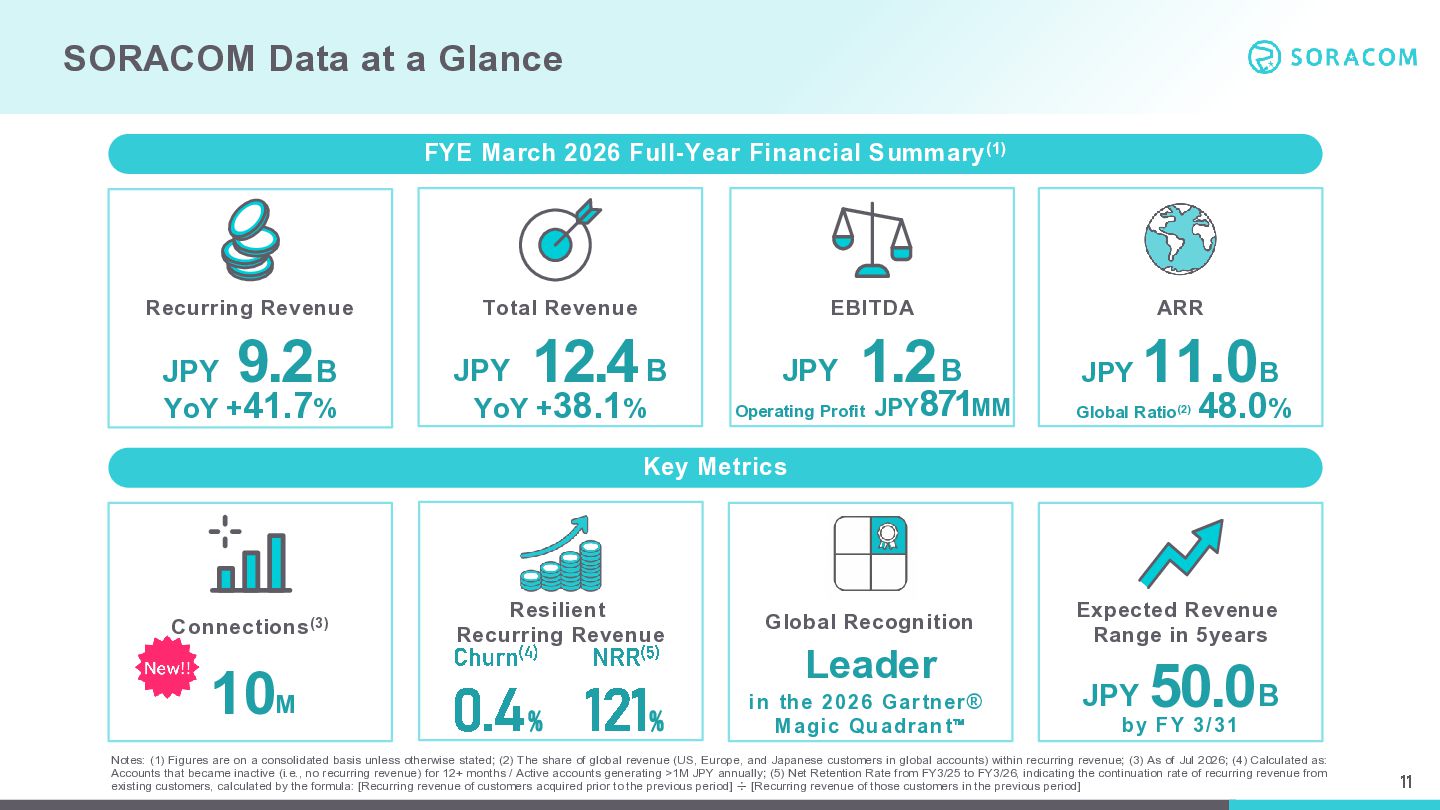
  10. SORACOM Data at a Glance FYE March 2026 Full-Year Financial

    Summary (1) Recurring Revenue JPY 9.2 B YoY +41.7% Total Revenue JPY EBITDA 12.4 B YoY +38.1% JPY ARR 1.2 B Operating Profit JPY 871MM JPY 11.0B Global Ratio(2) 48.0% Key Metrics Connections (3) 10M Resilient Recurring Revenue Global Recognition 0.4% 121% in the 2026 G artner® M ag ic Q u ad ran t Churn (4) NRR (5) Leader Expected Revenue Range in 5years JPY 50.0B by FY 3/31 Notes: (1) Figures are on a consolidated basis unless otherwise stated; (2) The share of global revenue (US, Europe, and Japanese customers in global accounts) within recurring revenue; (3) As of Jul 2026; (4) Calculated as: Accounts that became inactive (i.e., no recurring revenue) for 12+ months / Active accounts generating >1M JPY annually; (5) Net Retention Rate from FY3/25 to FY3/26, indicating the continuation rate of recurring revenue from existing customers, calculated by the formula: [Recurring revenue of customers acquired prior to the previous period] ÷ [Recurring revenue of those customers in the previous period] 11
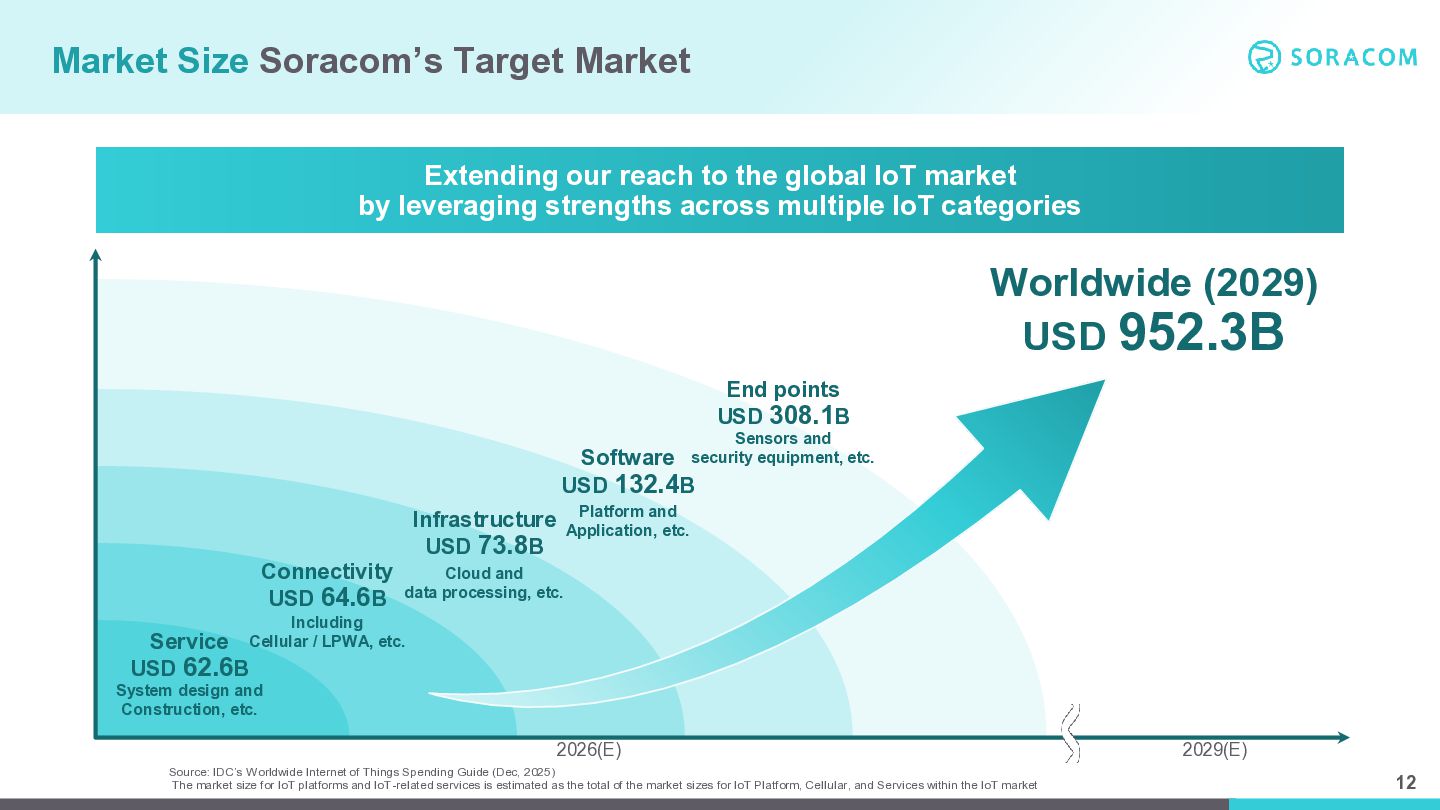
  11. Market Size Soracom’s Target Market Extending our reach to the

    global IoT market by leveraging strengths across multiple IoT categories Worldwide (2029) USD 952.3B End points USD 308.1B Sensors and Software security equipment, etc. USD 132.4B Platform and Infrastructure Application, etc. USD 73.8B Cloud and Connectivity USD 64.6B data processing, etc. Including Service Cellular / LPWA, etc. USD 62.6B System design and Construction, etc. 2026(E) Source: IDC’s Worldwide Internet of Things Spending Guide (Dec, 2025) The market size for IoT platforms and IoT-related services is estimated as the total of the market sizes for IoT Platform, Cellular, and Services within the IoT market 2029(E) 12
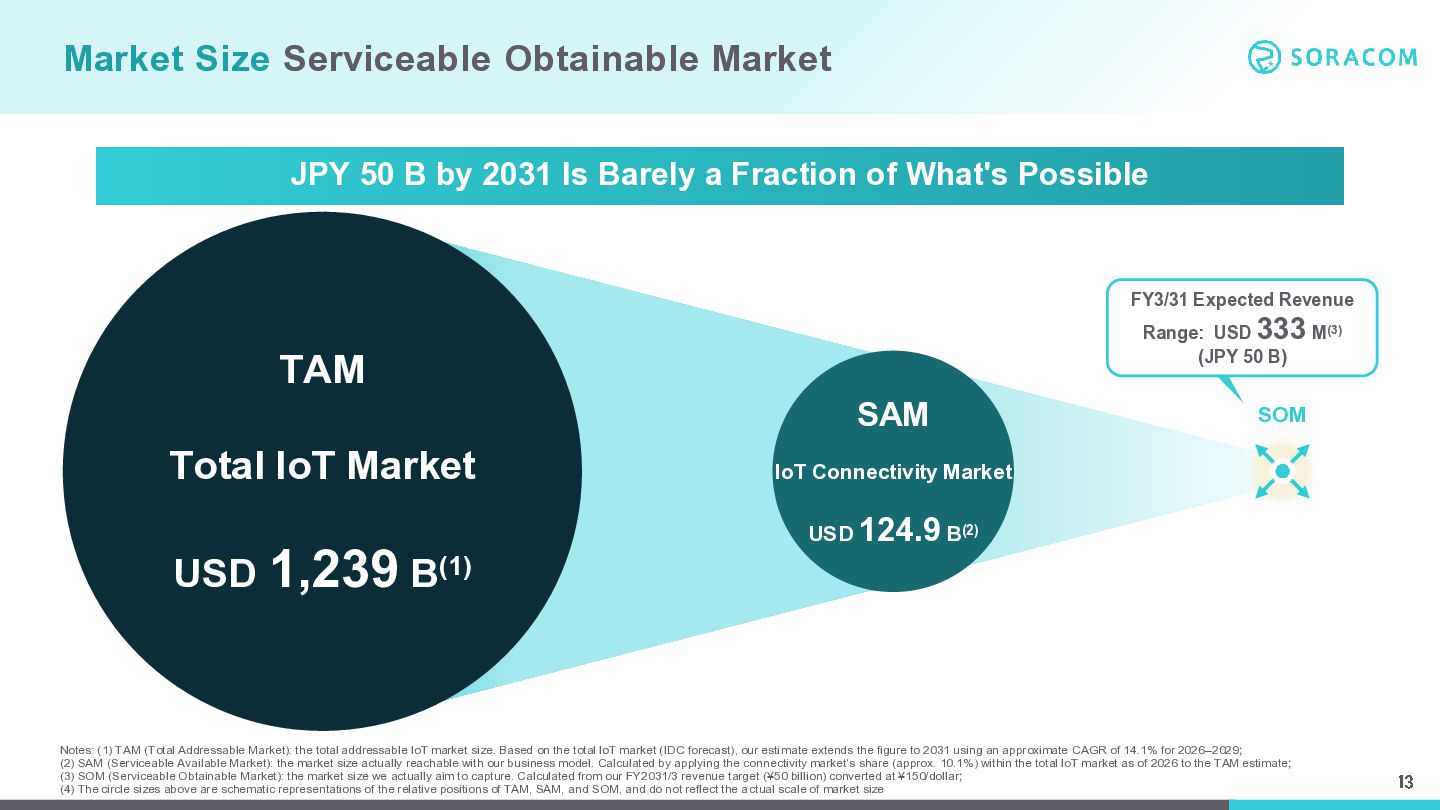
  12. Market Size Serviceable Obtainable Market JPY 50 B by 2031

    Is Barely a Fraction of What's Possible FY3/31 Expected Revenue 333 M(3) Range: USD (JPY 50 B) TAM SAM Total IoT Market USD 1,239 B(1) SOM IoT Connectivity Market USD 124.9 B(2) Notes: (1) TAM (Total Addressable Market): the total addressable IoT market size. Based on the total IoT market (IDC forecast), our estimate extends the figure to 2031 using an approximate CAGR of 14.1% for 2026–2029; (2) SAM (Serviceable Available Market): the market size actually reachable with our business model. Calculated by applying the connectivity market‘s share (approx. 10.1%) within the total IoT market as of 2026 to the TAM estimate; (3) SOM (Serviceable Obtainable Market): the market size we actually aim to capture. Calculated from our FY2031/3 revenue target (¥50 billion) converted at ¥150/dollar; (4) The circle sizes above are schematic representations of the relative positions of TAM, SAM, and SOM, and do not reflect the actual scale of market size 13
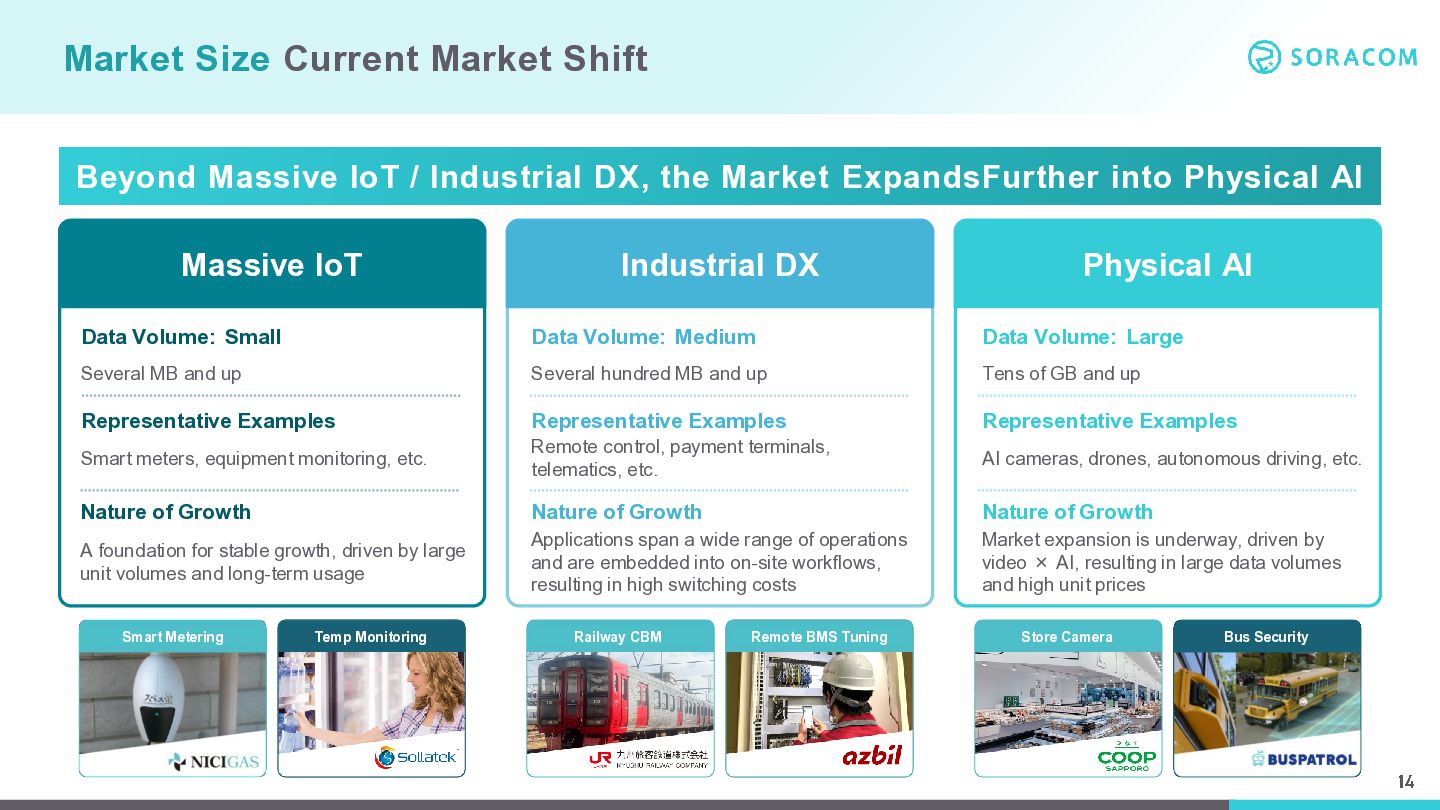
  13. Market Size Current Market Shift Beyond Massive IoT / Industrial

    DX, the Market ExpandsFurther into Physical AI Massive IoT Industrial DX Physical AI Data Volume: Small Data Volume: Medium Data Volume: Large Several MB and up Several hundred MB and up Tens of GB and up Representative Examples Representative Examples Representative Examples Smart meters, equipment monitoring, etc. Remote control, payment terminals, telematics, etc. AI cameras, drones, autonomous driving, etc. Nature of Growth Nature of Growth Nature of Growth A foundation for stable growth, driven by large unit volumes and long-term usage Applications span a wide range of operations and are embedded into on-site workflows, resulting in high switching costs Market expansion is underway, driven by video × AI, resulting in large data volumes and high unit prices Smart Metering Temp Monitoring Railway CBM Remote BMS Tuning Store Camera Bus Security 14
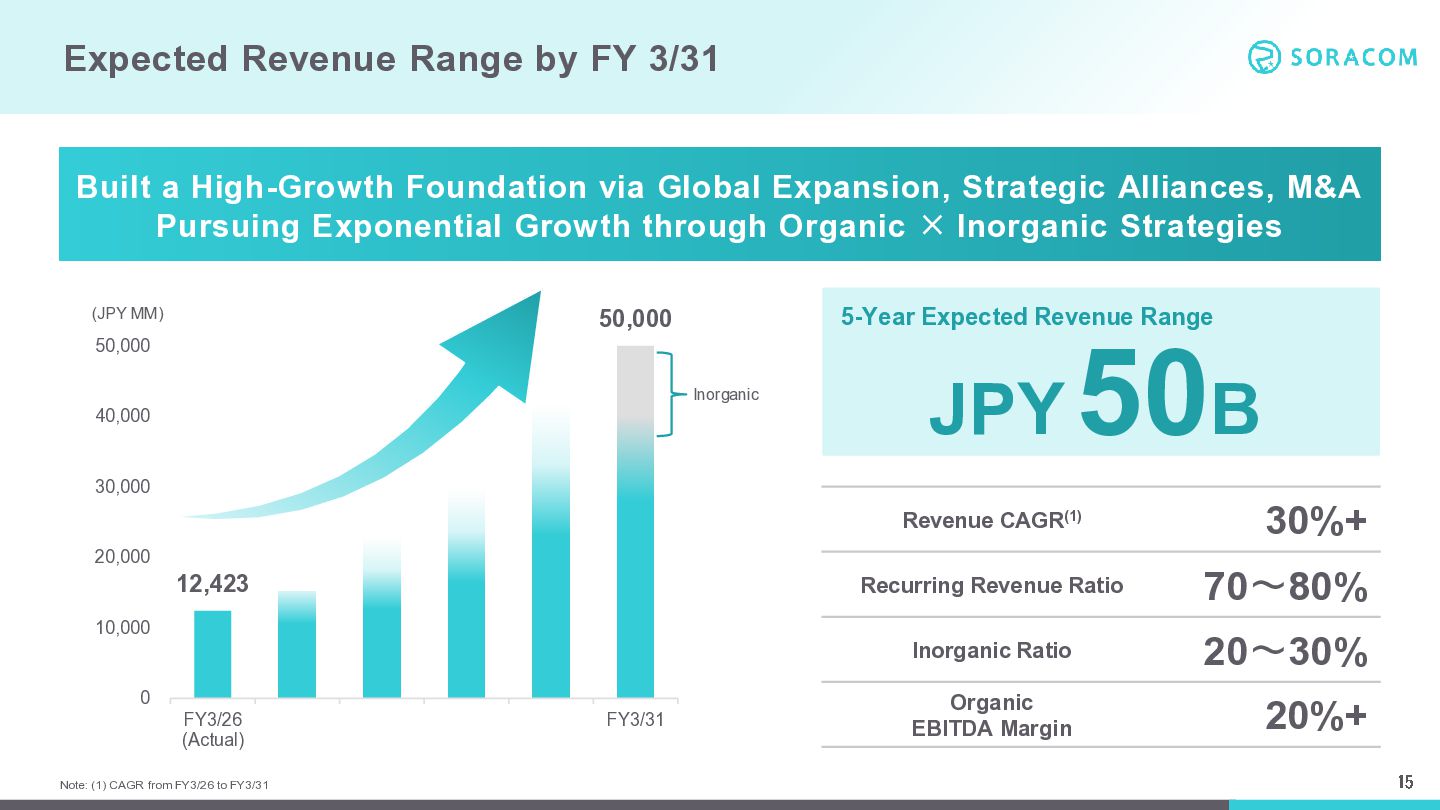
  14. Expected Revenue Range by FY 3/31 Built a High-Growth Foundation

    via Global Expansion, Strategic Alliances, M&A Pursuing Exponential Growth through Organic × Inorganic Strategies (JPY MM) 5-Year Expected Revenue Range 50,000 50,000 Inorganic 40,000 JPY 50B 30,000 Revenue CAGR(1) 20,000 12,423 Recurring Revenue Ratio 70~80% Inorganic Ratio 20~30% Organic EBITDA Margin 20%+ 10,000 0 FY3/26 (Actual) Note: (1) CAGR from FY3/26 to FY3/31 FY3/31 30%+ 15
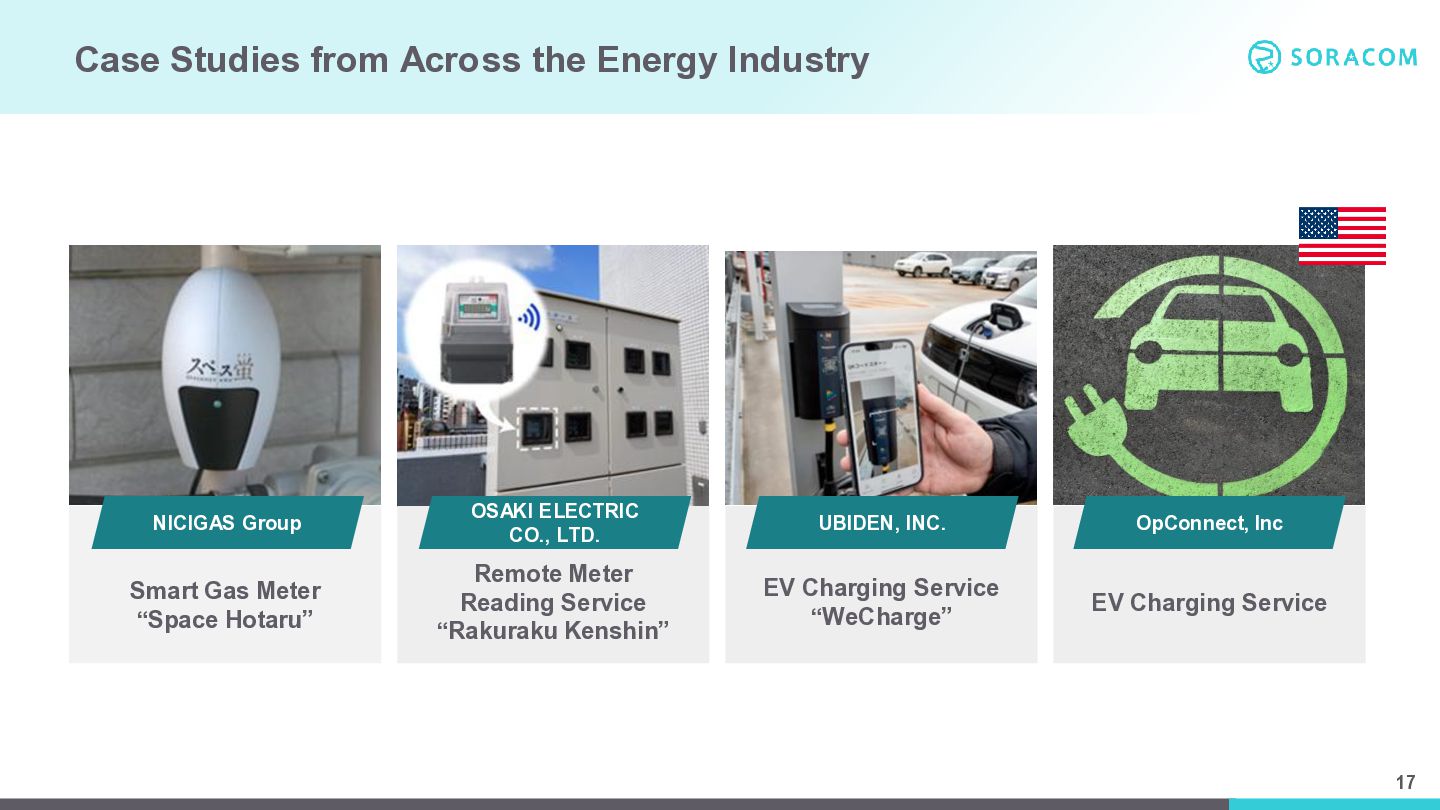
  15. Case Studies from Across the Energy Industry NICIGAS Group OSAKI

    ELECTRIC CO., LTD. UBIDEN, INC. OpConnect, Inc Smart Gas Meter “Space Hotaru” Remote Meter Reading Service “Rakuraku Kenshin” EV Charging Service “WeCharge” EV Charging Service 17
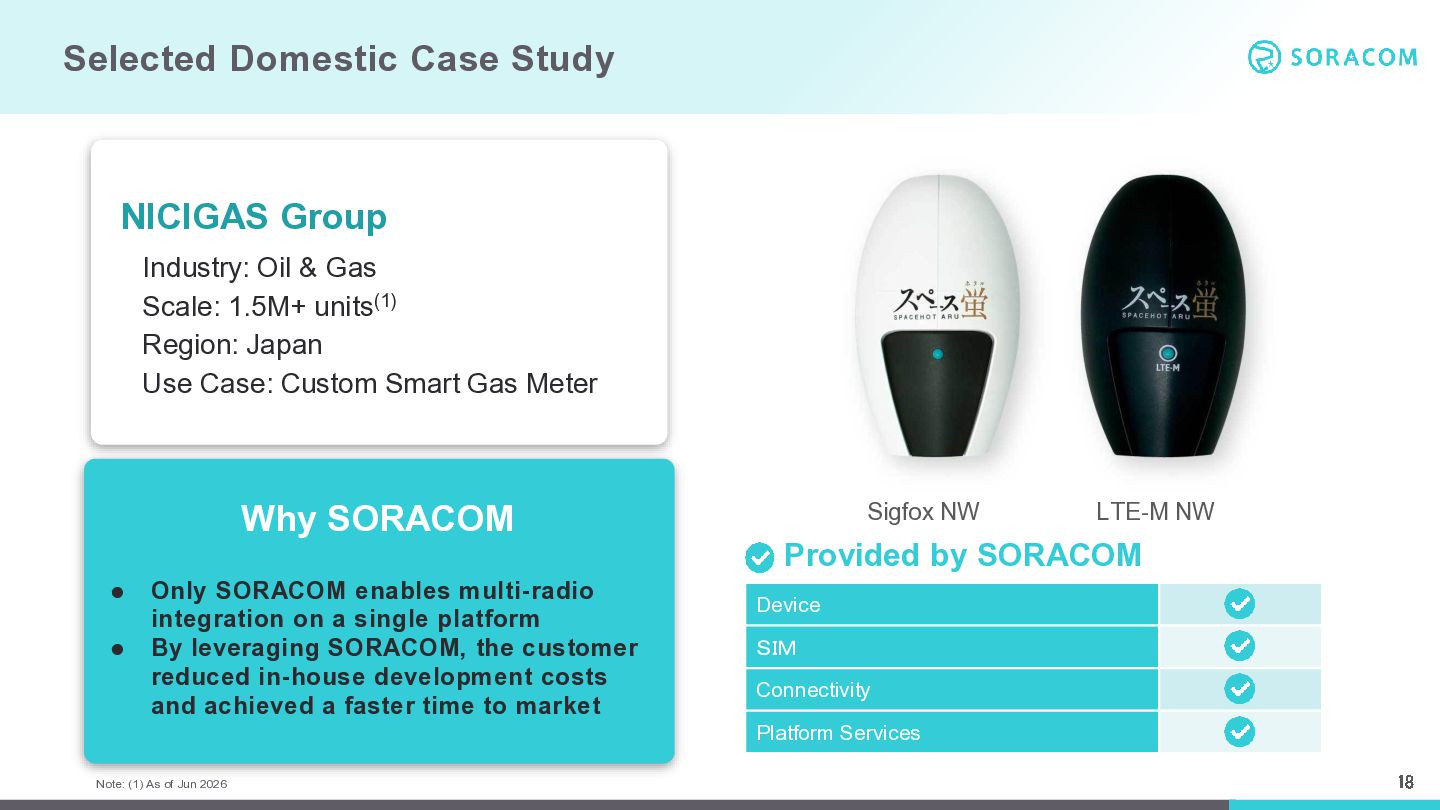
  16. Selected Domestic Case Study NICIGAS Group Industry: Oil & Gas

    Scale: 1.5M+ units(1) Region: Japan Use Case: Custom Smart Gas Meter Why SORACOM ⚫ ⚫ Only SORACOM enables multi-radio integration on a single platform By leveraging SORACOM, the customer reduced in-house development costs and achieved a faster time to market Sigfox NW LTE-M NW Provided by SORACOM Device SIM Connectivity Platform Services Note: (1) As of Jun 2026 18
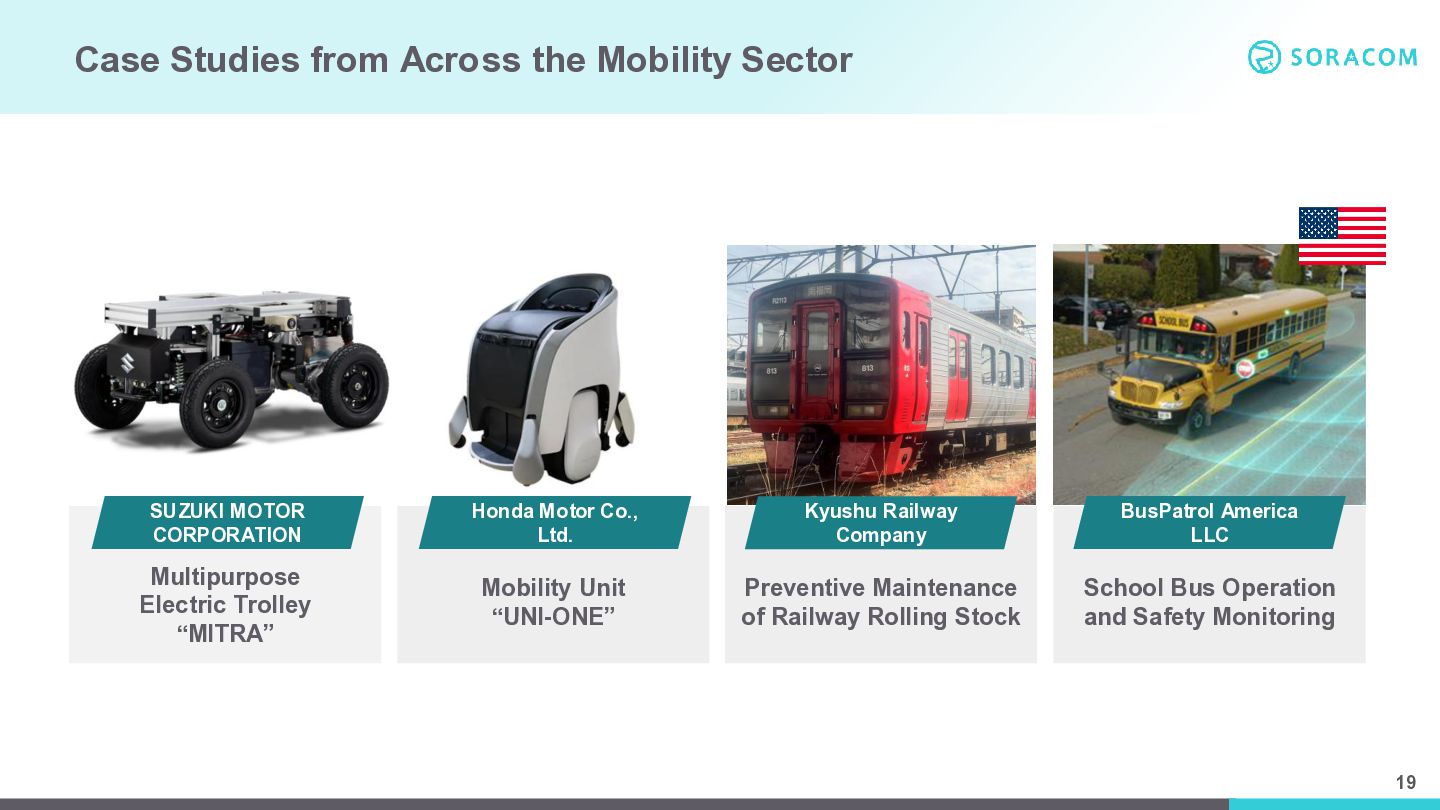
  17. Case Studies from Across the Mobility Sector SUZUKI MOTOR CORPORATION

    Honda Motor Co., Ltd. Kyushu Railway Company BusPatrol America LLC Multipurpose Electric Trolley “MITRA” Mobility Unit “UNI-ONE” Preventive Maintenance of Railway Rolling Stock School Bus Operation and Safety Monitoring 19
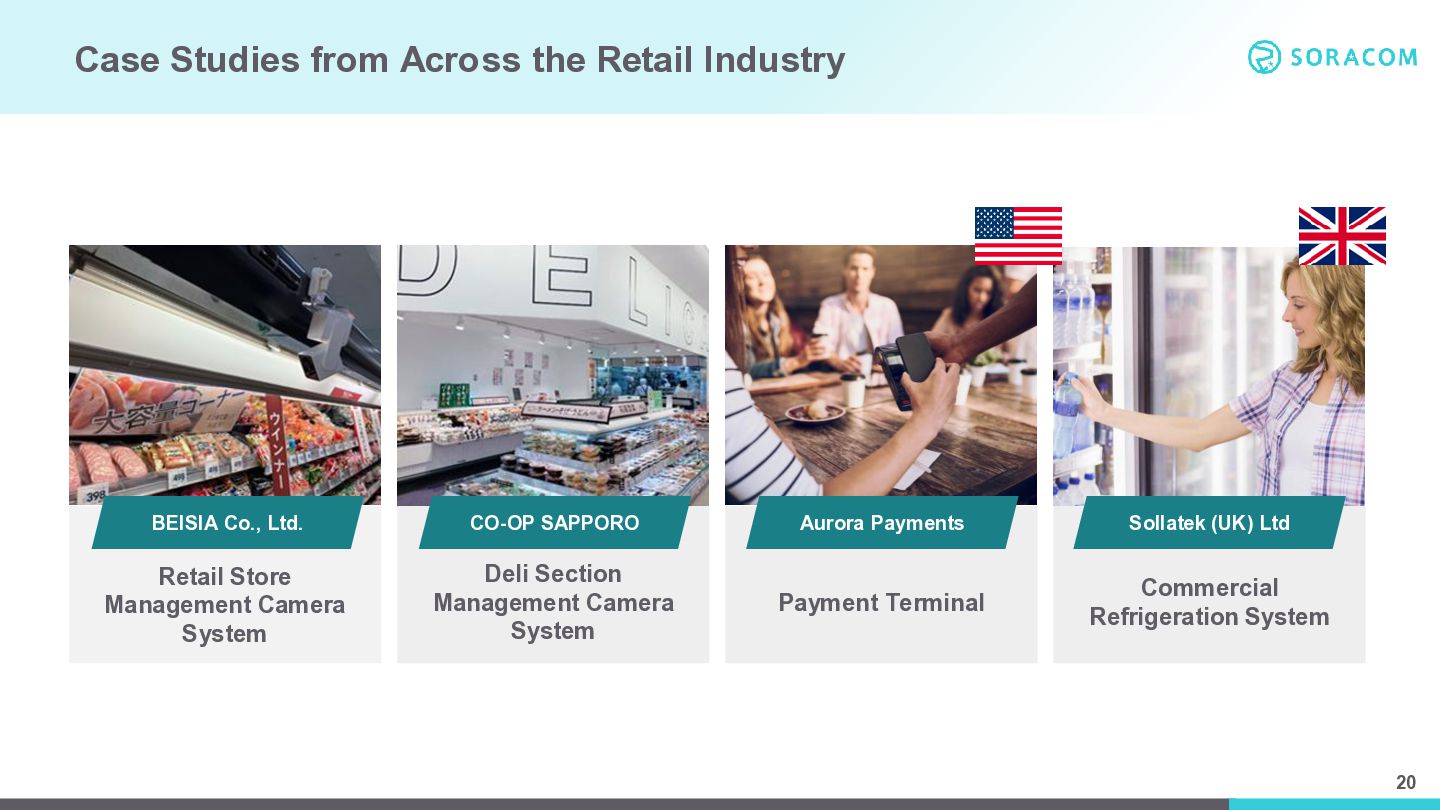
  18. Case Studies from Across the Retail Industry BEISIA Co., Ltd.

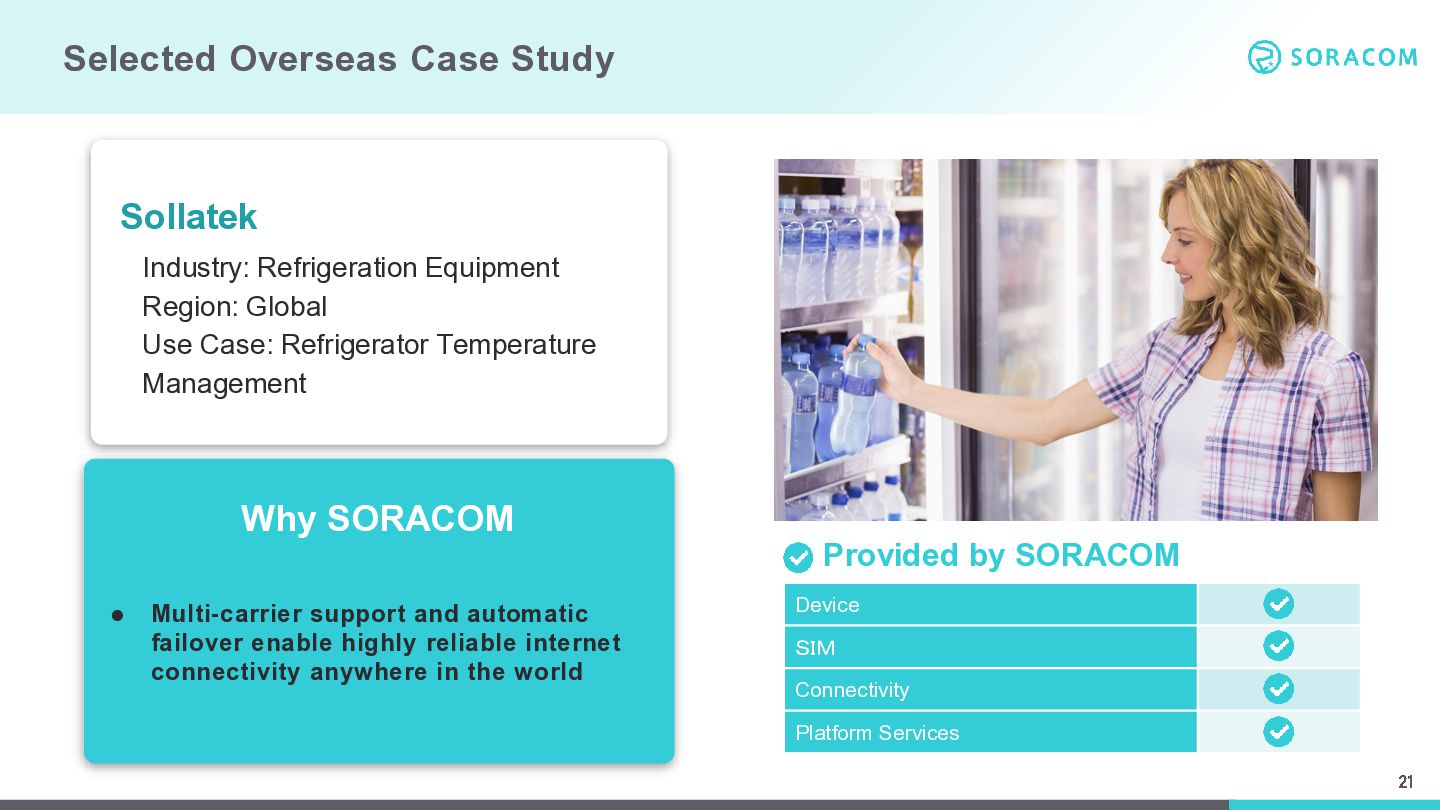
    CO-OP SAPPORO Aurora Payments Sollatek (UK) Ltd Retail Store Management Camera System Deli Section Management Camera System Payment Terminal Commercial Refrigeration System 20
  19. Selected Overseas Case Study Sollatek Industry: Refrigeration Equipment Region: Global

    Use Case: Refrigerator Temperature Management Why SORACOM ⚫ Multi-carrier support and automatic failover enable highly reliable internet connectivity anywhere in the world Provided by SORACOM Device SIM Connectivity Platform Services 21
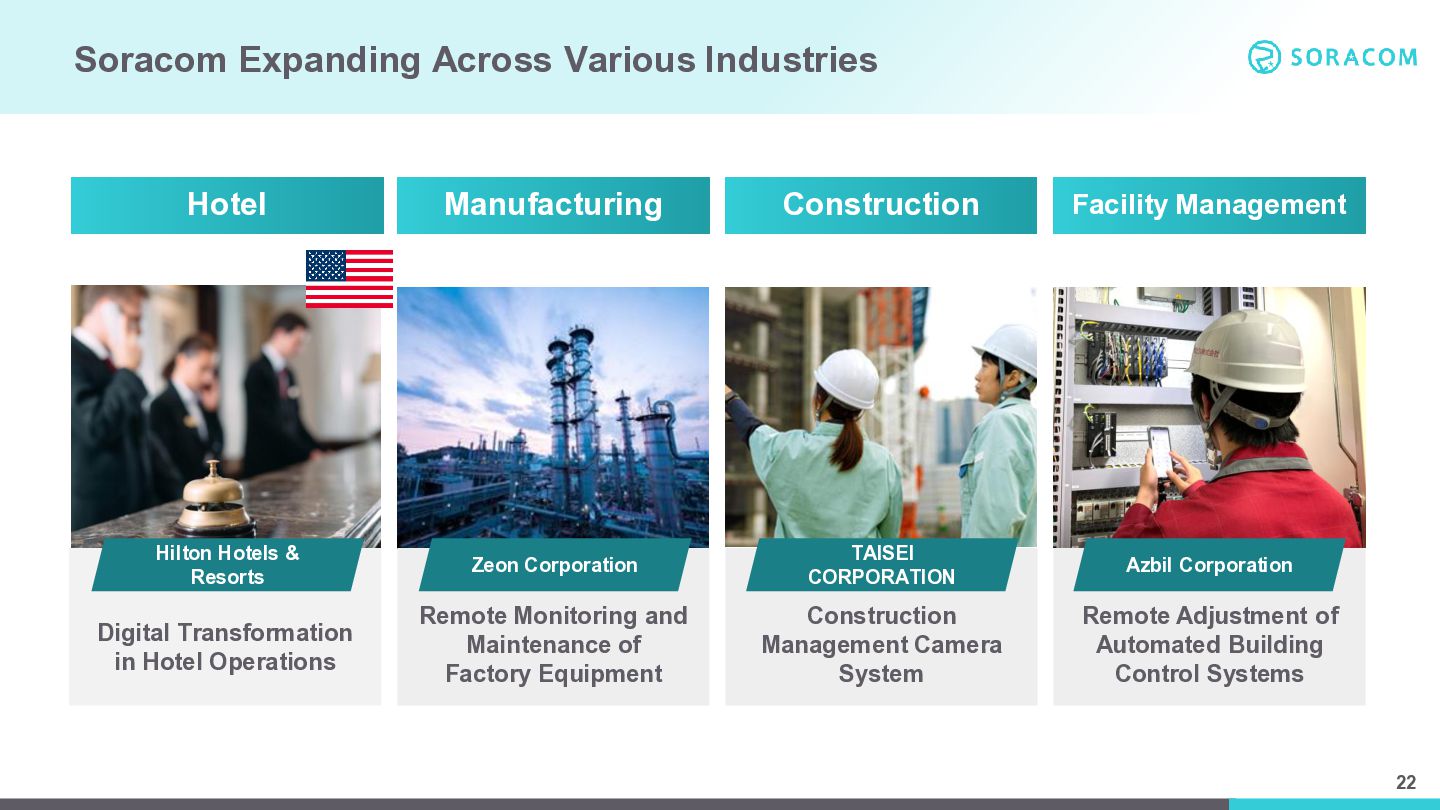
  20. Soracom Expanding Across Various Industries Hotel Manufacturing Construction Facility Management

    Hilton Hotels & Resorts Zeon Corporation TAISEI CORPORATION Azbil Corporation Digital Transformation in Hotel Operations Remote Monitoring and Maintenance of Factory Equipment Construction Management Camera System Remote Adjustment of Automated Building Control Systems 22
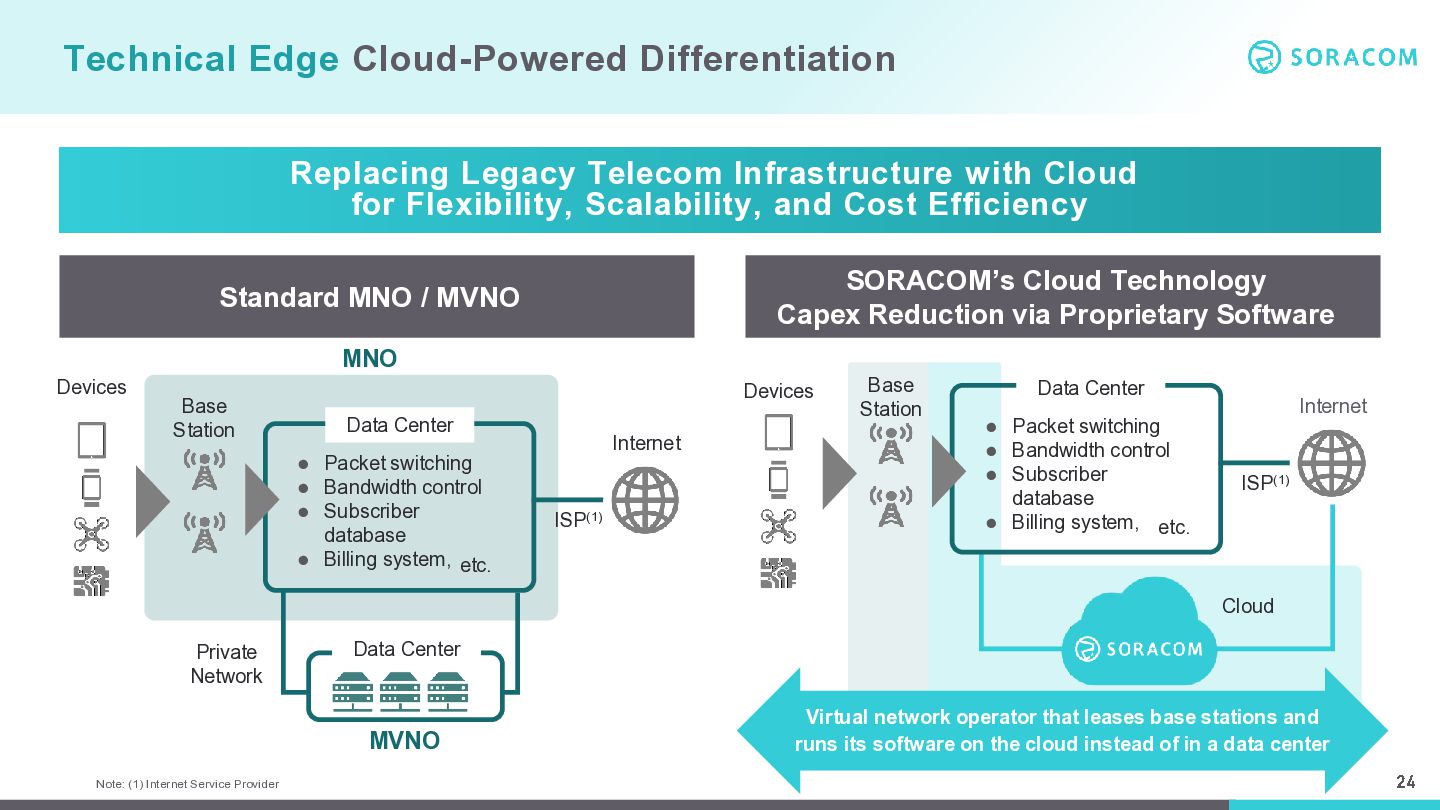
  21. Technical Edge Cloud-Powered Differentiation Replacing Legacy Telecom Infrastructure with Cloud

    for Flexibility, Scalability, and Cost Efficiency SORACOM’s Cloud Technology Capex Reduction via Proprietary Software Standard MNO / MVNO MNO Devices Devices Base Station Data Center Packet switching Bandwidth control Subscriber database ⚫ Billing system, etc. ⚫ ⚫ ⚫ Internet ISP(1) Base Station Data Center Packet switching Bandwidth control Subscriber database ⚫ Billing system, etc. ⚫ ⚫ ⚫ Internet ISP(1) Cloud Private Network Data Center MVNO Note: (1) Internet Service Provider Virtual network operator that leases base stations and runs its software on the cloud instead of in a data center 24
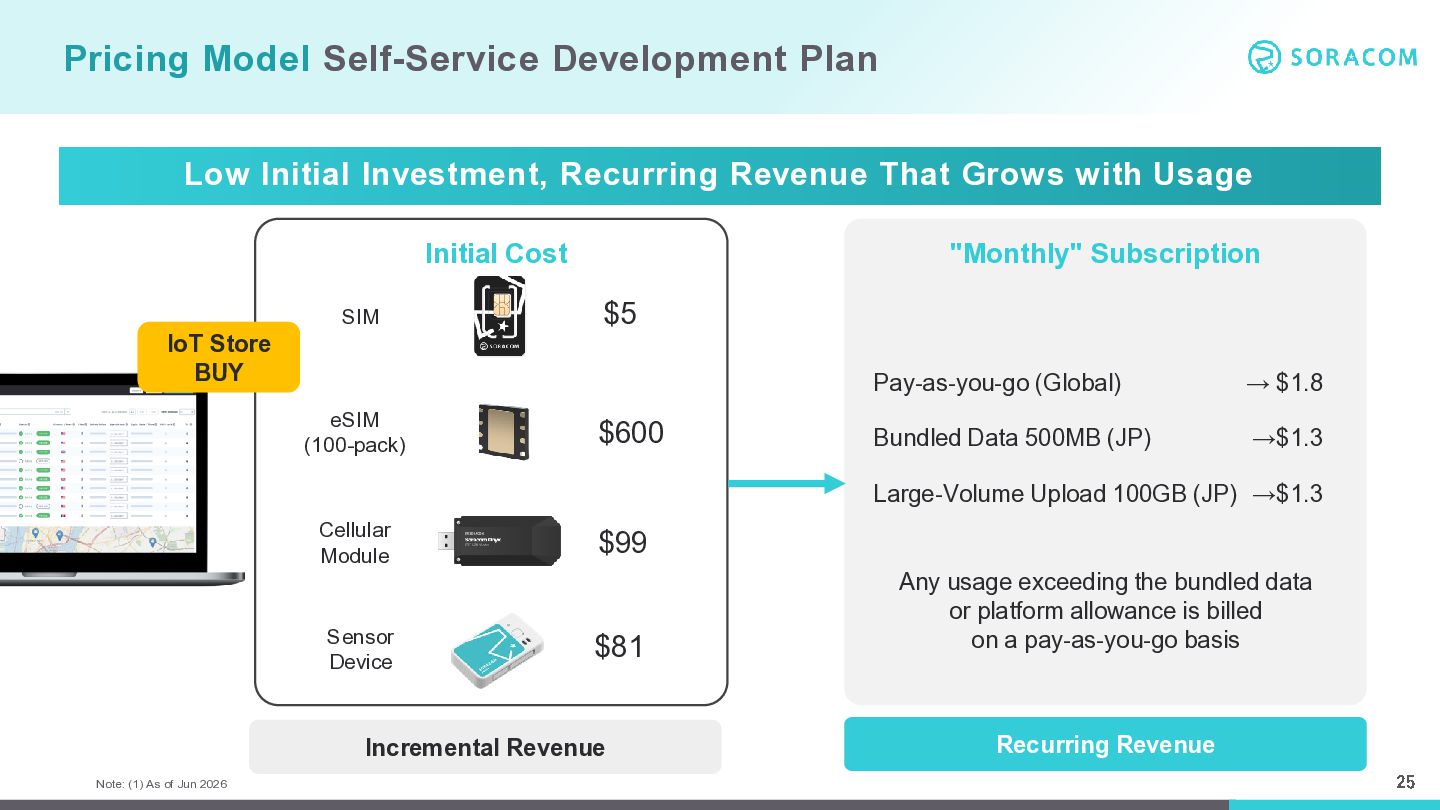
  22. Pricing Model Self-Service Development Plan Low Initial Investment, Recurring Revenue

    That Grows with Usage Initial Cost SIM "Monthly" Subscription $5 IoT Store BUY eSIM (100-pack) $600 Pay-as-you-go (Global) → $1.8 Bundled Data 500MB (JP) →$1.3 Large-Volume Upload 100GB (JP) →$1.3 Cellular Module Sensor Device $99 $81 Incremental Revenue Note: (1) As of Jun 2026 Any usage exceeding the bundled data or platform allowance is billed on a pay-as-you-go basis Recurring Revenue 25
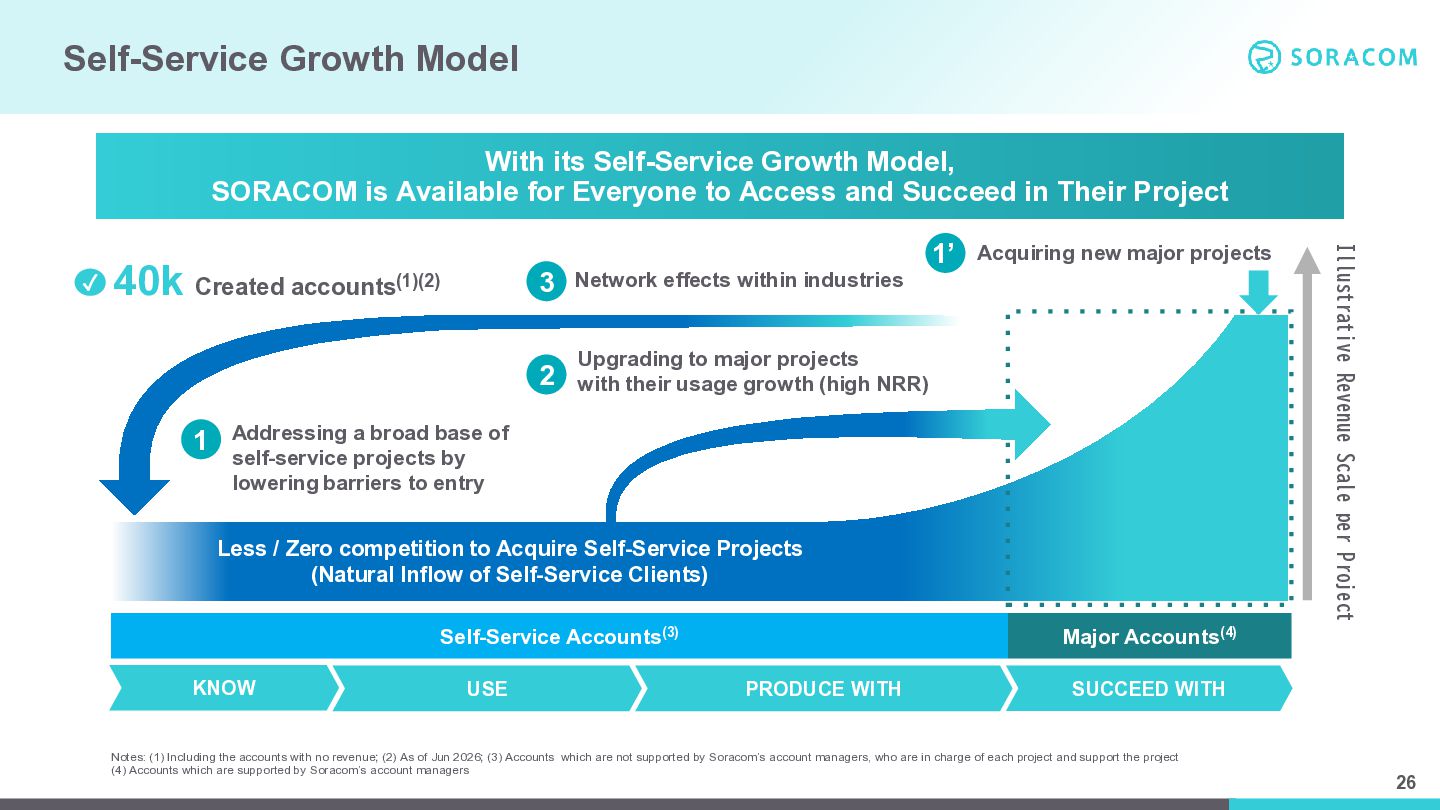
  23. Self-Service Growth Model With its Self-Service Growth Model, SORACOM is

    Available for Everyone to Access and Succeed in Their Project 40k 1 3 Network effects within industries 2 Upgrading to major projects with their usage growth (high NRR) 1’ Acquiring new major projects Addressing a broad base of self-service projects by lowering barriers to entry Less / Zero competition to Acquire Self-Service Projects (Natural Inflow of Self-Service Clients) Self-Service Accounts(3) KNOW USE Illustrative Revenue Scale per Project ✓ Created accounts(1)(2) Major Accounts(4) PRODUCE WITH SUCCEED WITH Notes: (1) Including the accounts with no revenue; (2) As of Jun 2026; (3) Accounts which are not supported by Soracom’s account managers, who are in charge of each project and support the project (4) Accounts which are supported by Soracom’s account managers 26
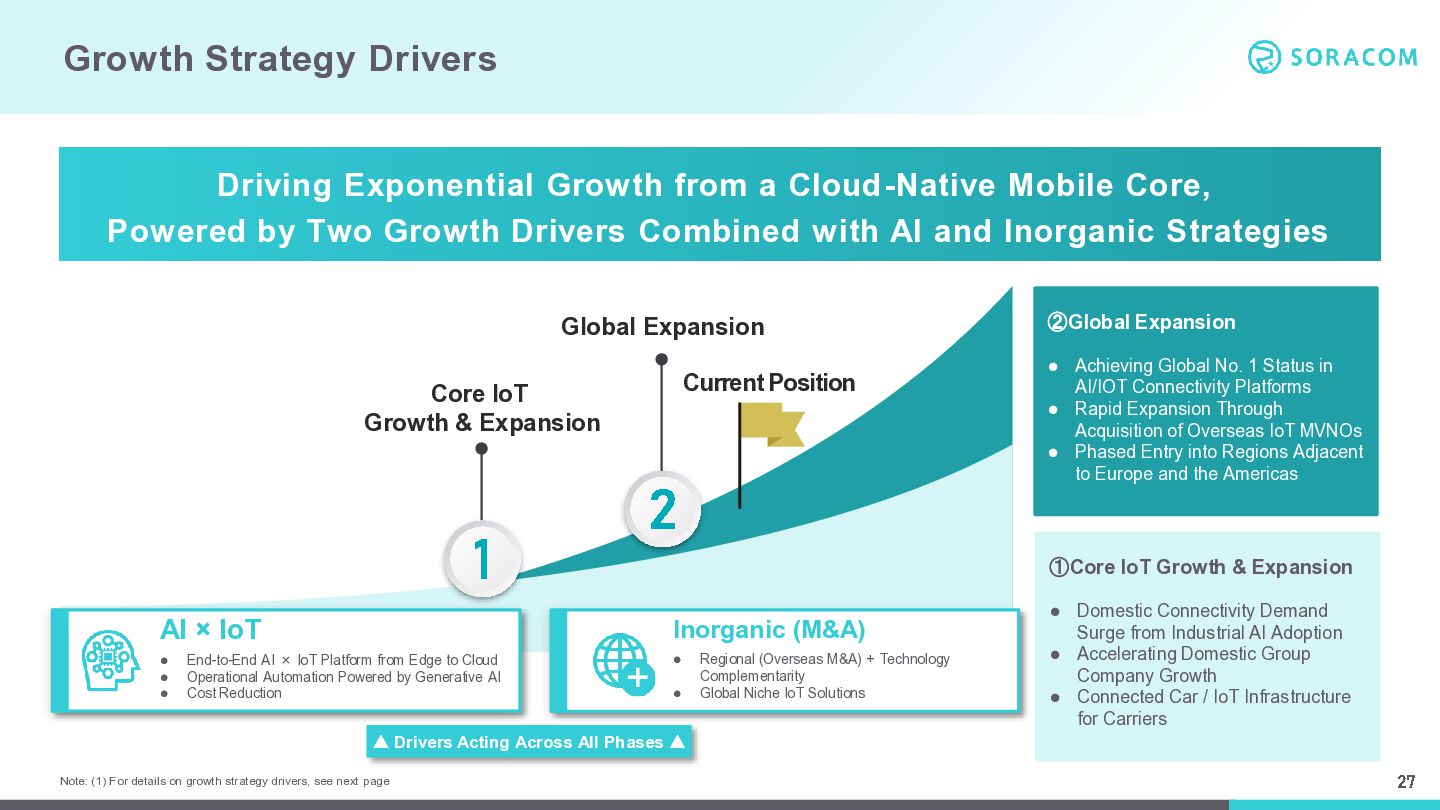
  24. Growth Strategy Drivers Driving Exponential Growth from a Cloud-Native Mobile

    Core, Powered by Two Growth Drivers Combined with AI and Inorganic Strategies Global Expansion Current Position Core IoT Growth & Expansion 1 ①Core IoT Growth & Expansion Inorganic (M&A) End-to-End AI × IoT Platform from Edge to Cloud Operational Automation Powered by Generative AI Cost Reduction Achieving Global No. 1 Status in AI/IOT Connectivity Platforms ⚫ Rapid Expansion Through Acquisition of Overseas IoT MVNOs ⚫ Phased Entry into Regions Adjacent to Europe and the Americas ⚫ 2 AI × IoT ⚫ ⚫ ⚫ ②Global Expansion + ⚫ ⚫ Regional (Overseas M&A) + Technology Complementarity Global Niche IoT Solutions Domestic Connectivity Demand Surge from Industrial AI Adoption ⚫ Accelerating Domestic Group Company Growth ⚫ Connected Car / IoT Infrastructure for Carriers ⚫ ▲ Drivers Acting Across All Phases ▲ Note: (1) For details on growth strategy drivers, see next page 27
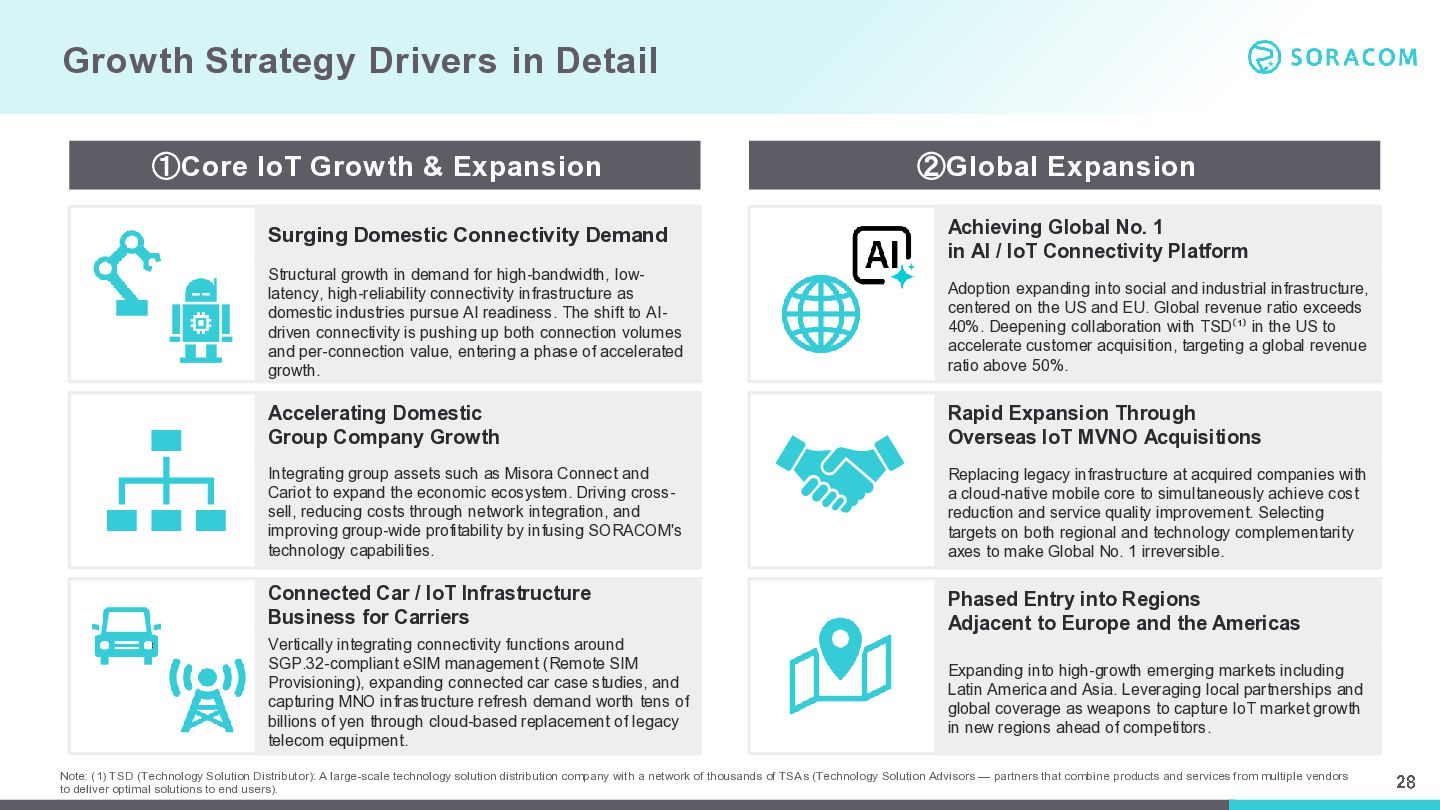
  25. Growth Strategy Drivers in Detail ①Core IoT Growth & Expansion

    ②Global Expansion Surging Domestic Connectivity Demand Achieving Global No. 1 in AI / IoT Connectivity Platform Structural growth in demand for high-bandwidth, lowlatency, high-reliability connectivity infrastructure as domestic industries pursue AI readiness. The shift to AIdriven connectivity is pushing up both connection volumes and per-connection value, entering a phase of accelerated growth. Adoption expanding into social and industrial infrastructure, centered on the US and EU. Global revenue ratio exceeds 40%. Deepening collaboration with TSD⁽¹⁾ in the US to accelerate customer acquisition, targeting a global revenue ratio above 50%. Accelerating Domestic Group Company Growth Rapid Expansion Through Overseas IoT MVNO Acquisitions Integrating group assets such as Misora Connect and Cariot to expand the economic ecosystem. Driving crosssell, reducing costs through network integration, and improving group-wide profitability by infusing SORACOM's technology capabilities. Replacing legacy infrastructure at acquired companies with a cloud-native mobile core to simultaneously achieve cost reduction and service quality improvement. Selecting targets on both regional and technology complementarity axes to make Global No. 1 irreversible. Connected Car / IoT Infrastructure Business for Carriers Phased Entry into Regions Adjacent to Europe and the Americas Vertically integrating connectivity functions around SGP.32-compliant eSIM management (Remote SIM Provisioning), expanding connected car case studies, and capturing MNO infrastructure refresh demand worth tens of billions of yen through cloud-based replacement of legacy telecom equipment. Expanding into high-growth emerging markets including Latin America and Asia. Leveraging local partnerships and global coverage as weapons to capture IoT market growth in new regions ahead of competitors. Note: (1) TSD (Technology Solution Distributor): A large-scale technology solution distribution company with a network of thousands of TSAs (Technology Solution Advisors — partners that combine products and services from multiple vendors to deliver optimal solutions to end users). 28
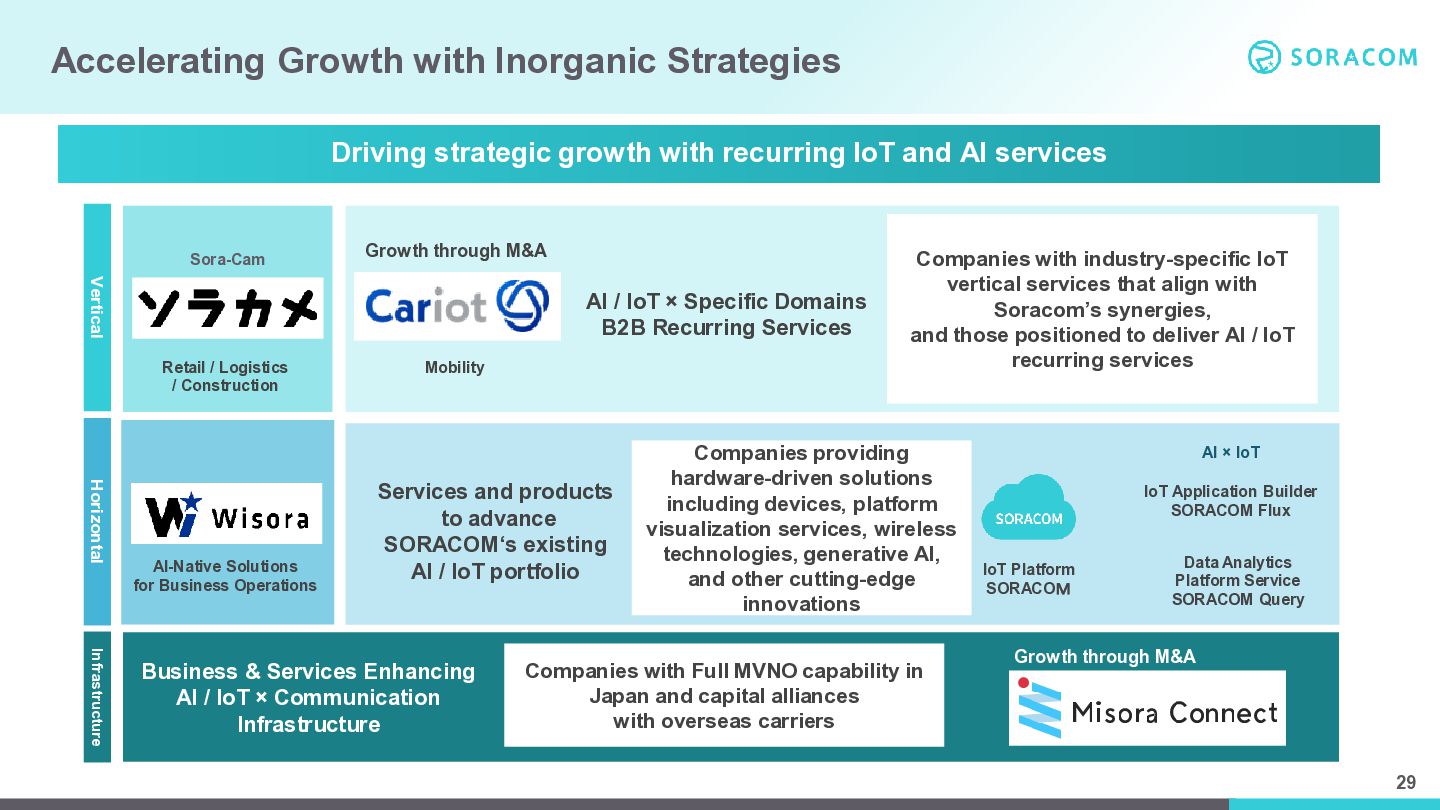
  26. Accelerating Growth with Inorganic Strategies Driving strategic growth with recurring

    IoT and AI services Sora-Cam Growth through M&A Vertical AI / IoT × Specific Domains B2B Recurring Services Retail / Logistics / Construction Horizontal AI-Native Solutions for Business Operations Mobility Services and products to advance SORACOM‘s existing AI / IoT portfolio Infrastructure Business & Services Enhancing AI / IoT × Communication Infrastructure Companies with industry-specific IoT vertical services that align with Soracom’s synergies, and those positioned to deliver AI / IoT recurring services Companies providing hardware-driven solutions including devices, platform visualization services, wireless technologies, generative AI, and other cutting-edge innovations Companies with Full MVNO capability in Japan and capital alliances with overseas carriers AI × IoT IoT Application Builder SORACOM Flux IoT Platform SORACOM Data Analytics Platform Service SORACOM Query Growth through M&A 29
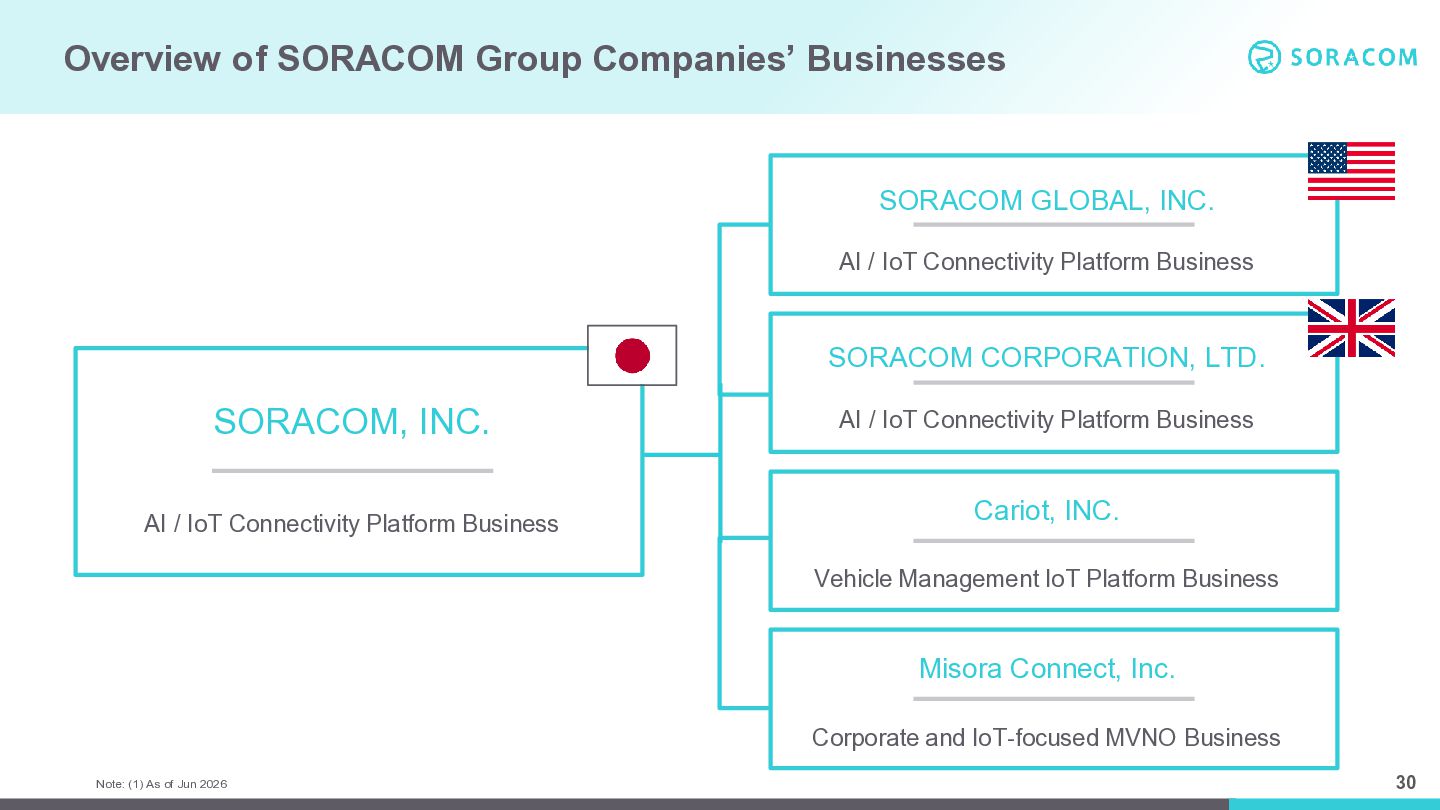
  27. Overview of SORACOM Group Companies’ Businesses SORACOM GLOBAL, INC. AI

    / IoT Connectivity Platform Business SORACOM CORPORATION, LTD. SORACOM, INC. AI / IoT Connectivity Platform Business AI / IoT Connectivity Platform Business Cariot, INC. Vehicle Management IoT Platform Business Misora Connect, Inc. Corporate and IoT-focused MVNO Business Note: (1) As of Jun 2026 30
  28. Legal Disclaimer This document has been prepared by SORACOM, INC.

    (the “Company”) solely for the informational purposes of explaining company information and does not constitute a solicitation of purchase or sale of securities in any jurisdiction including Japan, the United States, or any other jurisdiction. The offer or sale of its securities in Japan, the United States, or any other area cannot be conducted without registration or notification based on applicable laws or exemptions derived therefrom. In preparing this document, the Company has relied on the truthfulness, accuracy, and completeness of the information available to it at the time of its preparation. The information contained in this document may be subject to change without prior notice. This document and its contents cannot be disclosed to or used by any third party for any purpose without the prior written consent of the Company. Descriptions contained in this document regarding future business activities or performance are forward-looking statements. Forward-looking statements include expressions such as "aim," "predict," "assume," "believe," "sustain," "attempt," "estimate," "anticipate," "initiative," "intend," "plan," "potentially," "likelihood," "scheme," "intention," "risk," "pursue," "supposed to," "endeavor," "aspire," "intend to," "planned," or other similar expressions describing future business activities, performance, events, or situations. Forward-looking statements are based on the judgment of the Company's management at the time of preparation of this document, taking into account information available at that time, and these statements contain various risks and uncertainties. Therefore, these forward-looking statements may be influenced by various risks and uncertainties, and actual future business activities or performance may differ from the expectations explicitly or implicitly expressed in the forward-looking statements. Information related to companies or parties other than the Company or information created by them is generally based on publicly available information and other information cited in this document, and the Company has not independently verified the accuracy and appropriateness of such information, nor does it provide any guarantees regarding such information. This English translation is provided for convenience only. In the event of any discrepancy between the Japanese original and this English translation, the Japanese version shall prevail. Contact Information IR manager Email:[email protected] Website:https://soracom.com/en/ir 31