Upgrade to Pro — share decks privately, control downloads, hide ads and more …

DATA ANALYSIS

DATA ANALYSIS

Data analysis is the process of collecting, organizing, cleaning, and interpreting data to identify meaningful patterns, trends, and insights. It helps businesses make informed decisions, improve operational efficiency, solve problems, and achieve organizational goals. Various tools, including Microsoft Excel, SQL, Python, and Power BI, are used to analyze data and present findings through charts, tables, and reports. Data analysis supports performance monitoring, forecasting, cost reduction, and identifying improvement opportunities. By transforming raw data into useful information, organizations can understand business performance, recognize risks, measure results, and develop effective strategies for continuous improvement and better decision-making.

Avatar for Subhasheni

Subhasheni

October 17, 2026

More Decks by Subhasheni

Other Decks in Education

Transcript

  1. Data Analysis Turning Data into Actionable Insights By Ms.SUBHASHENI A

    Assistant Professor Department of Computer Science Sri Ramakrishna College of Arts & Science
  2. Introduction Data analysis is the process of collecting, organizing, and

    interpreting information to support informed decision-making. This presentation provides an overview of the analysis process, key findings, and recommendations.
  3. Data Overview Data Source Data Scope Data Type Identify where

    the data was collected. Define the time period and coverage. Summarize the information being analyzed.
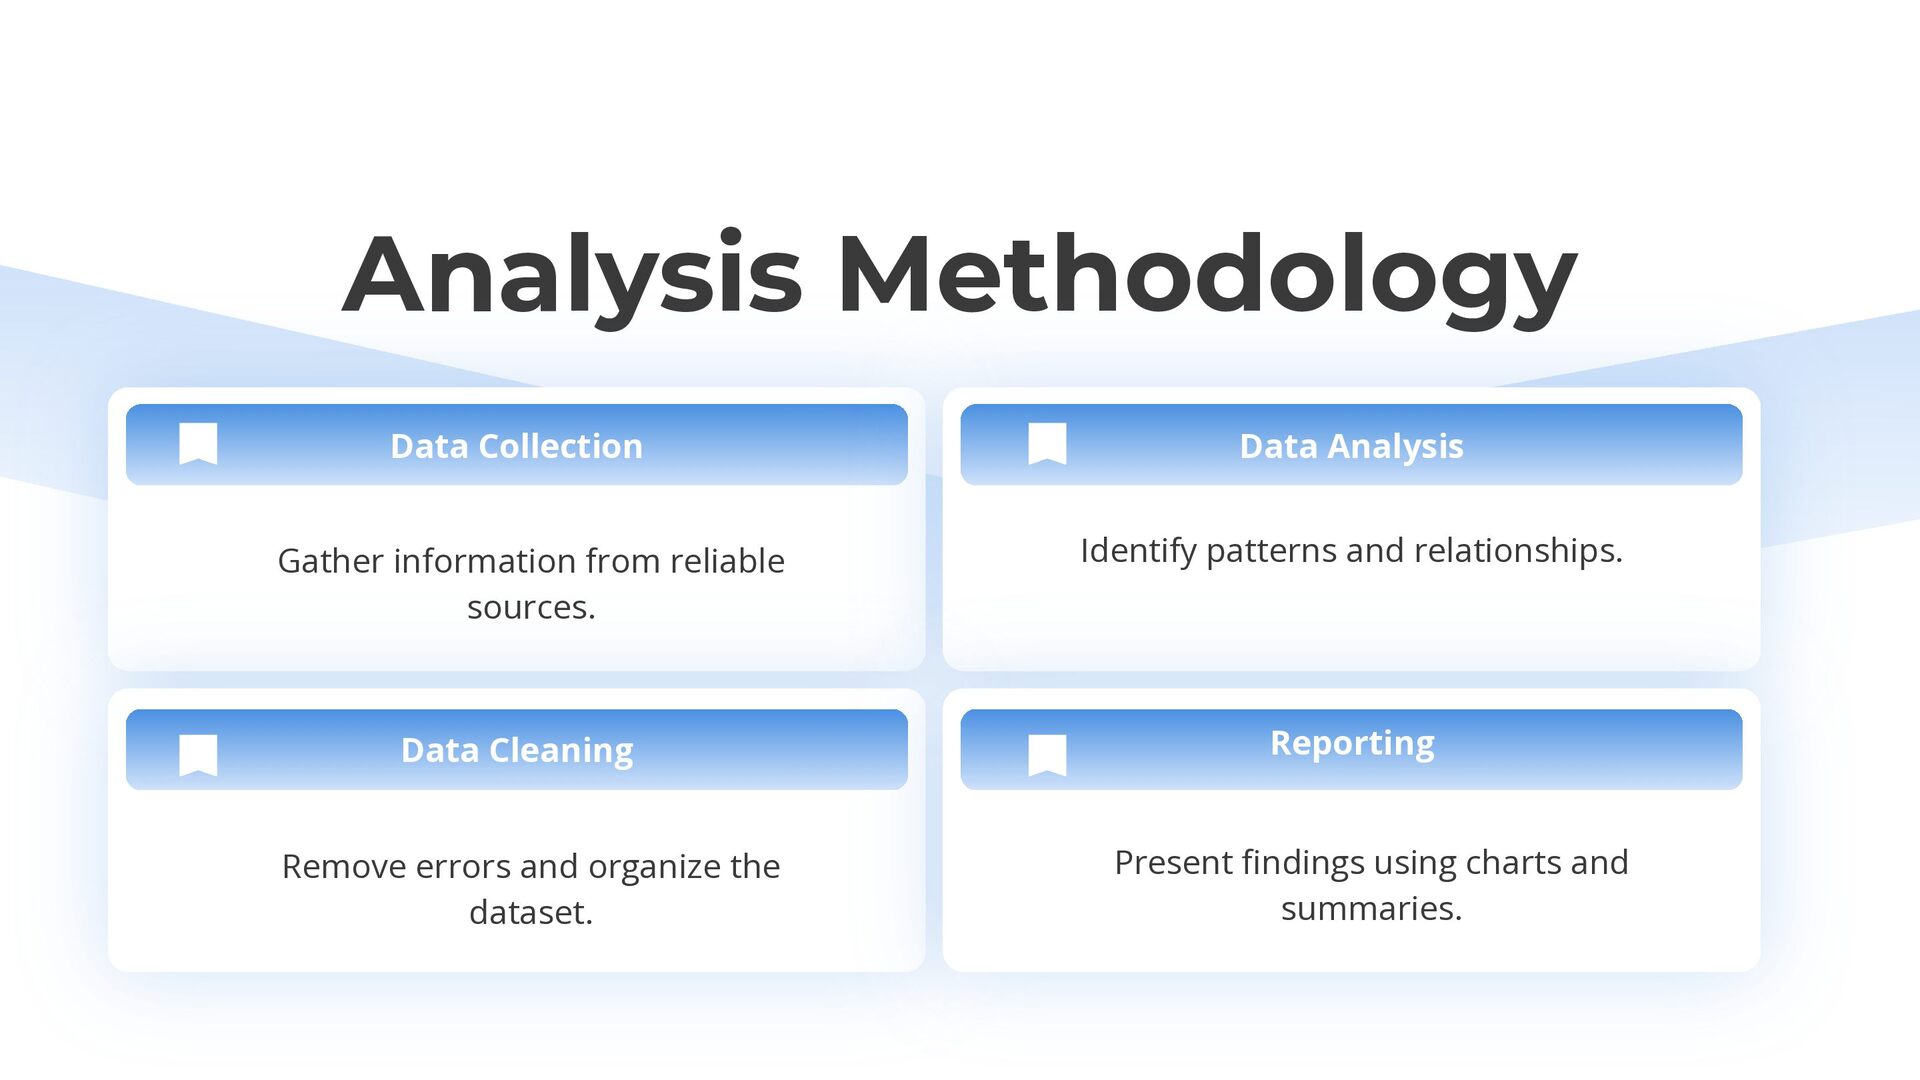
  4. Analysis Methodology Data Collection Data Analysis Gather information from reliable

    sources. Identify patterns and relationships. Data Cleaning Reporting Remove errors and organize the dataset. Present findings using charts and summaries.
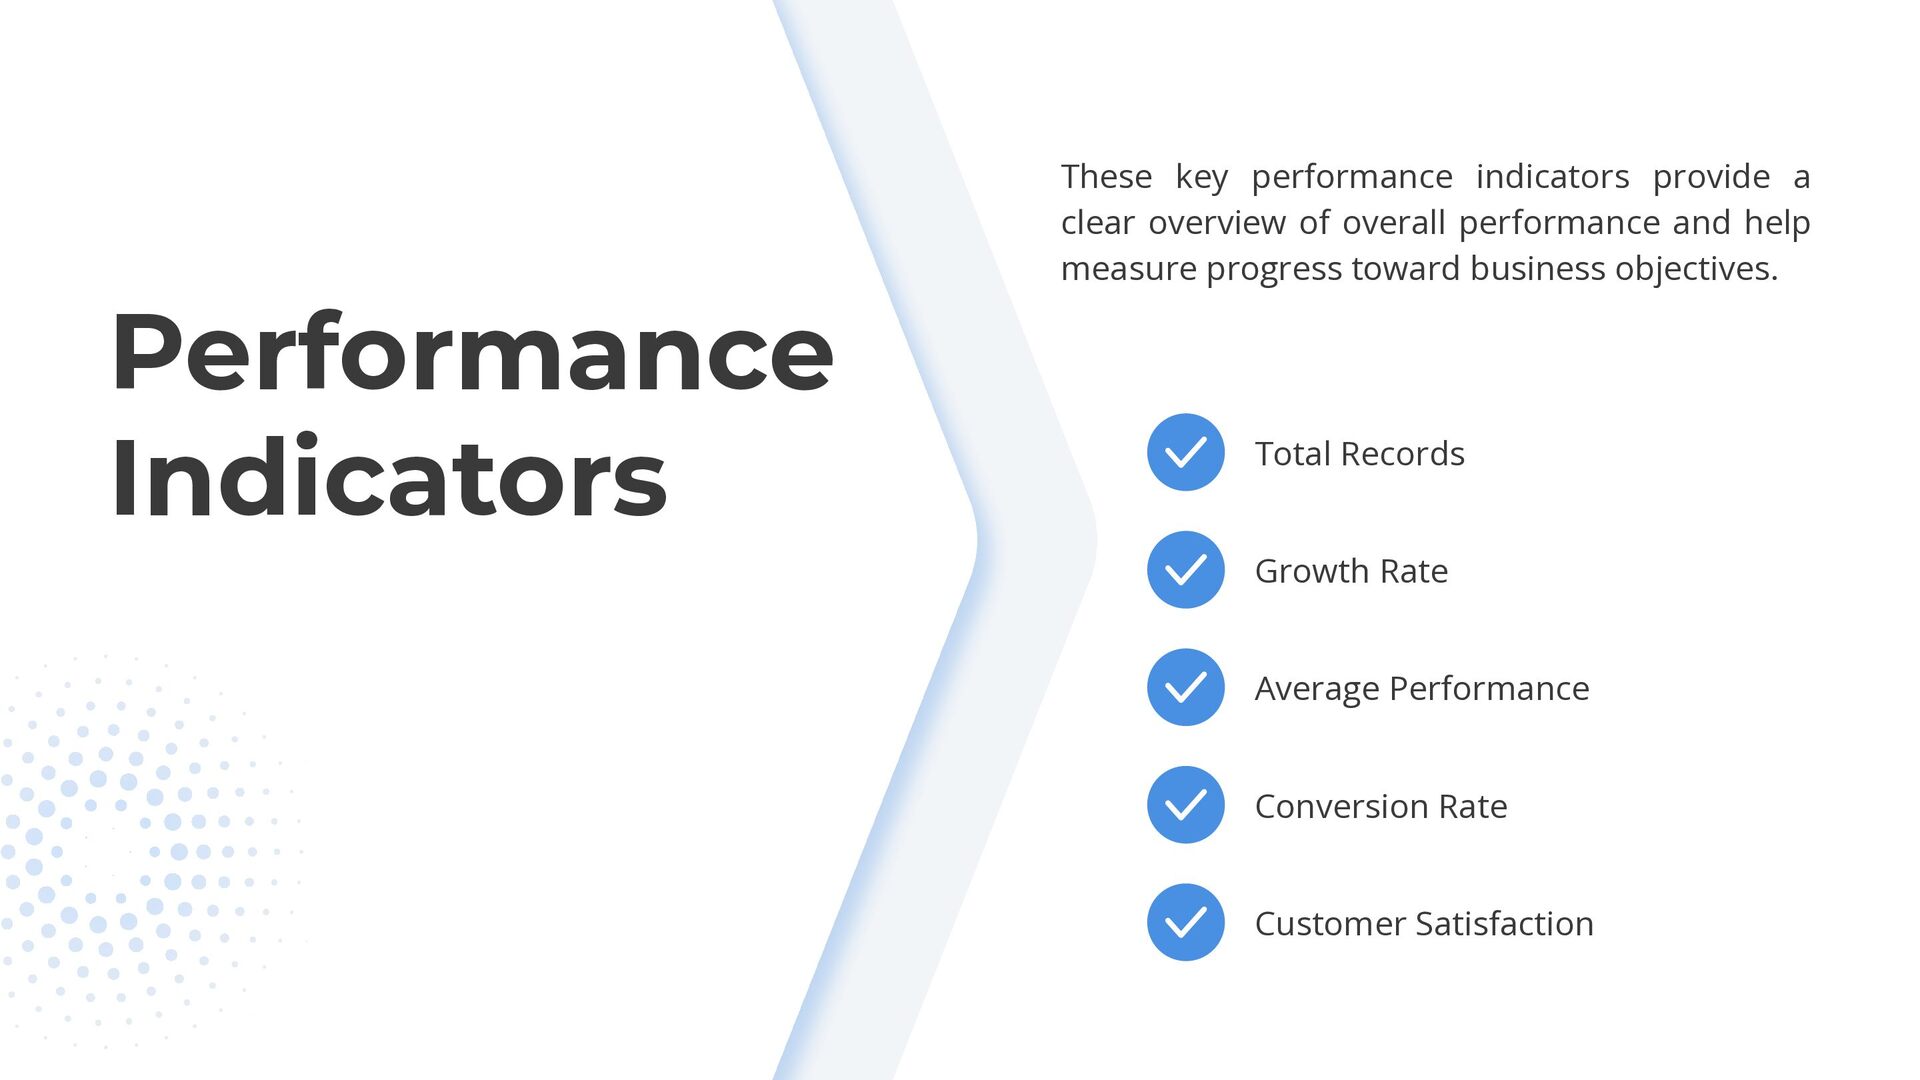
  5. Performance Indicators These key performance indicators provide a clear overview

    of overall performance and help measure progress toward business objectives. Total Records Growth Rate Average Performance Conversion Rate Customer Satisfaction
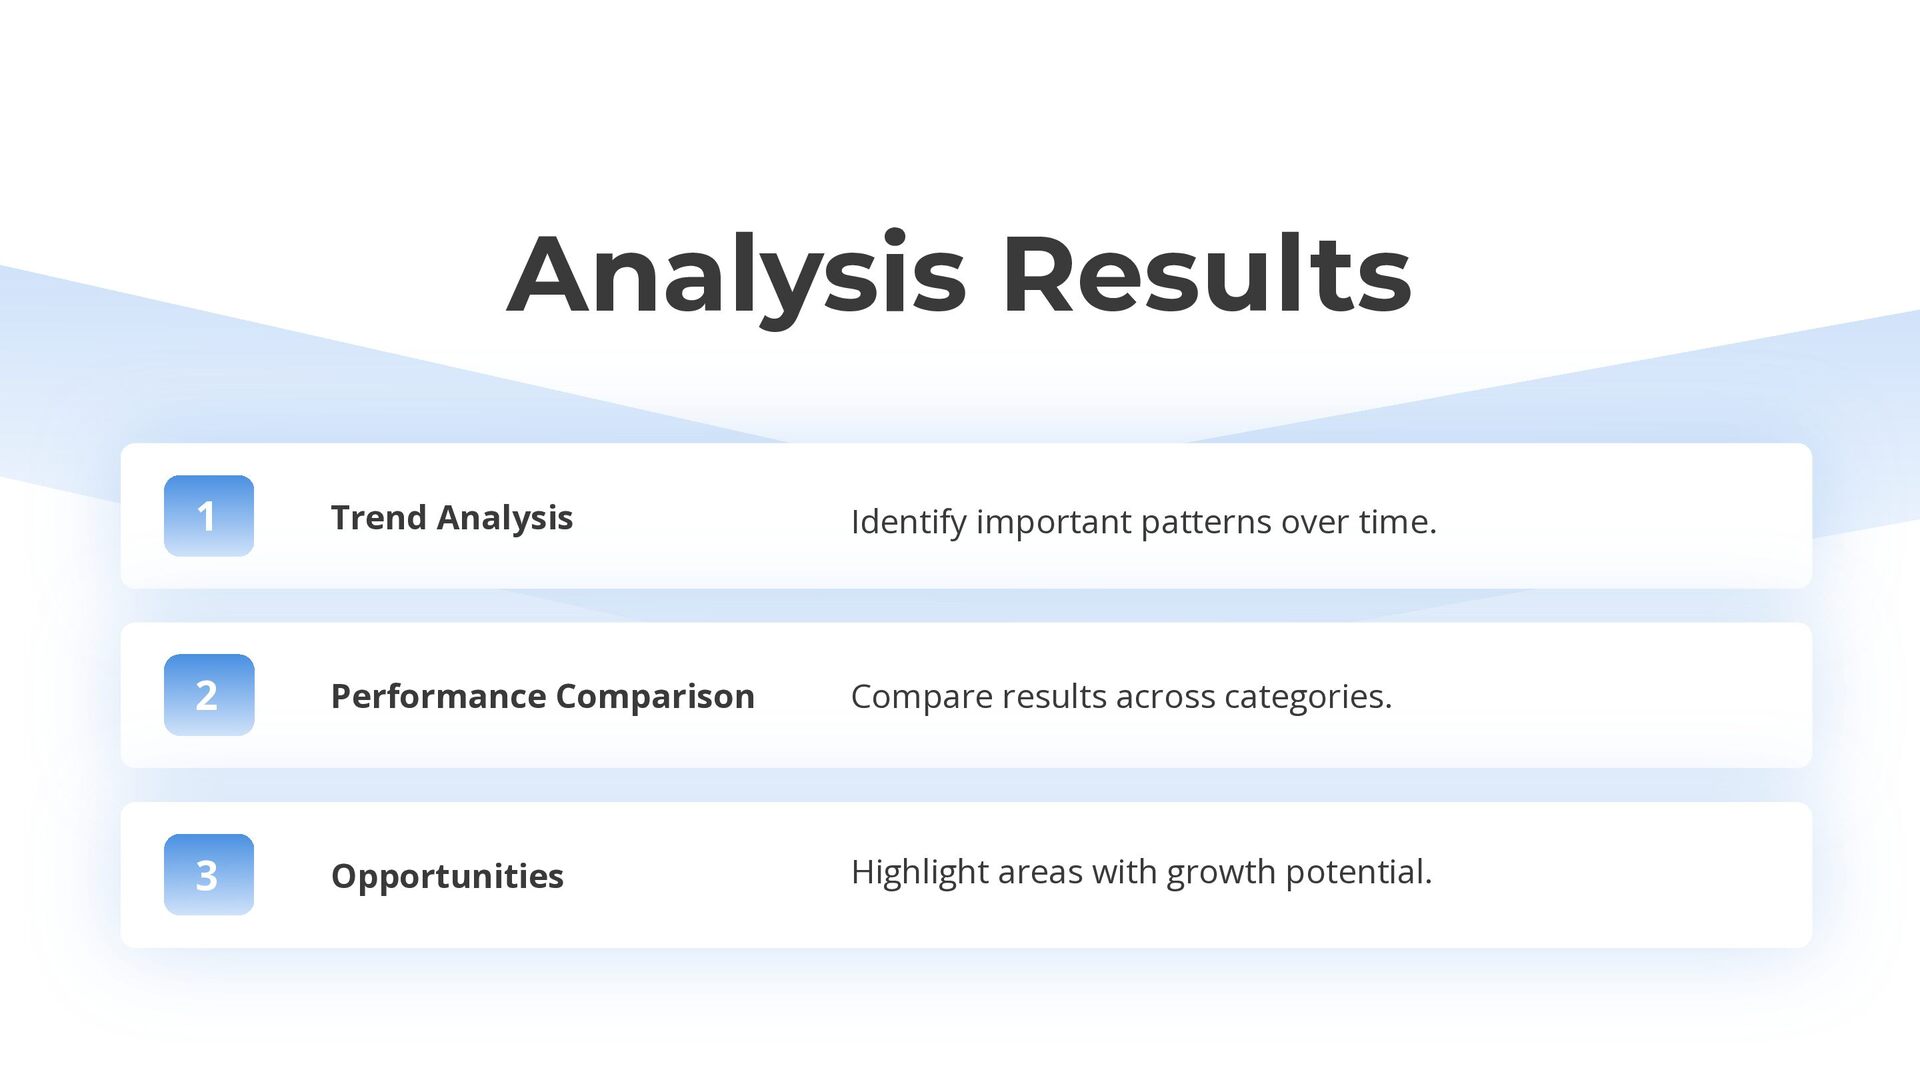
  6. Analysis Results 1 Trend Analysis Identify important patterns over time.

    2 Performance Comparison Compare results across categories. 3 Opportunities Highlight areas with growth potential.
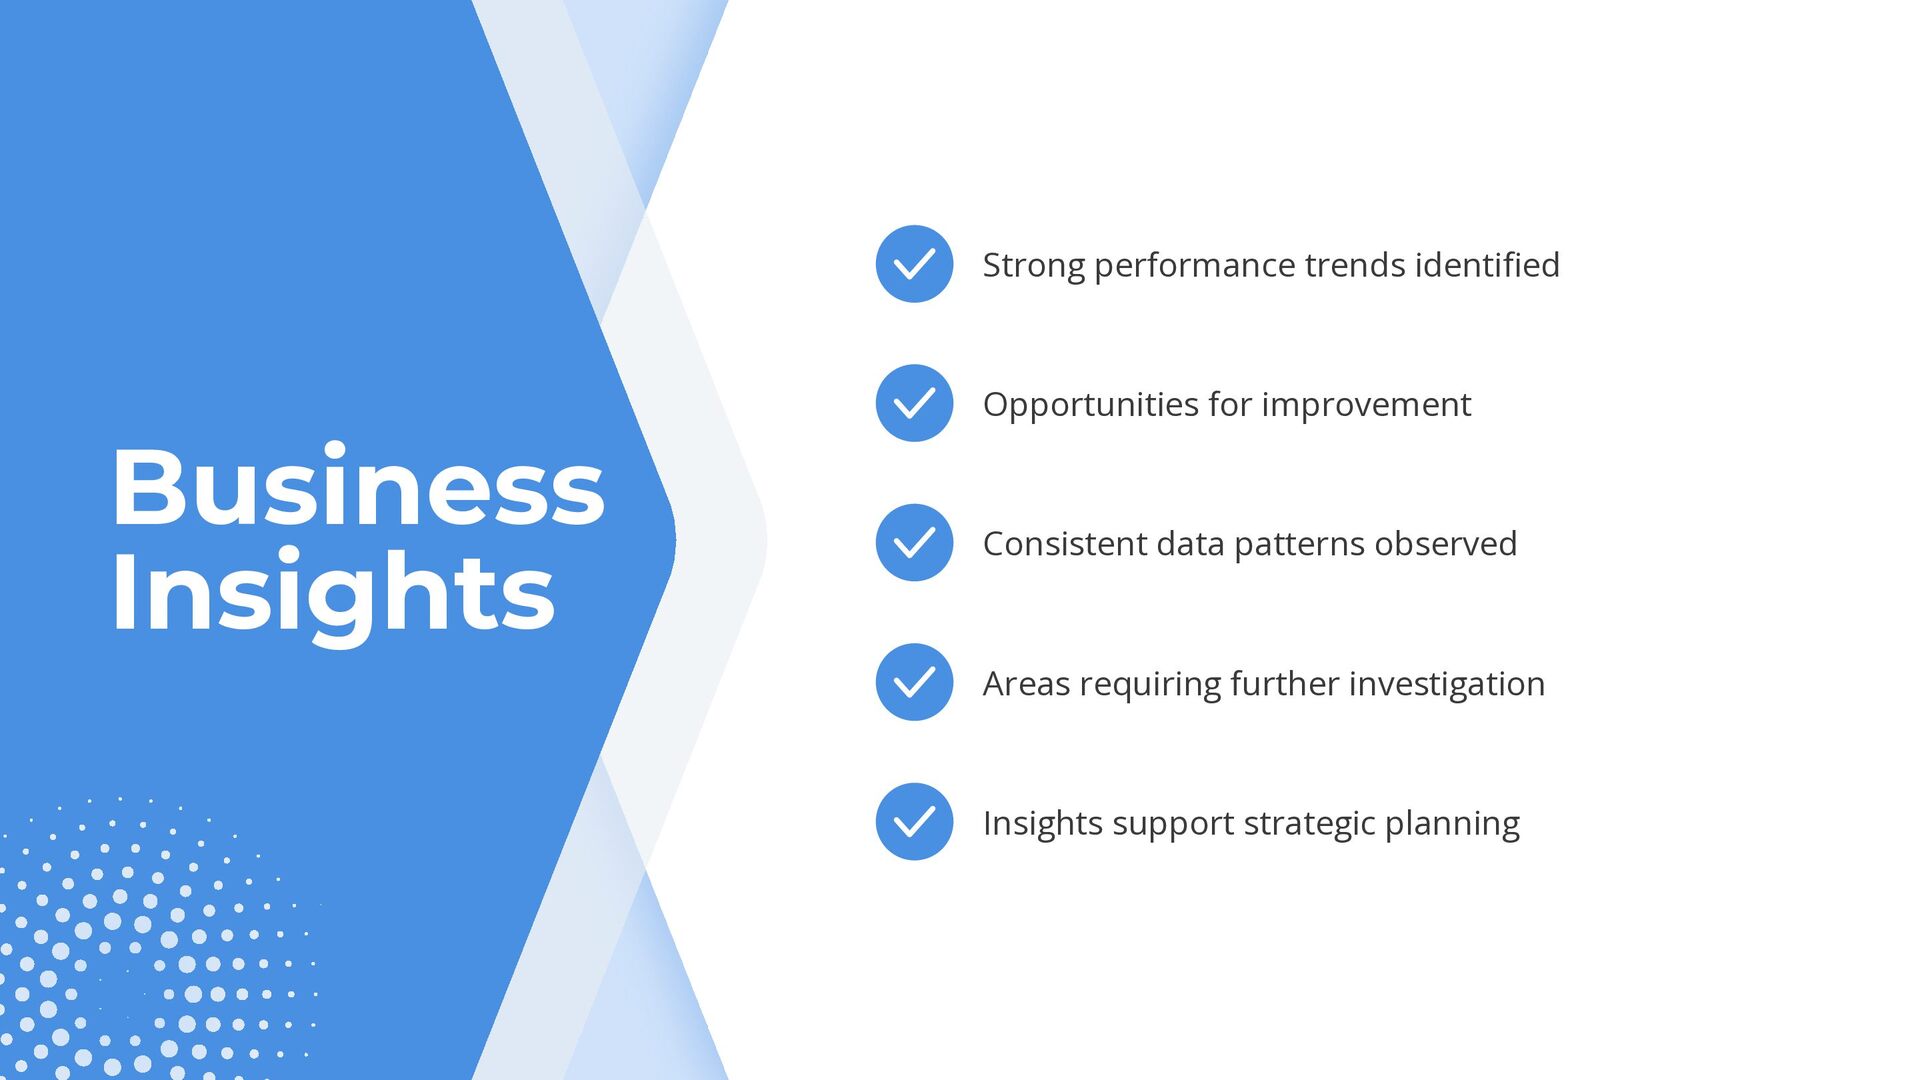
  7. Strong performance trends identified Business Insights Opportunities for improvement Consistent

    data patterns observed Areas requiring further investigation Insights support strategic planning
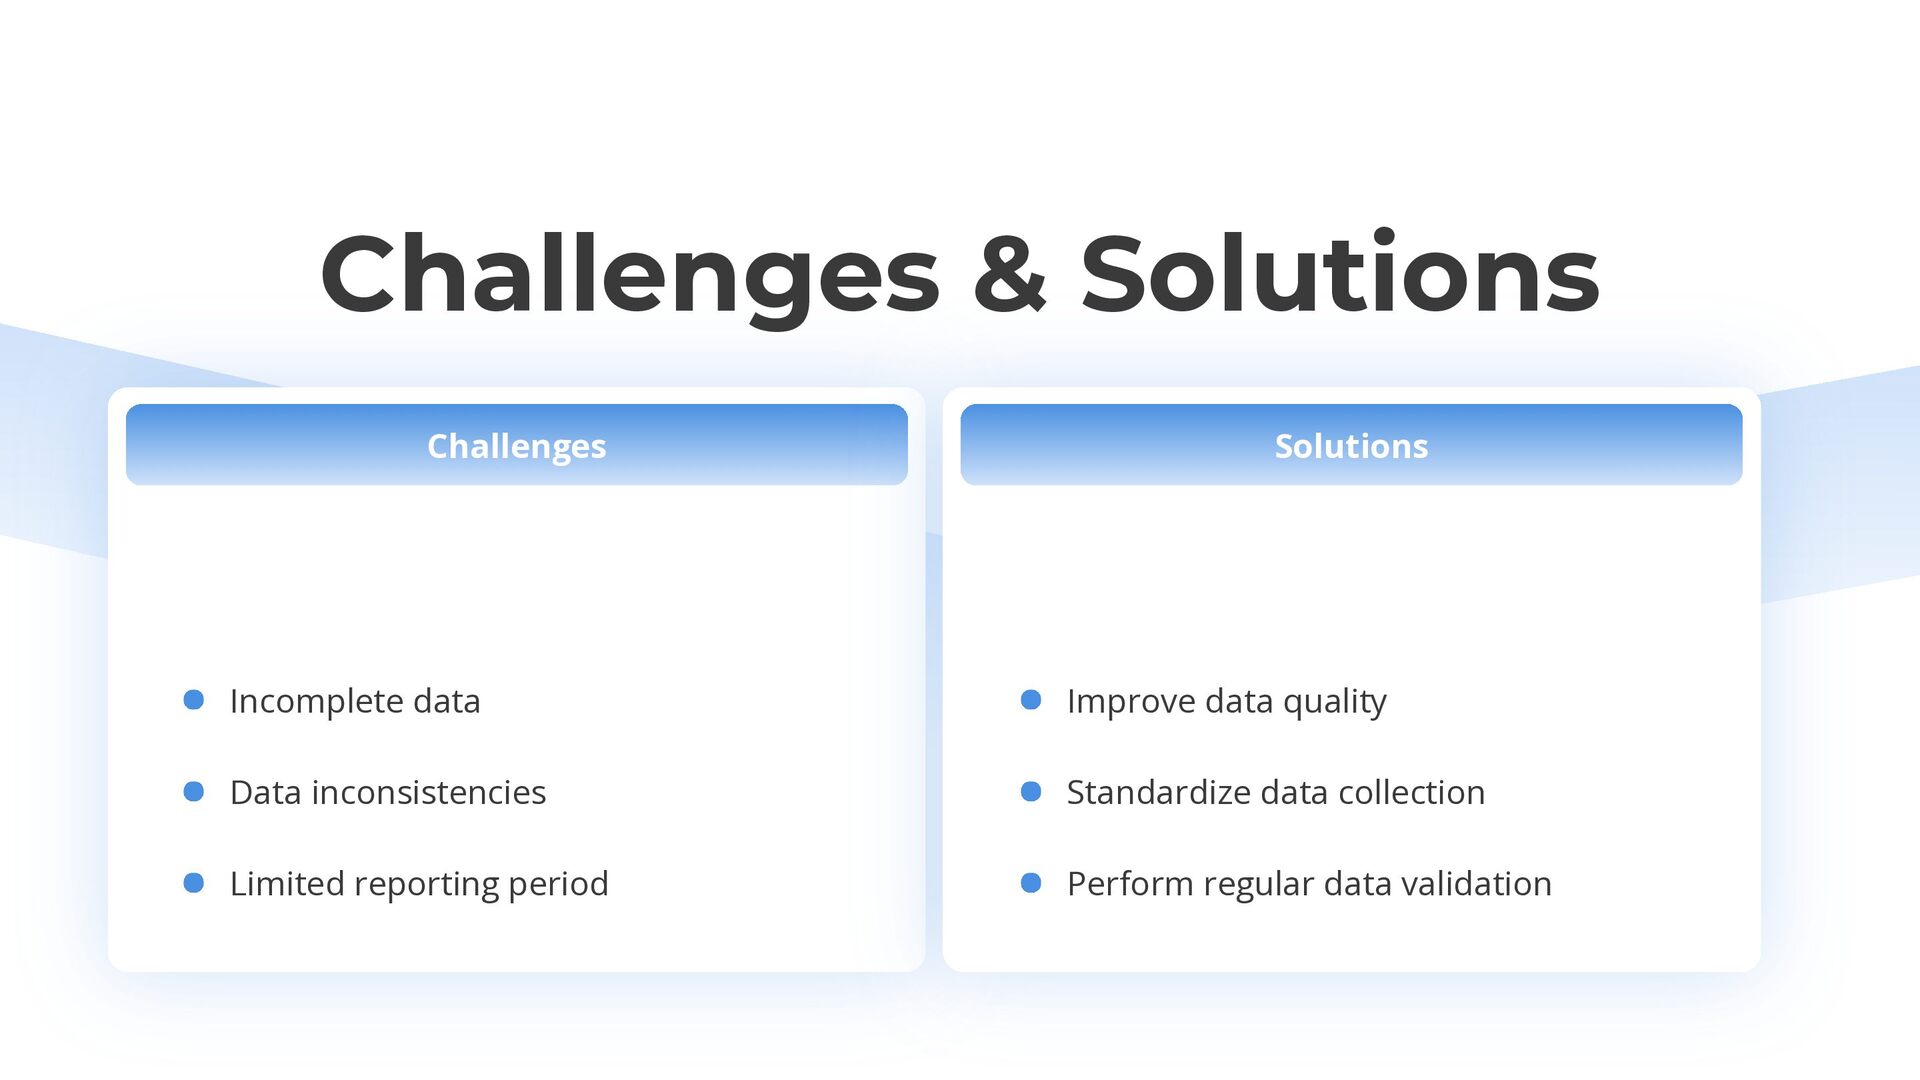
  8. Challenges & Solutions Challenges Solutions Incomplete data Improve data quality

    Data inconsistencies Standardize data collection Limited reporting period Perform regular data validation
  9. Recommendations Regular monitoring of key performance indicators, combined with consistent

    data collection and reporting practices, can improve the accuracy of future analyses. Organizations should also enhance data visualization, maintain high data quality standards, and use analytical insights to support strategic planning and informed decisionmaking.
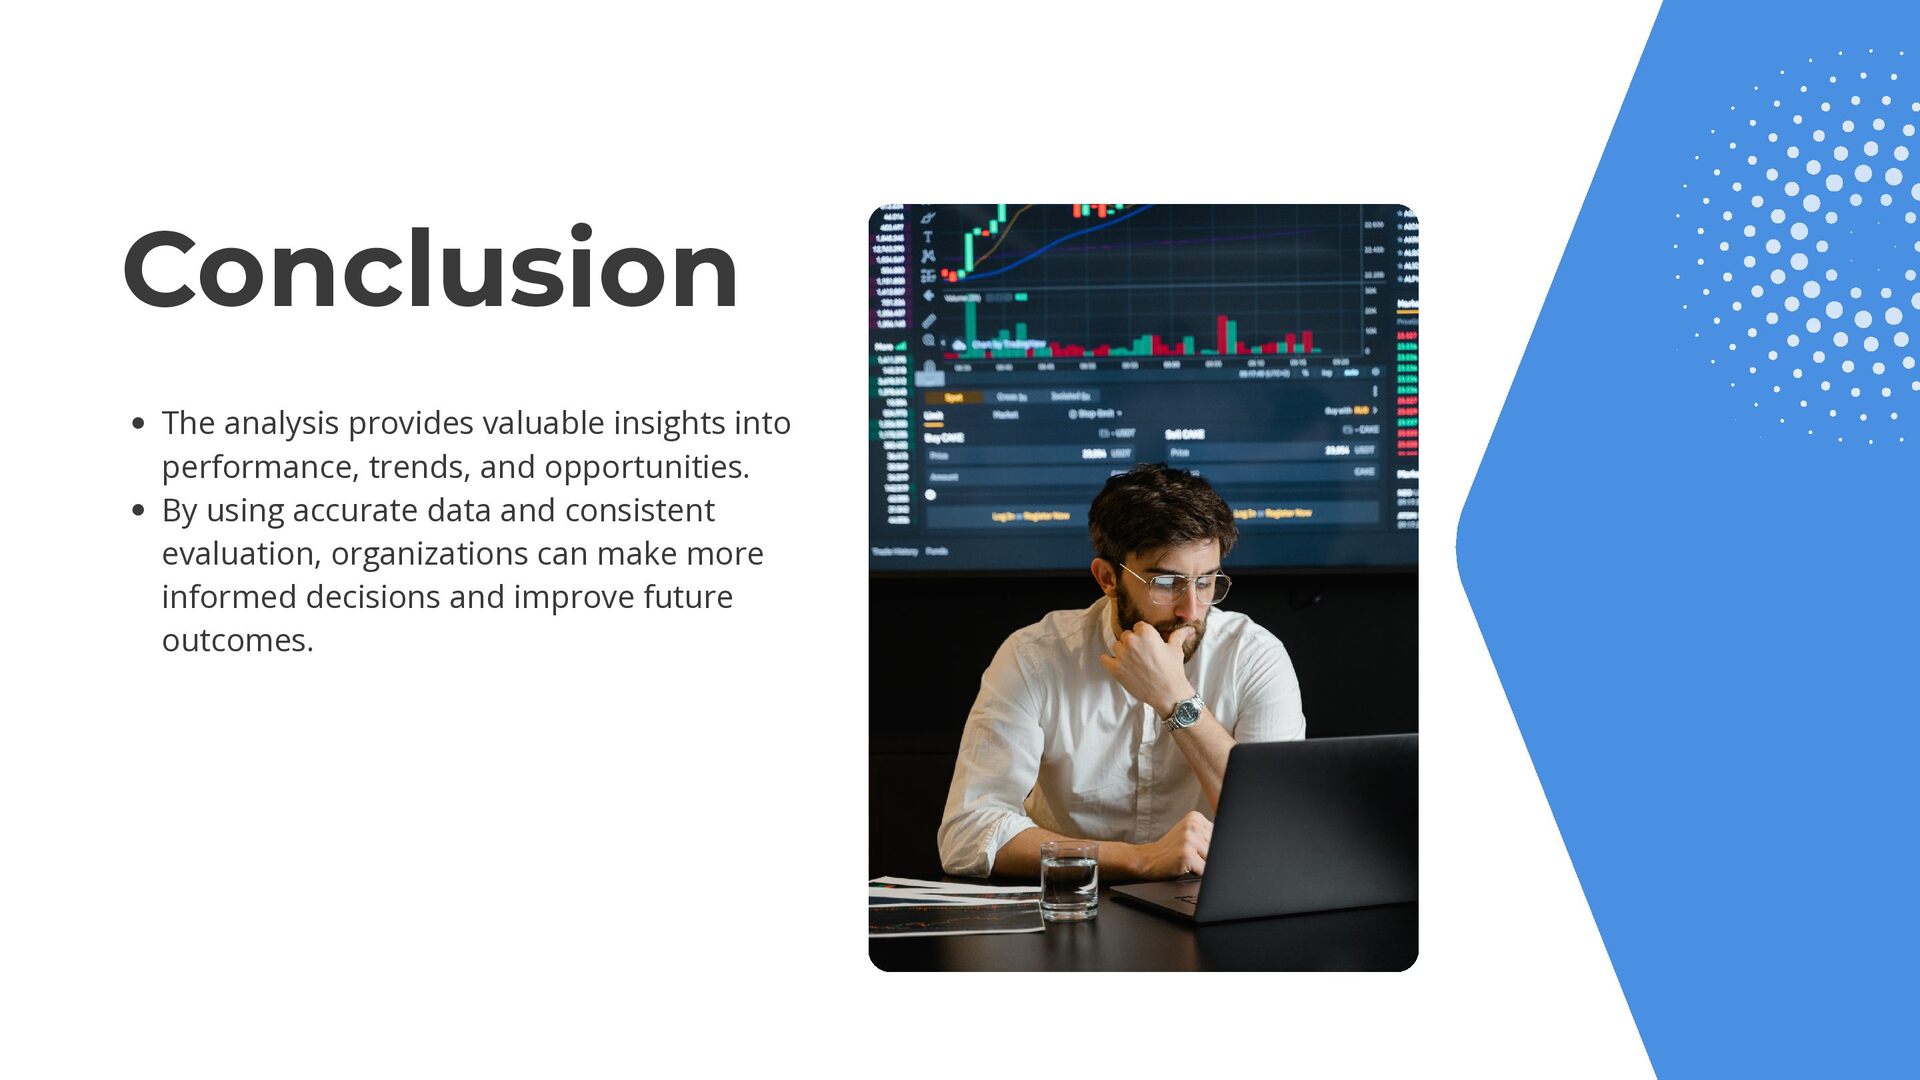
  10. Conclusion The analysis provides valuable insights into performance, trends, and

    opportunities. By using accurate data and consistent evaluation, organizations can make more informed decisions and improve future outcomes.