Upgrade to Pro — share decks privately, control downloads, hide ads and more …

Views You Can Use

Jay Stakelon
January 28, 2014

Views You Can Use

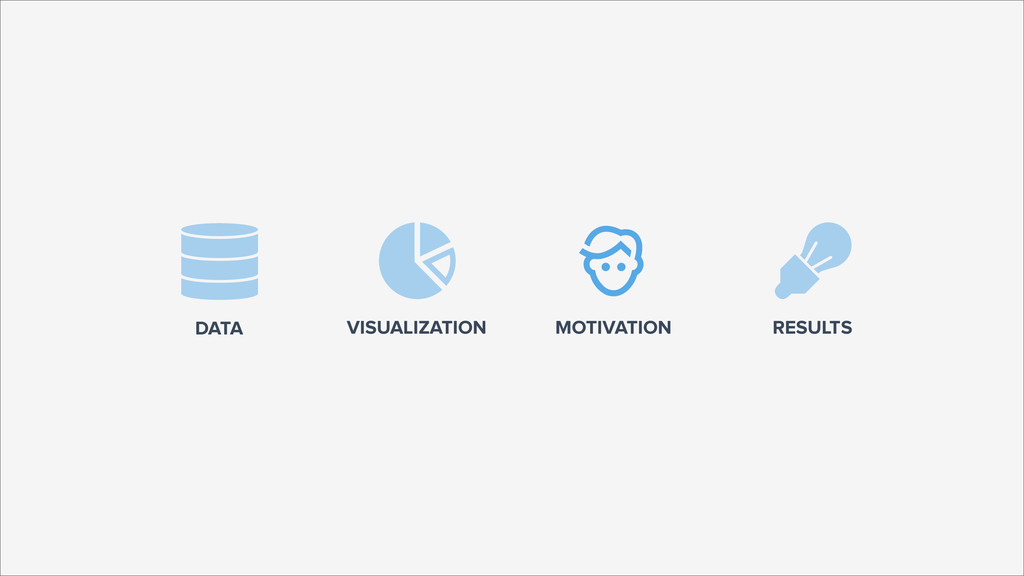
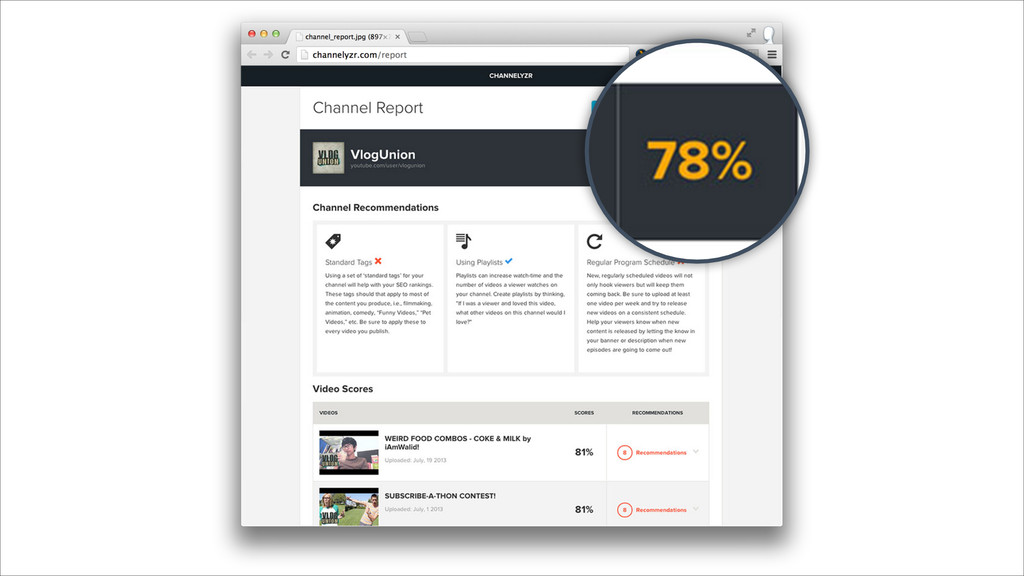
A couple of folks from the Fullscreen engineering team (Matthew Amick & Sean Stavropoulos) and myself gave a talk as part of UCLA's Data Entrepreneurship course. These are the slides from my portion of the talk about how we create and use data visualizations to help users and our business.

Jay Stakelon

January 28, 2014
Tweet

More Decks by Jay Stakelon

Other Decks in Design

Transcript

  1. PROTO-PERSONAS A design tool used to better understand who you’re

    creating visualizations for. Equal parts intuition and data.
  2. YOUTUBER 17 year-old gamer Junior in high school Has 2.5k

    YouTube subscribers Photo by wlodi: http://www.flickr.com/photos/wlodi/2279211019/
  3. SOCIAL MEDIA MANAGER Works for a major media company Responsible

    for multiple brands Has 4 direct reports Photo of Marco Montemagnio by googlisti: http://www.flickr.com/photos/googlisti/5037896757/
  4. Visualizations can show us patterns in data. Add to that

    an understanding of the conditions that created the data points and you can take those patterns and make inferences.
  5. This might mean that we need to start uploading videos

    to Channel One on Sundays, since the visualizations of Channel Two’s upload and view patterns show that Sunday’s the best day to upload.
  6. Or it might mean that Channel Two aired a live

    broadcast of the Super Bowl one single time.
  7. The presentation of data can be used to motivate users

    to behave in ways that mutually benefit both themselves and the business.
  8. Distilling a number of data points into a single “score”

    and tracking that score over time turns optimizing video content into a game.
  9. Visualizations can democratize access to complex data and make it

    useful to various stakeholders within a business.
  10. A simple time series visualization of video viewership patterns can

    help partner managers advise talent, content producers plan releases, and finance make projections.