Building an Observability Platform Using Apache...

Building an Observability Platform Using Apache Pinot (Neha Pawar, StarTree) | RTA Summit 2024

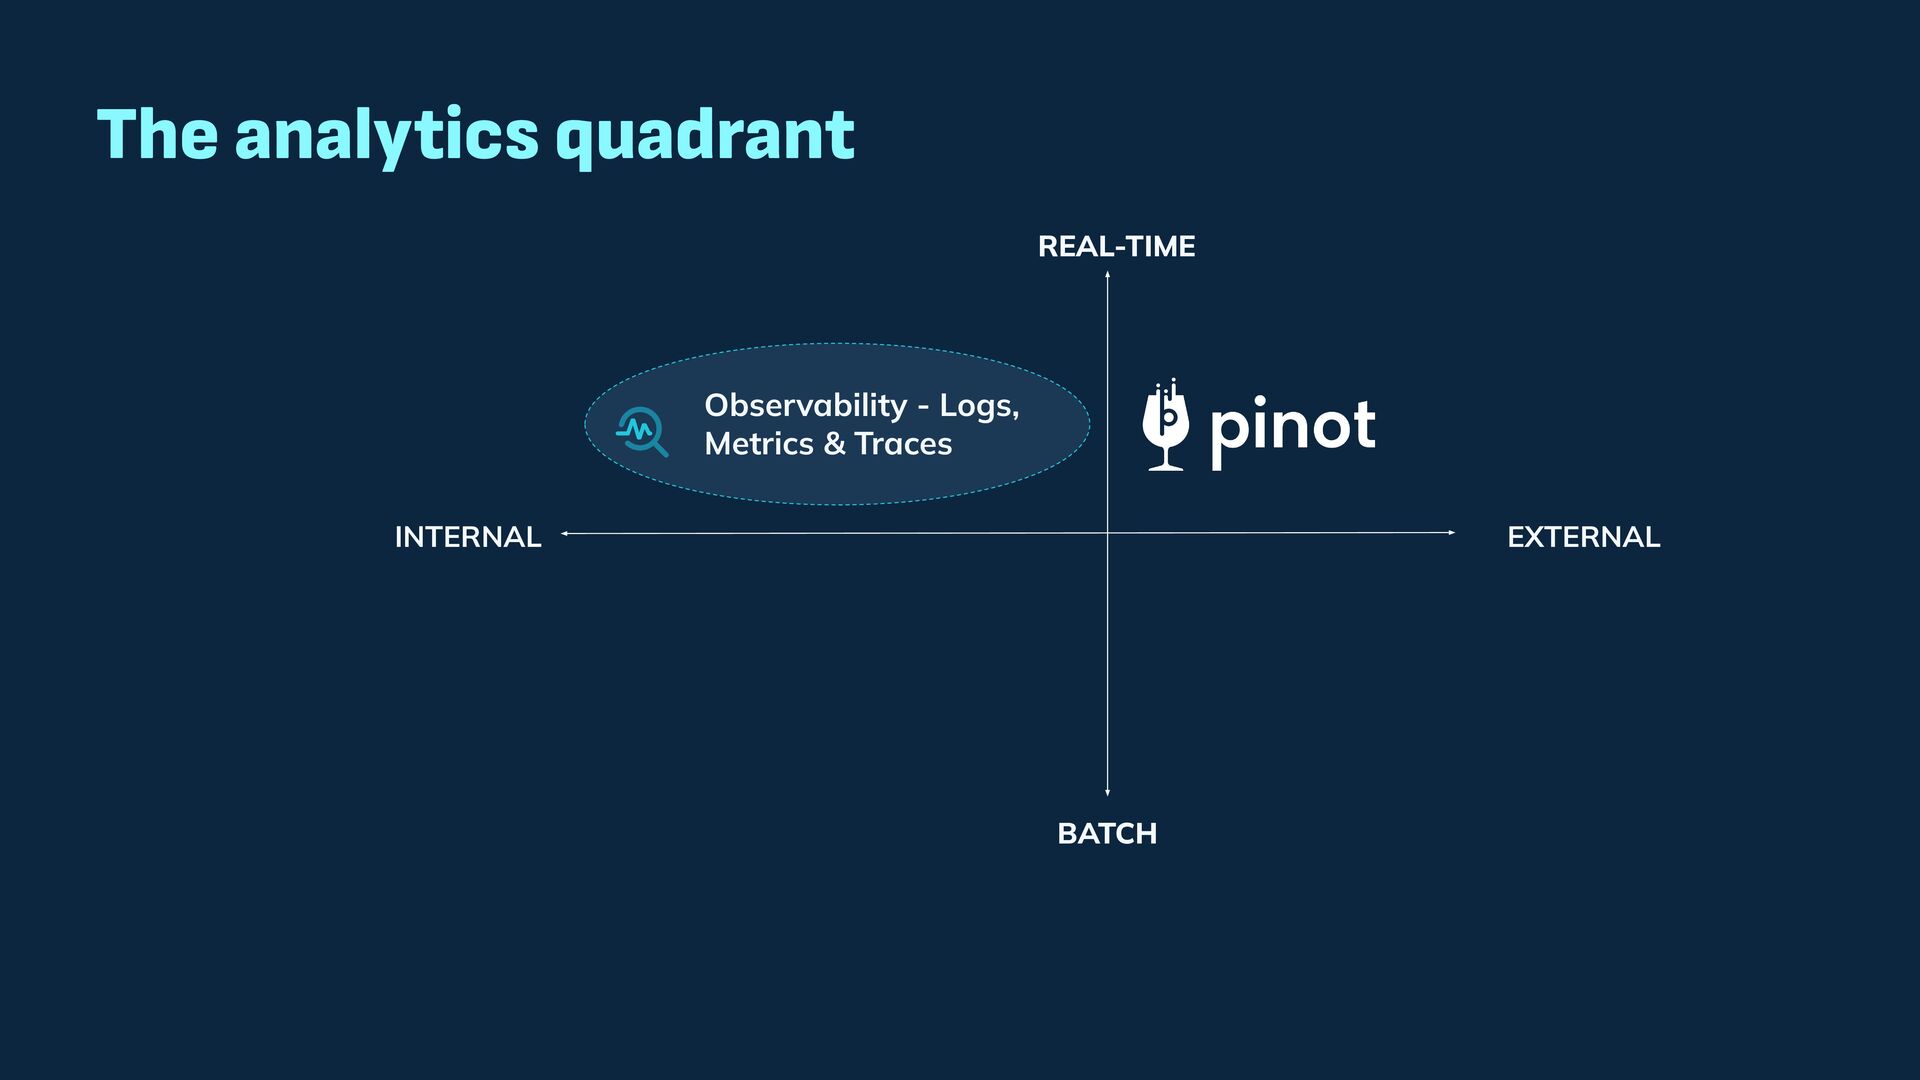
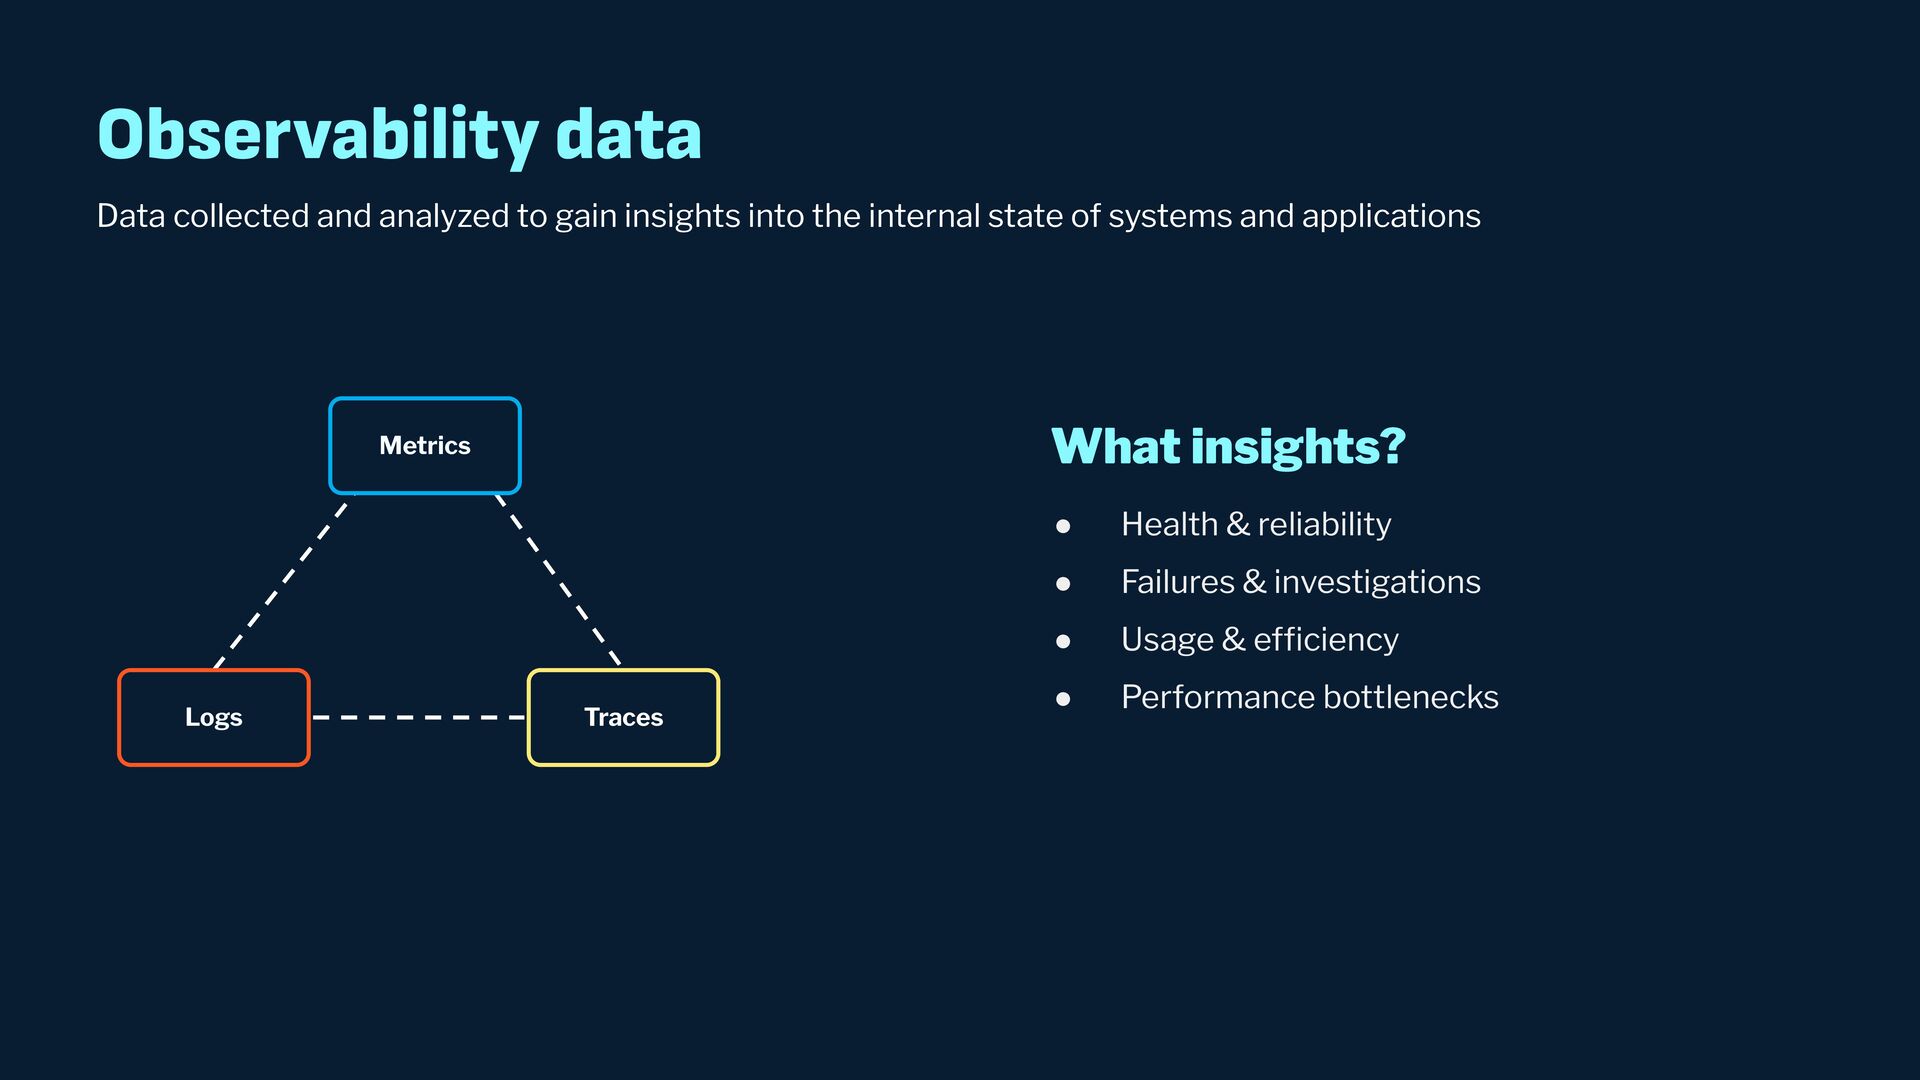
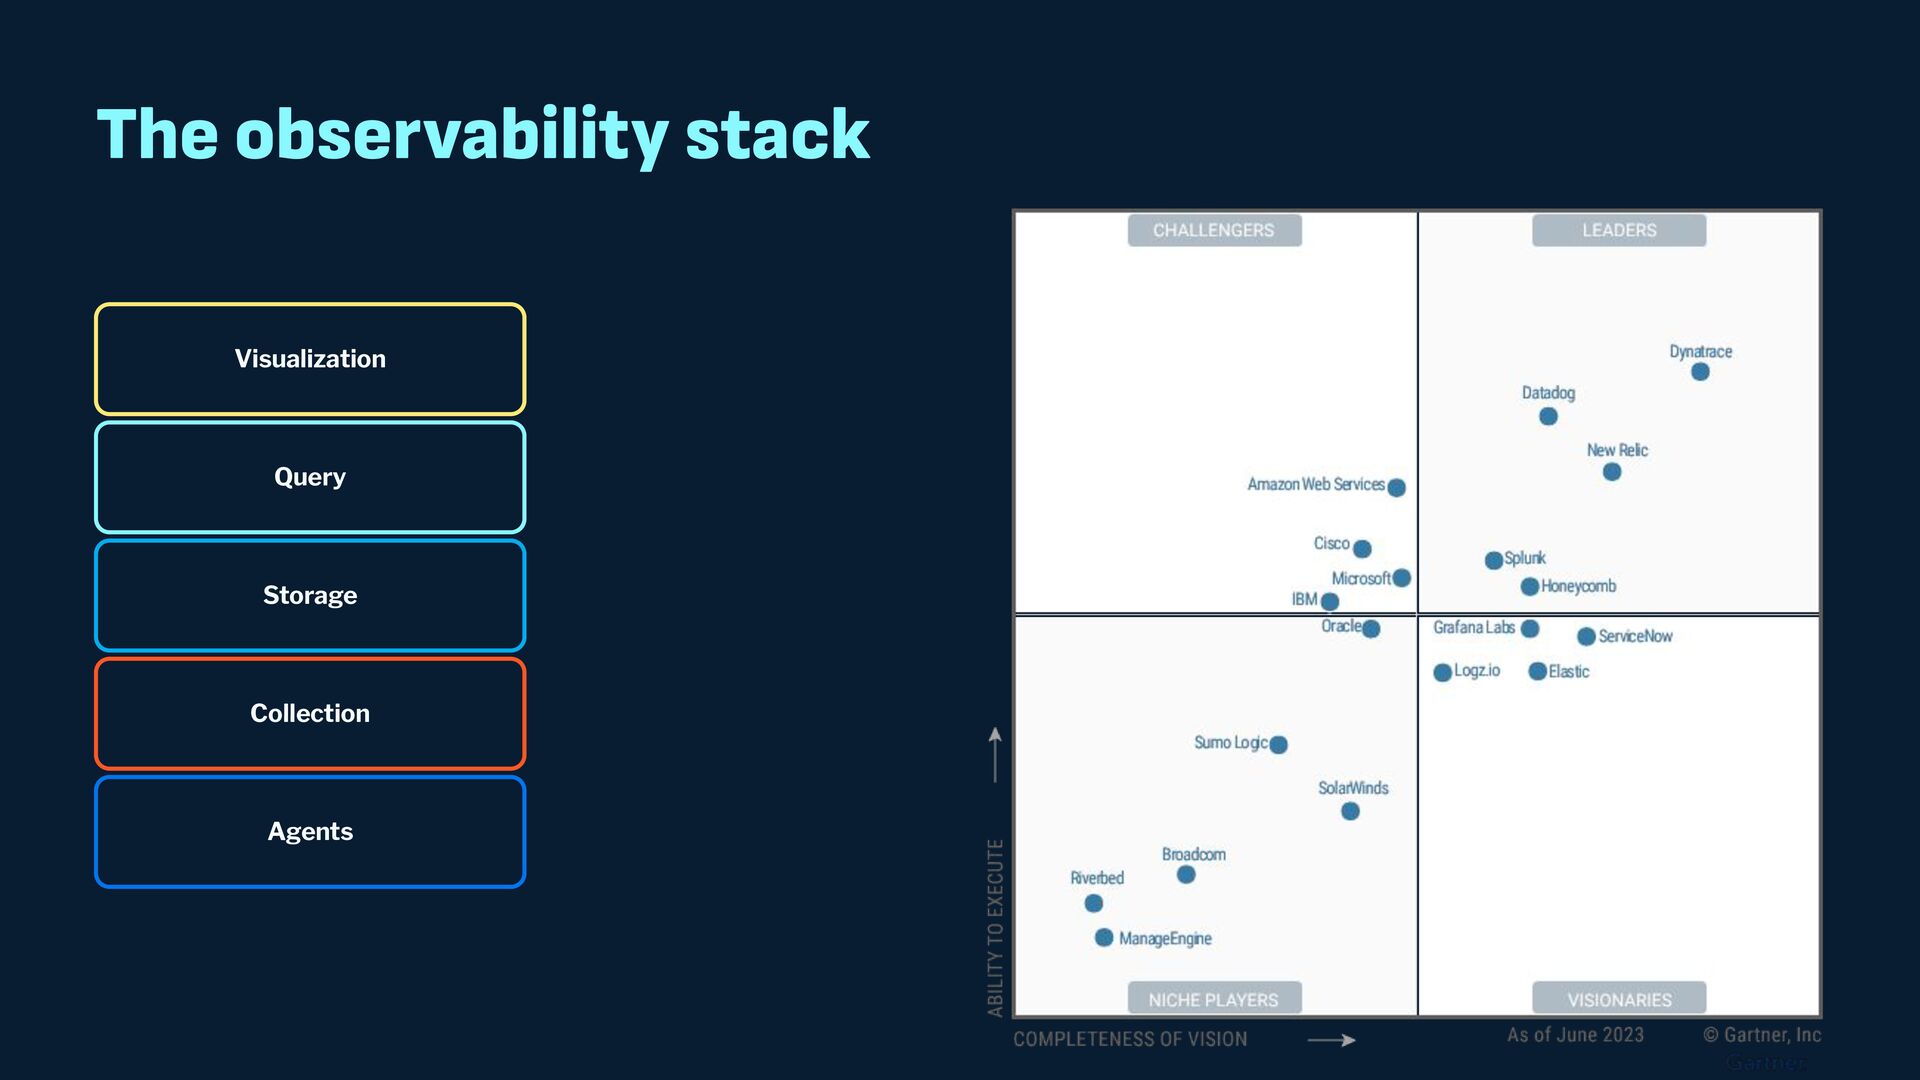
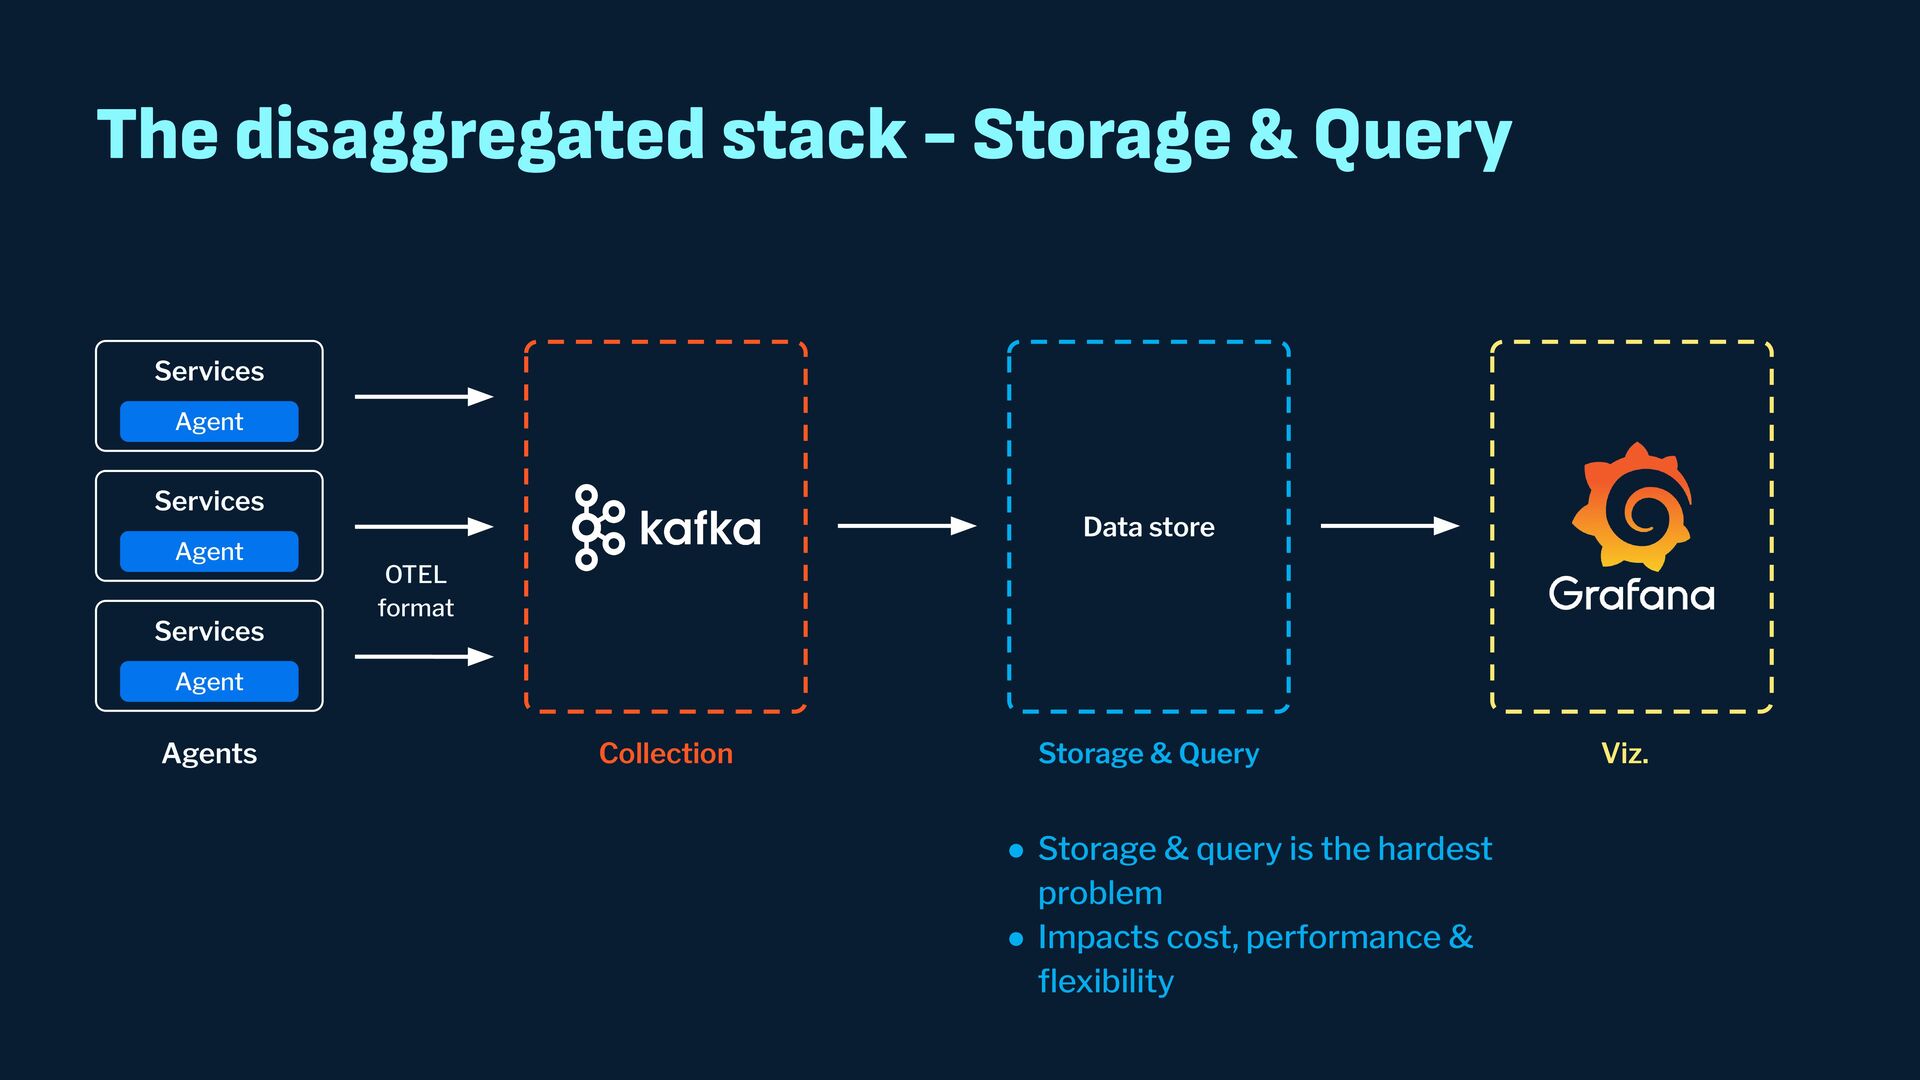
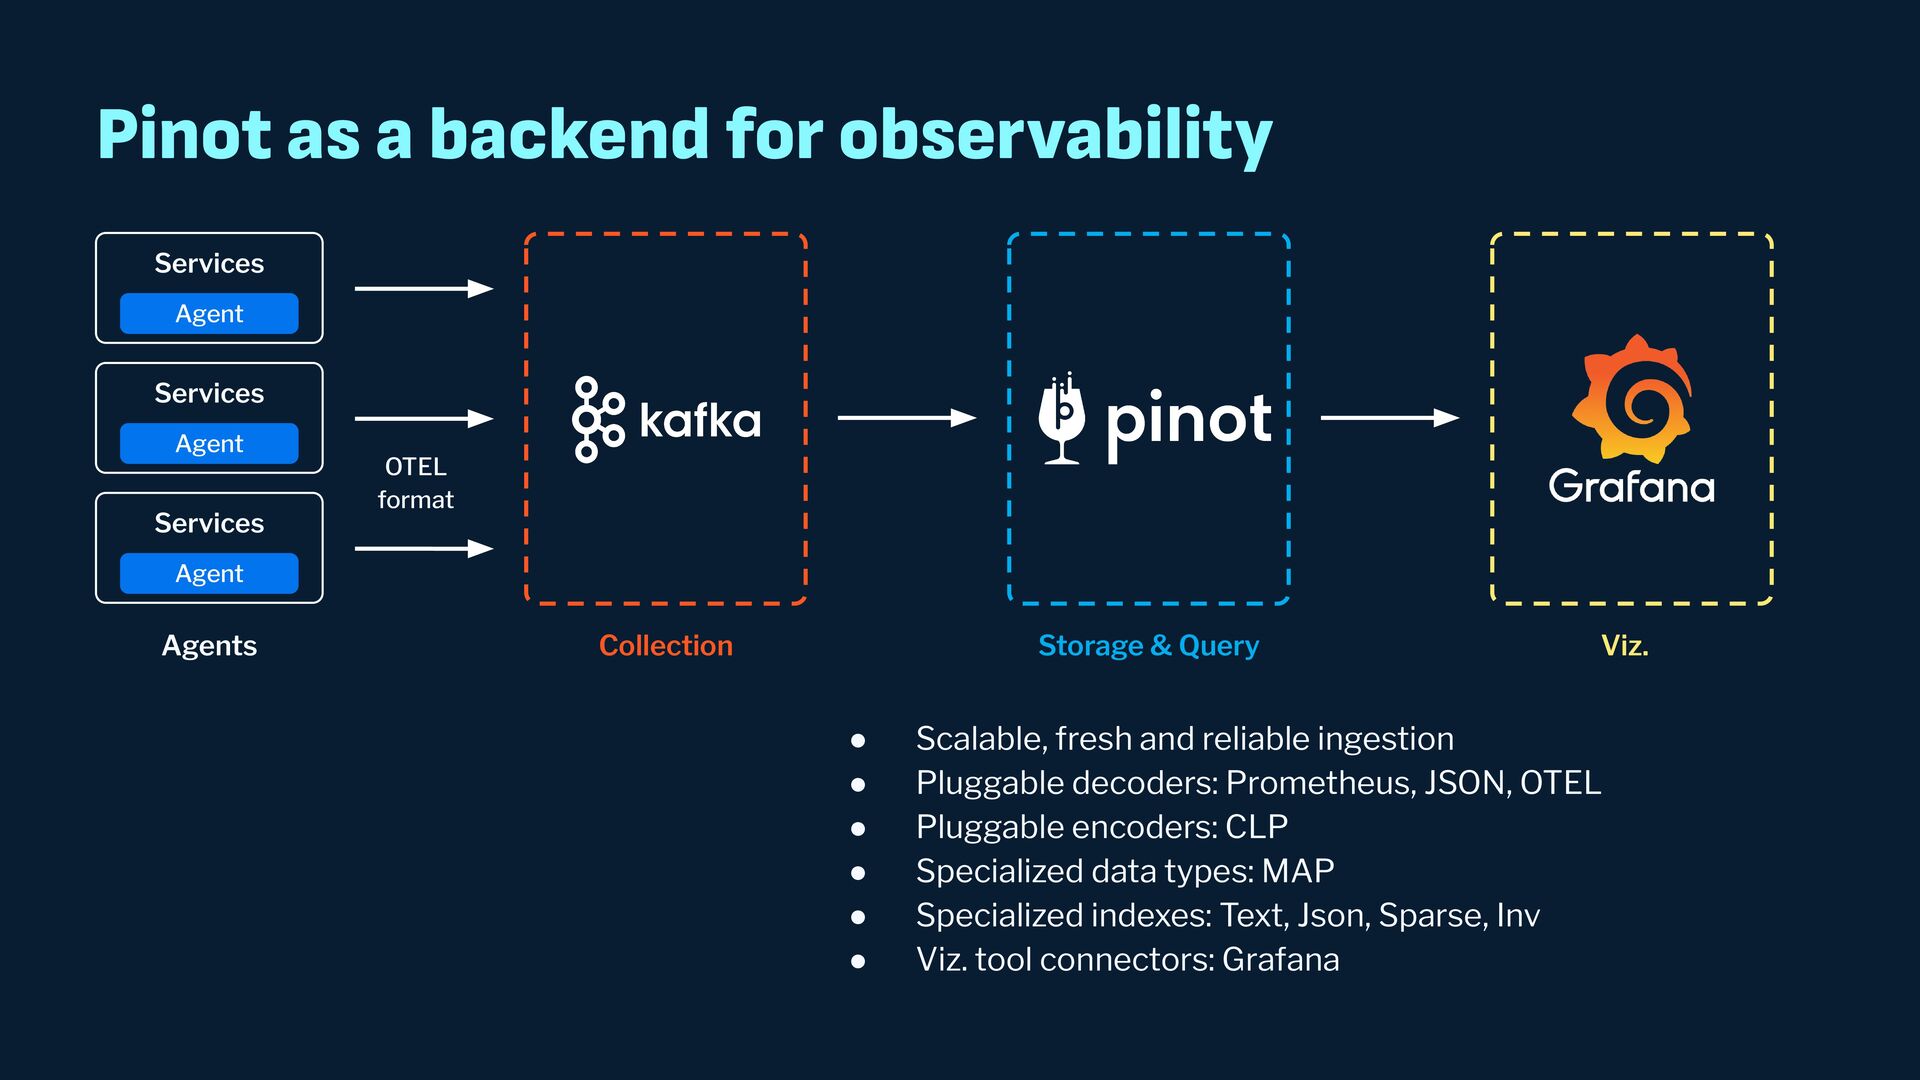
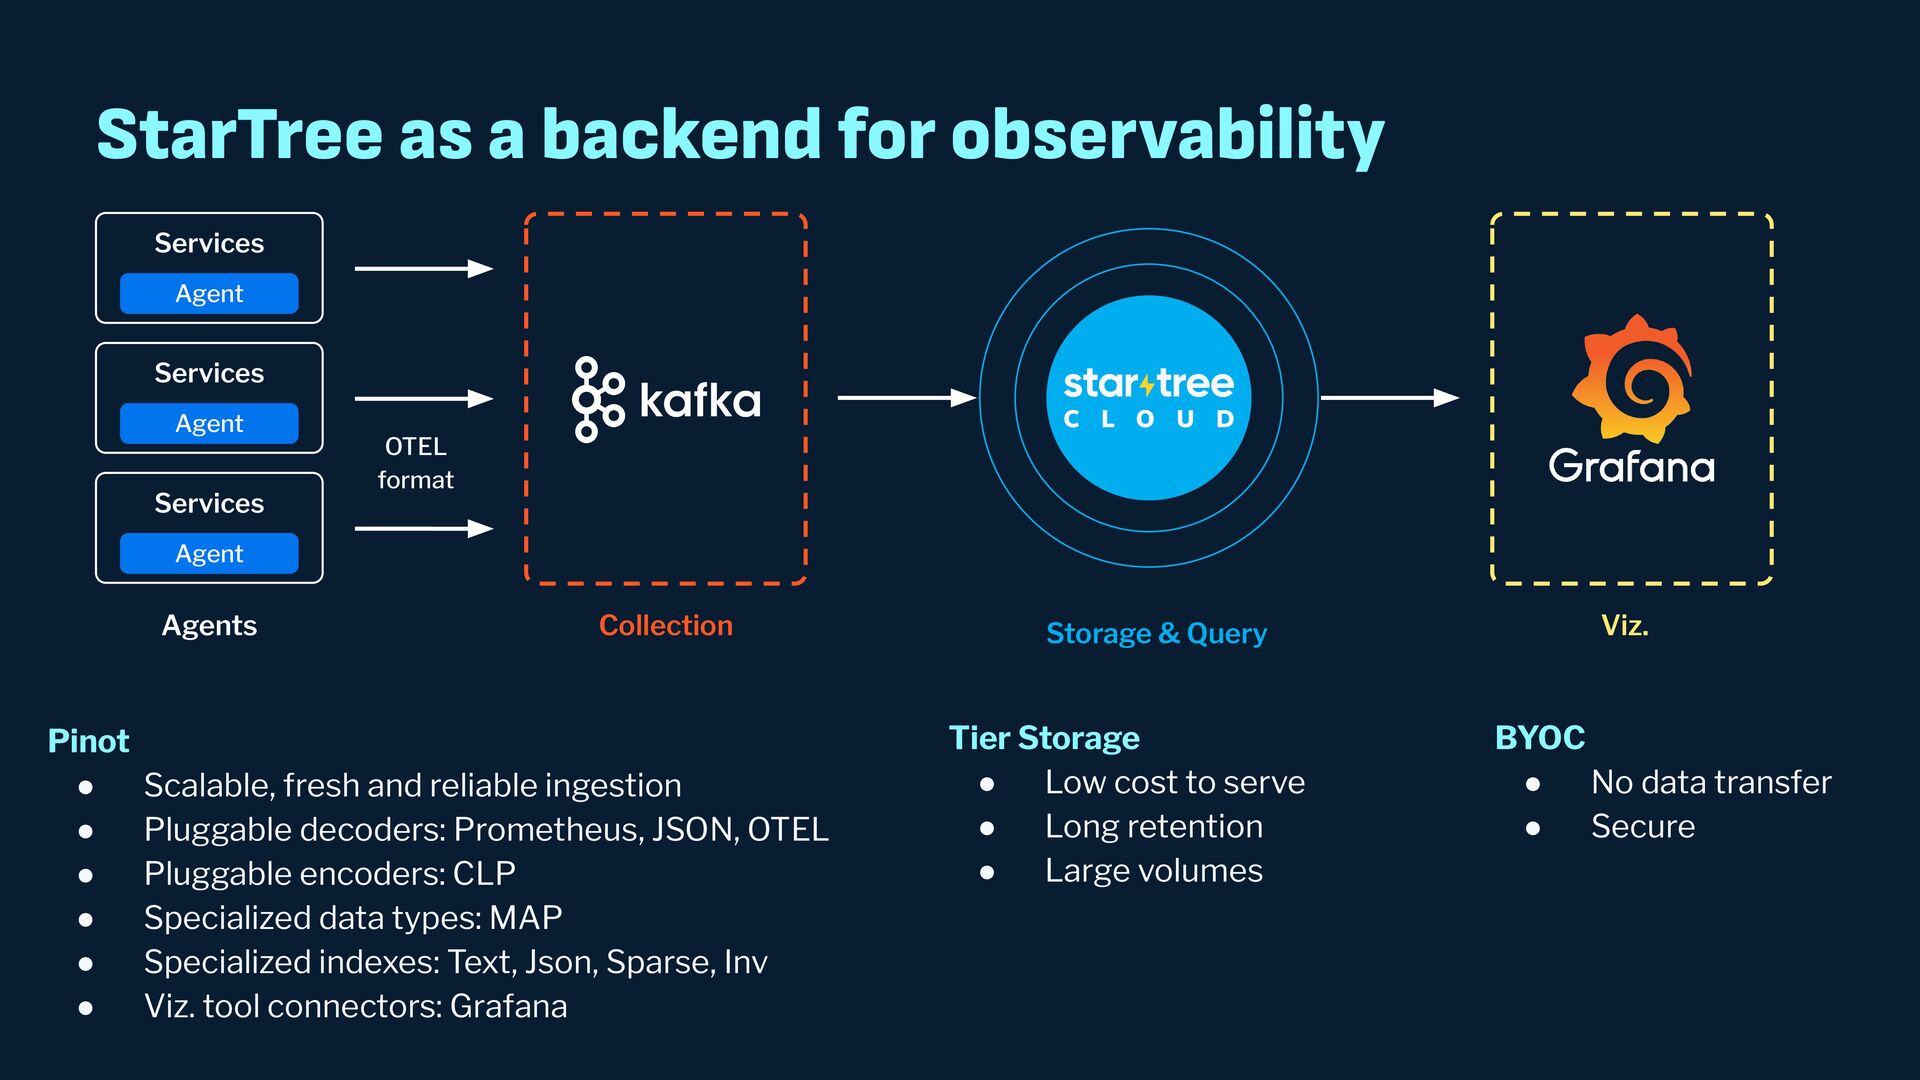
Observability data has become some of the most common types of data being generated and stored within the software industry. At the most basic level we have time series and log data, which are used not just for observability but also in business analytics and customer behavior data mining. Shortly after metrics and logs, trace data also became heavily used to provide deeper insights into applications and distributed systems. In this presentation, we will survey the observability ecosystem and common architectures to ingest, store, query and visualize metrics, logs and traces. We will then cover how we expanded Pinot's feature set to allow it to become an observability storage and analytics engine that can power observability platforms such as Grafana.

StarTree

May 20, 2024
Tweet

More Decks by StarTree

Other Decks in Technology

Transcript

  1. Observability data Data collected and analyzed to gain insights into

    the internal state of systems and applications What insights? • Health & reliability • Failures & investigations • Usage & efficiency • Performance bottlenecks Metrics Logs Traces
  2. Lack of flexibility • Much investment made in agents, added

    to cost • Vendor specific formats • Egress cost high • Data locked in • Each stack came with it’s own UI • Could not use for other data • Could not customize • High velocity + high volume data + high freshness = High cost • Low usage = Low ROI • Data locked in Visualization Query Storage Collection Agents All-or-nothing stack
  3. The disaggregated stack Services Agent Services Agent Services Agent Collection

    Viz. tools Streaming infra Data store Storage & Query Viz. Agents
  4. The disaggregated stack - Agents Services Agent Services Agent Services

    Agent Collection Viz. tools Streaming infra Data store Storage & Query Viz. Agents
  5. The disaggregated stack - Agents Services Agent Services Agent Services

    Agent Collection Viz. tools Streaming infra Data store Storage & Query Viz. Agents OTEL format • Agents are commoditized • Standards such as OTEL
  6. The disaggregated stack - Collection Services Agent Services Agent Services

    Agent Collection Viz. tools Streaming infra Data store Storage & Query Viz. Agents OTEL format
  7. The disaggregated stack - Collection Services Agent Services Agent Services

    Agent Collection Viz. tools Data store Storage & Query Viz. Agents OTEL format • Rise of stream processing systems like Kafka, RedPanda • Already in place for other streaming usecases
  8. The disaggregated stack - Visualization Services Agent Services Agent Services

    Agent Collection Viz. tools Data store Storage & Query Viz. Agents OTEL format
  9. The disaggregated stack - Visualization Services Agent Services Agent Services

    Agent Collection Data store Storage & Query Viz. Agents OTEL format Pluggable Grafana Connectors logQL promQL Customizable query editors
  10. The disaggregated stack - Storage & Query Services Agent Services

    Agent Services Agent Collection Data store Storage & Query Viz. Agents OTEL format • Storage & query is the hardest problem • Impacts cost, performance & flexibility
  11. Storage & Query Data store High Volume High Retention High

    Variety High Velocity High Query Complexity High Freshness
  12. Metrics data Common Challenges with Metrics Data Map of labels

    (dimensions) • Ingest ◦ Ingest as is - difficult to query ◦ Materialize all keys upfront ▪ Dynamic nature makes it challenging ▪ Sparse nature makes it costly • Query: ◦ Complex extraction logic ◦ High query fanout SELECT jsonExtractScalar(labels, '$.org_id'), jsonExtractScalar(labels, '$.table), SUM(value) FROM startree_metrics_analytics WHERE name IN ('pinot_broker_queryExecution_Count') AND timestamp > 1714608005000 and timestamp < 1714608005000 GROUP BY jsonExtractScalar(labels, '$.org_id'), jsonExtractScalar(labels, '$.table) LIMIT 10
  13. Logs data Common Challenges with Logs Data • High data

    volume, high storage cost • Long retention • Text search queries SELECT message FROM logs WHERE timestamp > '1714608005000' AND timestamp > '1714608005000' AND level = 'WARN' AND REGEXP_LIKE(message, 'ip 10.50.* time_ms=100.*') LIMIT 100;
  14. Trace data Common Challenges with trace data • Complex ingest

    • Storing semi-structured data • Complex json extraction queries
  15. Storage & Query Data store High Volume High Retention High

    Variety High Velocity High Query Complexity High Freshness
  16. Pinot as a backend for observability Services Agent Services Agent

    Services Agent Collection Storage & Query Viz. Agents OTEL format • Scalable, fresh and reliable ingestion • Pluggable decoders: Prometheus, JSON, OTEL • Pluggable encoders: CLP • Specialized data types: MAP • Specialized indexes: Text, Json, Sparse, Inv • Viz. tool connectors: Grafana
  17. Real-time streaming systems <-> Pinot integration • Scalable, fresh, reliable

    ingestion from real-time streaming systems • Pluggable decoders for various formats • Partition-aware ingestion
  18. Handling observability data in Pinot Timestamps Metric name Metric value

    Dimensions Log lines Traces Data types & Encoding Dictionary Var length dictionary Raw MAP CLP Json Indexing Timestamp Index Inverted index Sorted index Range Index Inverted index Text index Json index Data layout Partitioning
  19. The power of indexing Range • Fast range filtering on

    numeric columns using range of values to docIds mapping E.g. finding requests with latency between 100ms and 500ms. Timestamp index • Materialize and index different granularities of a timestamp • Override query predicates E.g. find metrics in time range Sorted • Sort on column frequently in query • Increase data locality • Reduces time to scan E.g. sort on metric name Inverted • Fast filtering using value to docIds mapping E.g. filter on attributes like level, class name
  20. Handling observability data in Pinot Timestamps Metric name Metric value

    Dimensions Log lines Traces Data types & Encoding Dictionary Var length dictionary Raw MAP CLP Json Indexing Timestamp Index Inverted index Sorted index Range Index Inverted index Text index Json index Data layout Partitioning
  21. Partitioning by space and time Pinot Broker Query on metricName

    , 1 2 5 6 9 10 Server 1 Server 2 Server 3 3 4 7 8 11 12 9 10 11 12 Broker level pruning 9 11 Server level pruning 1 2 3 4 5 6 7 8 9 10 11 12 Total segments to process Server 1 Server 2 Server 3 Partition 1, 2, 3 Partition 4, 5, 6 Partition 7, 8, 9, 10 Partition column = metricName Num partitions = 10
  22. Handling observability data in Pinot Timestamps Metric name Metric value

    Dimensions Log lines Traces Data types & Encoding Dictionary Var length dictionary Raw MAP CLP Json Indexing Timestamp Index Inverted index Sorted index Range Index Inverted index Text index Json index Data layout Partitioning
  23. MAP type - Ease of use Flexible Map type for

    metric data • Ease of ingestion • Smart storage: ◦ Store dense keys as dedicated column ◦ Store parse keys in EAV format • Simplified queries SELECT labels['org_id'], labels['table'], sum(value) FROM startree_metrics_analytics … GROUP BY labels['org_id'], labels['table'] docId: EAVs.. 0: key1|int|100, key18|string|foo 1: key2|long|2635822439, key999|float|0.5, key45|int|8 … "fieldConfigList": [{ "name": "tags", "encodingType": "RAW", "indexes": { "forward": { "mapIndexConfig": { "denseKeys": ["foo", "bar"] } } } }]
  24. MAP type - Smart storage "fieldConfigList": [{ "name": "tags", "encodingType":

    "RAW", "indexes": { "forward": { "mapIndexConfig": { "dynamicallyCreateDenseKeys": true, "maxKeys": 300, } } } }]
  25. MAP type - Query performance • Low storage footprint •

    Good Performance for scans on sparse keys • Poor performance on dense key scans All Columns Stored as Sparse All Columns Stored as Dense • Very High storage footprint • Good performance across all
  26. Handling observability data in Pinot Timestamps Metric name Metric value

    Dimensions Log lines Traces Data types & Encoding Dictionary Var length dictionary Raw MAP CLP Json Indexing Timestamp Index Inverted index Sorted index Range Index Inverted index Text index Json index Data layout Partitioning
  27. Log Compression with CLP Log line: 2024-05-01T00:07:45.000 INFO [BrokerRequestHandler] Broker

    pinot-broker_7001 took 20 ms to execute requestId 72 on table foo_OFFLINE Dictionary variables Non-dictionar y variables Log Type [pinot-broker_7001, foo_OFFLINE] [20, 72] Broker \x11 took \x12 ms to execute requestId \x12 on table \x11 CLP encoding for log lines in Pinot • Tokenize the phrase CLP is a compressor designed to encode unstructured log messages in a way that makes them more compressible while retaining the ability to search them • Extract values • Construct log type
  28. Log Compression with CLP Query: SELECT message FROM logs WHERE

    regexp_like(.* on table foo_OFFLINE) Dictionary variables Non-dictionary variables Log Type [foo_OFFLINE] [] on table \x11 Querying CLP encoded columns in Pinot Process search phrase in the same way that log string is compressed: • Tokenize the phrase • Extract variable values • Construct the log type
  29. Log Compression with CLP Ref: https://www.uber.com/blog/reducing-logging-cos t-by-two-orders-of-magnitude-using-clp/ 300MB csv file

    with Helix logs → 9MB Pinot segment 400k records → 300 log types * Compression keeps increasing with data size, as log types typically keep repeating Compression ratio results Reference: https://www.uber.com/blog/reducing-l ogging-cost-by-two-orders-of-magnit ude-using-clp/
  30. StarTree as a backend for observability Services Agent Services Agent

    Services Agent Collection Viz. Agents OTEL format Storage & Query Pinot • Scalable, fresh and reliable ingestion • Pluggable decoders: Prometheus, JSON, OTEL • Pluggable encoders: CLP • Specialized data types: MAP • Specialized indexes: Text, Json, Sparse, Inv • Viz. tool connectors: Grafana Tier Storage • Low cost to serve • Long retention • Large volumes BYOC • No data transfer • Secure
  31. Pin indexes locally Brokers Brokers Server 1 Server 2 Server

    3 Server 4 Object Store Pinot segment Metadata & indexes
  32. Column / Block level reads ◦ NO lazy loading ◦

    Selective columnar fetch ◦ Block fetch Pinot Server Object Store SELECT sum(impressions) FROM table WHERE region = ‘foo’ Columnar fetch: region.dict, region.inv_idx, impressions.fwd, Block fetch: region.inv impressions.fwd browser.fwd_idx browser.inv_idx browser.dict region.inv_idx region.fwd_idx region.dict country… … … impressions.fwd_idx impressions.dict cost.. … timestamp.. .. columns.psf
  33. Run details Latency Baseline - Columnar fetch > 60s Enabling

    block reads <1 s Querying Logs on Cloud Native Storage • 100GB logs, 500 segments, 200 million records • Query all 500 segments, 10k rows • Pinned locally = FST + inverted index header (1GB total)
  34. Bring Your Own Cloud deployment • No VPC peering •

    Principle of least privilege • Data Security / Governance • Fully managed • Cost effective