Upgrade to Pro — share decks privately, control downloads, hide ads and more …

Observability: the new incompetence

Observability: the new incompetence

Why you need monitoring, and how to get started with Sensu and Graphite.

Elliot Murphy

August 15, 2013
Tweet

More Decks by Elliot Murphy

Other Decks in Programming

Transcript

  1. Observability
    The new incompetence
    Part 1: Open your eyes

    View Slide

  2. Basic competency as
    a product dev team
    • Version control
    • Appropriate databases
    • Test suite; green, deployable trunk
    • Secure handling of passwords, credit
    cards
    • Timely security patching

    View Slide

  3. Pointless if you can’t keep
    the product running.

    View Slide

  4. Examples
    (yes, I’ve made every
    one of these mistakes)

    View Slide

  5. Hey, the site is down!
    Uhh...our website?
    (45 minutes later) OK I made more
    room on the disk and restarted.

    View Slide

  6. “BTW, looks like our storage
    costs are growing at $1500 
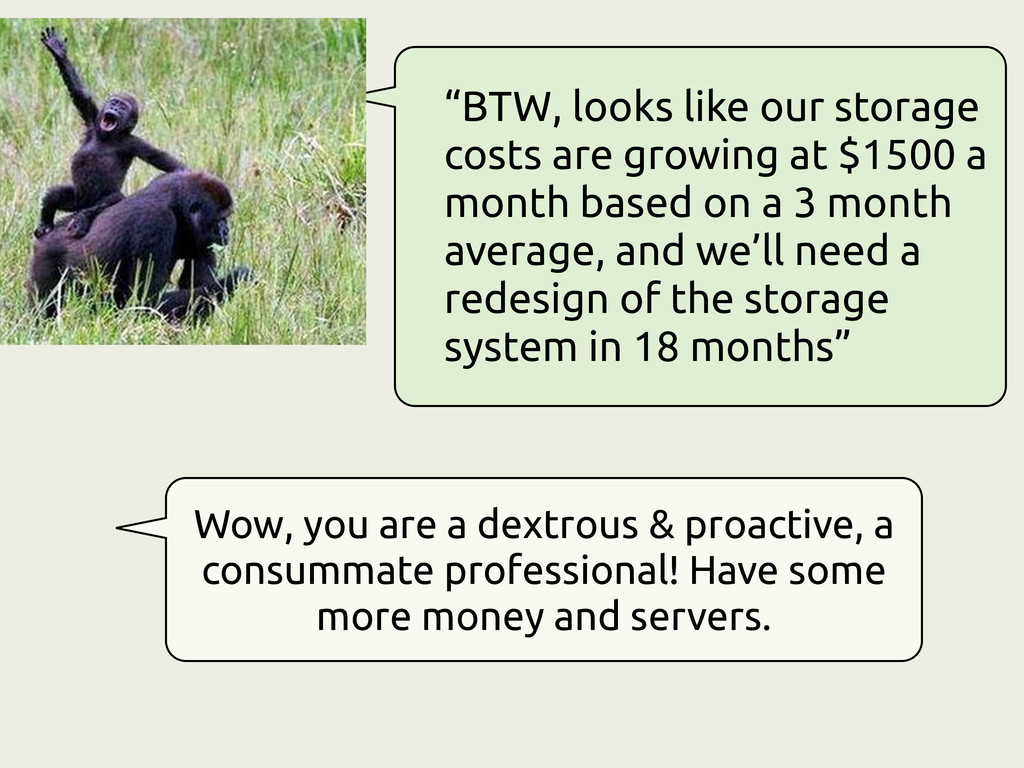
a
    month based on a 3 month
    average, and we’ll need a
    redesign of the storage
    system in 18 months”
    Wow, you are a dextrous & proactive, a
    consummate professional! Have some
    more money and servers.

    View Slide

  7. Uhh...it’s working in dev. Are you sure
    they are using it correctly?
    Yup, we have seen 37
    crashes this morning.
    Looks like users with
    Cyrillic names are
    affected. ETA on a fix
    is less than one hour.
    Hey, users are reporting a crash
    when updating their profile...

    View Slide

  8. The site seems slow
    Uhh...well we’ve been writing a lot 
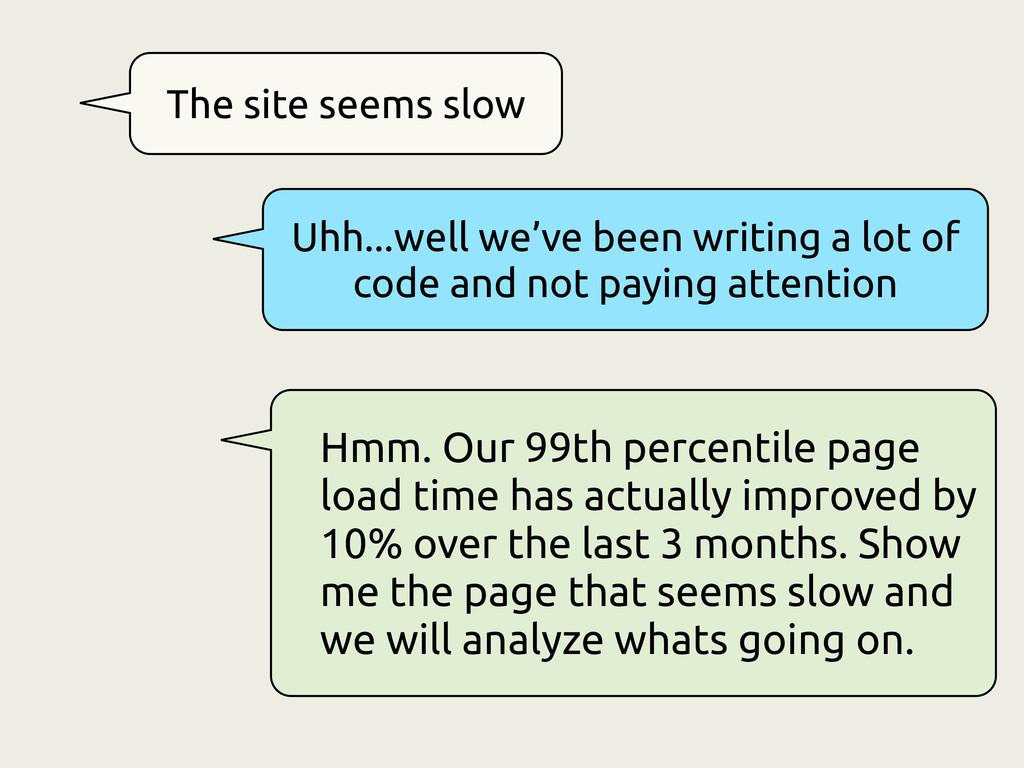
of
    code and not paying attention
    Hmm. Our 99th percentile page
    load time has actually improved by
    10% over the last 3 months. Show
    me the page that seems slow and
    we will analyze whats going on.

    View Slide

  9. You need monitoring
    MONITORS, LOTS OF MONITORS.
    MONITORS ARE FOR EXPLORATION/ANALYSIS
    HUMANS STINK AT WATCHING COMPUTERS
    SHOULD BE IMPOSSIBLE FOR BOSS, INVESTORS,
    USERS TO BE THE FIRST TO NOTIFY YOU.

    View Slide

  10. YOUR JOB IS TO RESPOND, NOT TO REACT.

    View Slide

  11. What is monitoring
    • Critical/Warn/OK monitoring
    • Trending over time, 
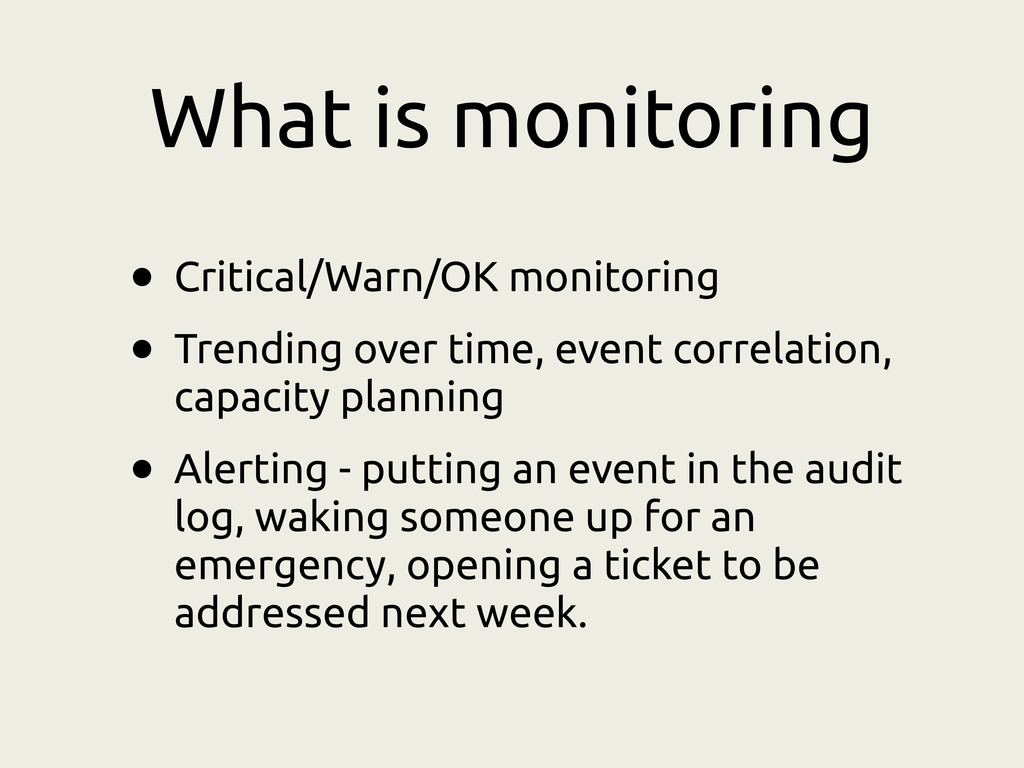
event correlation,
    capacity planning
    • Alerting - putting an event in the audit
    log, waking someone up for an
    emergency, opening a ticket to be
    addressed next week.

    View Slide

  12. What can we watch?
    • Business or application level metrics -
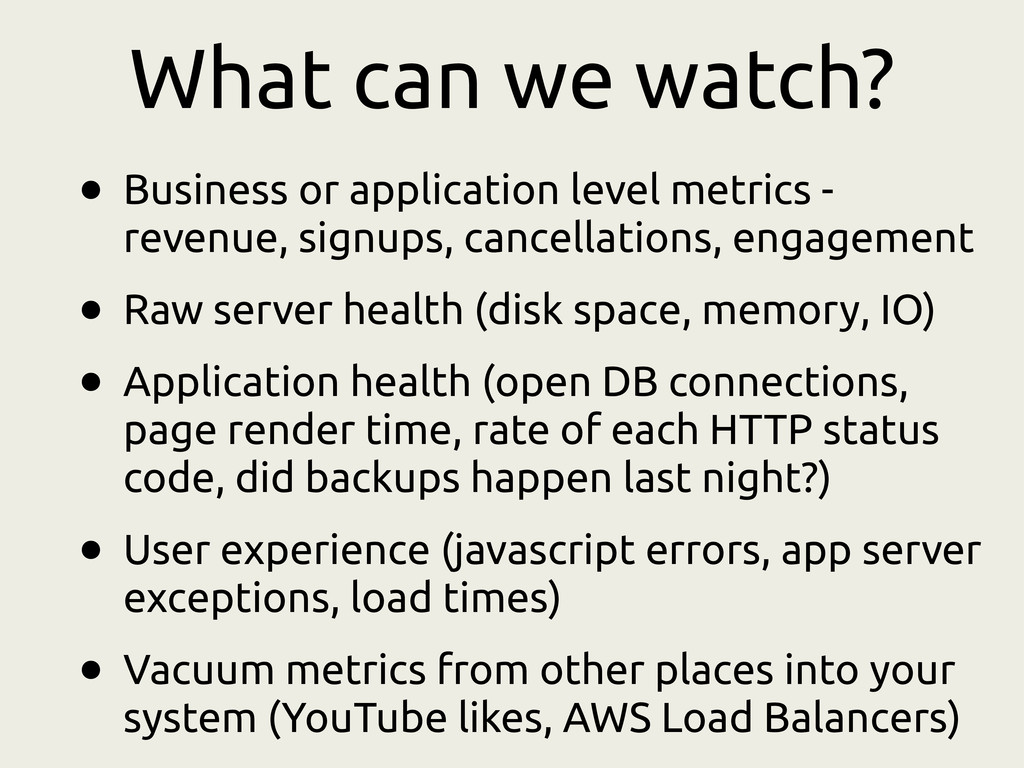
    revenue, signups, cancellations, engagement
    • Raw server health (disk space, memory, IO)
    • Application health (open DB connections,
    page render time, rate of each HTTP status
    code, did backups happen last night?)
    • User experience (javascript errors, app server
    exceptions, load times)
    • Vacuum metrics from other places into your
    system (YouTube likes, AWS Load Balancers)

    View Slide

  13. Blank sheet of paper
    is scary paralyzing

    View Slide

  14. Do you want to spend
    time or money?
    • “lean”, maybe only contract devs - just use a
    bunch of SaaS products. Valid approach.
    • Bootstrapping?
    • HIPAA or PCI data protection?
    • Any fulltime devs?
    • Consider running some of your own
    monitoring tools. Business folks love ‘em too

    View Slide

  15. Running your own
    • Sensu
    • Sensu-community-plugins
    • Graphite, Descartes, Tasseo
    • Pagerduty or OpsGenie for alerting
    • Logstash, Kibana (http://kibana.org/
    infrastructure.html, needs sensu)
    • Vagrant+Chef for config management
    Start
    HERE

    View Slide

  16. Part 2: Sensu+Graphite
    • Sensu is a monitoring framework.
    Successor 
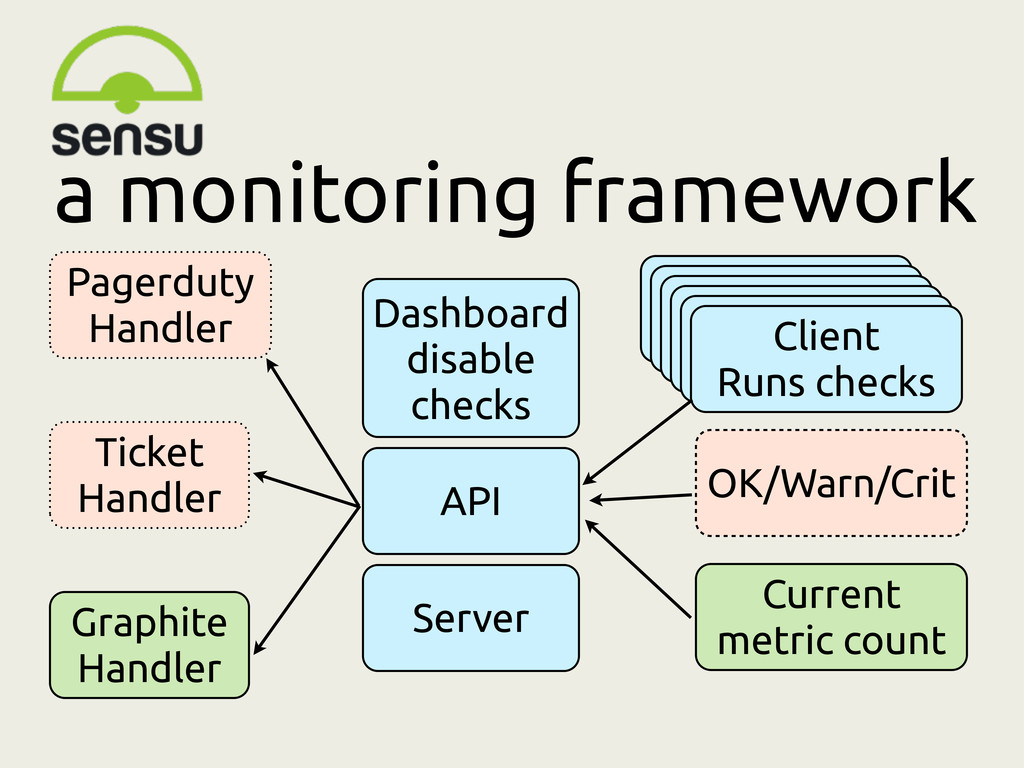
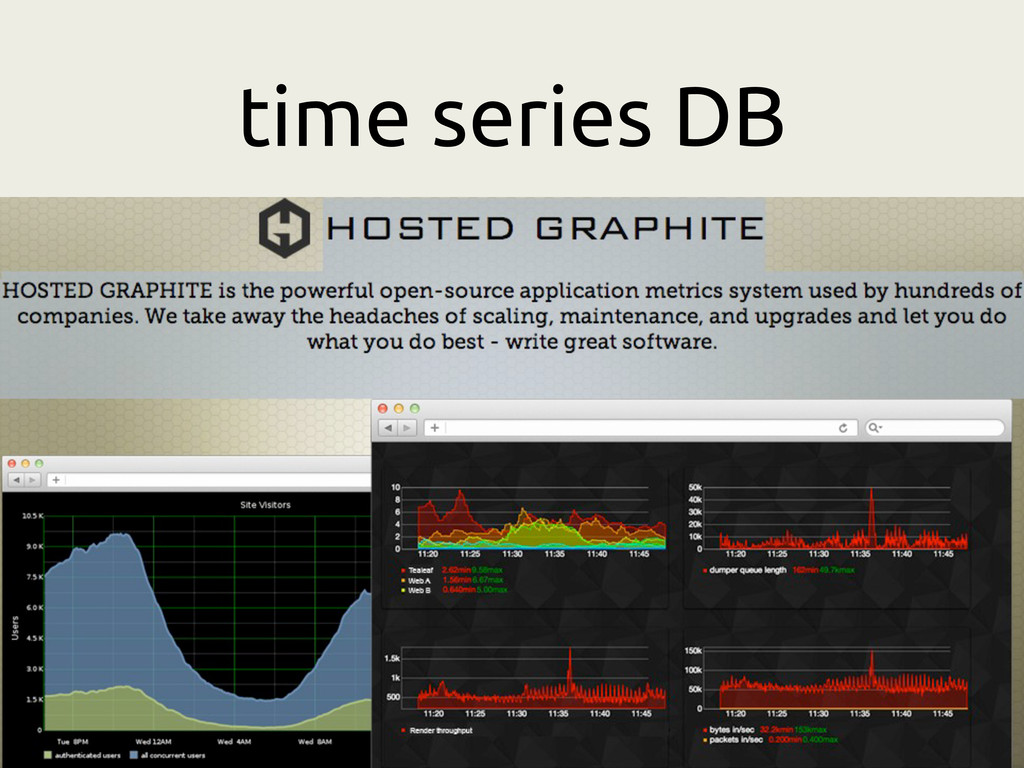
to Nagios, emerged from
    needs of cloudy app architecture.
    #monitoringsucks
    • Graphite is a time series database.
    Successor to RRD, originally written at
    orbitz.com. Amazingly flexible, surging
    in popularity (Github, hosted services)

    View Slide

  17. a monitoring framework
    Server
    Client
    Runs checks
    Pagerduty
    Handler
    Ticket
    Handler API
    Dashboard
    disable
    checks
    Client
    Runs checks
    Client
    Runs checks
    Client
    Runs checks
    Client
    Runs checks
    Client
    Runs checks
    OK/Warn/Crit
    Current
    metric count
    Graphite
    Handler

    View Slide

  18. time series DB

    View Slide

  19. Recording events
    • deploy happened
    • marketing email sends
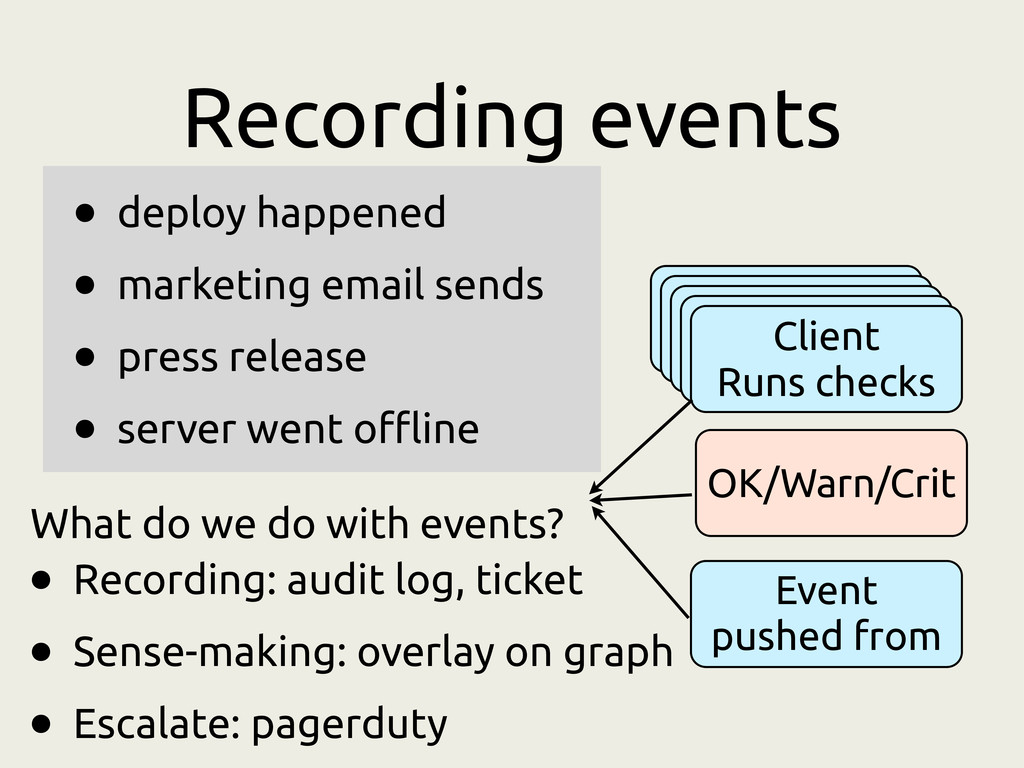
    • press release
    • server went offline
    What do we do with events?
    Event
    pushed from
    Client
    Runs checks
    Client
    Runs checks
    Client
    Runs checks
    Client
    Runs checks
    Client
    Runs checks
    OK/Warn/Crit
    • Recording: audit log, ticket
    • Sense-making: overlay on graph
    • Escalate: pagerduty

    View Slide

  20. Recording metrics
    • free disk space
    • page load times
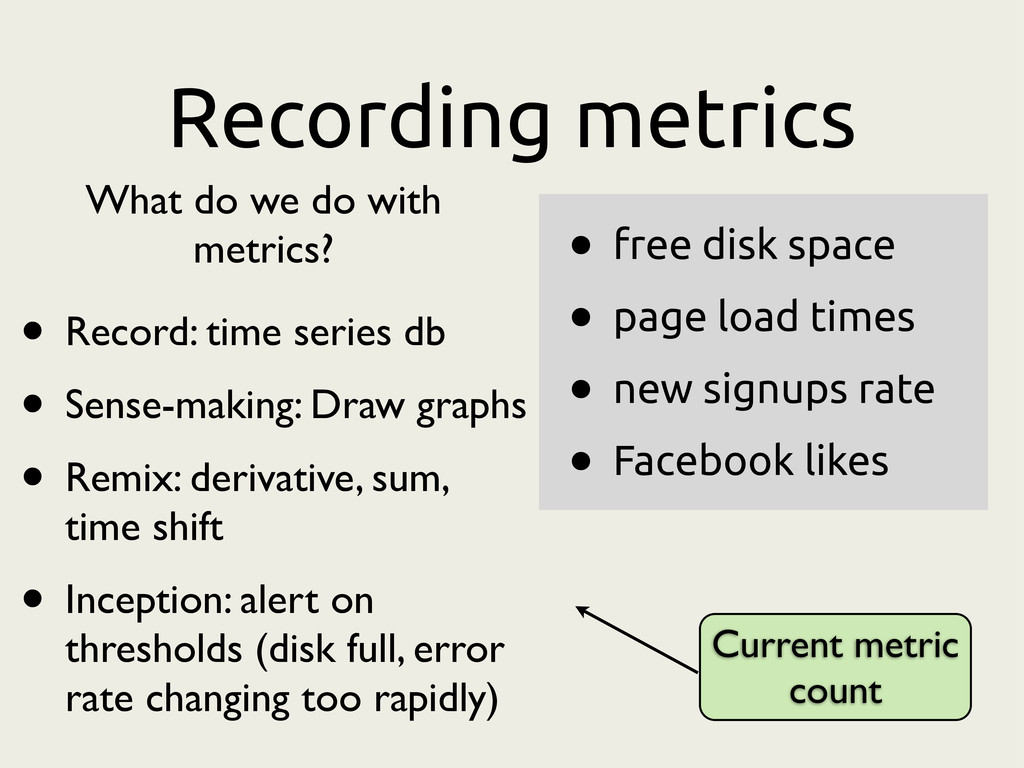
    • new signups rate
    • Facebook likes
    Current metric
    count
    • Record: time series db
    • Sense-making: Draw graphs
    • Remix: derivative, sum,
    time shift
    • Inception: alert on
    thresholds (disk full, error
    rate changing too rapidly)
    What do we do with
    metrics?

    View Slide

  21. Publishing metrics
    from your app
    Run statsd in front of 
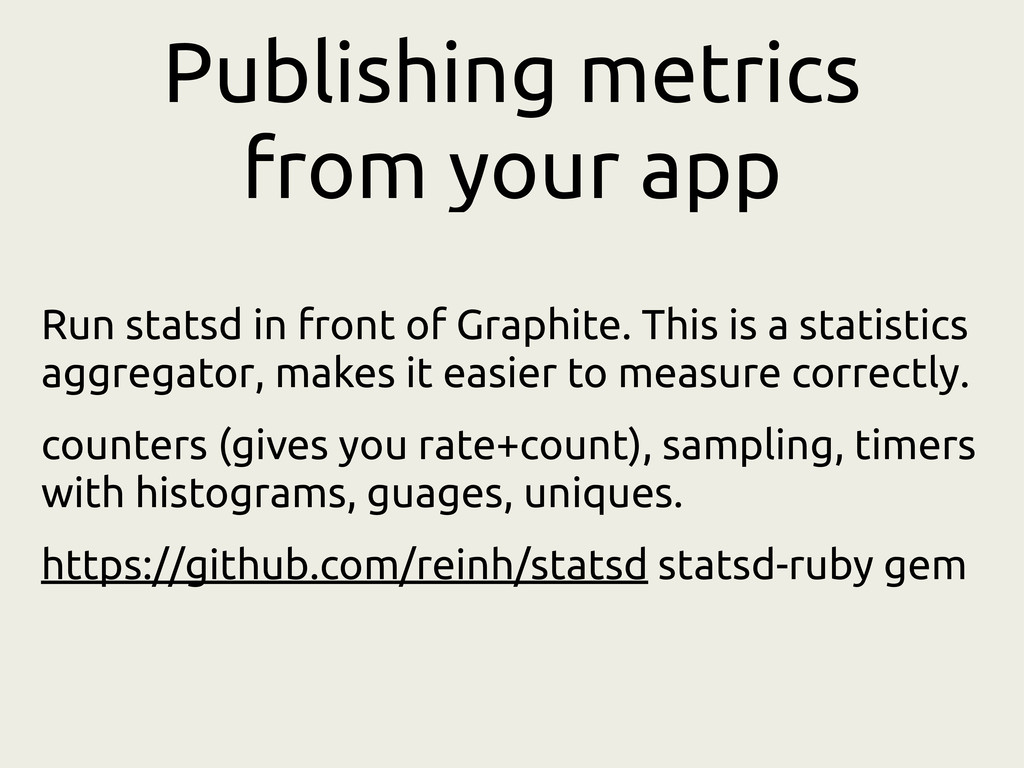
Graphite. This is a statistics
    aggregator, makes it easier to measure correctly.
    counters (gives you rate+count), sampling, timers
    with histograms, guages, uniques.
    https://github.com/reinh/statsd statsd-ruby gem

    View Slide

  22. View Slide

  23. View Slide

  24. View Slide

  25. View Slide

  26. View Slide

  27. Cassandra
    Apache
    DNS
    elasticsearch
    files
    graphite
    haproxy
    hbase
    java
    logging
    lxc
    memcached
    mongodb
    pingdom
    opsgenie
    percona
    postfix
    snmp
    solr
    twilio
    youtube
    aws
    varnish
    postgres
    redis riak
    rabbitmq
    processes

    View Slide

  28. • This is a lot of moving parts
    • You 
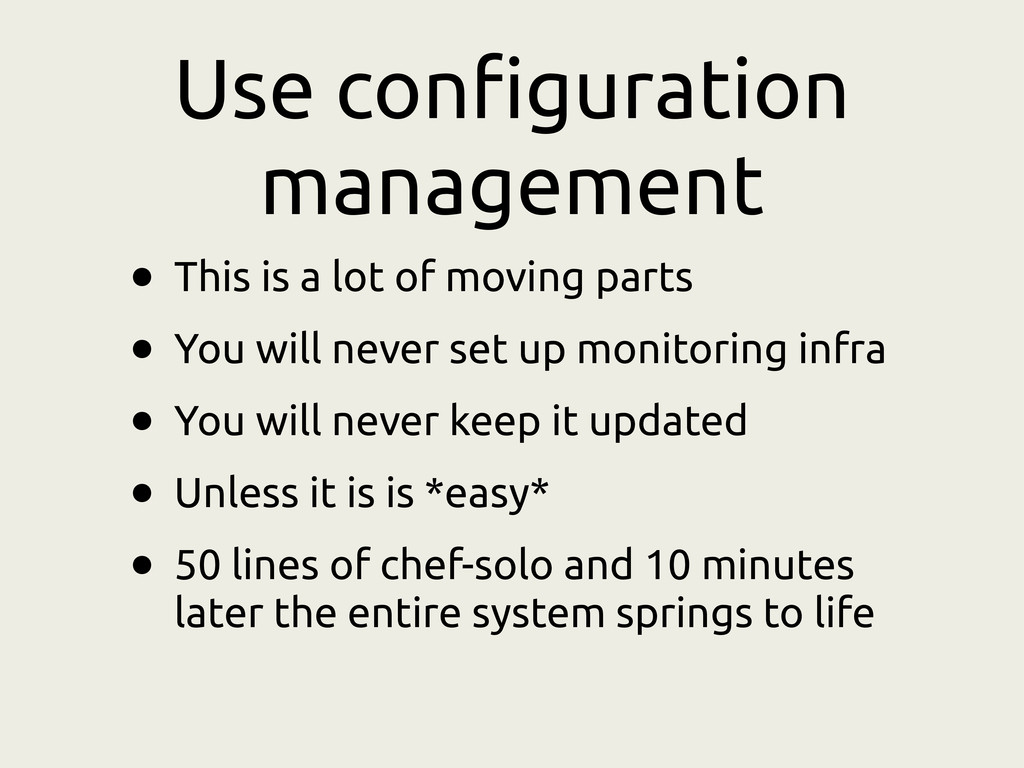
will never set up monitoring infra
    • You will never keep it updated
    • Unless it is is *easy*
    • 50 lines of chef-solo and 10 minutes
    later the entire system springs to life
    Use configuration
    management

    View Slide

  29. links
    https://speakerdeck.com/statik/observability-
    the-new-incompetence
    http://sensuapp.com/
    https://github.com/sensu/sensu-community-
    plugins
    http://graphite.wikidot.com/
    http://animals-riding-animals.tumblr.com/

    View Slide