Upgrade to Pro — share decks privately, control downloads, hide ads and more …

Popular Data Visualization

strajk
October 01, 2012

Popular Data Visualization

Popular Data Visualization based on vision of Hans Rosling
For school course FI/PA055 Visualizing Complex Data
Made in Adobe InDesign

strajk

October 01, 2012
Tweet

More Decks by strajk

Other Decks in Design

Transcript

  1. FACT-BASED WORLD Data is everywhere around us, but they are

    noisy hypes and anomalies inaccurate data incomplete data irrelevant data noise – opposite of information
  2. FACT-BASED WORLD Data is everywhere around us, but they are

    in complex format many formats xls / csv / xlsx / rtf / xml / json / unstructured preprocessing needed cleaning, normalization, transformation, feature extraction understanding data mining, machine learning
  3. FACT-BASED WORLD Data is everywhere around us, but they doesn’t

    make sense wrong algorithms used wrong correlations presumed cannot uncover meaning
  4. FACT-BASED WORLD Data is everywhere around us, and they are

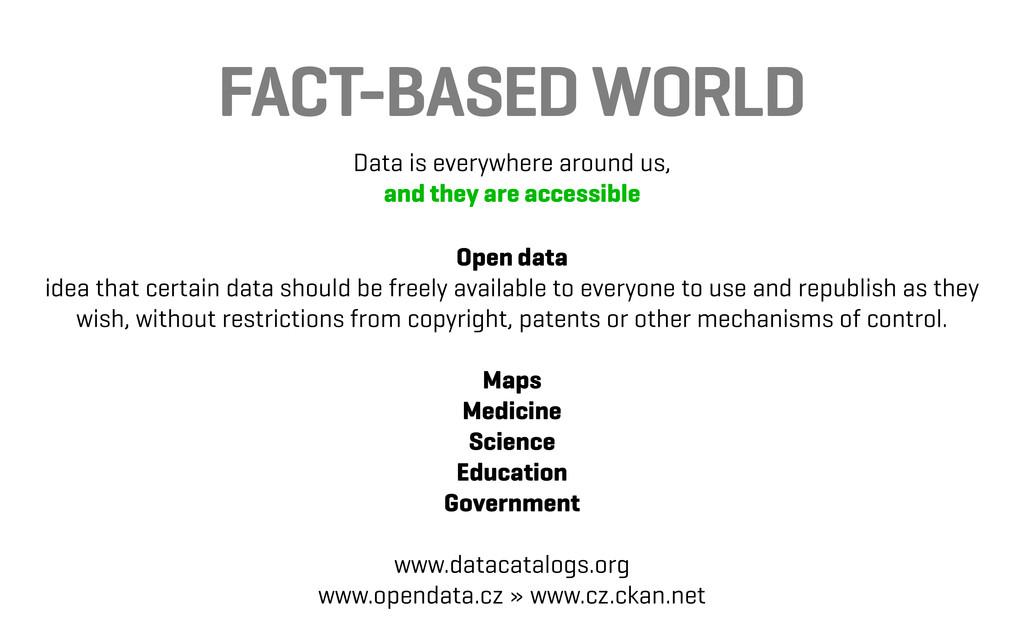
    accessible Open data idea that certain data should be freely available to everyone to use and republish as they wish, without restrictions from copyright, patents or other mechanisms of control. Maps Medicine Science Education Government www.datacatalogs.org www.opendata.cz » www.cz.ckan.net
  5. FACT-BASED WORLD Data is everywhere around us, and we have

    computing power Google Excel Illustrator R Weka SAS Ruby GapMinder ...
  6. GOAL See world in perspective Use statistics to test hypothesises

    Fit a statistical model and predict future Make sense of data and understand life and universe
  7. GOAL Features Measures Methods Mean Density Distribution Error Deviation Confidence

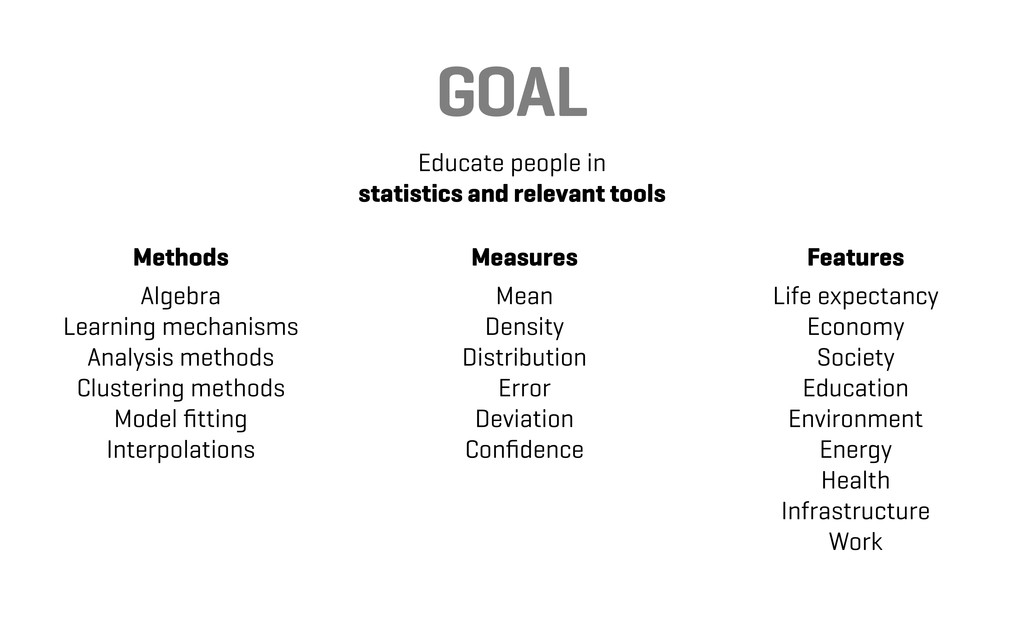
    Algebra Learning mechanisms Analysis methods Clustering methods Model fitting Interpolations Life expectancy Economy Society Education Environment Energy Health Infrastructure Work Educate people in statistics and relevant tools
  8. ULTIMATE GOAL Improve health Help developing countries Stabilize economics Improve

    mainstream education Find most efficient solutions Use produced information for our benefit and use it when planning
  9. TOOLS Use power of modern technologies to enable people to

    use statistics as easy as shopping at Amazon