Upgrade to Pro — share decks privately, control downloads, hide ads and more …

Weka steps for logistic regression

Avatar for sudhakar_c sudhakar_c
September 23, 2016

Weka steps for logistic regression

Machine learning in WEKA

Avatar for sudhakar_c

sudhakar_c

September 23, 2016
Tweet

Other Decks in Technology

Transcript

  1. Index • WEKA Introduction • WEKA file formats • Loading

    data • Univariate analysis • Data Manipulation • Feature Selection • Creating Training, Validation and Test Sets • Model Execution - Logistic Regression • Model Analysis - ROC Curve • Model Analysis – Cost/Benefit Analysis • Re-apply model on new data • Weka Plus and Negatives
  2. Introduction • Weka is a collection of machine learning algorithms

    for data mining tasks • The algorithms can either be applied directly to a dataset or called from your own Java code. • ARFF – Attribute relation file format
  3. Univariate Analysis • Current Relation – Dataset name, number of

    records, number of attributes in dataset. • Attribute details- All attributes to select for univariate analysis
  4. Univariate Analysis • Selected attribute – • Provides information about

    attribute type, Missing values, Distinct values, etc.
  5. Data Manipulation • Changing data type of field • Missing

    values update • Creating BINS from data • Standardize data • Outlier Treatment • Creating new calculated fields
  6. 1. Convert NA to 0 • Flow > Preprocess >

    Edit > Right Click on Attribute > Replace Values
  7. 2. Changing data types of attribute • Flow > Preprocess

    > Filter > Choose > Filters > Unsupervised > Attribute >
  8. 3. Creating BINS • Flow > Preprocess > Filter >

    Choose > Filters > Unsupervised > Attribute > Discretize
  9. 3. Creating BINS • Provide attribute number, Number of BINs

    to be created and click on ‘Apply’
  10. 3. Creating Custom BINS • Flow > Preprocess > Filter

    > Choose > Filters > Unsupervised > Attribute > AddExpression • ifelse(a2 > 0, ifelse(a2 > 10,ifelse(a2 > 20,4, 3), 2), 1)
  11. 4. Standardize data • To convert all numeric attributes in

    data to zero mean and unit variance. • Flow > Preprocess > Filter > Choose > Filters > Unsupervised > Attribute > Standardize •
  12. 4. Standardize data- Log values • To convert specific numeric

    attributes to log. • Flow > Preprocess > Filter > Choose > Filters > Unsupervised > Attribute > Numeric Transform •
  13. 4. Standardize data- Log values • Provide value for attribute

    number which is to be converted to log value. • Also provide method name – log. Here we can provide any other methods such as abs,round,floor •
  14. 5. Identify Outliers • Flow > Preprocess > Filter >

    Choose > Filters > Unsupervised > Attribute > Interquartile Range • Outliers can be identified for separate attribute or for all together
  15. 5. Remove Outliers • Flow > Preprocess > Filter >

    Choose > Filters > Unsupervised > Instance > RemoveWithValues
  16. 5. Remove Outliers • Params : attributeIndices - Attribute number,

    NominalIndices=Nominal value of outlier in Outlier attribute
  17. 5. Transform Outliers • Flow > Preprocess > Filter >

    Choose > Filters > Unsupervised > Attribute > AddExpression – this option will create new field e.g : ifelse(a2 > 1000,200, 1) •
  18. 6. New Calculated fields • This is helpful In case

    any new field is to be derived from existing fields • Flow > Preprocess > Filter > Choose > Filters > Unsupervised > Attribute > Add Expression
  19. 6. New Calculated fields • This is helpful In case

    any new field is to be derived from existing fields • Provide expression/equation and new field name
  20. Creating data sets • For 60%-20%-20% • Step 1- •

    Flow > Preprocess > Filter > Choose > Unsupervised > Instance > Resample
  21. Creating data sets • Step 2- Parameters for resample •

    Flow > Preprocess > Filter > Choose > Unsupervised > Instance > Resample > • Check noReplacement = True, sample size percent – 60 > ok > Apply
  22. Creating data sets • Step 3 – Check • After

    apply we can check the current relation for number of records selected • • Step 4 – Save the result as filename_train.arff • Step 5 – Click on ‘Undo’ to get to original data set • Step 6 – Change the Resample parameters again • Parameters - > Invert selection = True, noReplacement = True, sampleSizePercent = 60
  23. Creating data sets • Step 8 – Don’t save the

    results • Step 9 – Open Resample parameters set below parameters • Invert selection = False, noReplacement = True, sampleSizePercent = 50 • OK > Apply Check the results
  24. Creating data sets • Step 10 – Check the results

    • Step 11 – Save the results as Test Data. • Step 13 – Click on Undo to get earlier 40% of dataset • Step 13 – Parameters invertSelection = True, noReplacement=True , sampleSizePercent = 50 • Step 14 – Ok > Apply • Step 15 – Save as Evaluation Data
  25. Creating data sets 2. Weka inbuilt – Flow > Classify

    > Test Options > Use Training Set – With this option selected data set will be used as training set to create model
  26. Creating data sets 2. Weka inbuilt – Flow > Classify

    > Test Options > Use Supplied Test Set – With this option selected data set will be used as test set to create model
  27. Creating data sets 2. Weka inbuilt – Flow > Classify

    > Test Options > Use Supplied Test Set – With this option selected data set will be used as test set to test model
  28. Creating data sets 2. Weka inbuilt – Flow > Classify

    > Test Options > Cross Validation – With this option selected data set will be divided into 10 folds create model internally and weka will take average of all these models to show final model on UI
  29. Creating data sets 2. Weka inbuilt – Flow > Classify

    > Test Options > Percentage Split – With this option selected data set will be divided into Training and Test set for model creation
  30. Model Analysis • Flow > Right Click on Model >

    Visualize threshold curve > ROC Curve
  31. Model Analysis- Cost Benefit Analysis • Flow > Classify >

    Right click model > Cost/Benefit Analysis
  32. Model Analysis- Cost/Benefit Analysis • Flow > Classify > Right

    click model > Cost/Benefit Analysis > Threshold Bar • Sliding the bar under Threshold label will change the accuracy and threshold curve
  33. Save prediction output to file • Flow > Classify >

    Test Options > More Options > Output Predictions > Text Bar to provide file name • Parameters: Choose: to provide file type, Attributes : First-last to get all fields, outPutFile : File name to save data
  34. WEKA Pluses: • Platform independent and portable, java library can

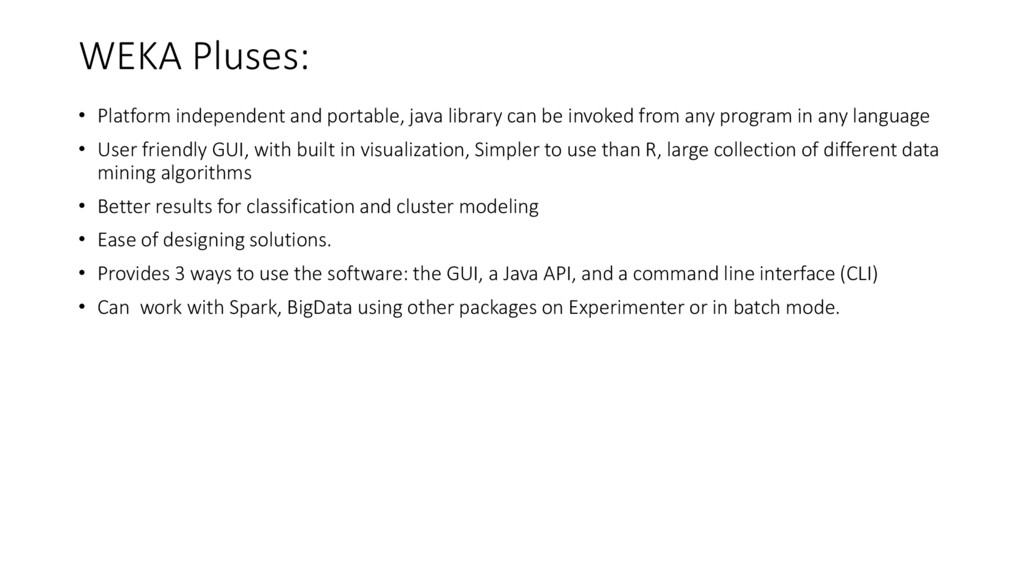
    be invoked from any program in any language • User friendly GUI, with built in visualization, Simpler to use than R, large collection of different data mining algorithms • Better results for classification and cluster modeling • Ease of designing solutions. • Provides 3 ways to use the software: the GUI, a Java API, and a command line interface (CLI) • Can work with Spark, BigData using other packages on Experimenter or in batch mode.
  35. WEKA Limitation: • Visualizations can be managed better in R

    with different packages like ggplot • Not really flexible for data manipulation • Accepts only limited file format lile CSV,ARFF • Limited documentation available on Explorer.