Upgrade to Pro — share decks privately, control downloads, hide ads and more …

Unlock Revenue with CRM Reports & Dashboards

SugarCRM
October 25, 2022

Unlock Revenue with CRM Reports & Dashboards

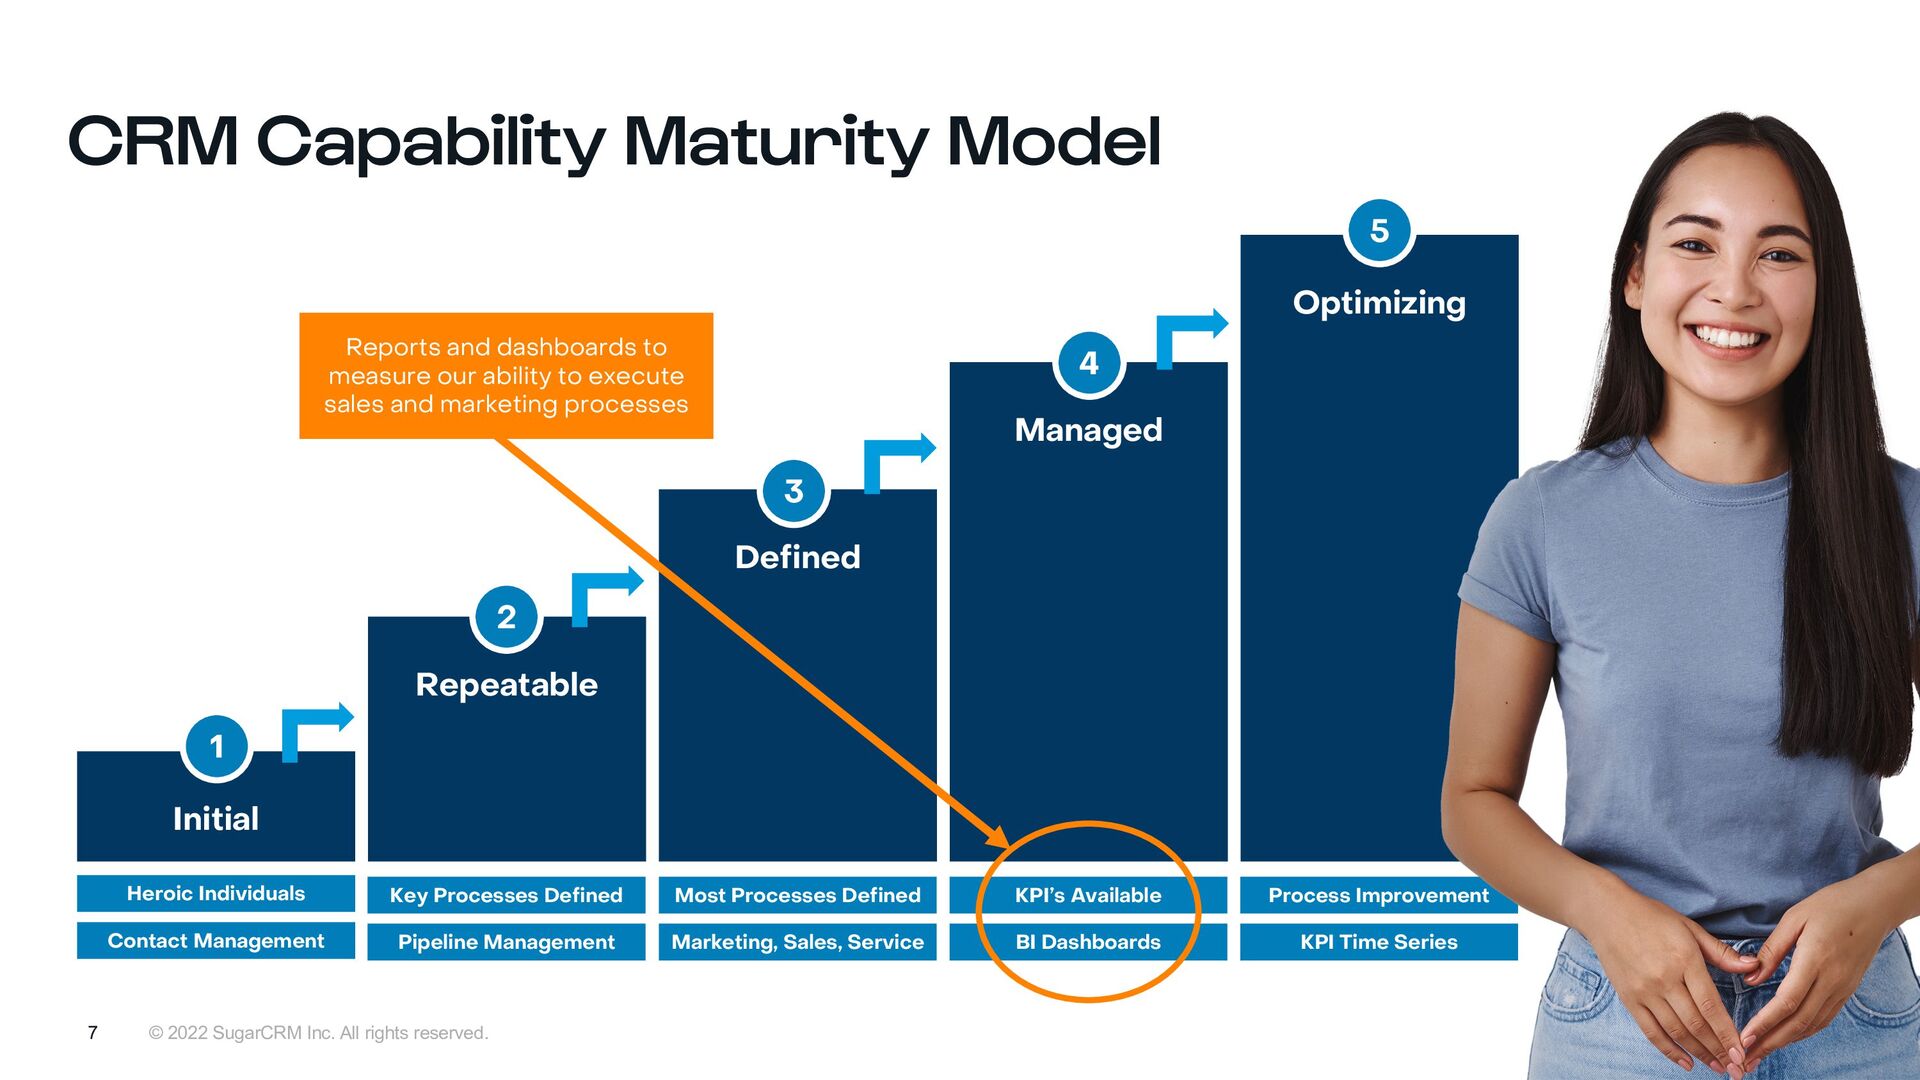
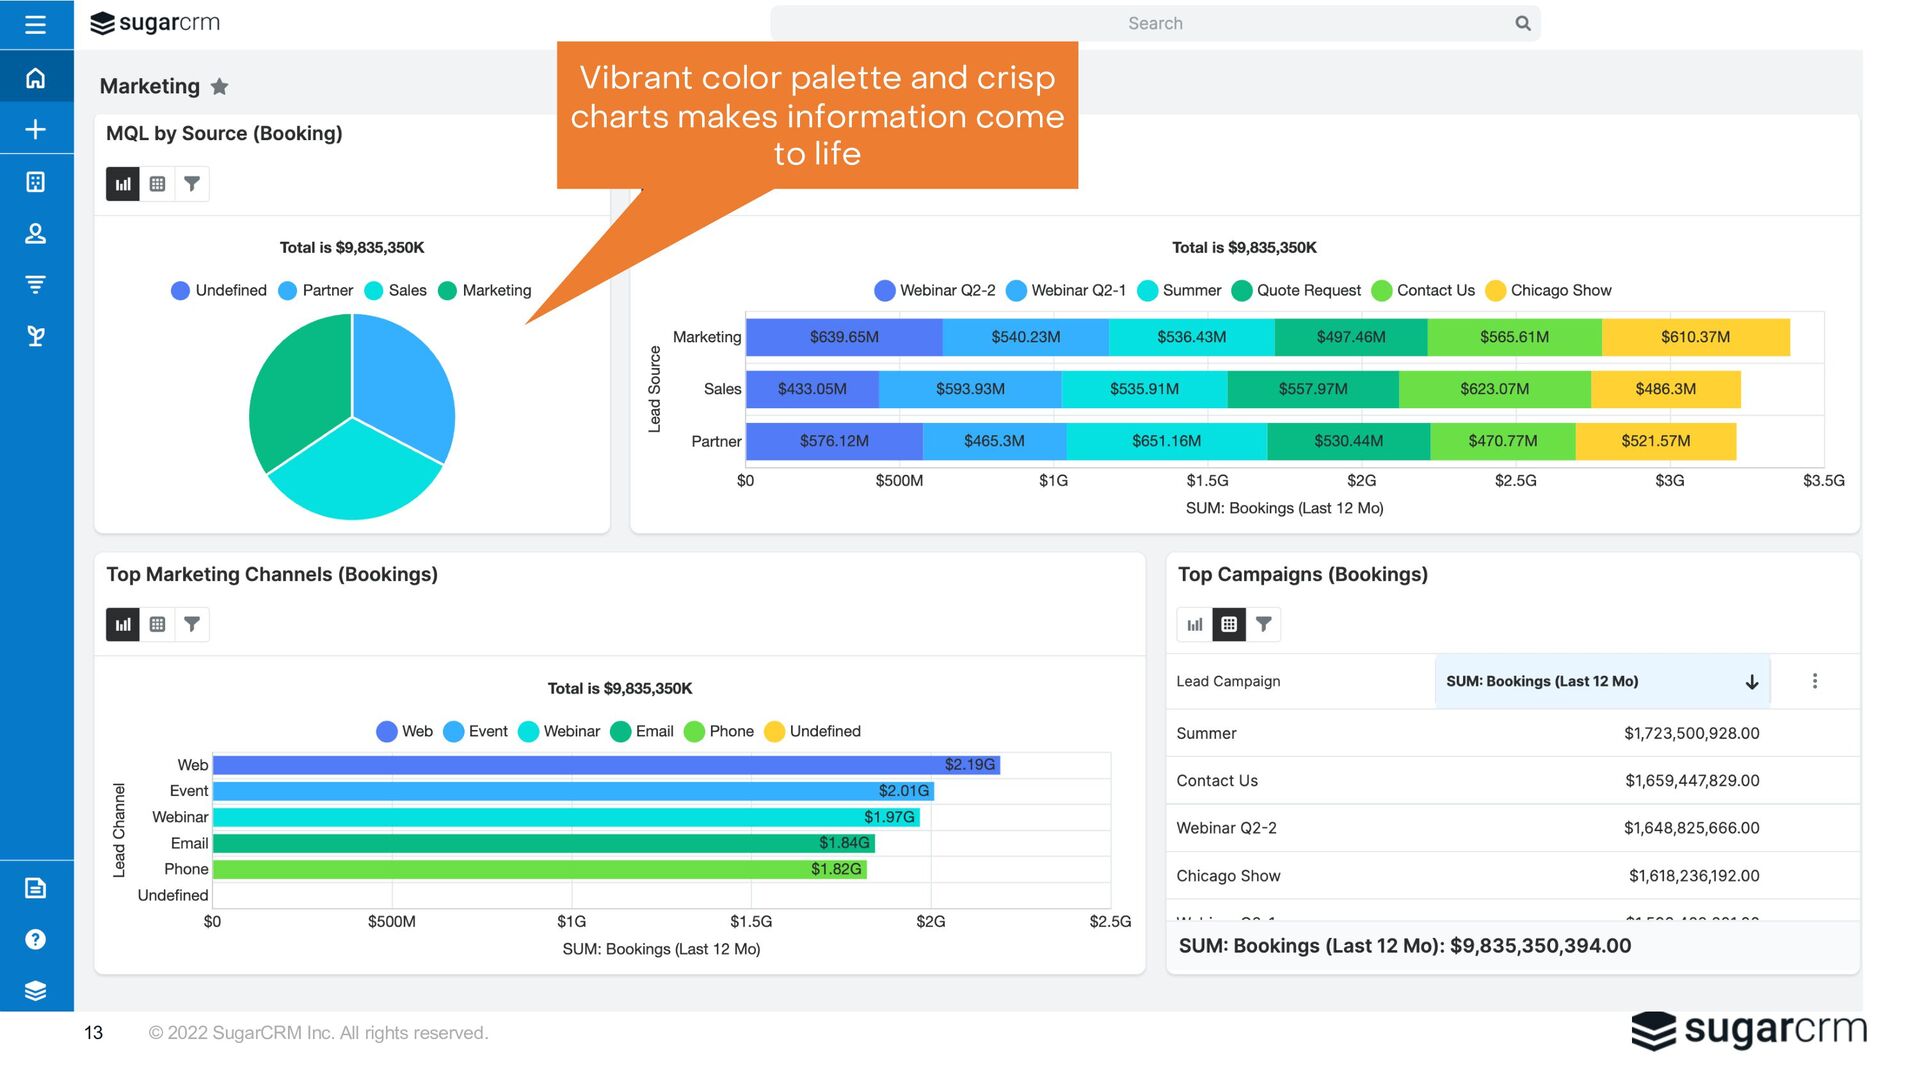
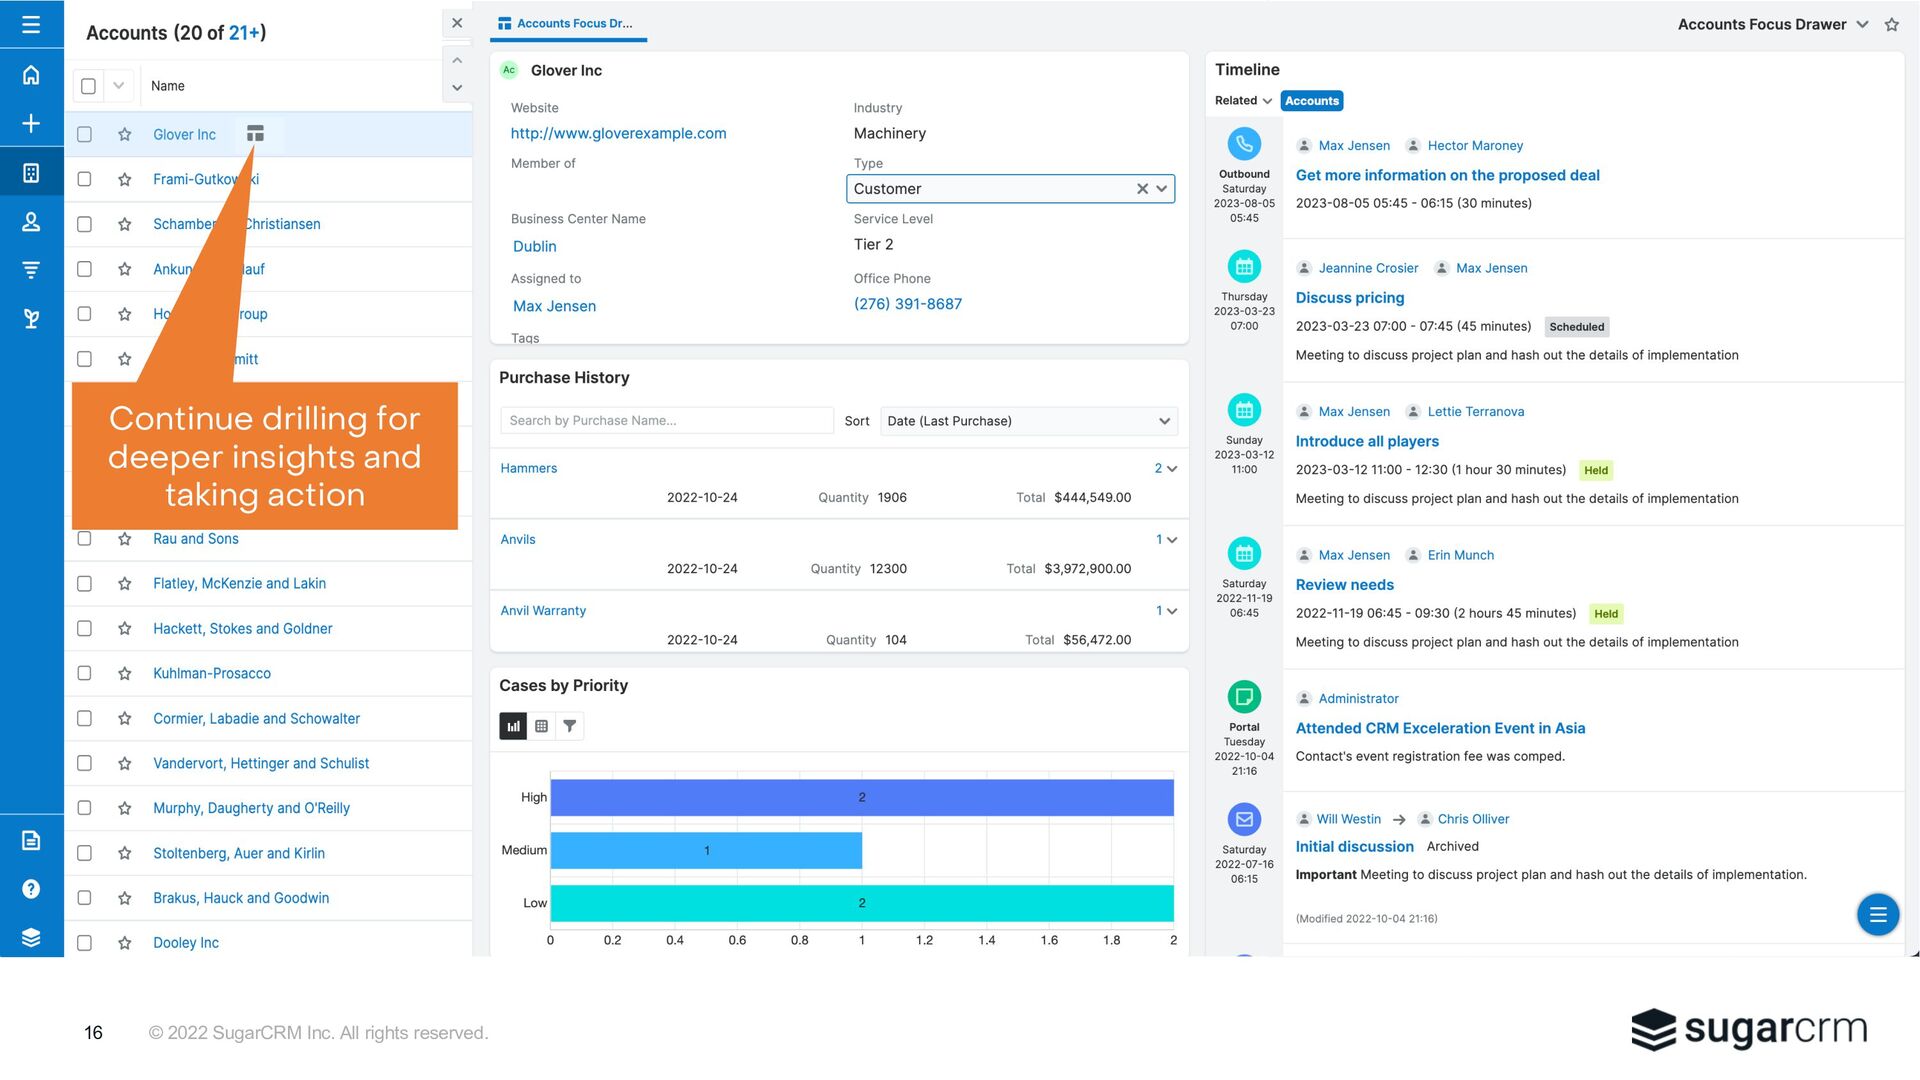
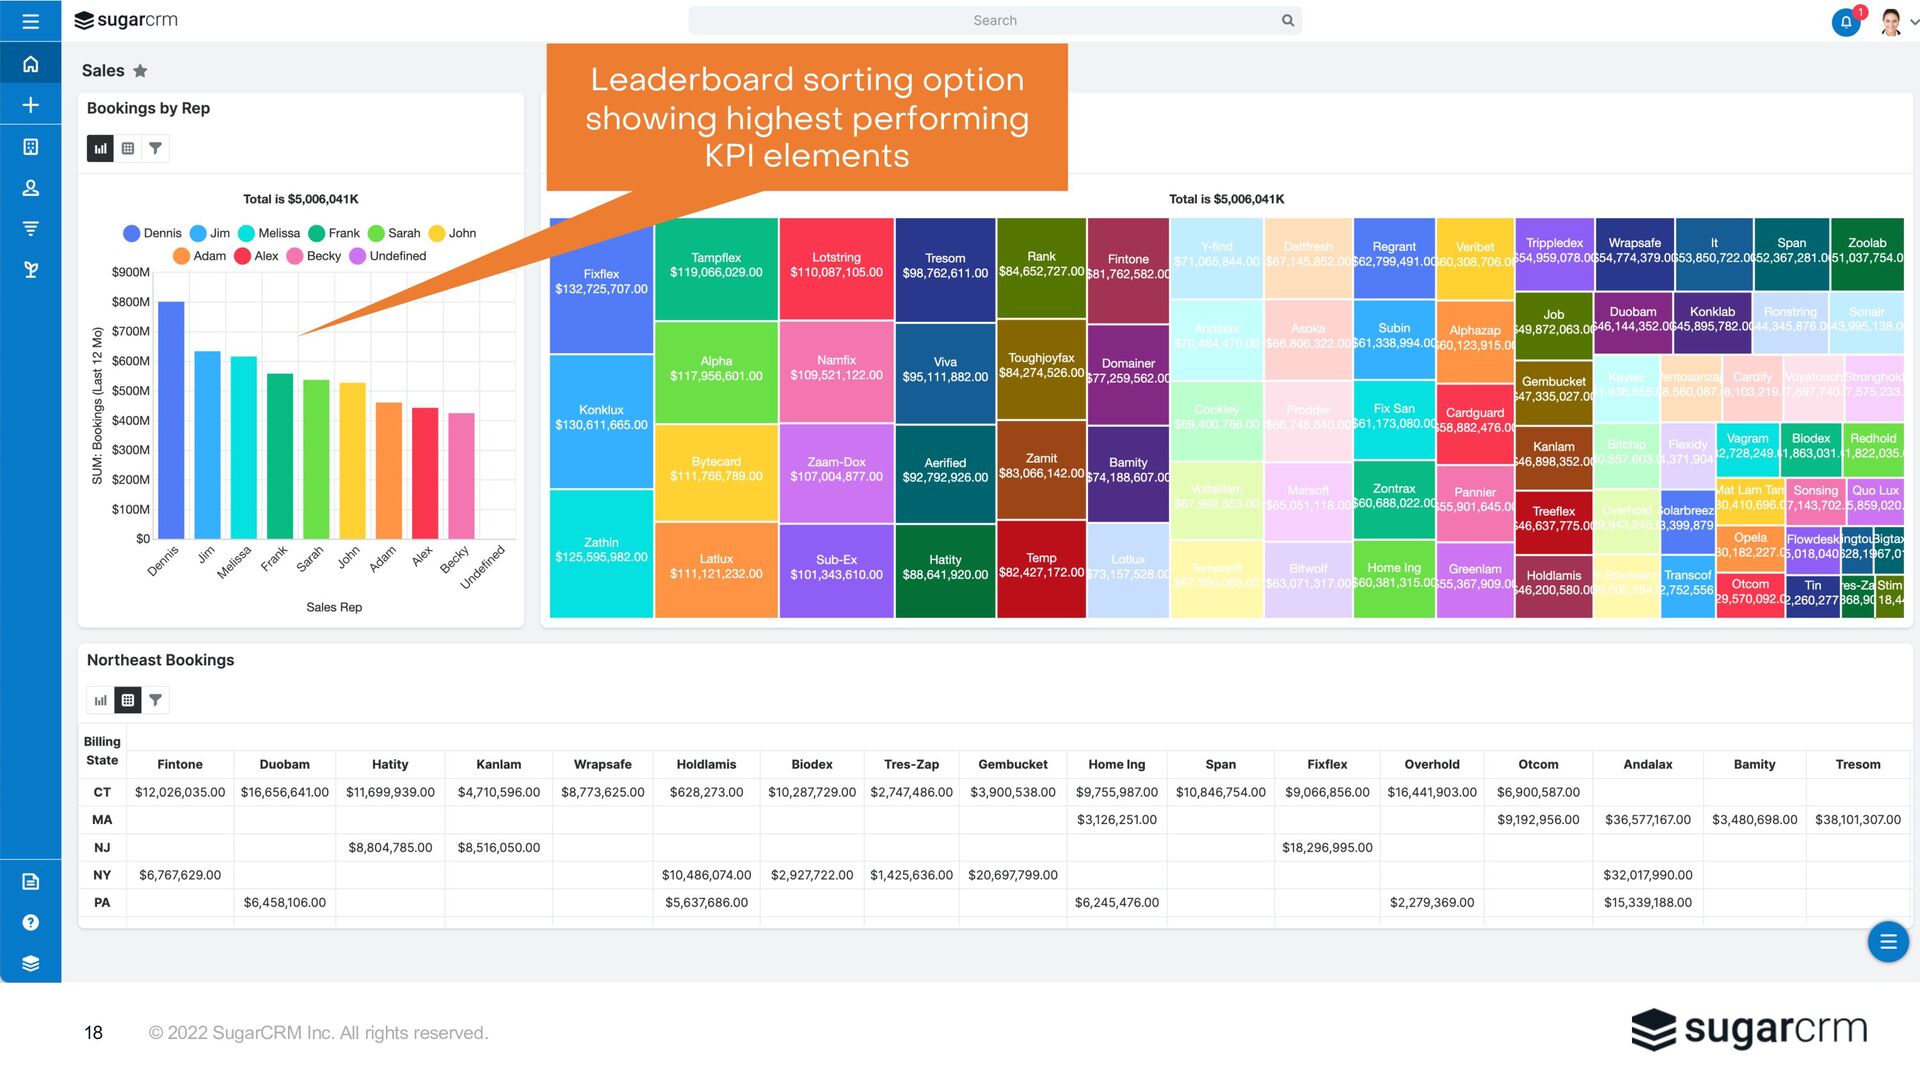
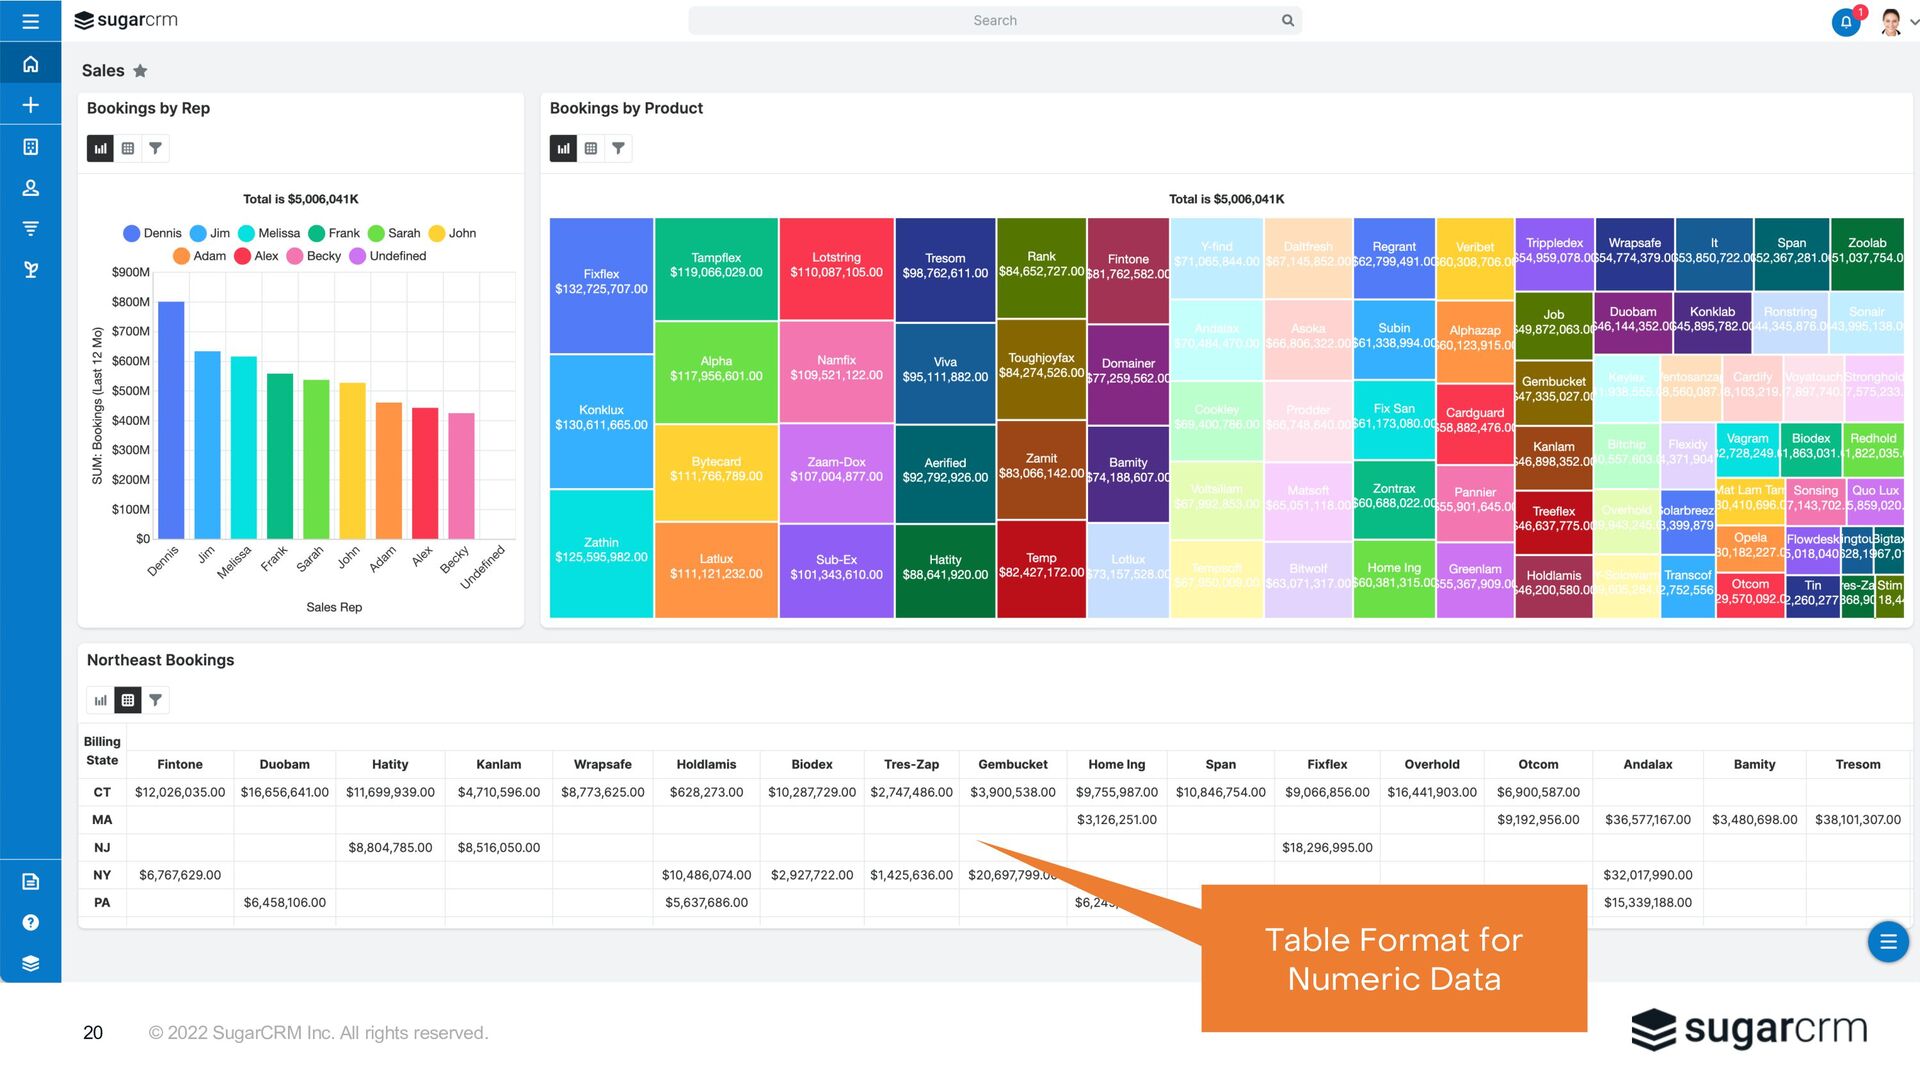
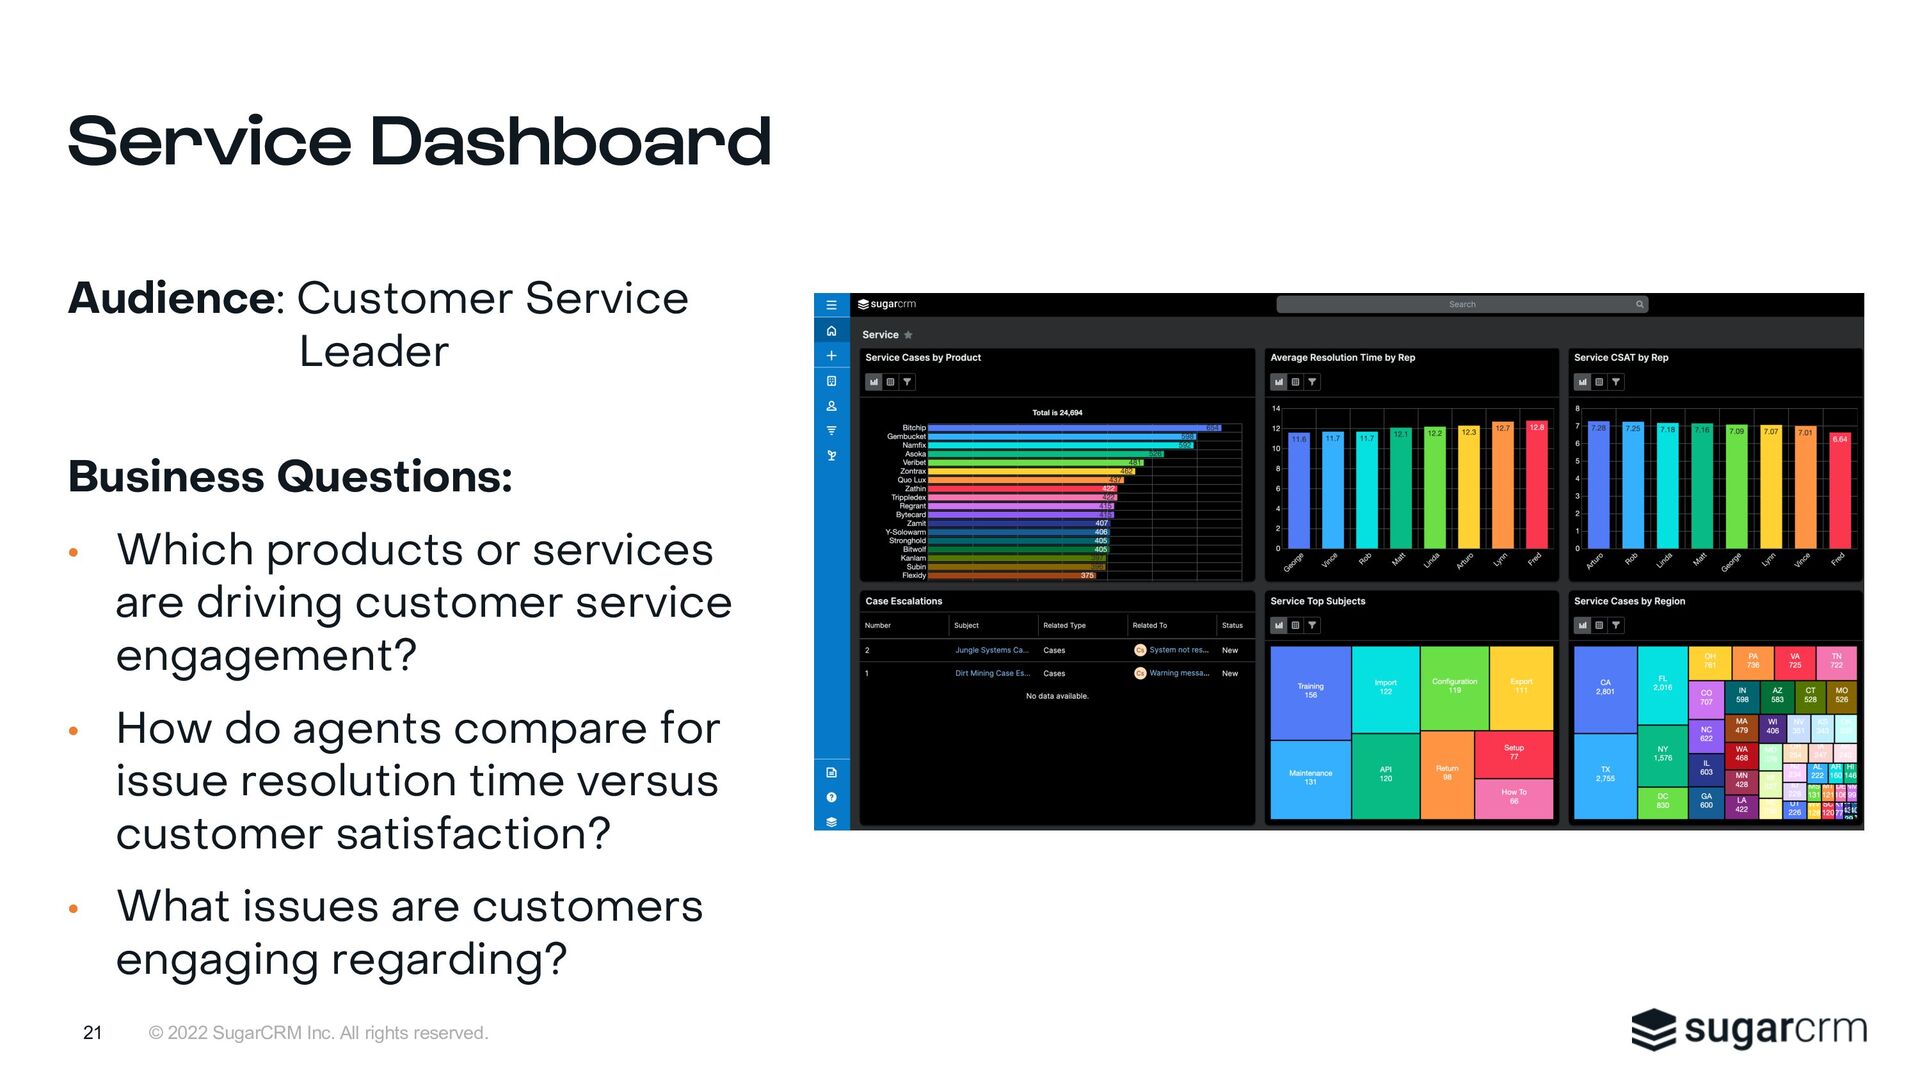
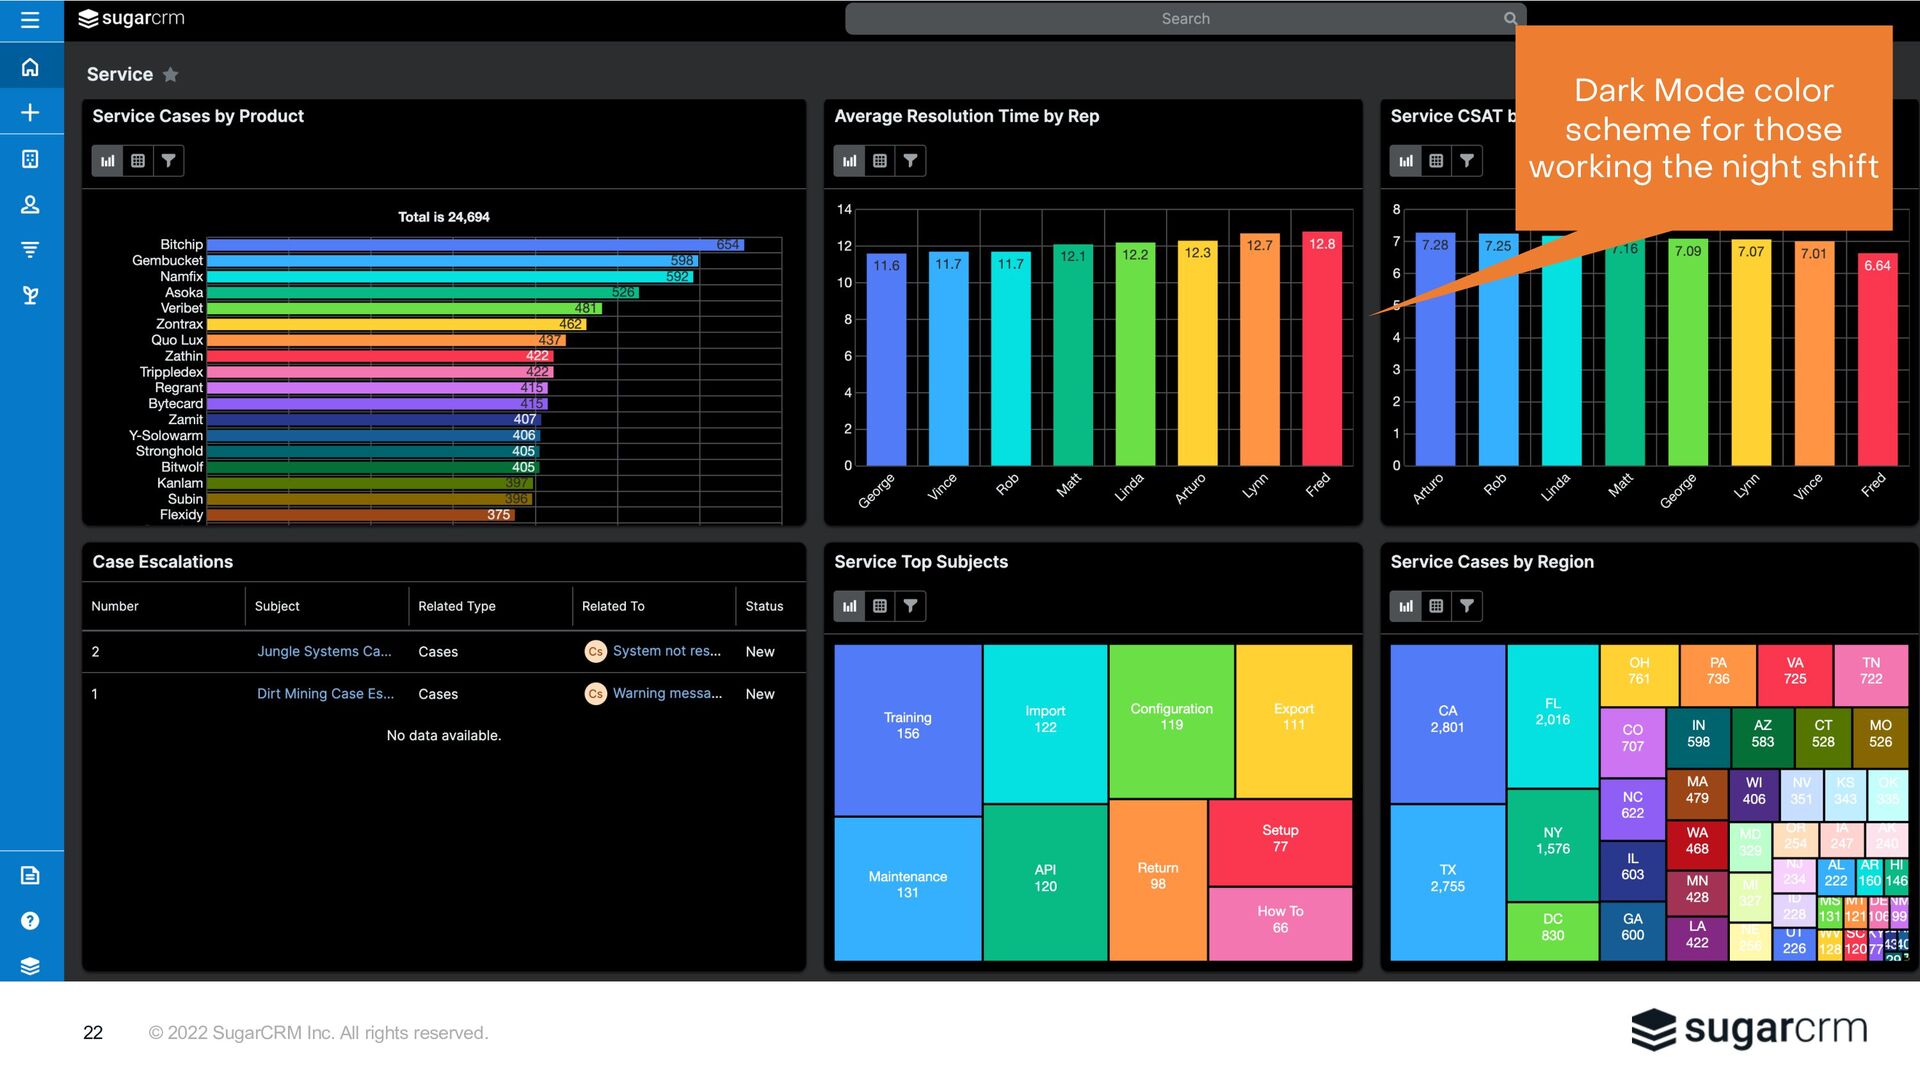
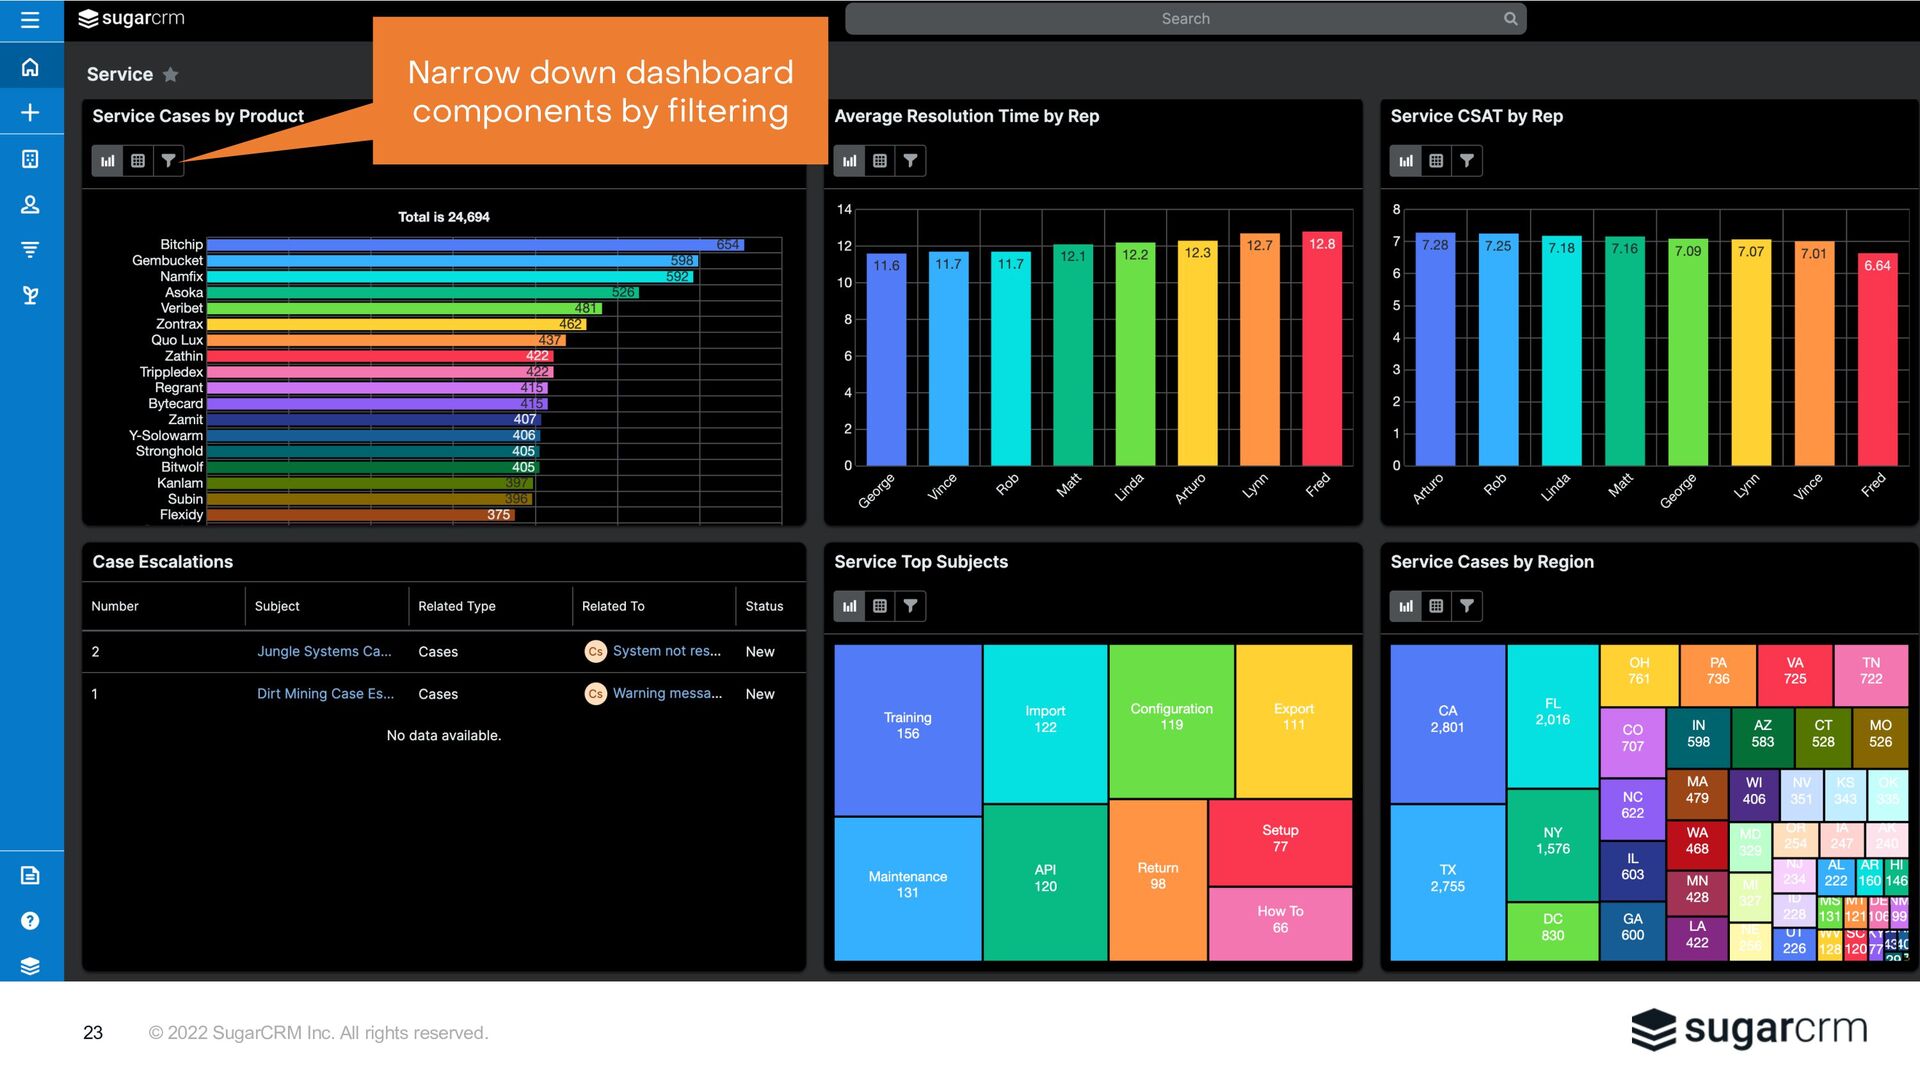
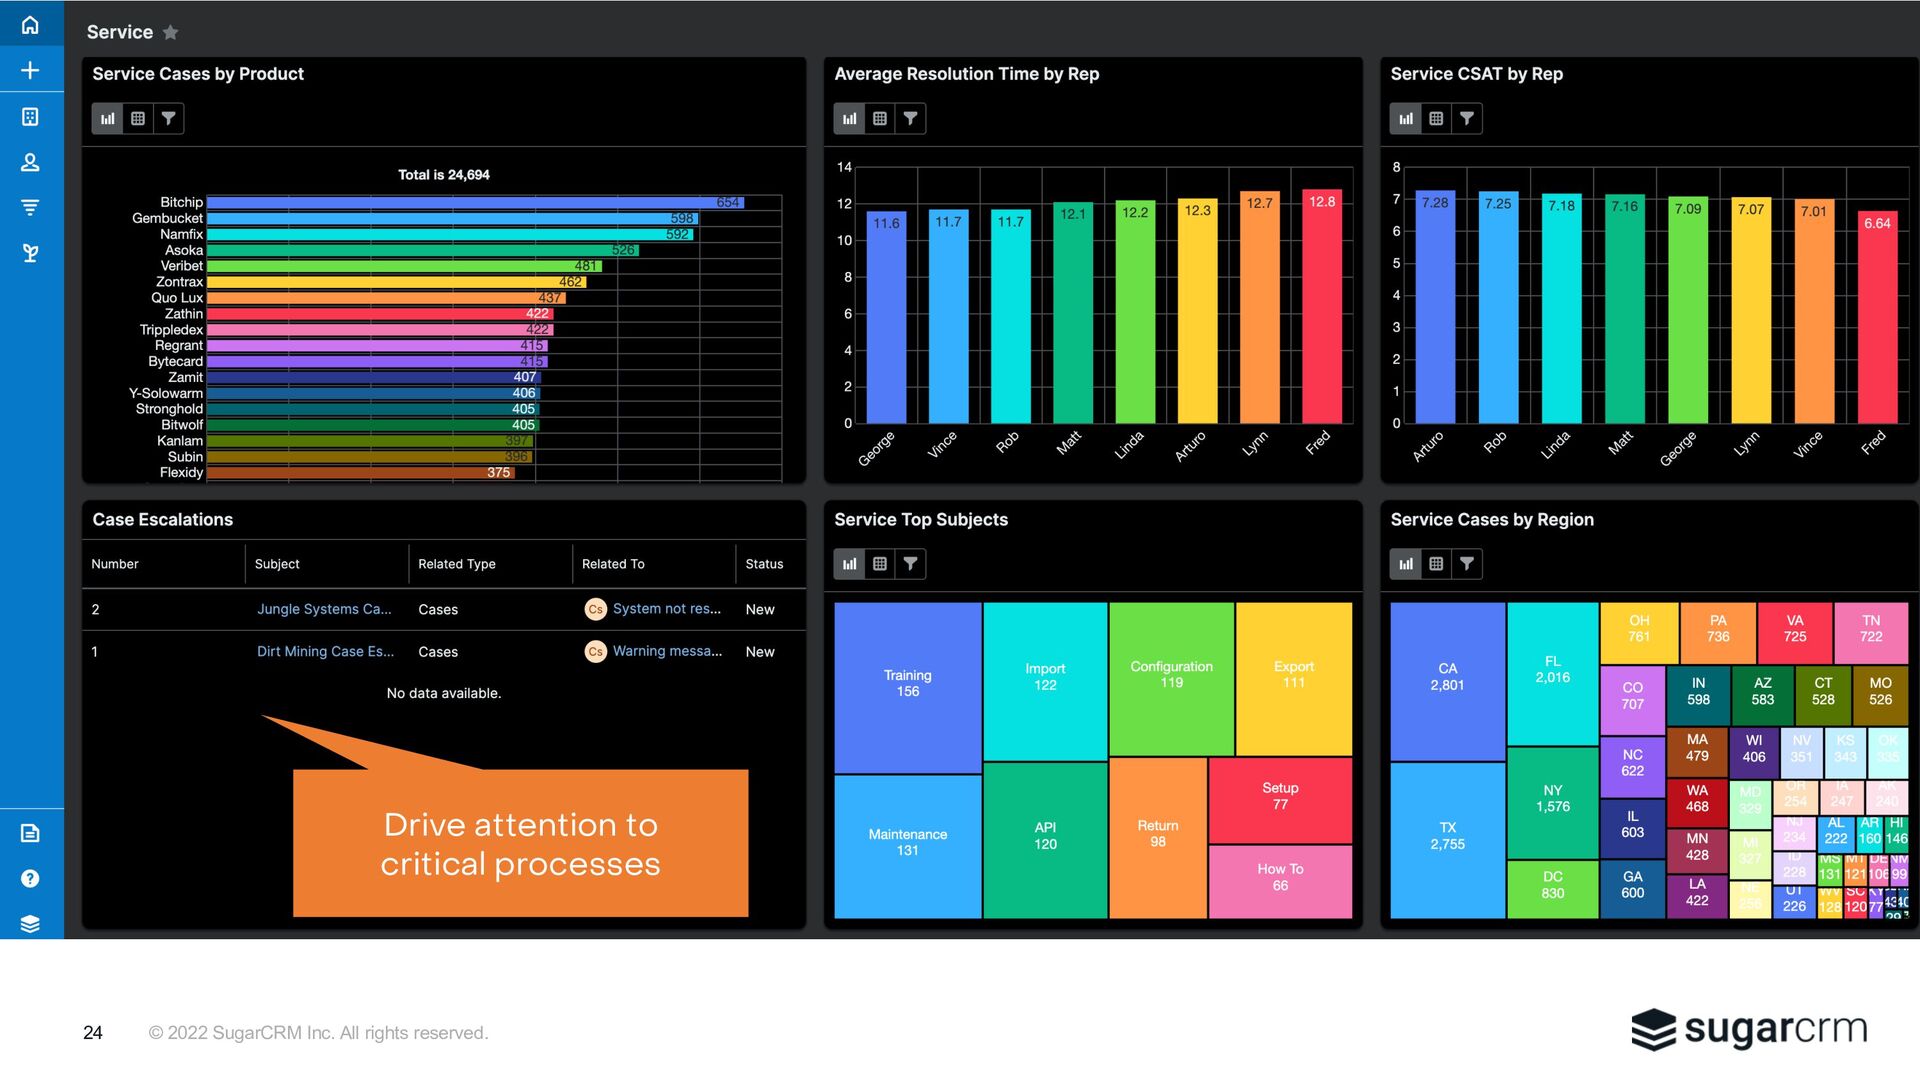
If you’re looking to drive better sales and more revenue, why not leverage your existing CRM data? Through Sugar’s dashboards, analytics, and reporting capabilities, you can easily uncover previously hidden opportunities and achieve organizational goals.

SugarCRM

October 25, 2022
Tweet

More Decks by SugarCRM

Other Decks in Technology

Transcript

  1. © 2022 SugarCRM Inc. All rights reserved. 2 Everyone is

    on mute Questions are welcome Recording available Before We Start
  2. © 2022 SugarCRM Inc. All rights reserved. • Introductions •

    Using CRM Dashboards Effectively • Marketing, Sales, and Service Dashboards for Revenue Growth • How SugarCRM Customer American Specialties Leverage Dashboards • Q&A Agenda 3 3
  3. © 2022 SugarCRM Inc. All rights reserved. Ellen True Senior

    Director, Product Management SugarCRM etrue @sugarcrm.com Presenters Christian Wettre SVP & GM, Platform SugarCRM christian.wettre @sugarcrm.com Sarah Friedlander G. Senior Director, Brand & Content Marketing SugarCRM sarah.friedlander @sugarcrm.com Avi Bar National Sales Manager American Specialties abar @americanspecialties.com 4
  4. © 2022 SugarCRM Inc. All rights reserved. Our Guest, Avi

    Bar with American Specialties “Only ASI Group designs, engineers and manufactures fully integrated washroom accessories, partitions, lockers and visual display products from one source.” Yonkers, New York Environment 125 Sales Users ERP: Epicor Use Cases • Account Management • Project Engagement (Dodge Data) • Customer Service Engagement • Epicor ERP and Sugar • Integration and Collaboration 5
  5. © 2022 SugarCRM Inc. All rights reserved. Initial Repeatable Defined

    Managed Optimizing 1 2 3 4 5 Heroic Individuals Key Processes Defined Most Processes Defined KPI’s Available Process Improvement Contact Management Pipeline Management Marketing, Sales, Service BI Dashboards KPI Time Series Reports and dashboards to measure our ability to execute sales and marketing processes CRM Capability Maturity Model 7
  6. © 2022 SugarCRM Inc. All rights reserved. What is a

    Dashboard? A dashboard is collection of reports consolidated for easy consumption. Reports are often built but then forgotten – put them on dashboards for visibility. Remember to test your dashboard with your audience. Dashboards are built for specific audiences: • Company Executive • Departmental Manager • Individual Contributor Dashboards should: • Align to goals • Answer a business question • Be intuitive • Actionable information • Stimulate competitive instincts • Contain trusted and timely data 8
  7. © 2022 SugarCRM Inc. All rights reserved. Marketing, Sales, and

    Service Dashboards for Revenue Growth 10
  8. © 2022 SugarCRM Inc. All rights reserved. SugarCRM’s Visualization Features

    11 Homepage Dashboards Drilldown to details Modern and Vibrant UI Leaderboard Charts Engaging Visualization Types Sharing Outside Sugar
  9. © 2022 SugarCRM Inc. All rights reserved. Audience: Revenue Marketing

    Manager Business Questions: • Where are my leads coming from? • What campaigns are performing best? • What are our top performing channels of communication? • How do these channels and campaigns drive sales opportunities and bookings? Marketing Dashboard 12
  10. © 2022 SugarCRM Inc. All rights reserved. Marketing Dashboard 13

    Vibrant color palette and crisp charts makes information come to life
  11. © 2022 SugarCRM Inc. All rights reserved. Marketing Dashboard 14

    Drilldown and filtering on any data segment enables deeper understanding
  12. © 2022 SugarCRM Inc. All rights reserved. 15 Drill down

    context switching allows quick comparisons
  13. © 2022 SugarCRM Inc. All rights reserved. Audience: Sales Leader

    Business Questions: • Which reps are performing best and worst? • Show me bookings by product? • Show me product bookings by region? Sales Dashboard 17
  14. © 2022 SugarCRM Inc. All rights reserved. 18 Leaderboard sorting

    option showing highest performing KPI elements
  15. © 2022 SugarCRM Inc. All rights reserved. 19 Tree Chart

    Style provides a better alternative to Pie Charts when you have many chart elements
  16. © 2022 SugarCRM Inc. All rights reserved. Audience: Customer Service

    Leader Business Questions: • Which products or services are driving customer service engagement? • How do agents compare for issue resolution time versus customer satisfaction? • What issues are customers engaging regarding? Service Dashboard 21
  17. © 2022 SugarCRM Inc. All rights reserved. Service Dashboard 22

    Dark Mode color scheme for those working the night shift
  18. © 2022 SugarCRM Inc. All rights reserved. Service Dashboard 23

    Narrow down dashboard components by filtering
  19. © 2022 SugarCRM Inc. All rights reserved. What Results and

    Learnings has ASI Gained from Using Dashboards? 25