Upgrade to Pro — share decks privately, control downloads, hide ads and more …

CROI2025

Sponsored · Your Podcast. Everywhere. Effortlessly. Share. Educate. Inspire. Entertain. You do you. We'll handle the rest. →
Avatar for Summer Shi Summer Shi
June 16, 2025
74

 CROI2025

Avatar for Summer Shi

Summer Shi

June 16, 2025

Transcript

  1. Clinic Switching and HIV Care Engagement in Africa: A Multi-Country

    Population-Based Study Joseph G. Rosen1,2,3,4, M. Kate Grabowski5, Robert Ssekubugu6, Caitlin E. Kennedy4, Larry W. Chang4,5, Gertrude Nakigozi6, Fred Nalugoda6, Ronald M. Galiwango6, Godfrey Kigozi6, Steven J. Reynolds4,5,6,7, Joseph Kagaayi6 1 Rhode Island Hospital, Providence, Rhode Island, USA 2 The Warren Alpert Medical School, Providence, RI, USA 3 School of Public Health, Brown University, Providence, RI, USA 4 Bloomberg School of Public Health, Johns Hopkins University, Baltimore, MD, USA 5 School of Medicine, Johns Hopkins University, Baltimore, MD, USA 6 Rakai Health Sciences Program, Kalisizo, Uganda 7 National Institutes of Health, Bethesda, MD, USA 32nd Conference on Retroviruses and Opportunistic Infections (CROI) San Francisco, CA, USA Wednesday, March 12th, 2025 Gaps and Solutions in the HIV Response
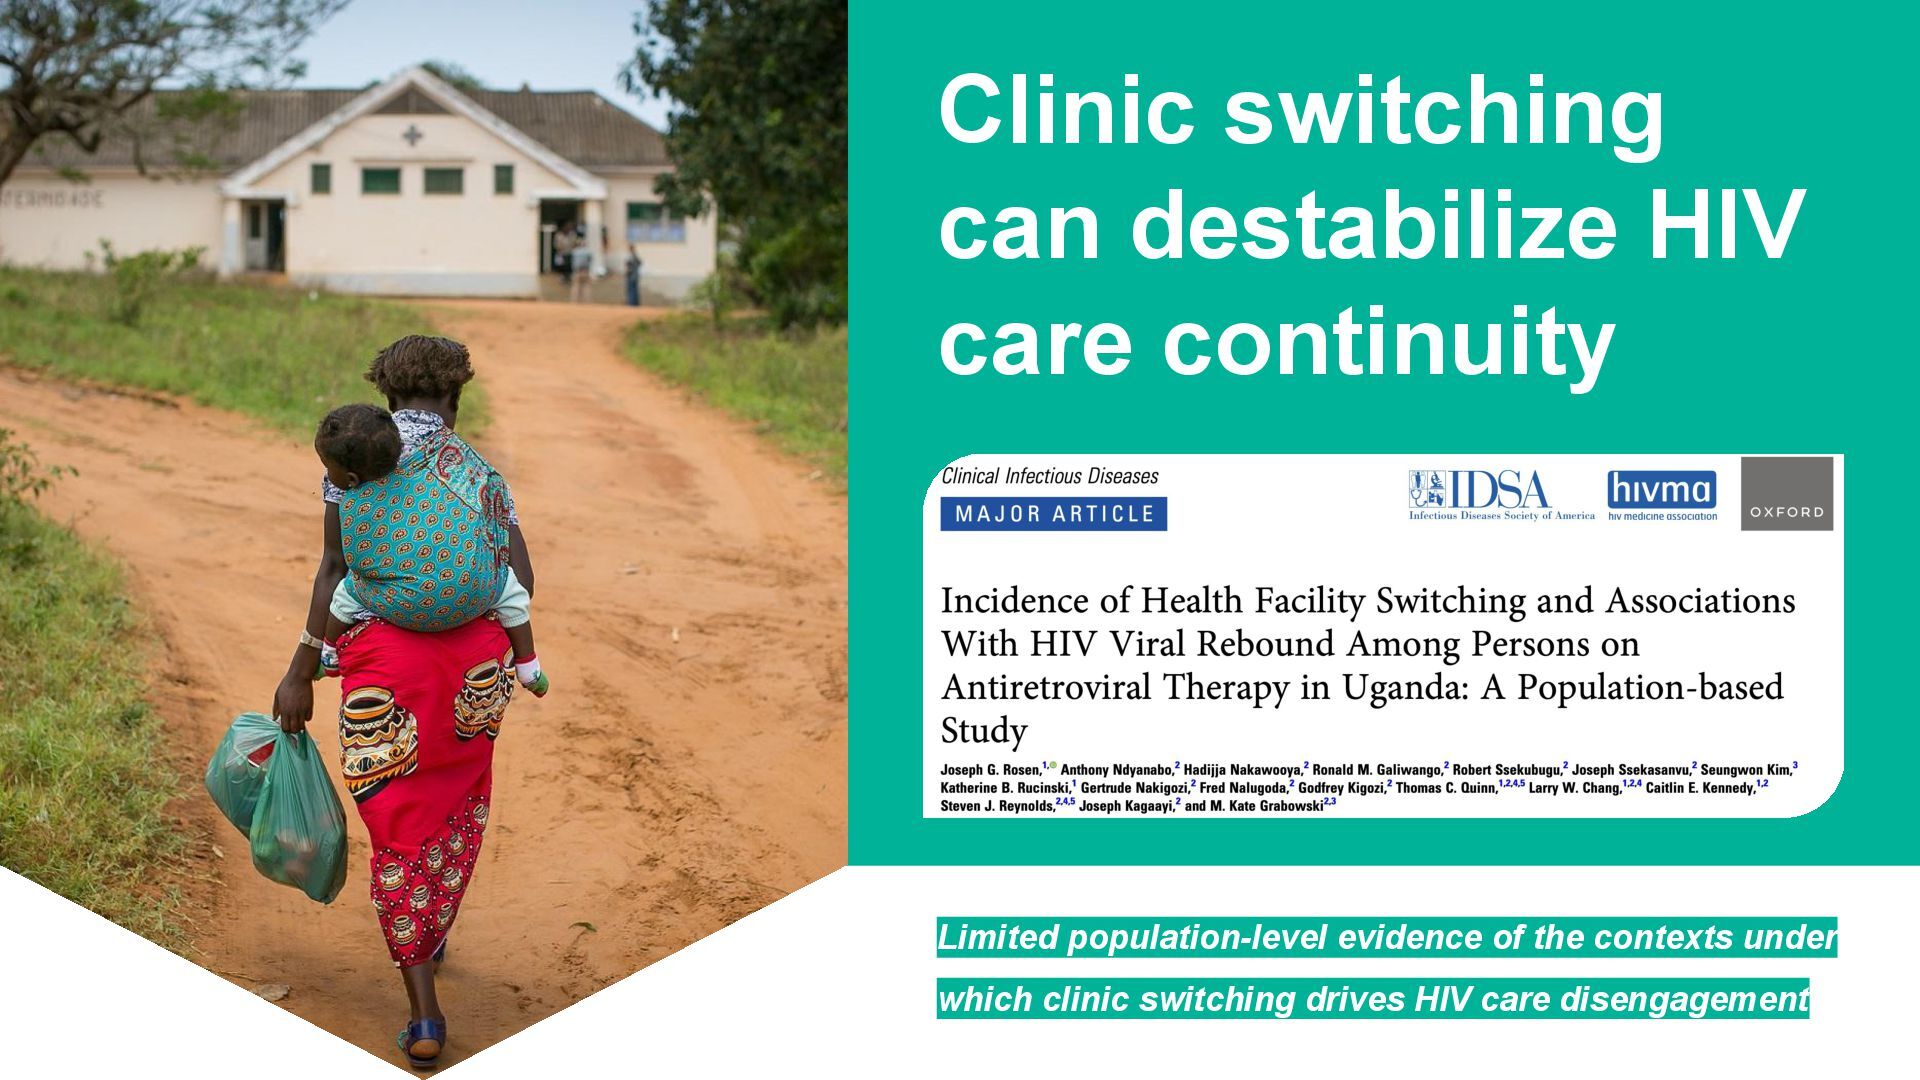
  2. Clinic switching can destabilize HIV care continuity Limited population-level evidence

    of the contexts under which clinic switching drives HIV care disengagement
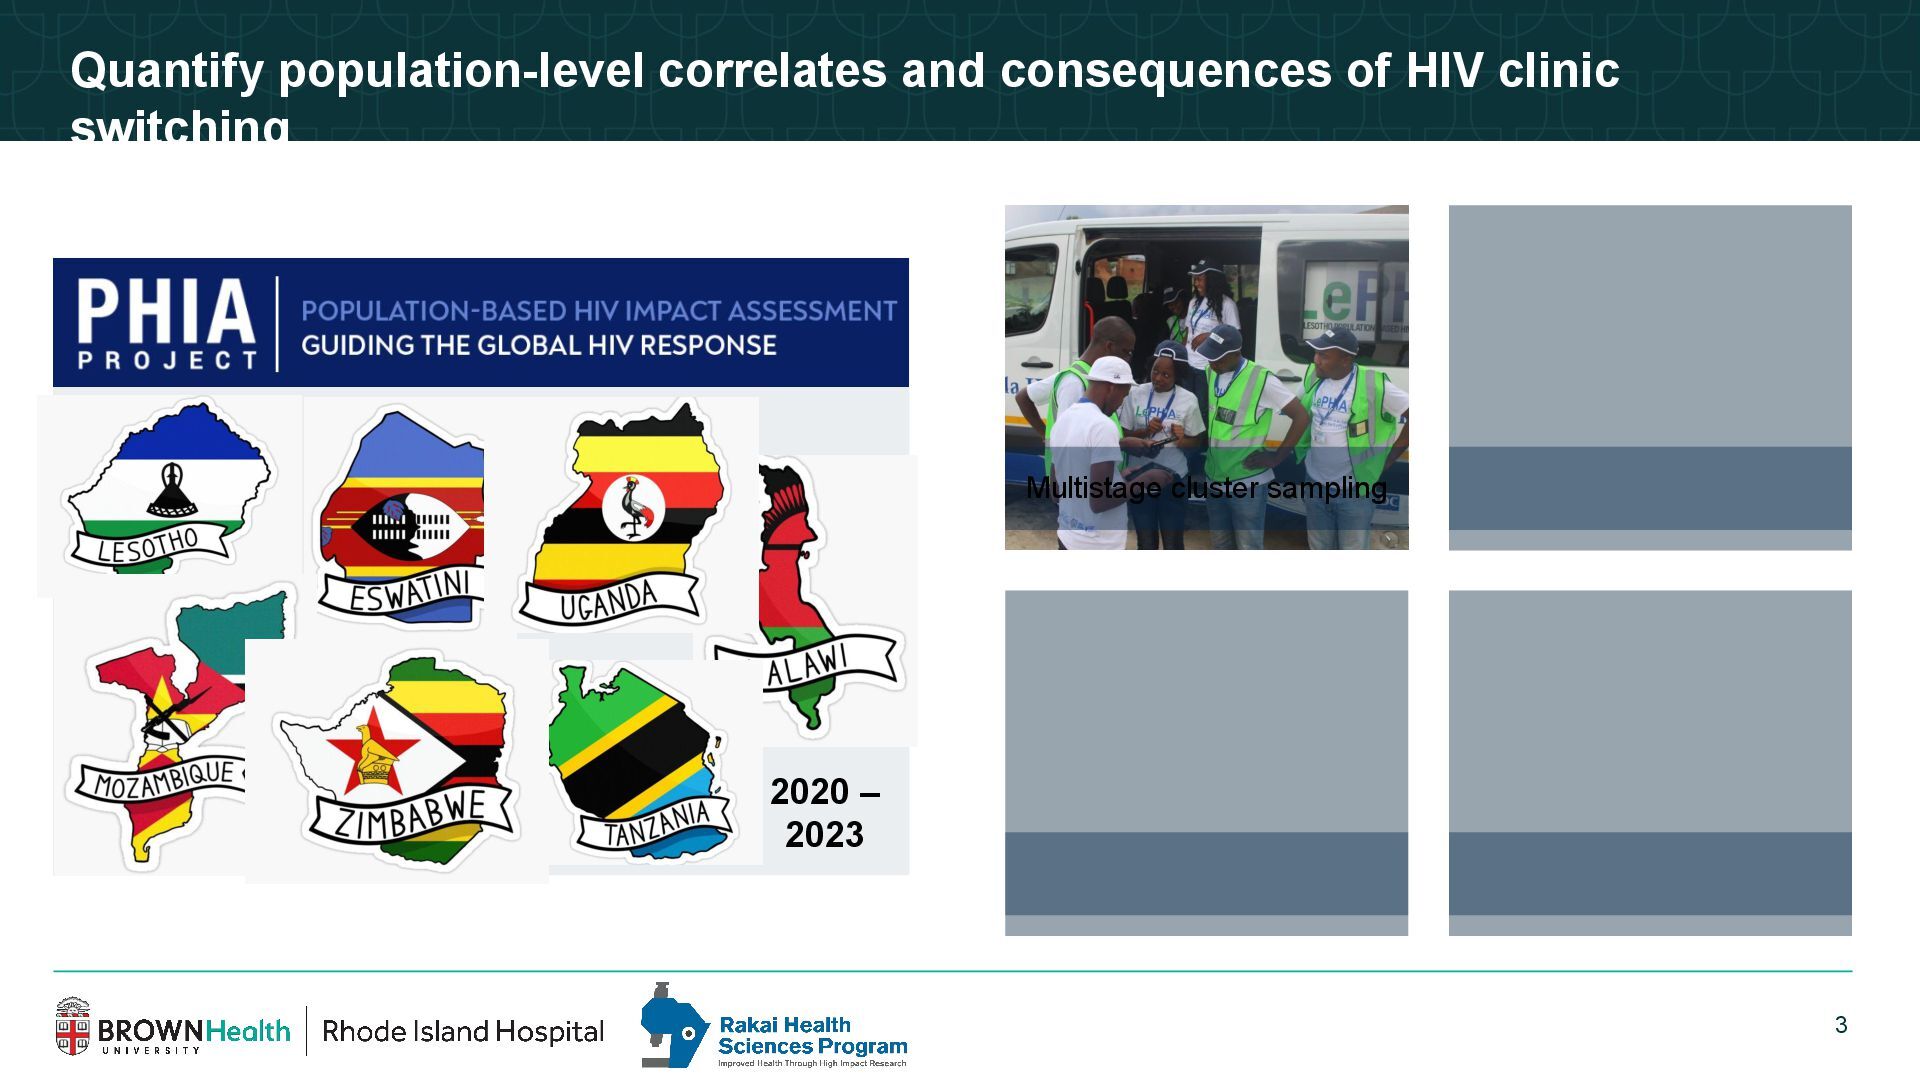
  3. 4 Quantify population-level correlates and consequences of HIV clinic switching

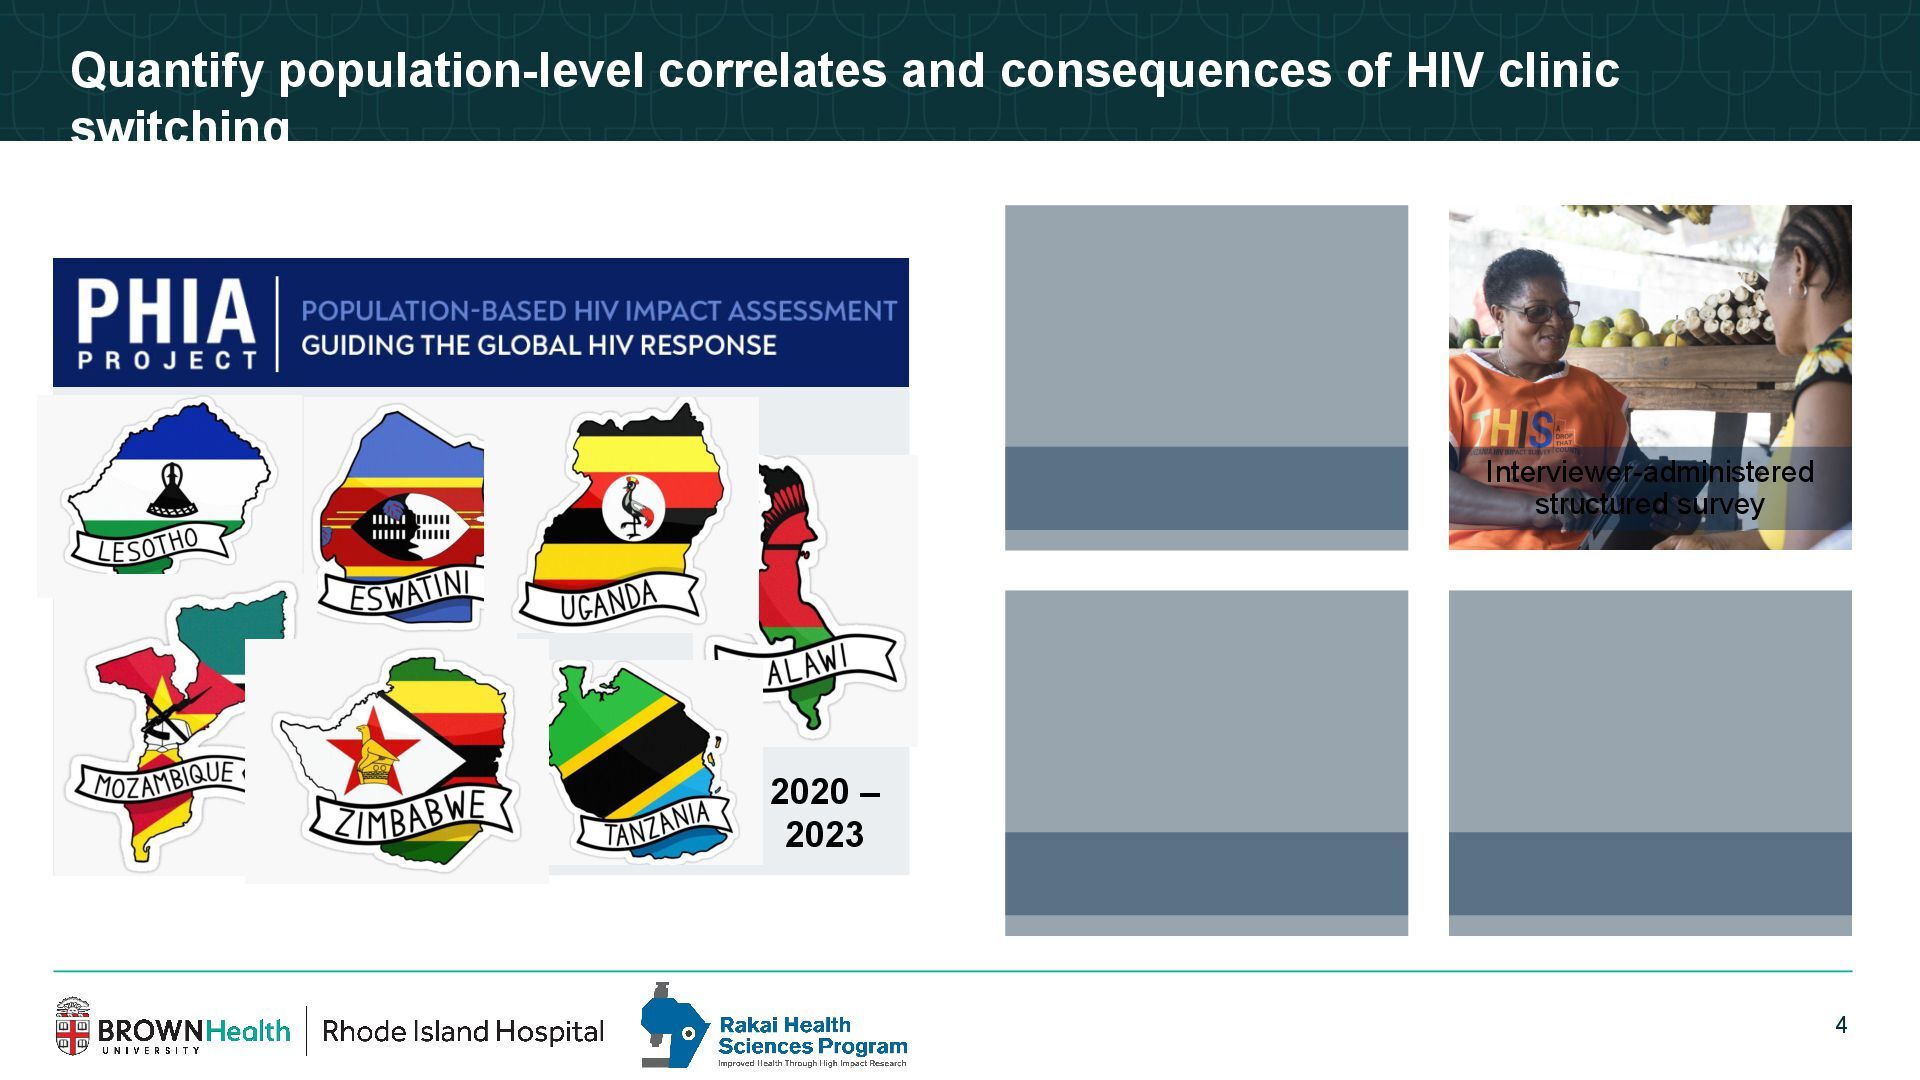
    Interviewer-administered structured survey 2020 – 2023
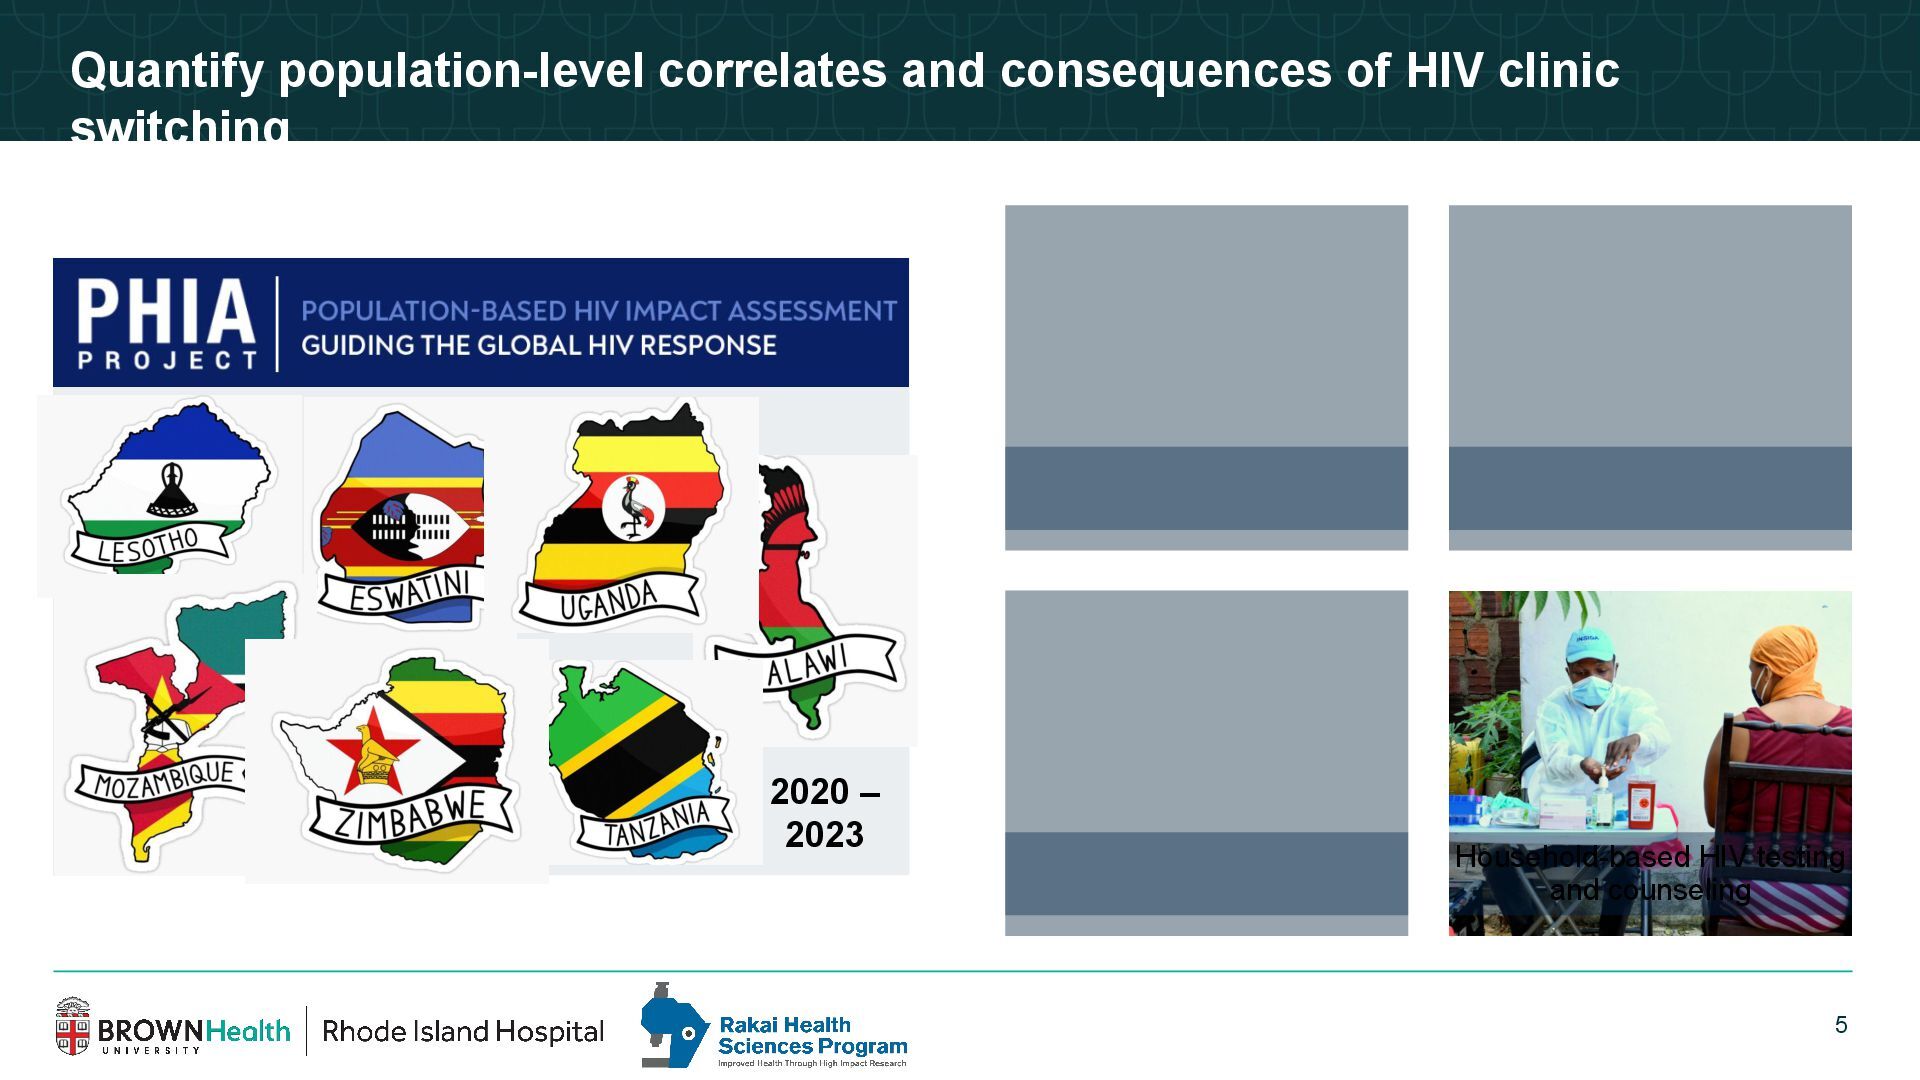
  4. 5 Quantify population-level correlates and consequences of HIV clinic switching

    Household-based HIV testing and counseling 2020 – 2023
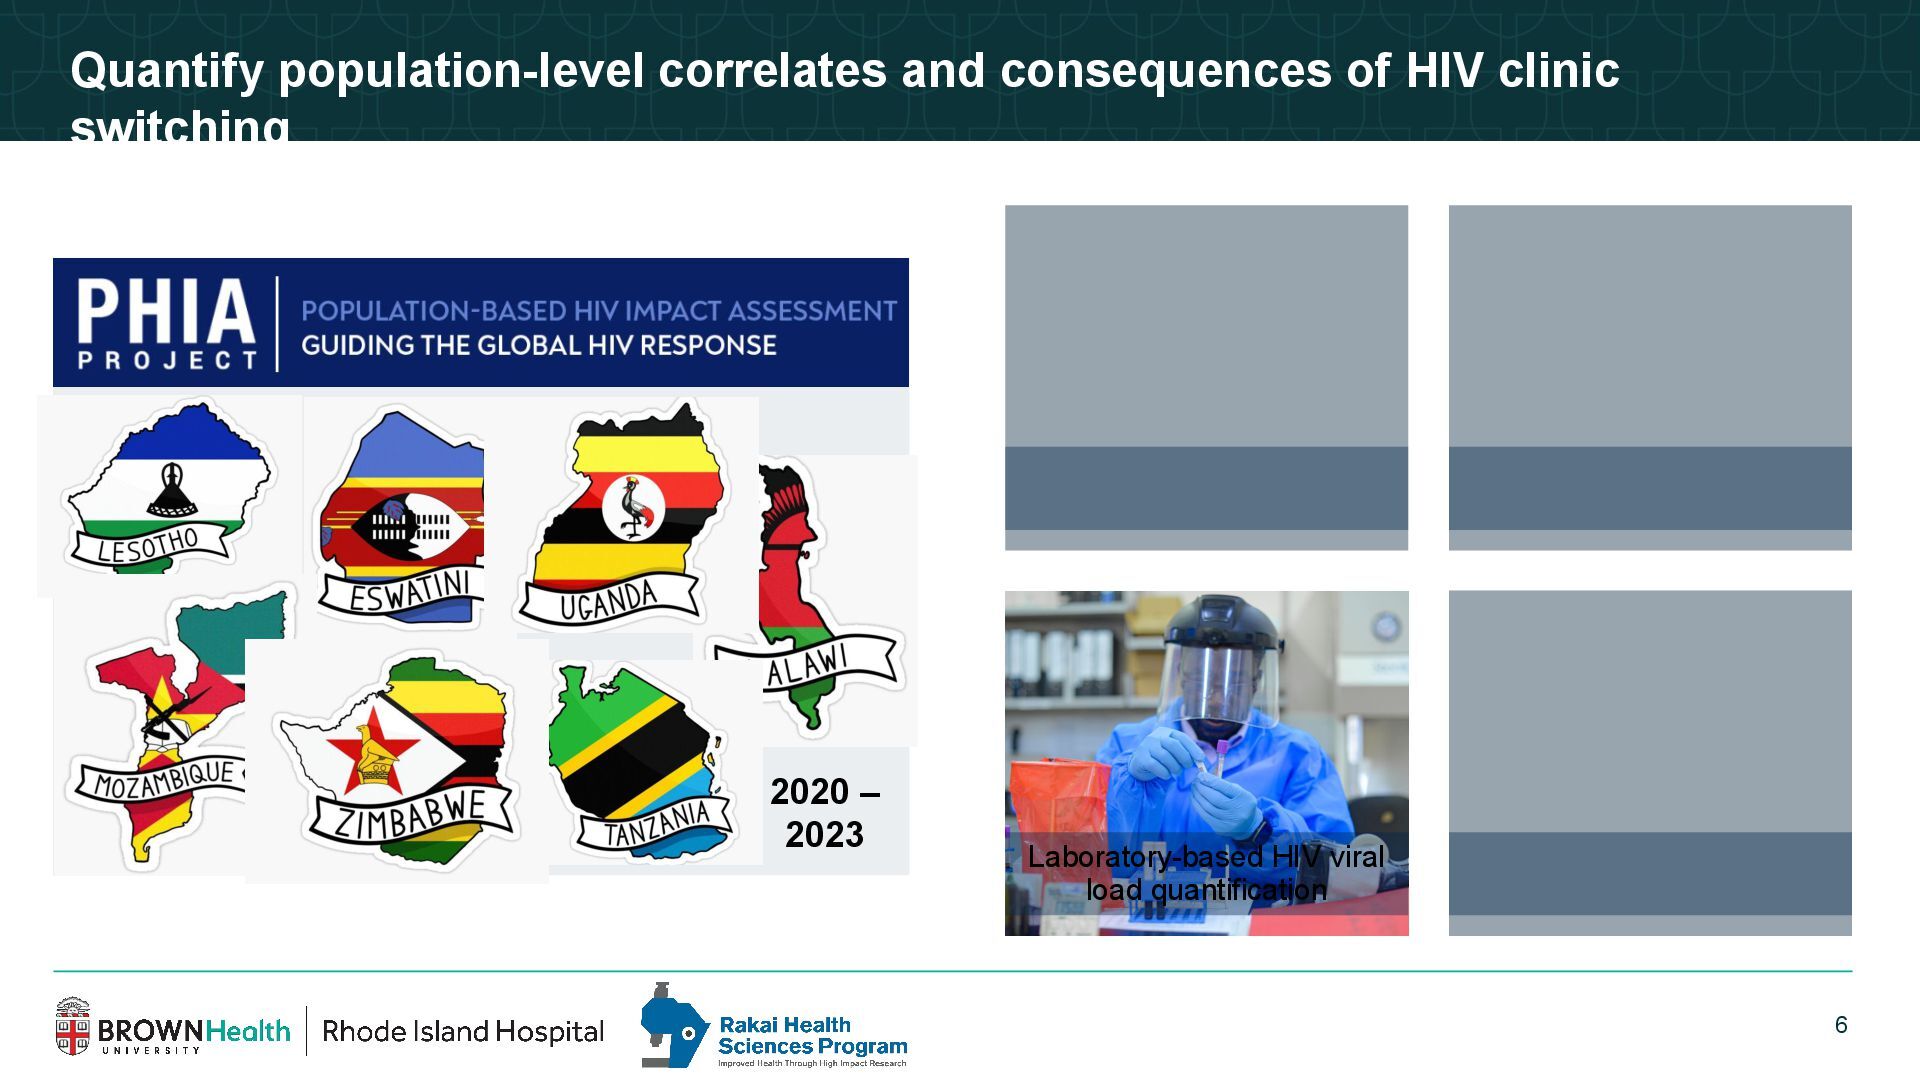
  5. 6 Quantify population-level correlates and consequences of HIV clinic switching

    Laboratory-based HIV viral load quantification 2020 – 2023
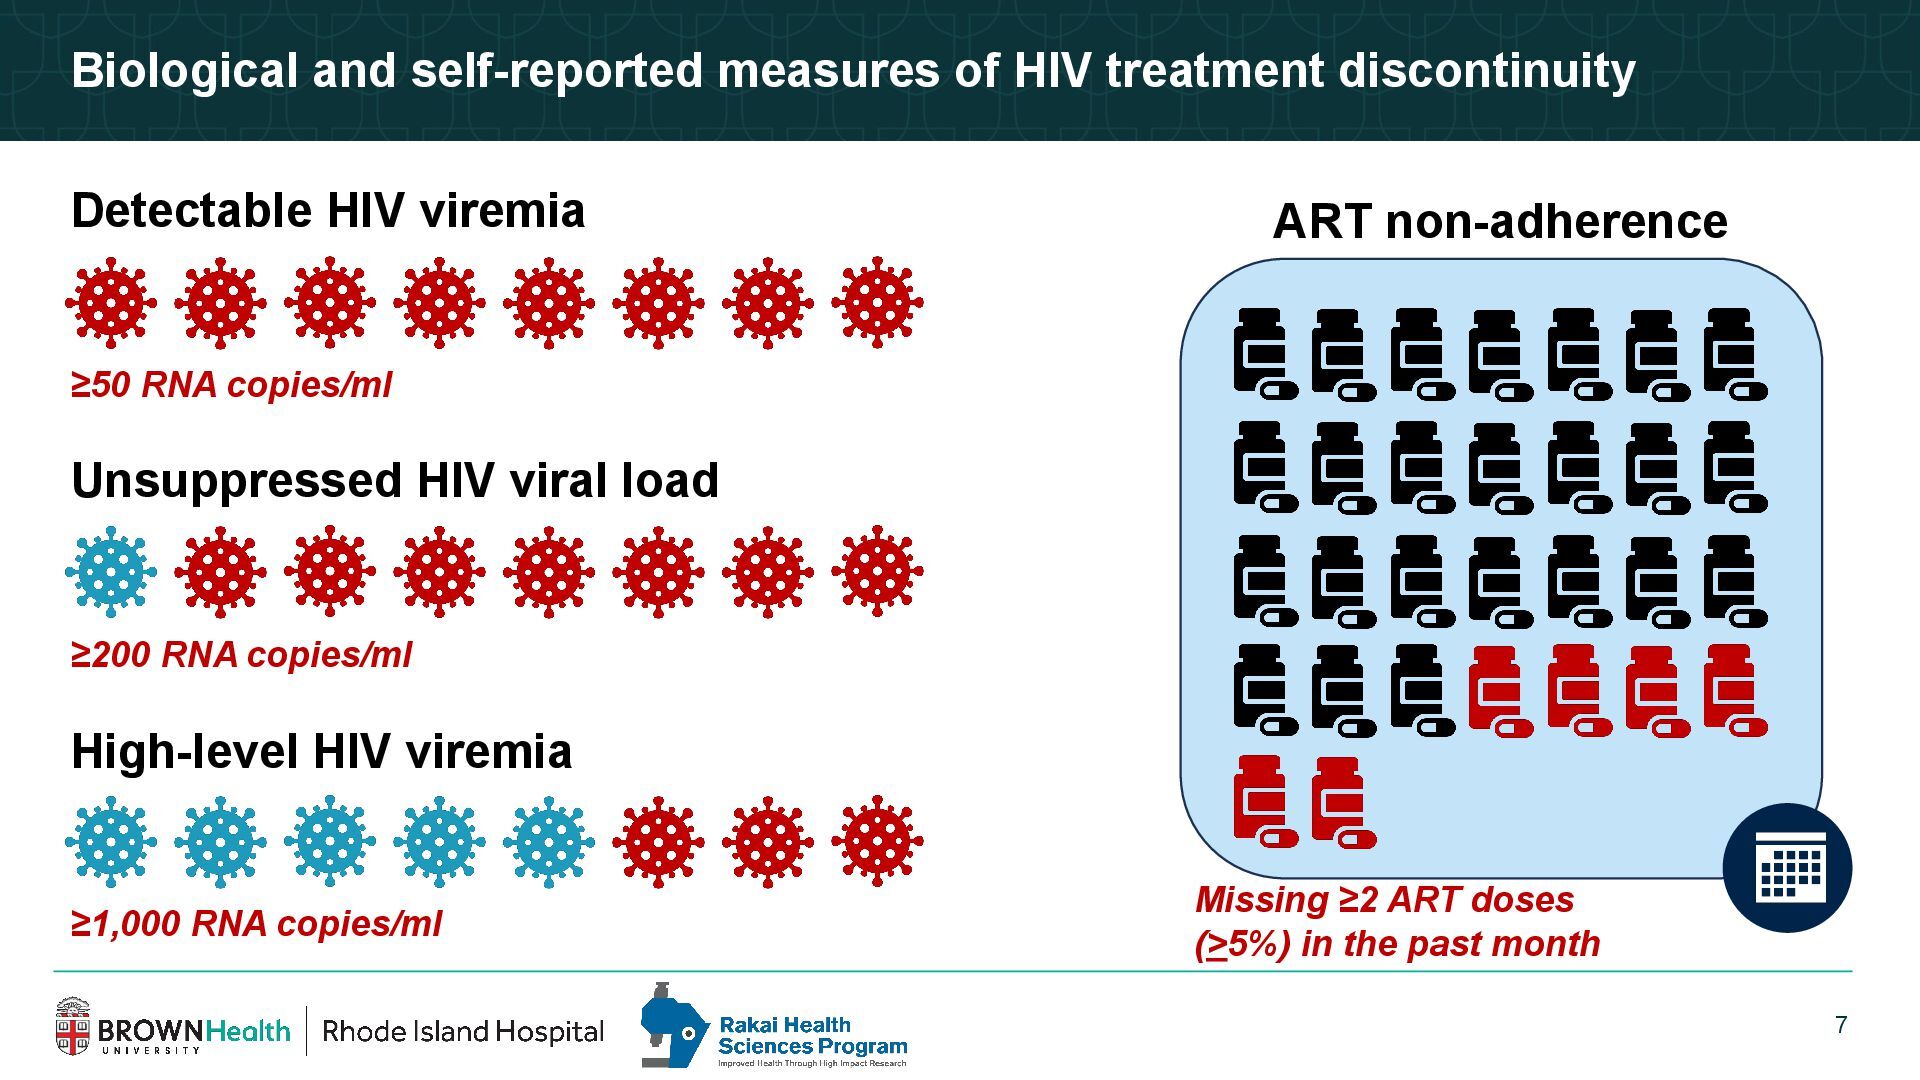
  6. 7 Biological and self-reported measures of HIV treatment discontinuity Detectable

    HIV viremia Unsuppressed HIV viral load High-level HIV viremia ≥1,000 RNA copies/ml ≥200 RNA copies/ml ≥50 RNA copies/ml ART non-adherence Missing ≥2 ART doses (>5%) in the past month
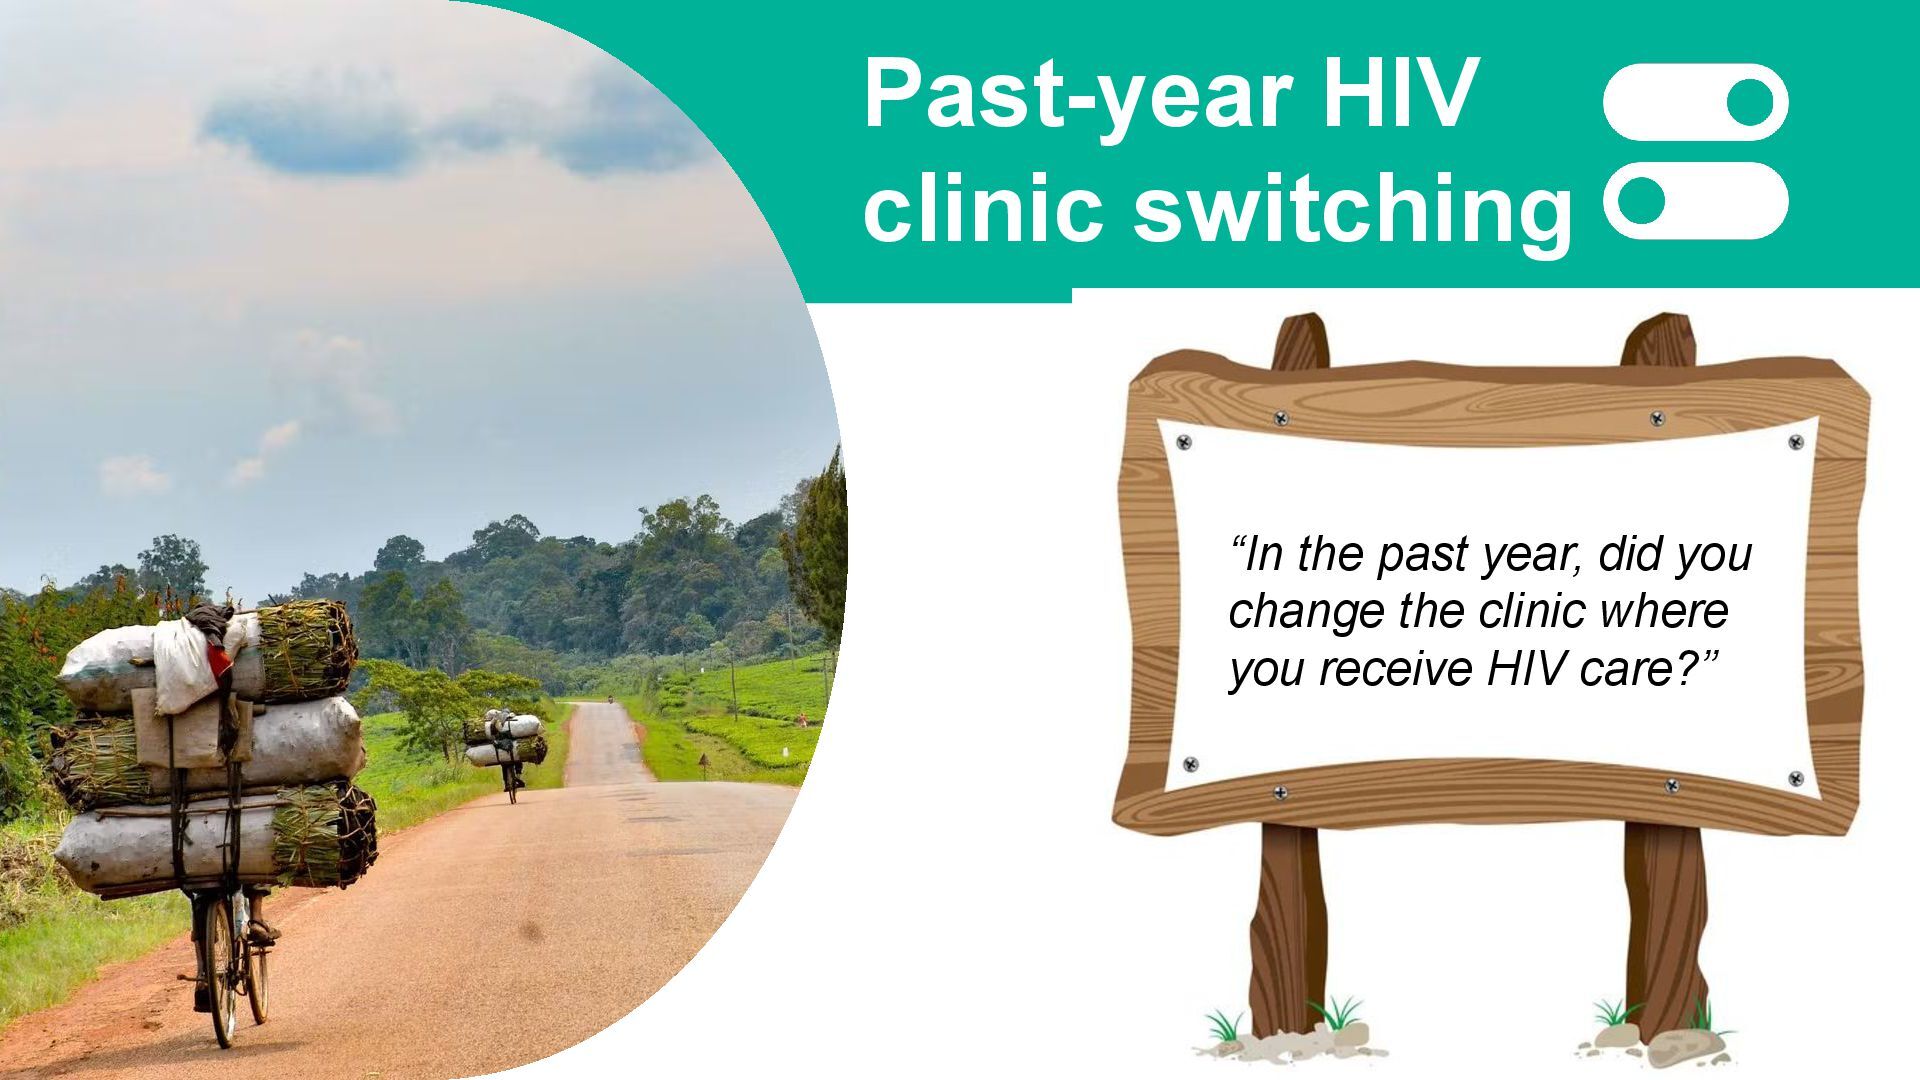
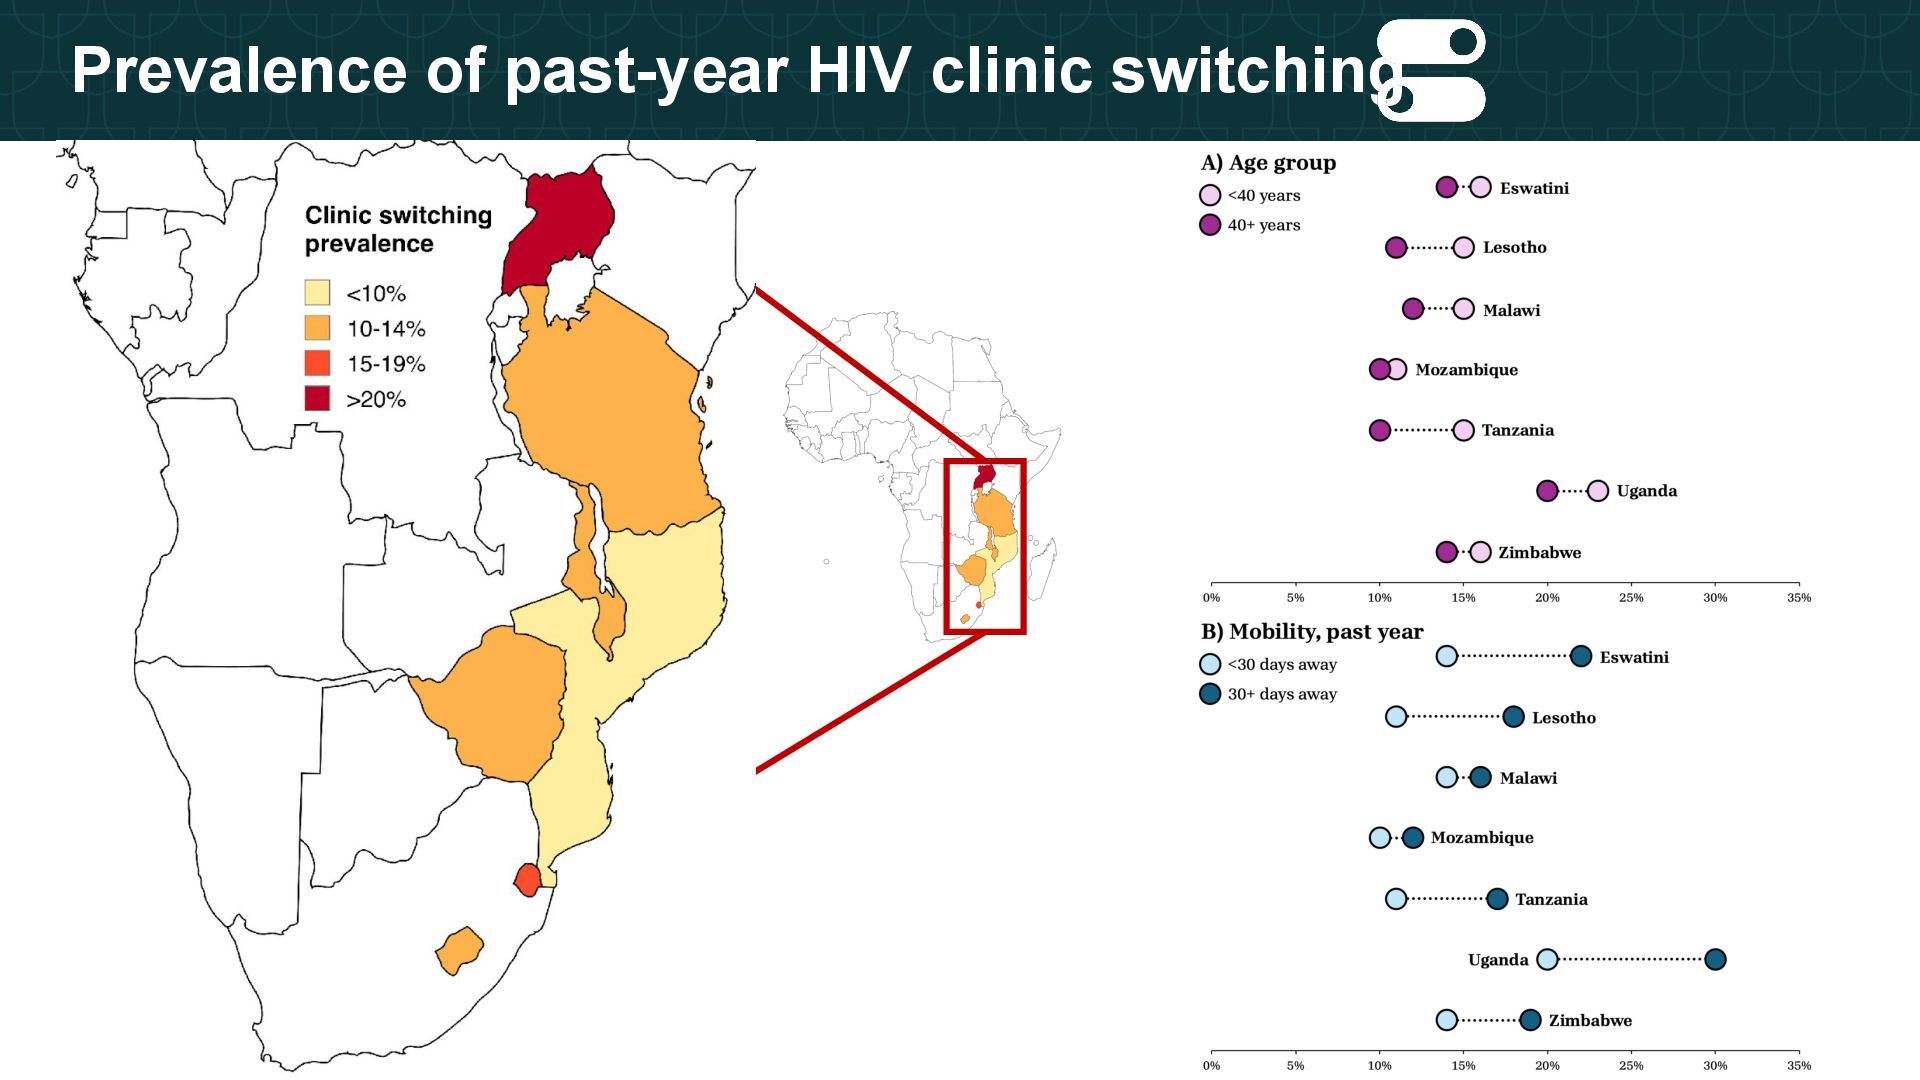
  7. Past-year HIV clinic switching “In the past year, did you

    change the clinic where you receive HIV care?”
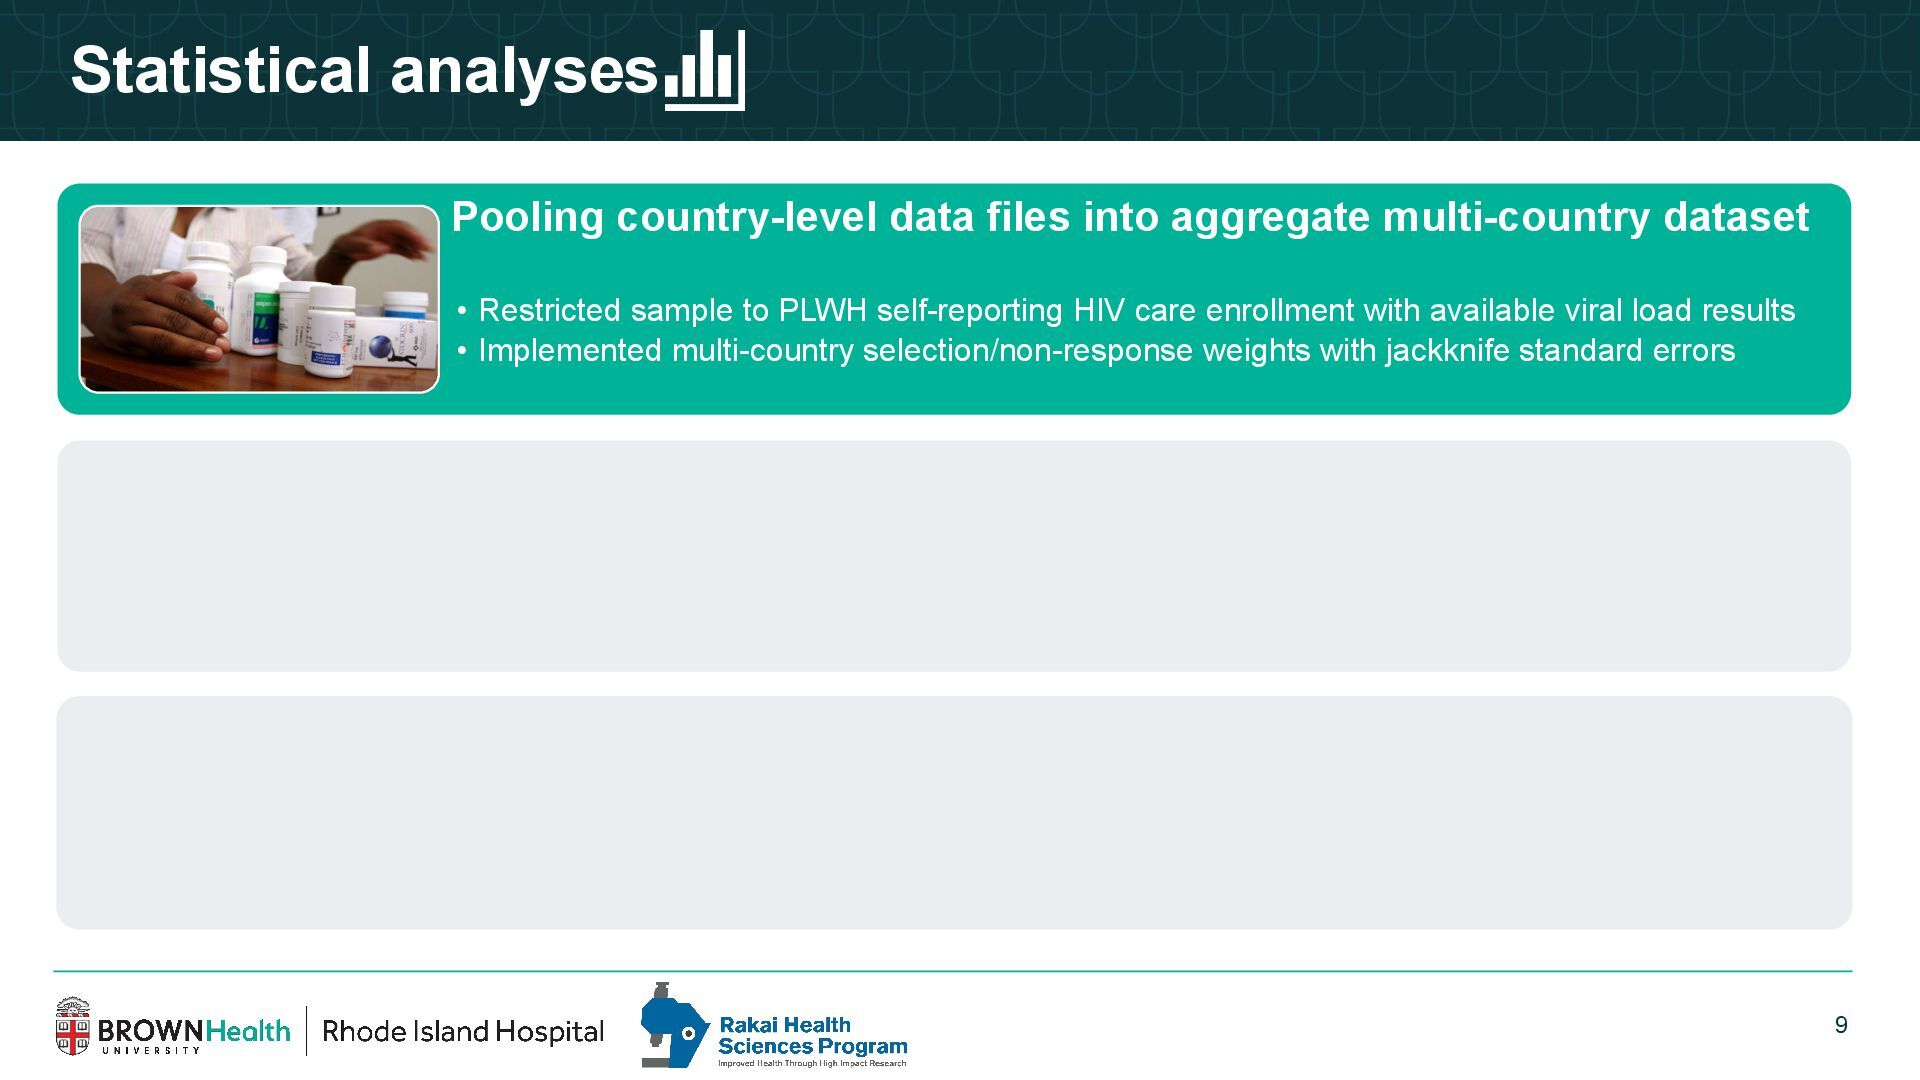
  8. 9 Statistical analyses Pooling country-level data files into aggregate multi-country

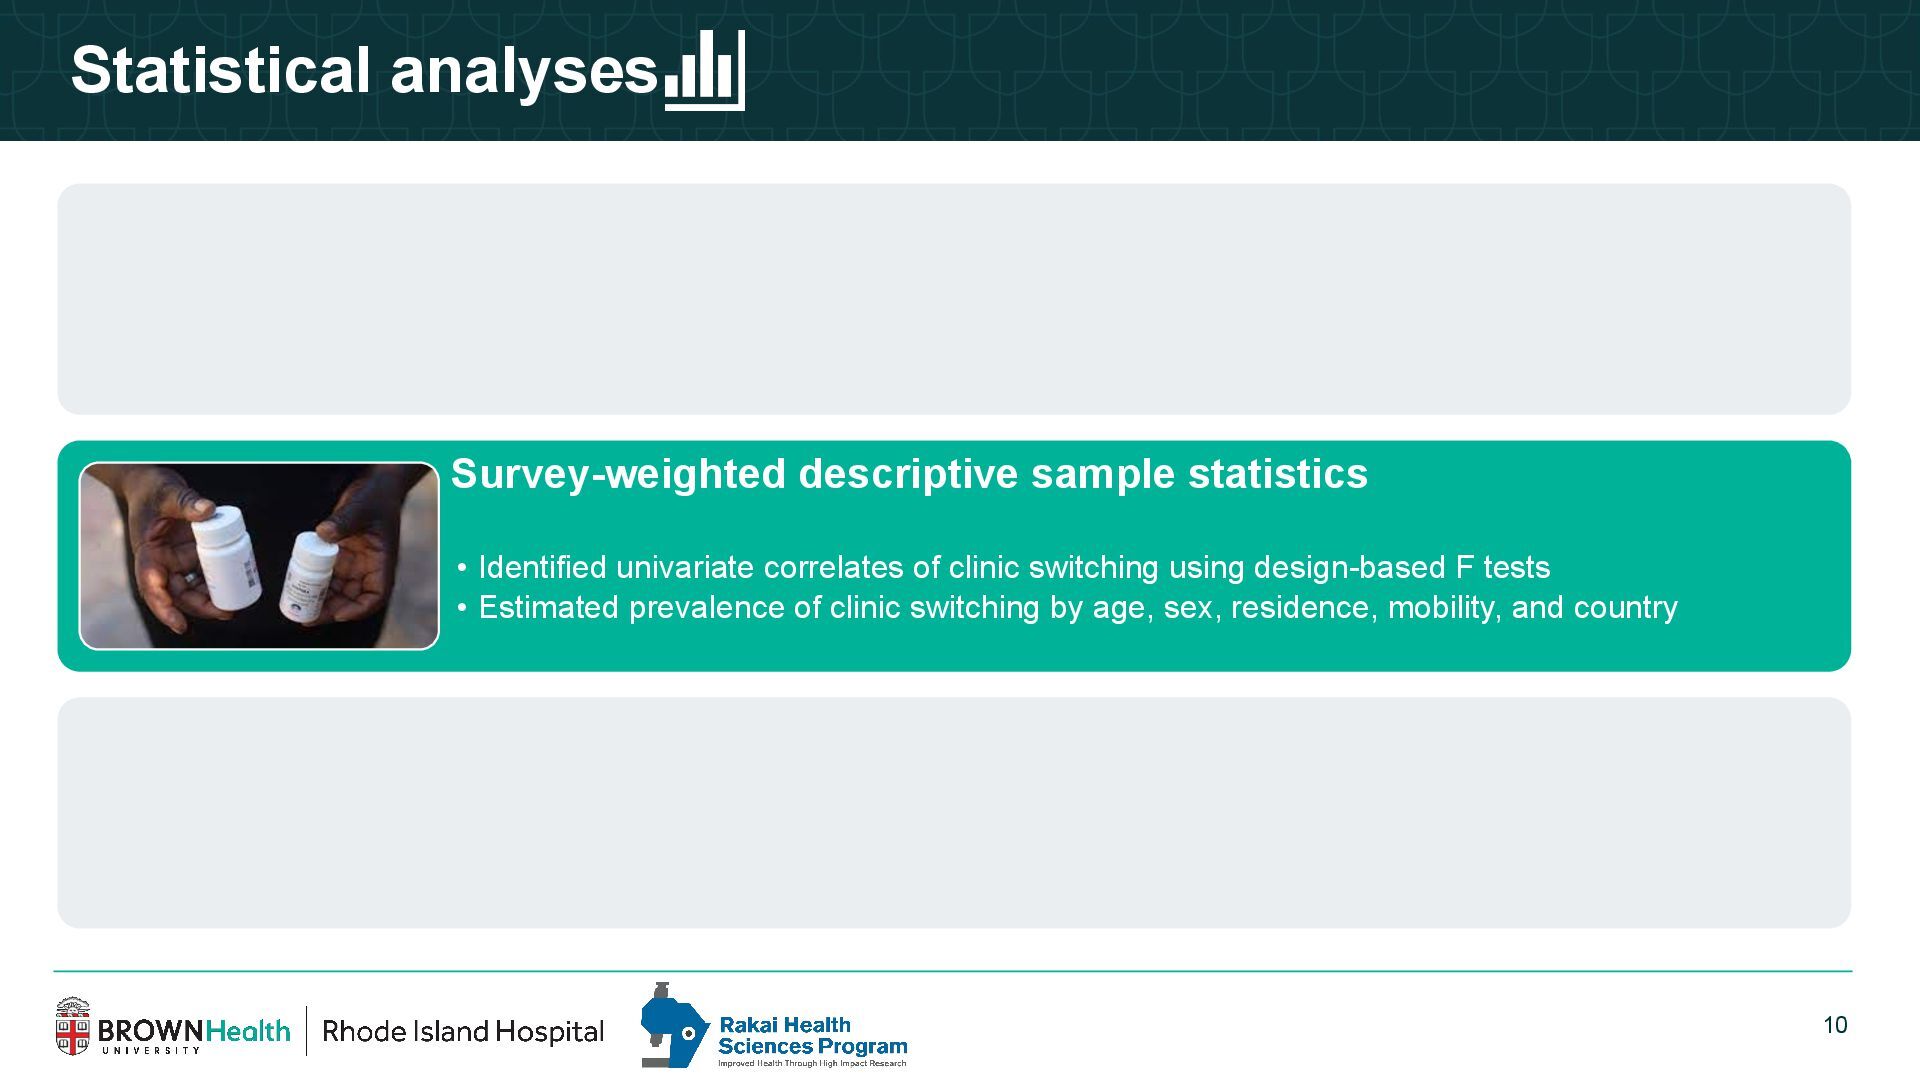
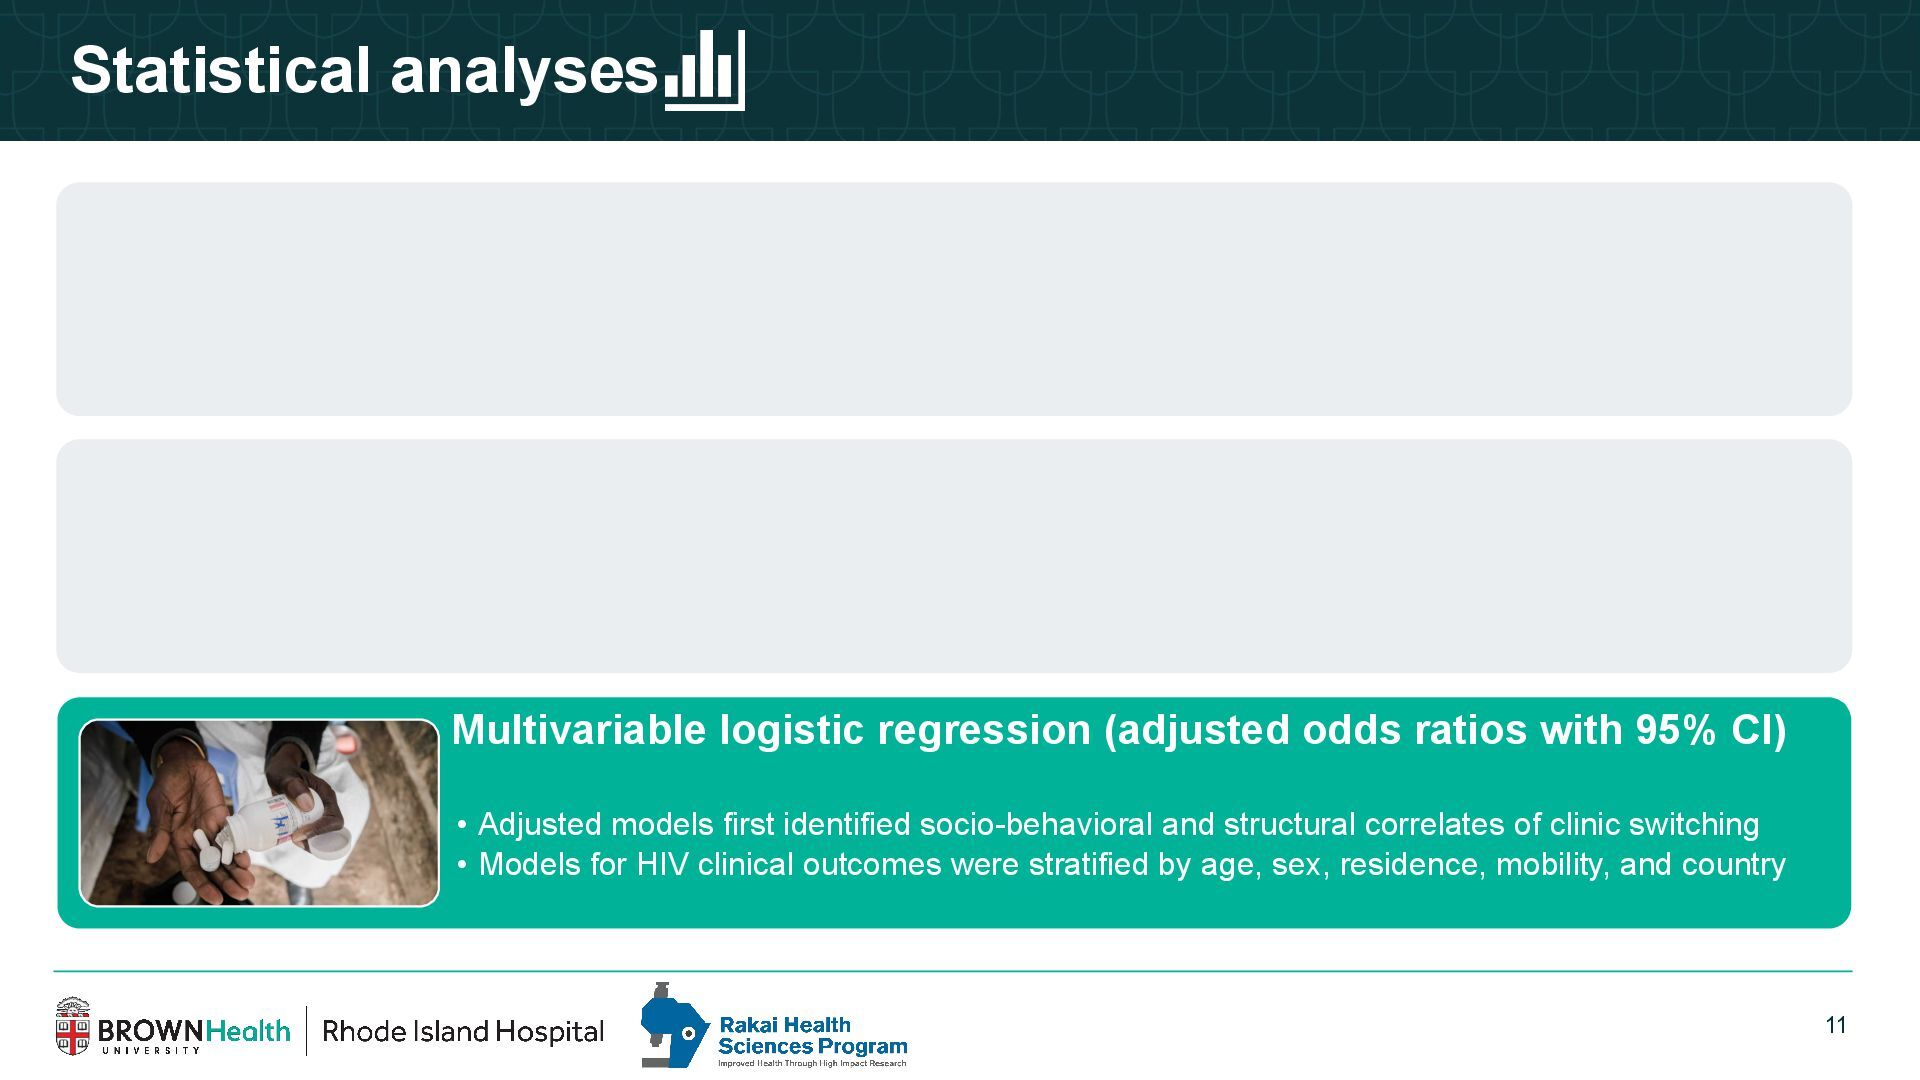
    dataset • Restricted sample to PLWH self-reporting HIV care enrollment with available viral load results • Implemented multi-country selection/non-response weights with jackknife standard errors Survey-weighted descriptive sample statistics • Identified univariate correlates of clinic switching using design-based F tests • Estimated prevalence of clinic switching by age, sex, residence, mobility, and country Multivariable logistic regression (adjOR with 95% CI) • Adjusted models first identified socio-behavioral and structural correlates of clinic switching • Models for HIV clinical outcomes were stratified by age, sex, residence, mobility, and country
  9. 10 Statistical analyses Pooling country-level datasets into single multi-country data

    file • Recalculated replicate weights to correct for data aggregation across independent surveys • Implemented corrected selection/non-response weights with jackknife standard errors Survey-weighted descriptive sample statistics • Identified univariate correlates of clinic switching using design-based F tests • Estimated prevalence of clinic switching by age, sex, residence, mobility, and country Multivariable logistic regression (adjOR with 95% CI) • Adjusted models first identified socio-behavioral and structural correlates of clinic switching • Models for HIV clinical outcomes were stratified by age, sex, residence, mobility, and country
  10. 11 Statistical analyses Pooling country-level datasets into single multi-country data

    file • Recalculated replicate weights to correct for data aggregation across independent surveys • Implemented corrected selection/non-response weights with jackknife standard errors Survey-weighted descriptive sample statistics • Identified univariate correlates of clinic switching using design-based F tests • Estimated prevalence of clinic switching by age, sex, residence, mobility, and country Multivariable logistic regression (adjusted odds ratios with 95% CI) • Adjusted models first identified socio-behavioral and structural correlates of clinic switching • Models for HIV clinical outcomes were stratified by age, sex, residence, mobility, and country
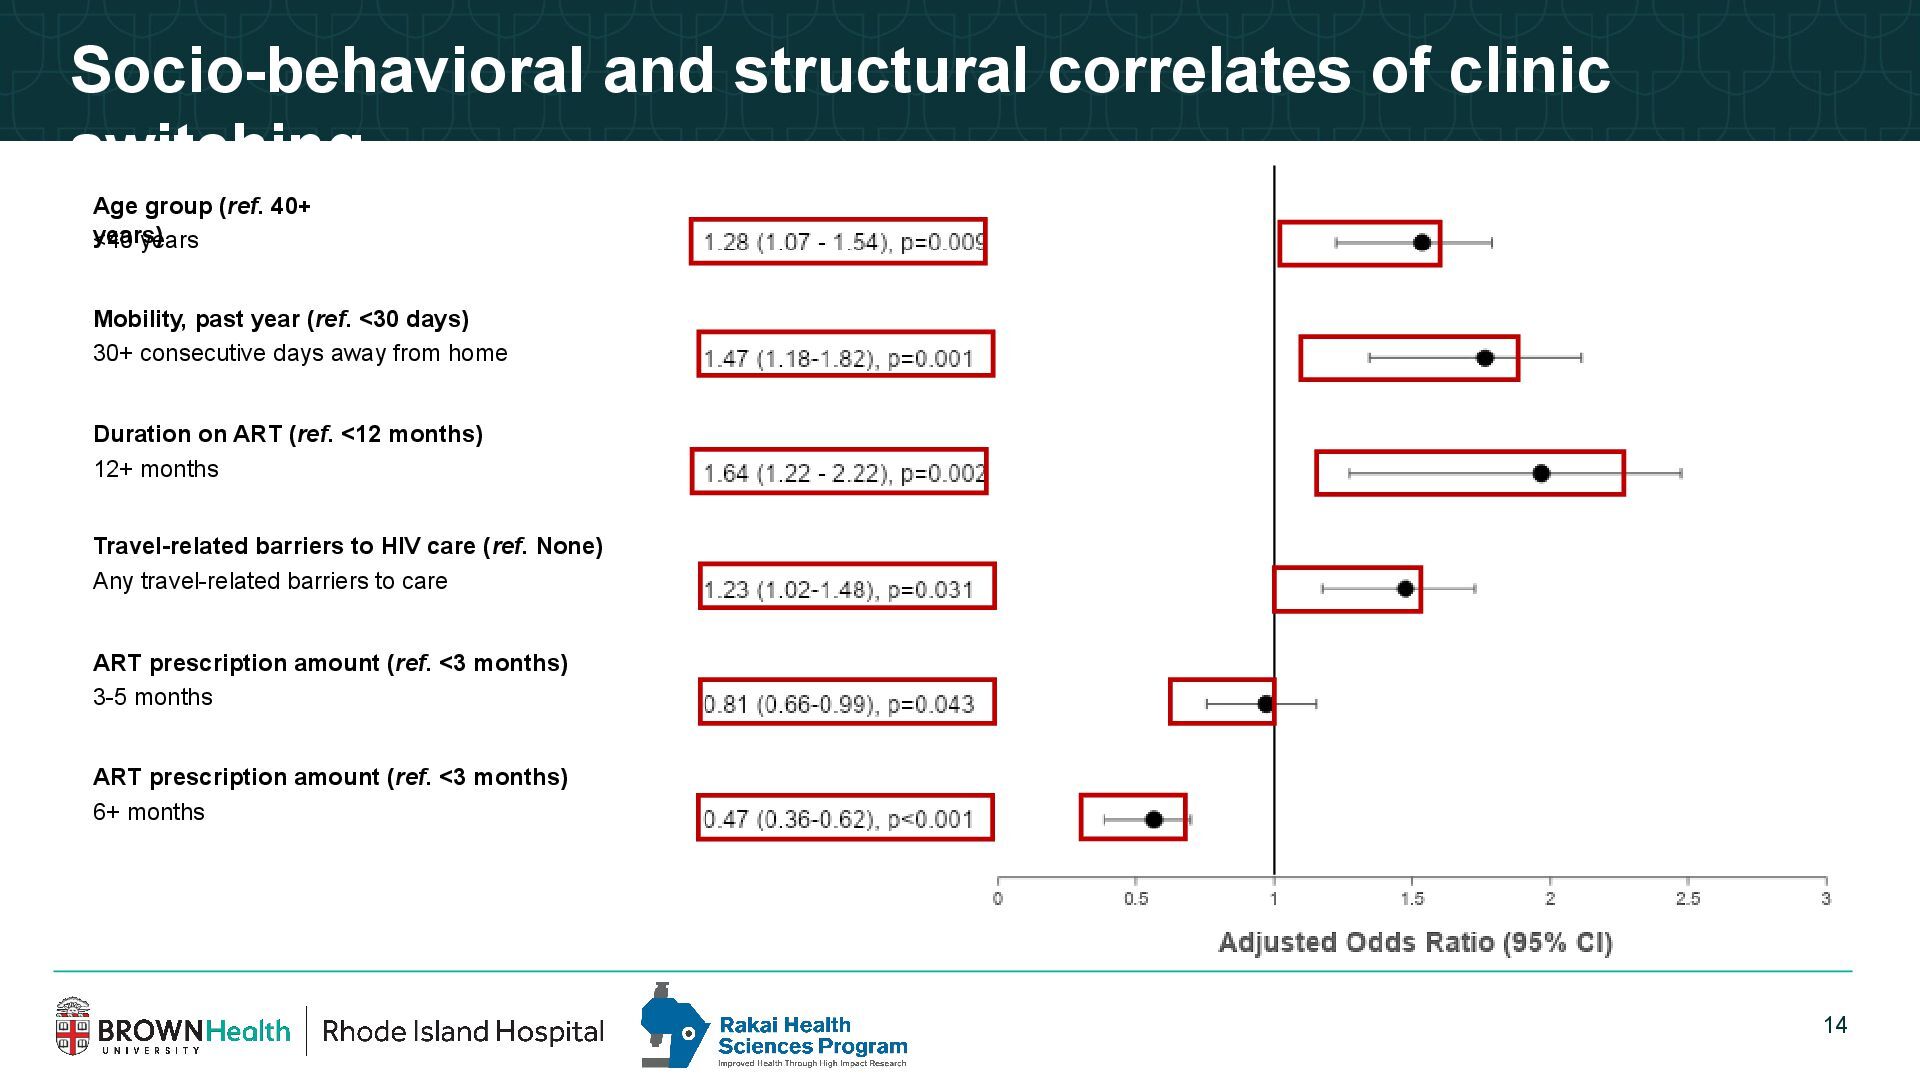
  11. 14 Socio-behavioral and structural correlates of clinic switching <40 years

    Age group (ref. 40+ years) 30+ consecutive days away from home Mobility, past year (ref. <30 days) 12+ months Duration on ART (ref. <12 months) Any travel-related barriers to care Travel-related barriers to HIV care (ref. None) 3-5 months ART prescription amount (ref. <3 months) 6+ months ART prescription amount (ref. <3 months)
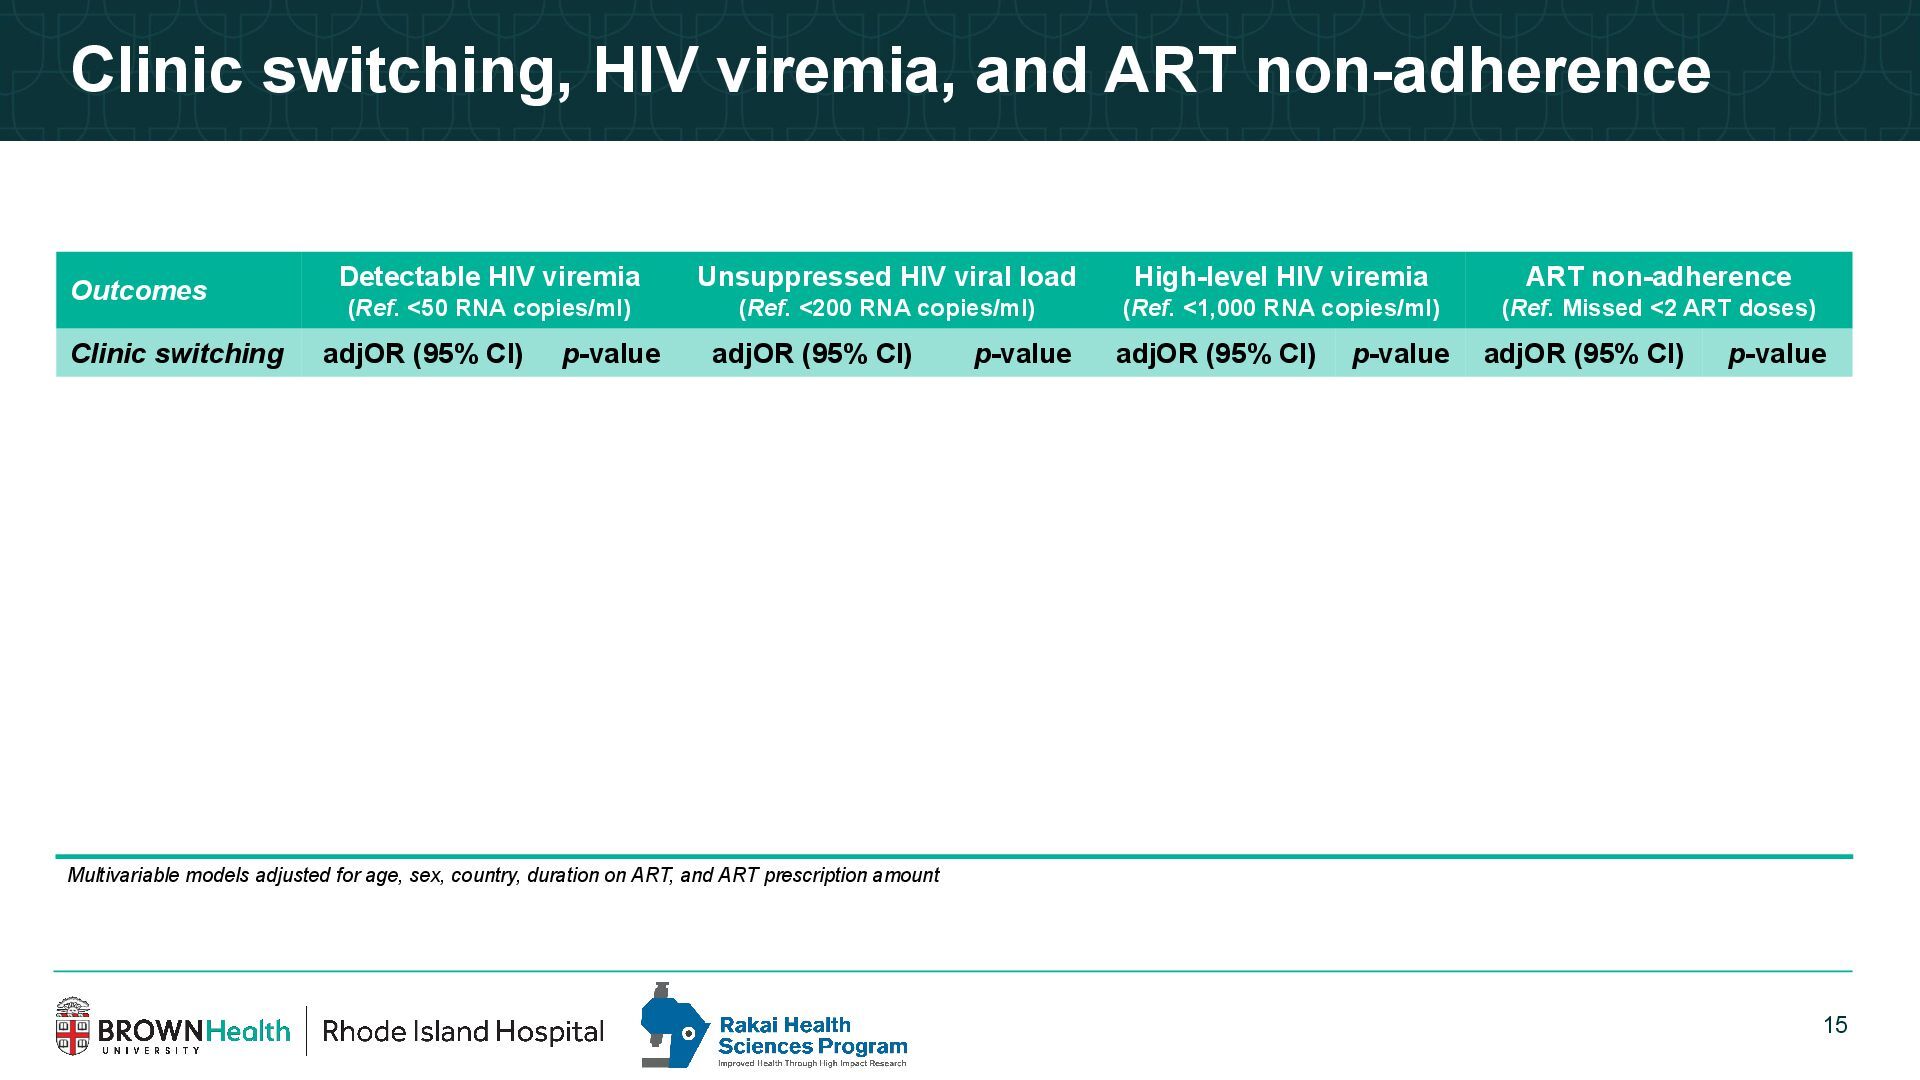
  12. 15 Clinic switching, HIV viremia, and ART non-adherence Outcomes Detectable

    HIV viremia (Ref. <50 RNA copies/ml) Unsuppressed HIV viral load (Ref. <200 RNA copies/ml) High-level HIV viremia (Ref. <1,000 RNA copies/ml) ART non-adherence (Ref. Missed <2 ART doses) Clinic switching adjOR (95% CI) p-value adjOR (95% CI) p-value adjOR (95% CI) p-value adjOR (95% CI) p-value Overall 1.05 (0.87-1.27) 0.563 0.90 (0.71-1.12) 0.325 0.83 (0.59-1.17) 0.282 1.29 (1.03-1.61) 0.028 Age group <40 years 1.12 (0.85-1.46) 0.411 0.80 (0.57-1.14) 0.208 0.73 (0.46-1.14) 0.157 1.37 (1.02-1.86) 0.040 40+ years 0.98 (0.77-1.26) 0.893 1.05 (0.75-1.49) 0.757 1.09 (0.67-1.78) 0.710 1.18 (0.83-1.67) 0.342 Sex Male 0.79 (0.58-1.08) 0.135 0.84 (0.57-1.25) 0.375 0.85 (0.48-1.51) 0.561 1.24 (0.81-1.91) 0.307 Female 1.23 (1.01-1.52) 0.047 0.93 (0.70-1.23) 0.579 0.82 (0.56-1.19) 0.278 1.32 (1.02-1.72) 0.038 Residence Urban 1.04 (0.77-1.40) 0.806 0.87 (0.60-1.27) 0.457 0.63 (0.36-1.10) 0.101 1.21 (0.85-1.72) 0.279 Rural 1.07 (0.85-1.34) 0.558 0.91 (0.68-1.22) 0.527 0.97 (0.63-1.49) 0.895 1.35 (1.02-1.79) 0.037 Multivariable models adjusted for age, sex, country, duration on ART, and ART prescription amount
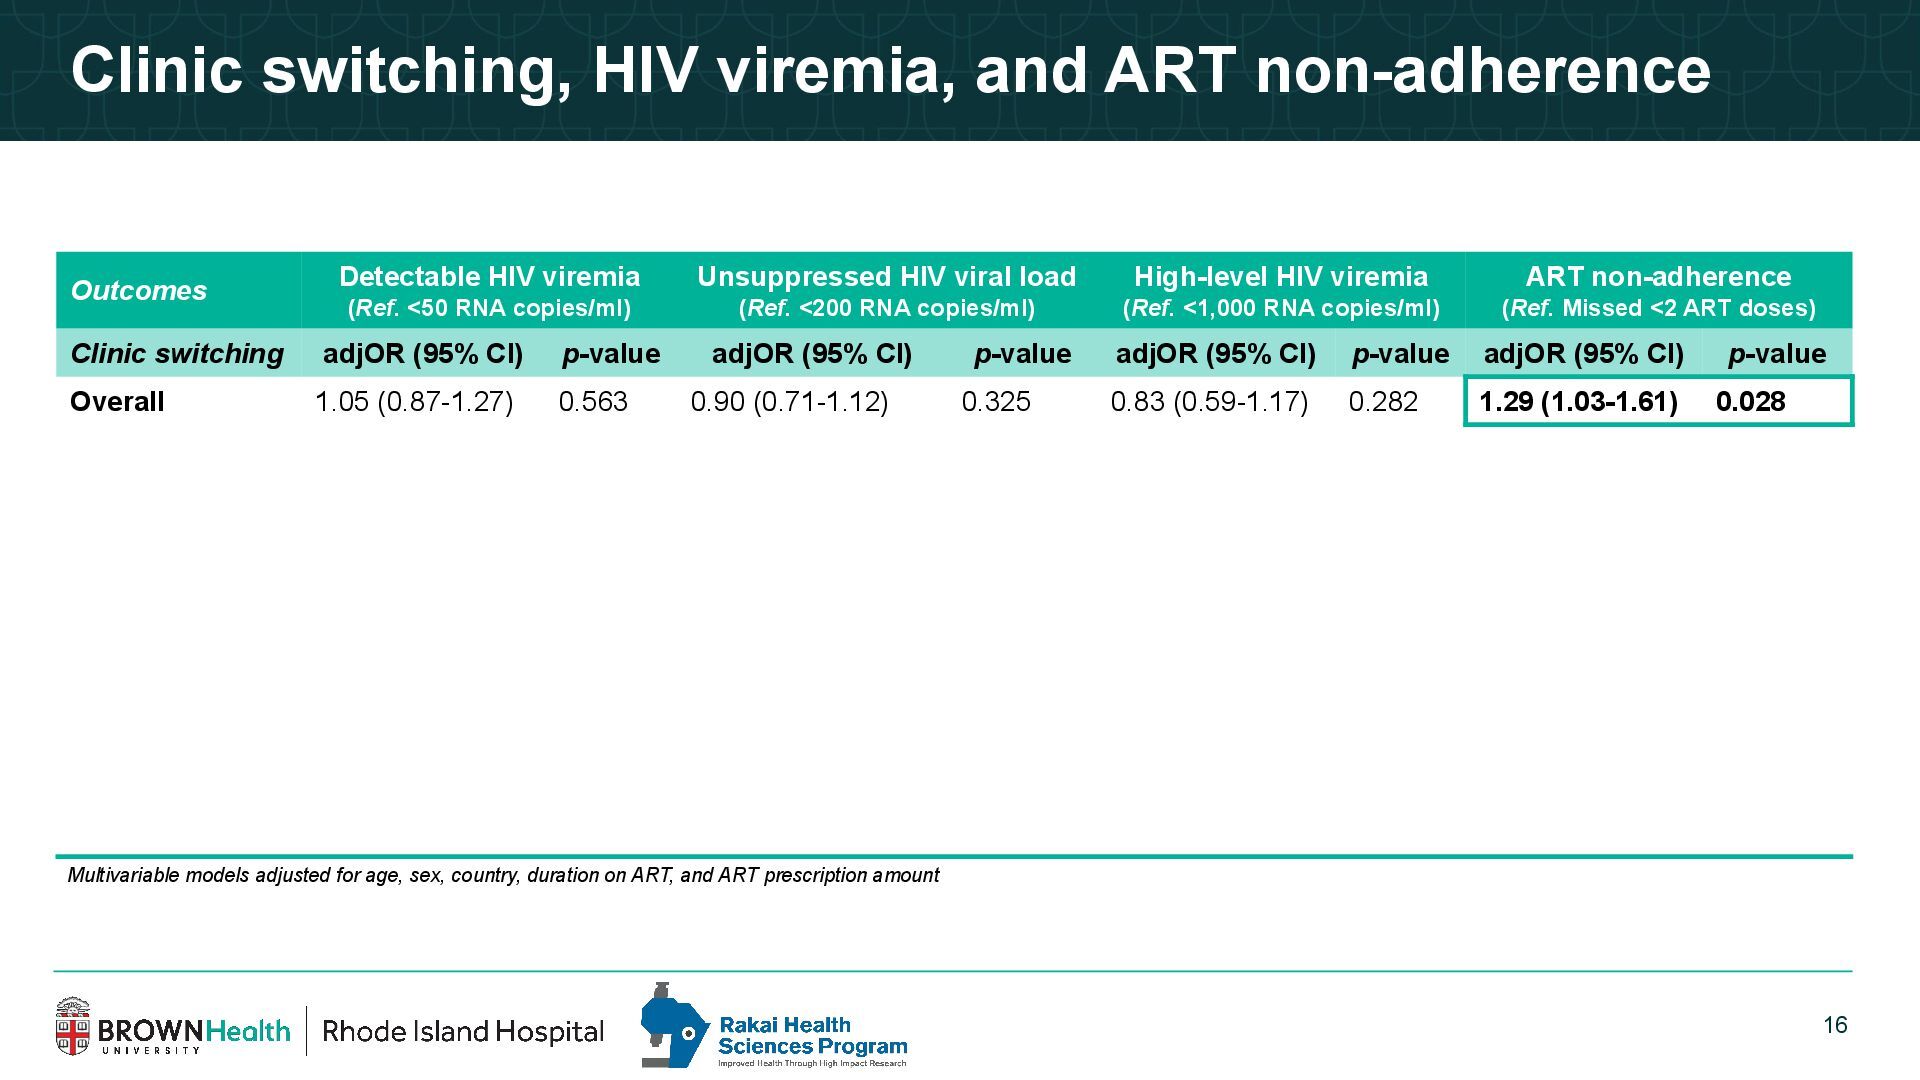
  13. 16 Clinic switching, HIV viremia, and ART non-adherence Outcomes Detectable

    HIV viremia (Ref. <50 RNA copies/ml) Unsuppressed HIV viral load (Ref. <200 RNA copies/ml) High-level HIV viremia (Ref. <1,000 RNA copies/ml) ART non-adherence (Ref. Missed <2 ART doses) Clinic switching adjOR (95% CI) p-value adjOR (95% CI) p-value adjOR (95% CI) p-value adjOR (95% CI) p-value Overall 1.05 (0.87-1.27) 0.563 0.90 (0.71-1.12) 0.325 0.83 (0.59-1.17) 0.282 1.29 (1.03-1.61) 0.028 Age group <40 years 1.12 (0.85-1.46) 0.411 0.80 (0.57-1.14) 0.208 0.73 (0.46-1.14) 0.157 1.37 (1.02-1.86) 0.040 40+ years 0.98 (0.77-1.26) 0.893 1.05 (0.75-1.49) 0.757 1.09 (0.67-1.78) 0.710 1.18 (0.83-1.67) 0.342 Sex Male 0.79 (0.58-1.08) 0.135 0.84 (0.57-1.25) 0.375 0.85 (0.48-1.51) 0.561 1.24 (0.81-1.91) 0.307 Female 1.23 (1.01-1.52) 0.047 0.93 (0.70-1.23) 0.579 0.82 (0.56-1.19) 0.278 1.32 (1.02-1.72) 0.038 Residence Urban 1.04 (0.77-1.40) 0.806 0.87 (0.60-1.27) 0.457 0.63 (0.36-1.10) 0.101 1.21 (0.85-1.72) 0.279 Rural 1.07 (0.85-1.34) 0.558 0.91 (0.68-1.22) 0.527 0.97 (0.63-1.49) 0.895 1.35 (1.02-1.79) 0.037 Multivariable models adjusted for age, sex, country, duration on ART, and ART prescription amount
  14. 17 Clinic switching, HIV viremia, and ART non-adherence Outcomes Detectable

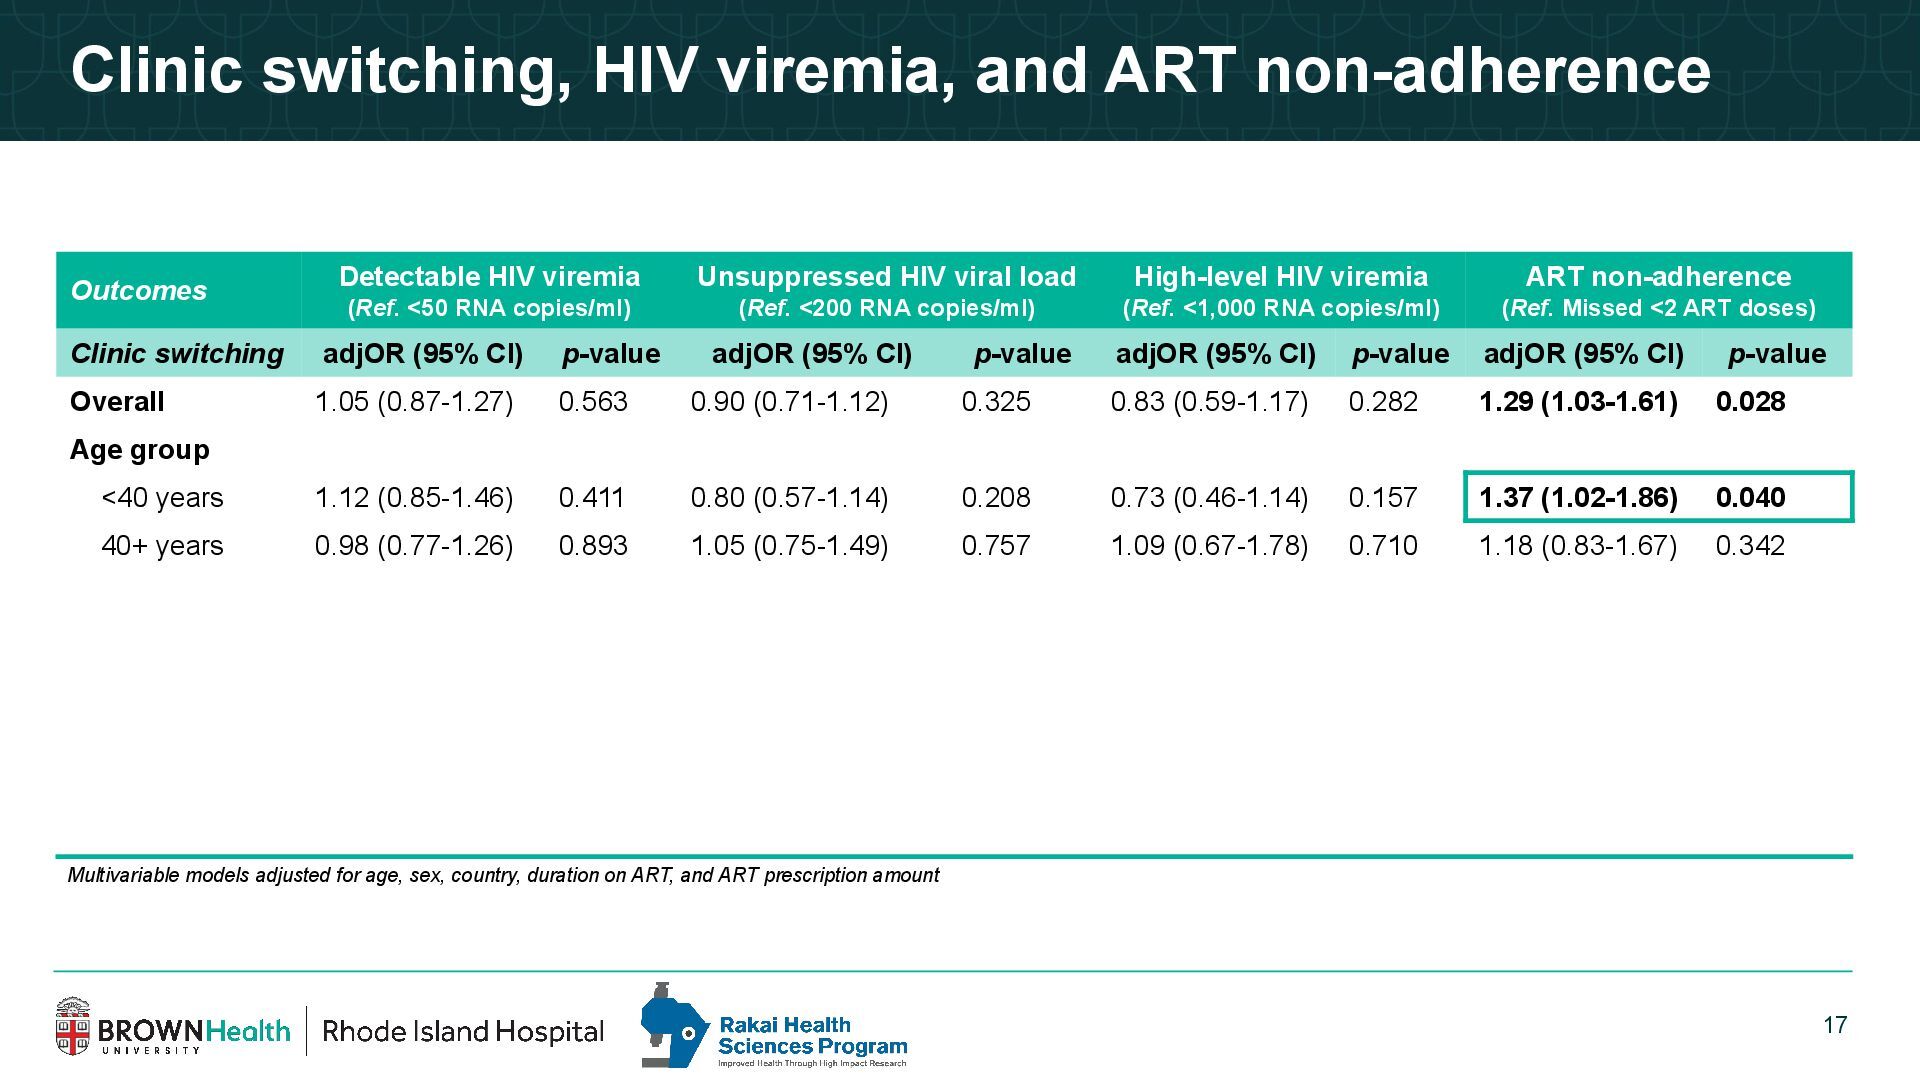
    HIV viremia (Ref. <50 RNA copies/ml) Unsuppressed HIV viral load (Ref. <200 RNA copies/ml) High-level HIV viremia (Ref. <1,000 RNA copies/ml) ART non-adherence (Ref. Missed <2 ART doses) Clinic switching adjOR (95% CI) p-value adjOR (95% CI) p-value adjOR (95% CI) p-value adjOR (95% CI) p-value Overall 1.05 (0.87-1.27) 0.563 0.90 (0.71-1.12) 0.325 0.83 (0.59-1.17) 0.282 1.29 (1.03-1.61) 0.028 Age group <40 years 1.12 (0.85-1.46) 0.411 0.80 (0.57-1.14) 0.208 0.73 (0.46-1.14) 0.157 1.37 (1.02-1.86) 0.040 40+ years 0.98 (0.77-1.26) 0.893 1.05 (0.75-1.49) 0.757 1.09 (0.67-1.78) 0.710 1.18 (0.83-1.67) 0.342 Sex Male 0.79 (0.58-1.08) 0.135 0.84 (0.57-1.25) 0.375 0.85 (0.48-1.51) 0.561 1.24 (0.81-1.91) 0.307 Female 1.23 (1.01-1.52) 0.047 0.93 (0.70-1.23) 0.579 0.82 (0.56-1.19) 0.278 1.32 (1.02-1.72) 0.038 Residence Urban 1.04 (0.77-1.40) 0.806 0.87 (0.60-1.27) 0.457 0.63 (0.36-1.10) 0.101 1.21 (0.85-1.72) 0.279 Rural 1.07 (0.85-1.34) 0.558 0.91 (0.68-1.22) 0.527 0.97 (0.63-1.49) 0.895 1.35 (1.02-1.79) 0.037 Multivariable models adjusted for age, sex, country, duration on ART, and ART prescription amount
  15. 18 Clinic switching, HIV viremia, and ART non-adherence Outcomes Detectable

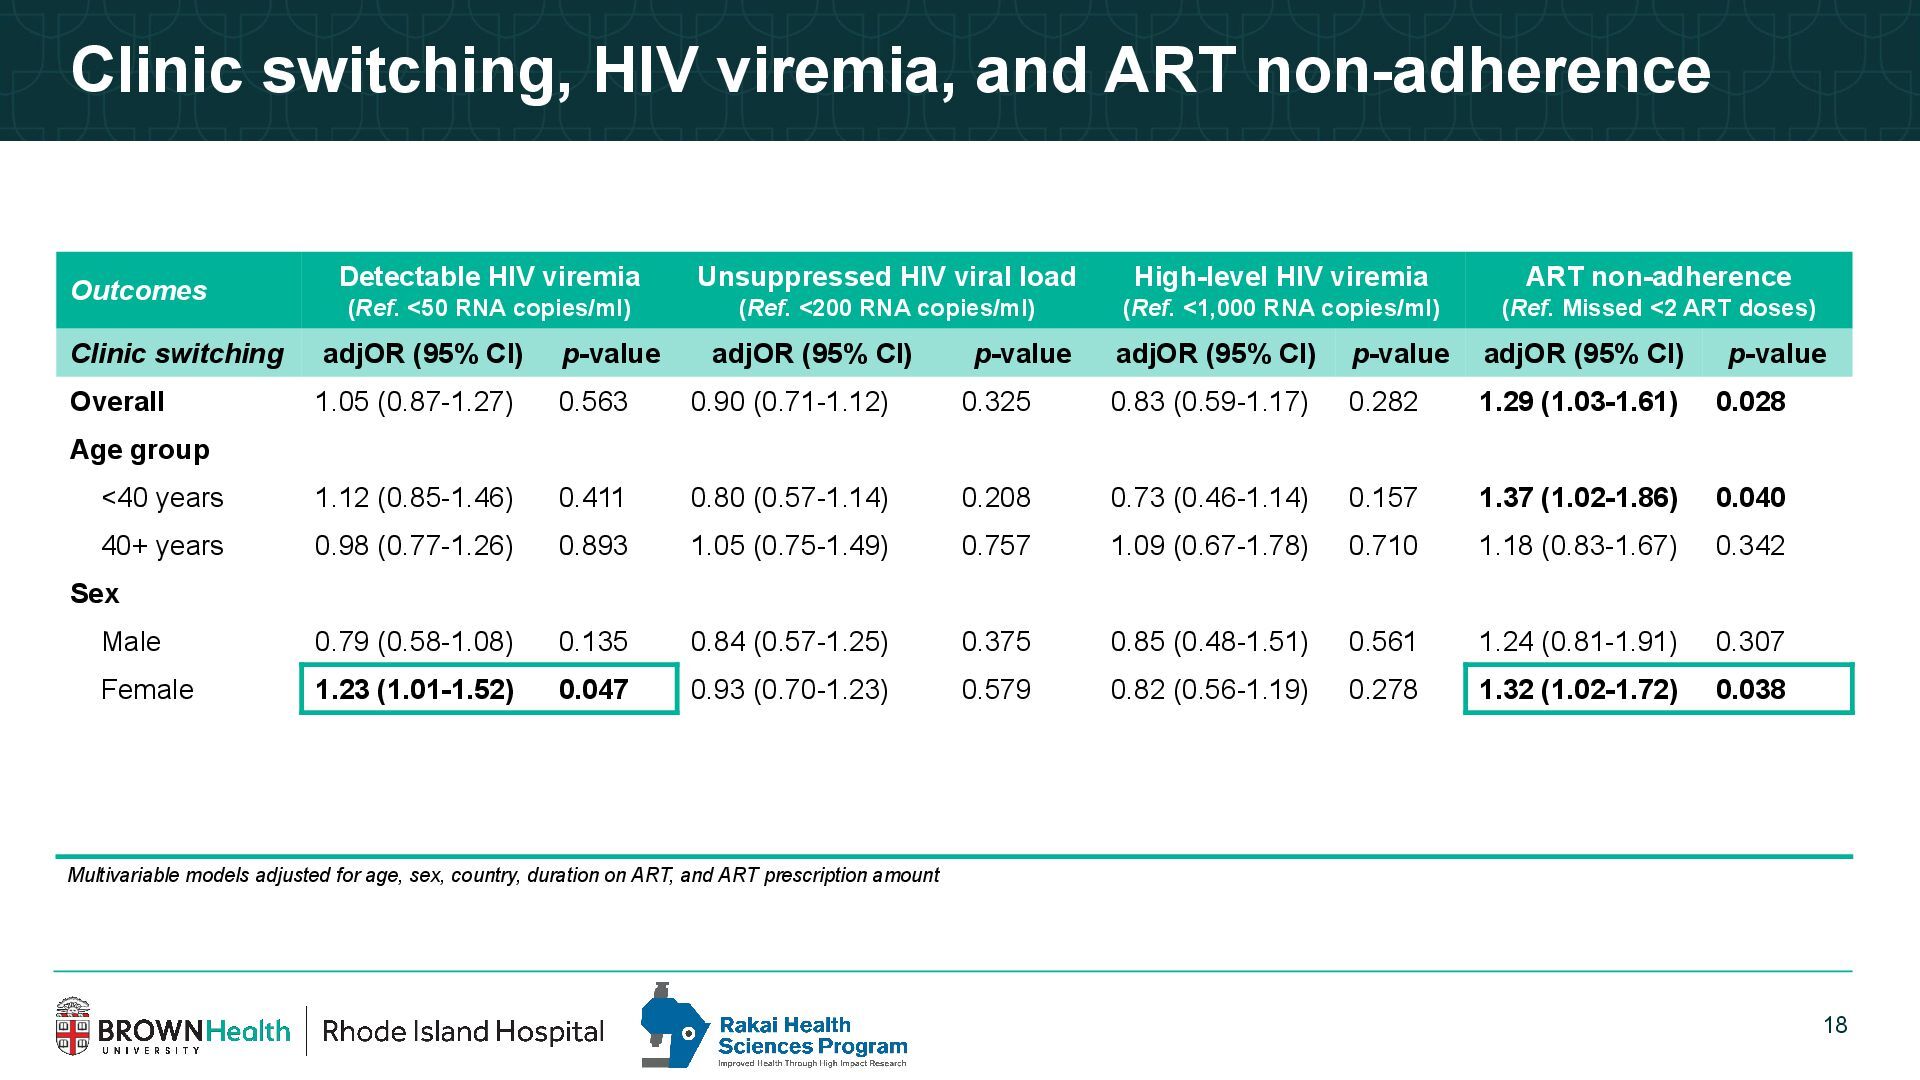
    HIV viremia (Ref. <50 RNA copies/ml) Unsuppressed HIV viral load (Ref. <200 RNA copies/ml) High-level HIV viremia (Ref. <1,000 RNA copies/ml) ART non-adherence (Ref. Missed <2 ART doses) Clinic switching adjOR (95% CI) p-value adjOR (95% CI) p-value adjOR (95% CI) p-value adjOR (95% CI) p-value Overall 1.05 (0.87-1.27) 0.563 0.90 (0.71-1.12) 0.325 0.83 (0.59-1.17) 0.282 1.29 (1.03-1.61) 0.028 Age group <40 years 1.12 (0.85-1.46) 0.411 0.80 (0.57-1.14) 0.208 0.73 (0.46-1.14) 0.157 1.37 (1.02-1.86) 0.040 40+ years 0.98 (0.77-1.26) 0.893 1.05 (0.75-1.49) 0.757 1.09 (0.67-1.78) 0.710 1.18 (0.83-1.67) 0.342 Sex Male 0.79 (0.58-1.08) 0.135 0.84 (0.57-1.25) 0.375 0.85 (0.48-1.51) 0.561 1.24 (0.81-1.91) 0.307 Female 1.23 (1.01-1.52) 0.047 0.93 (0.70-1.23) 0.579 0.82 (0.56-1.19) 0.278 1.32 (1.02-1.72) 0.038 Residence Urban 1.04 (0.77-1.40) 0.806 0.87 (0.60-1.27) 0.457 0.63 (0.36-1.10) 0.101 1.21 (0.85-1.72) 0.279 Rural 1.07 (0.85-1.34) 0.558 0.91 (0.68-1.22) 0.527 0.97 (0.63-1.49) 0.895 1.35 (1.02-1.79) 0.037 Multivariable models adjusted for age, sex, country, duration on ART, and ART prescription amount
  16. 19 Clinic switching, HIV viremia, and ART non-adherence Outcomes Detectable

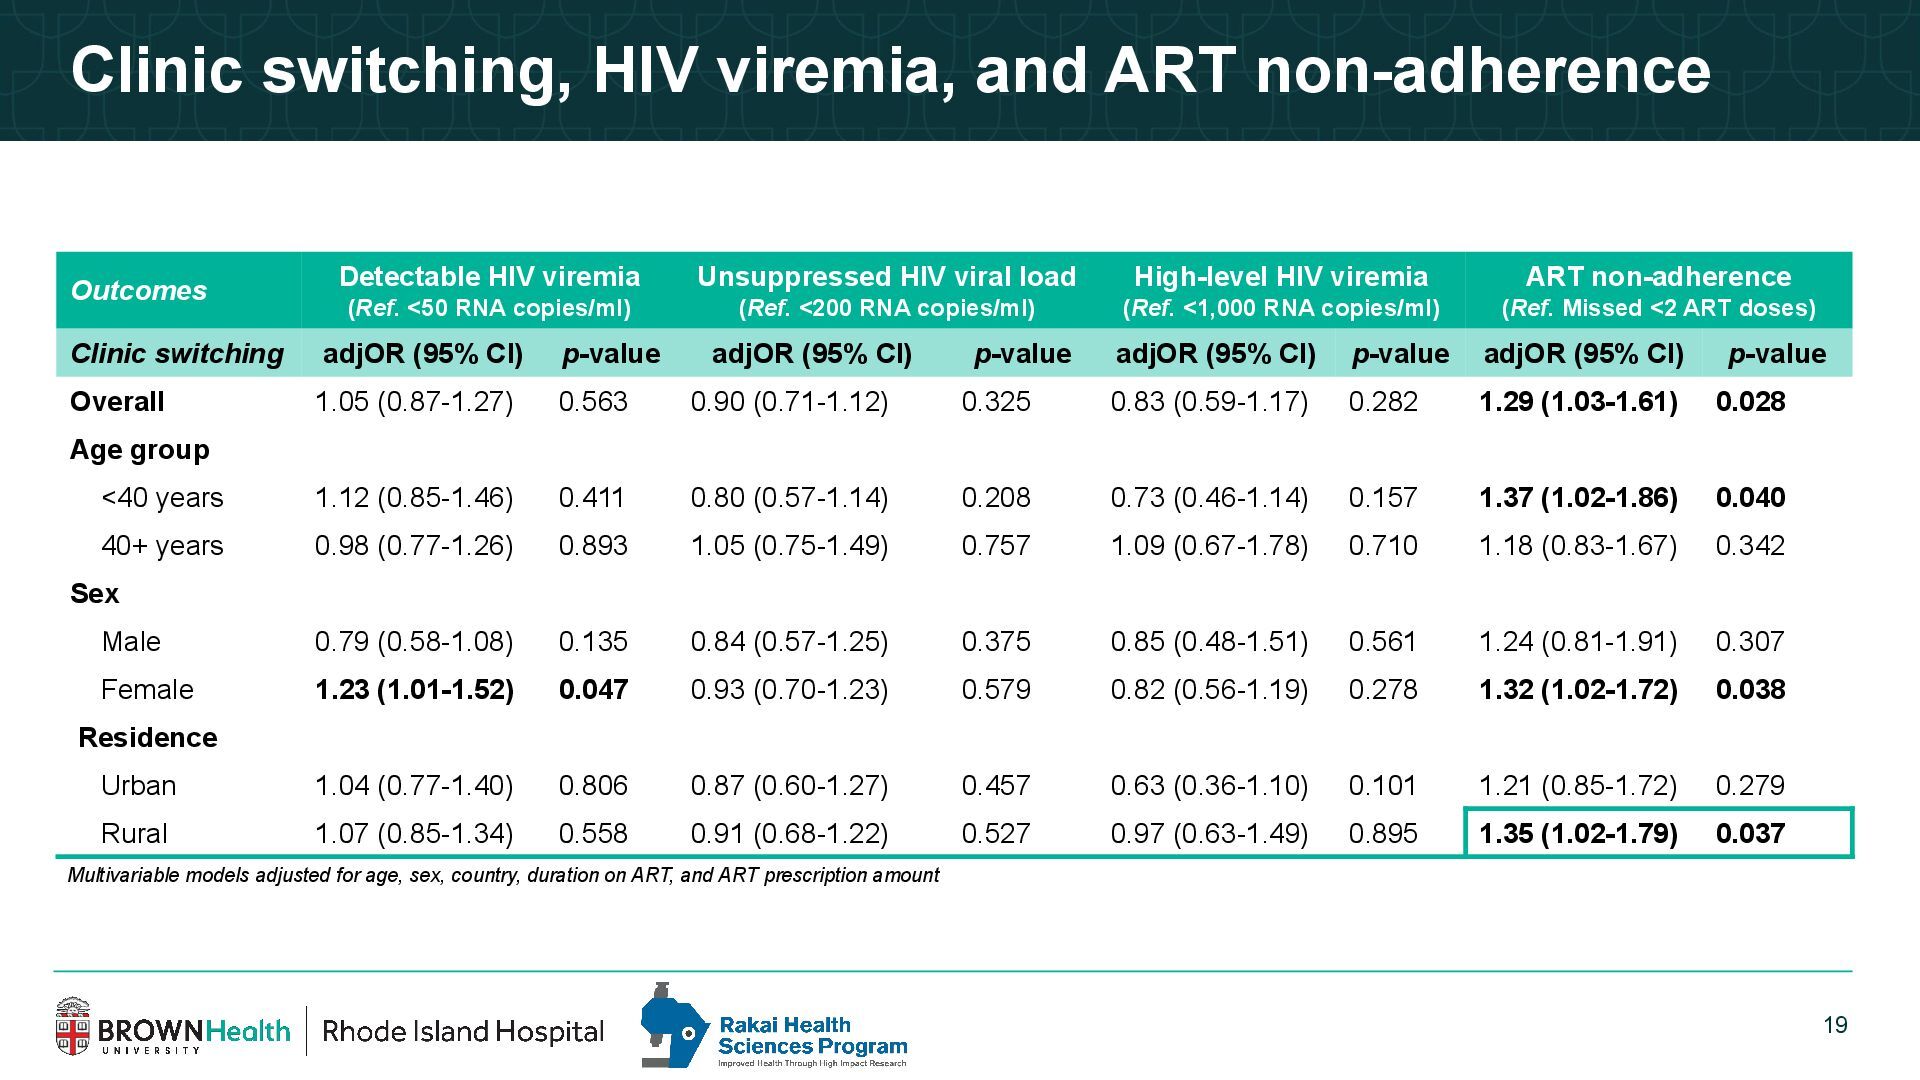
    HIV viremia (Ref. <50 RNA copies/ml) Unsuppressed HIV viral load (Ref. <200 RNA copies/ml) High-level HIV viremia (Ref. <1,000 RNA copies/ml) ART non-adherence (Ref. Missed <2 ART doses) Clinic switching adjOR (95% CI) p-value adjOR (95% CI) p-value adjOR (95% CI) p-value adjOR (95% CI) p-value Overall 1.05 (0.87-1.27) 0.563 0.90 (0.71-1.12) 0.325 0.83 (0.59-1.17) 0.282 1.29 (1.03-1.61) 0.028 Age group <40 years 1.12 (0.85-1.46) 0.411 0.80 (0.57-1.14) 0.208 0.73 (0.46-1.14) 0.157 1.37 (1.02-1.86) 0.040 40+ years 0.98 (0.77-1.26) 0.893 1.05 (0.75-1.49) 0.757 1.09 (0.67-1.78) 0.710 1.18 (0.83-1.67) 0.342 Sex Male 0.79 (0.58-1.08) 0.135 0.84 (0.57-1.25) 0.375 0.85 (0.48-1.51) 0.561 1.24 (0.81-1.91) 0.307 Female 1.23 (1.01-1.52) 0.047 0.93 (0.70-1.23) 0.579 0.82 (0.56-1.19) 0.278 1.32 (1.02-1.72) 0.038 Residence Urban 1.04 (0.77-1.40) 0.806 0.87 (0.60-1.27) 0.457 0.63 (0.36-1.10) 0.101 1.21 (0.85-1.72) 0.279 Rural 1.07 (0.85-1.34) 0.558 0.91 (0.68-1.22) 0.527 0.97 (0.63-1.49) 0.895 1.35 (1.02-1.79) 0.037 Multivariable models adjusted for age, sex, country, duration on ART, and ART prescription amount
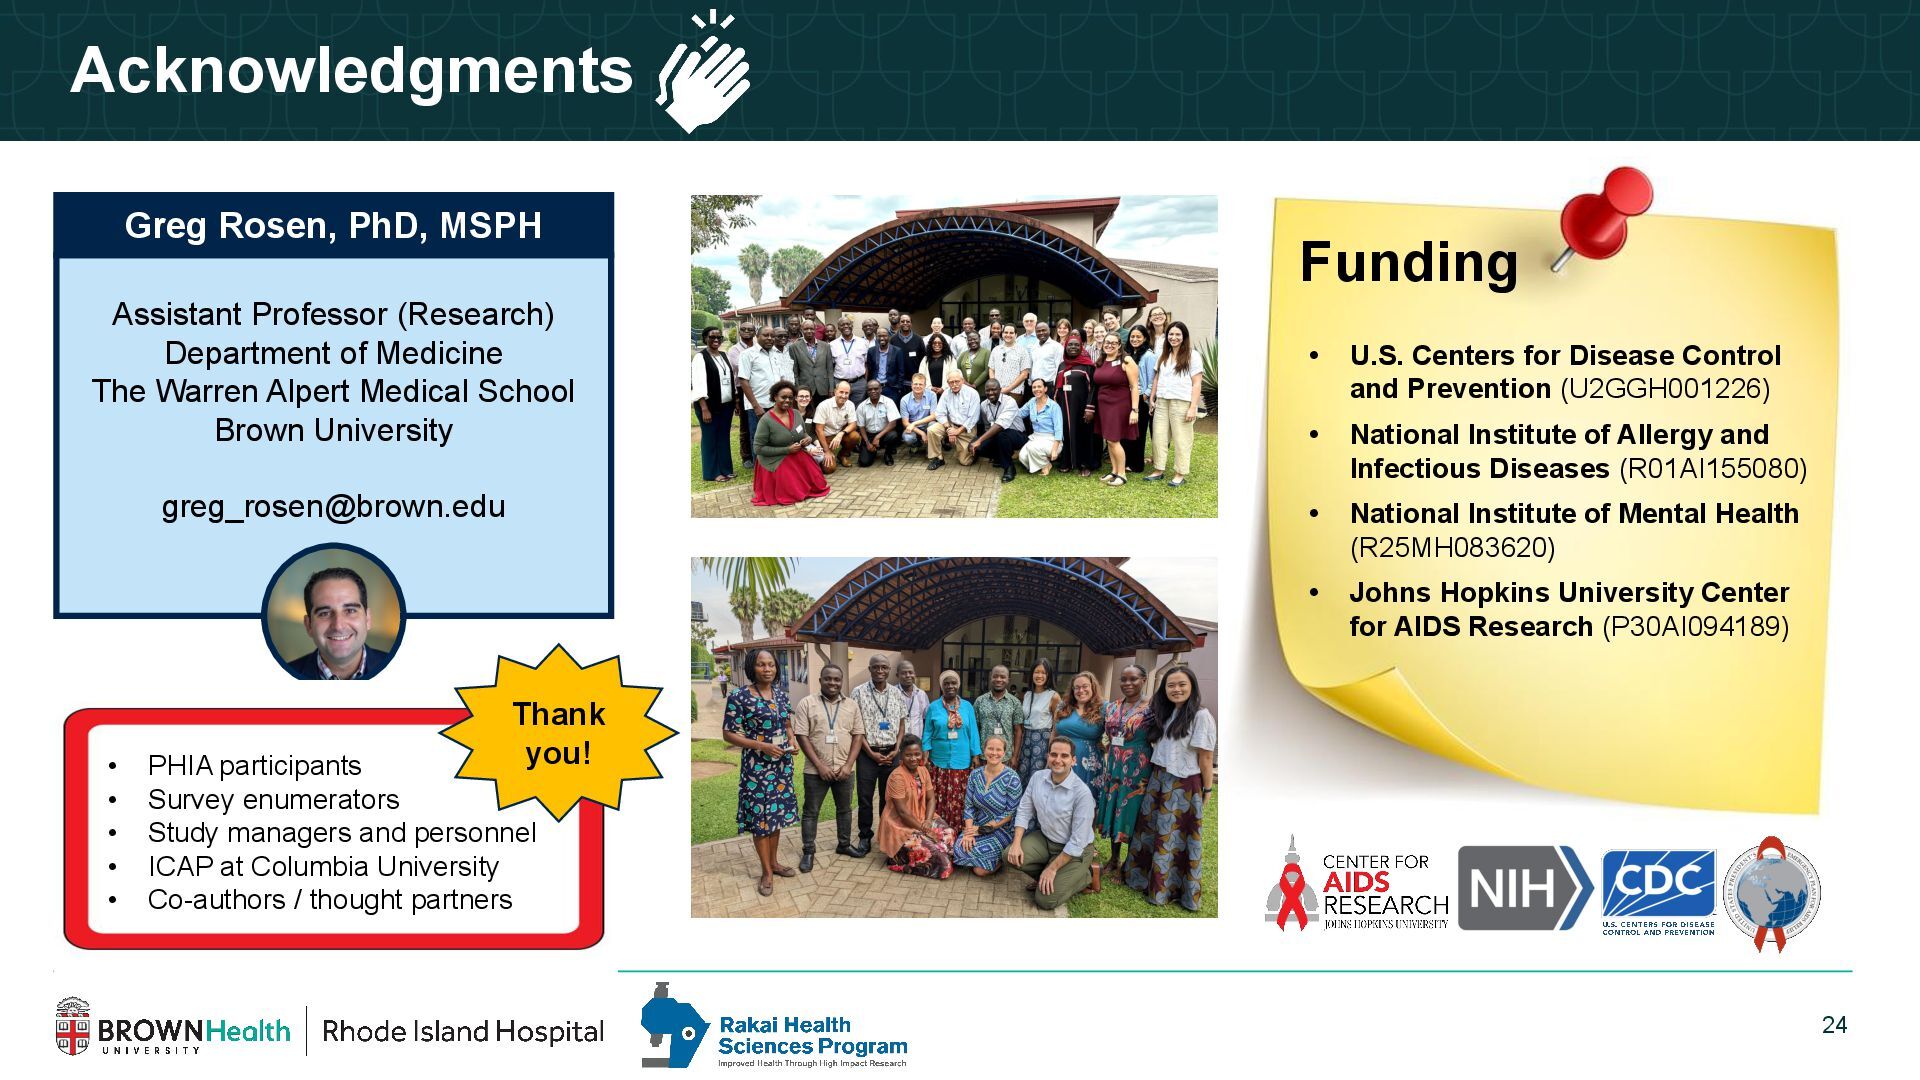
  17. 24 Acknowledgments Funding • U.S. Centers for Disease Control and

    Prevention (U2GGH001226) • National Institute of Allergy and Infectious Diseases (R01AI155080) • National Institute of Mental Health (R25MH083620) • Johns Hopkins University Center for AIDS Research (P30AI094189) Assistant Professor (Research) Department of Medicine The Warren Alpert Medical School Brown University [email protected] Greg Rosen, PhD, MSPH • PHIA participants • Survey enumerators • Study managers and personnel • ICAP at Columbia University • Co-authors / thought partners Thank you!