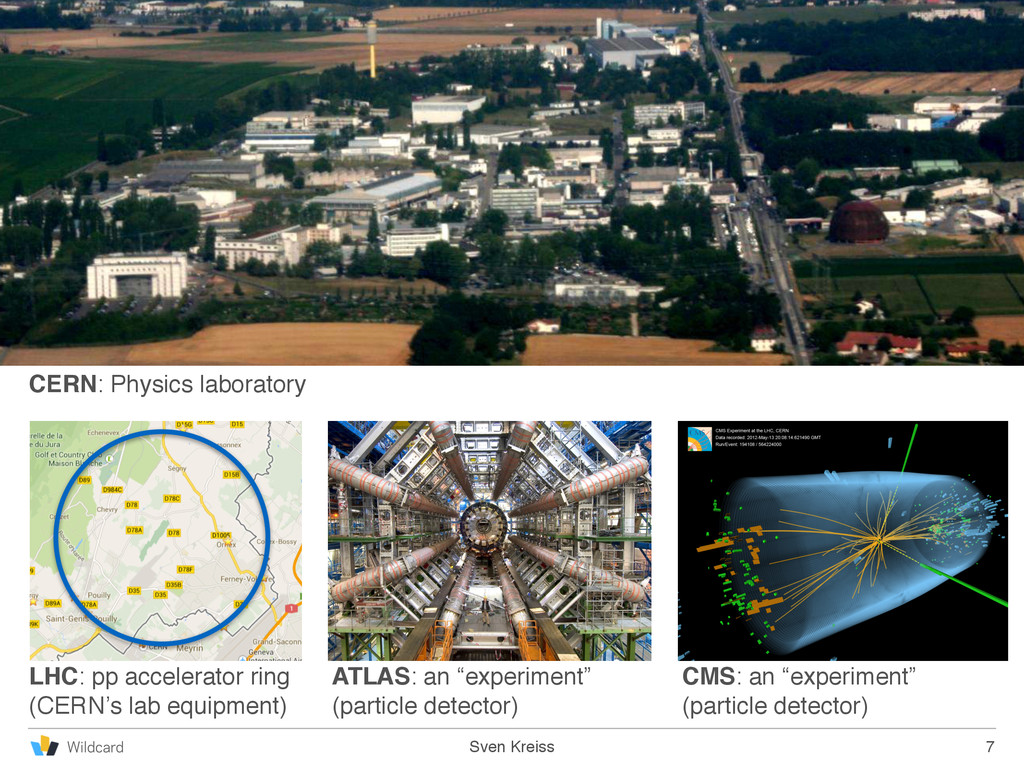
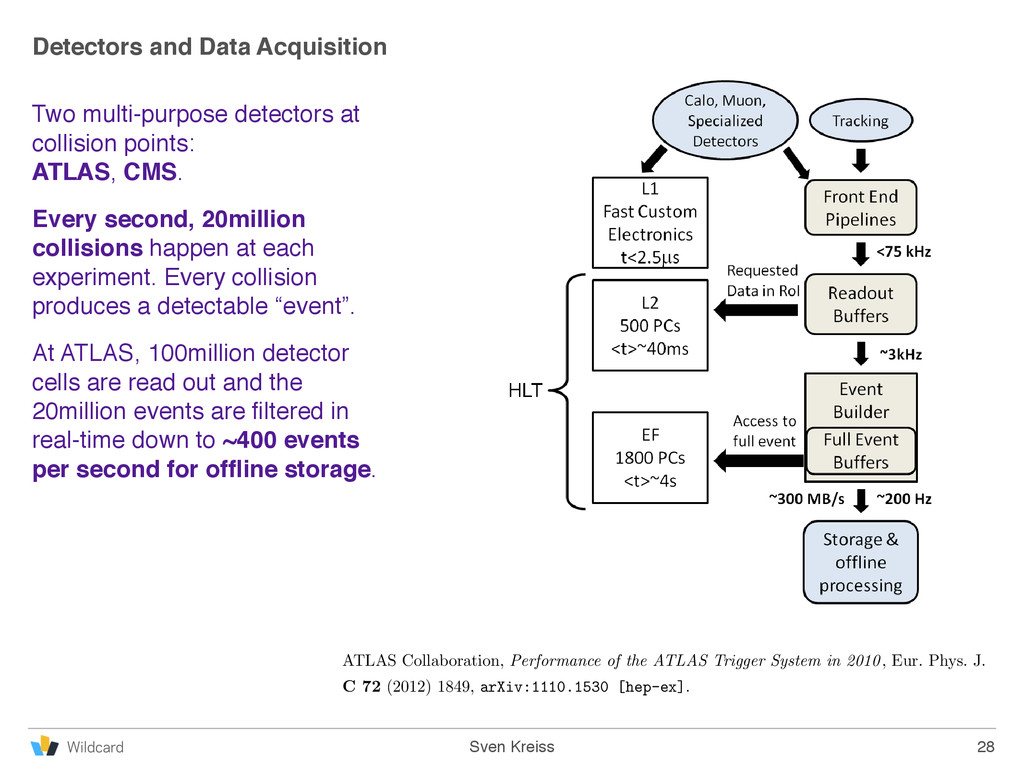
Upgrade to Pro — share decks privately, control downloads, hide ads and more …

Data and Higgs Discovery

Data and Higgs Discovery

High level view of my work at CERN and a little tailored towards a data science/engineering audience. Presented at a brown bag seminar at Betaworks.

Sven Kreiss

May 14, 2015
Tweet

More Decks by Sven Kreiss

Other Decks in Science

Transcript

  1. Data and Higgs Boson Discovery CERN, LHC, ATLAS, Geneva. Sven

    Kreiss now Data Scientist at Wildcard, previously Particle Physics PhD at NYU May 14, 2015 at Betaworks, New York Wildcard
  2. Sven Kreiss Yves Sirois, LHC Days in Split Croatia, October

    2012, Slide 6 Different Perspectives of the Higgs Story 2
  3. Sven Kreiss My Part of the Story “Chasing the Higgs”

    by Dennis Overbye. The article was the entire science section of the New York Times on March 5, 2013. My paragraph: 3 [GeV] H m 110 120 130 140 150 160 170 180 0 local p -8 10 -7 10 -6 10 -5 10 -4 10 -3 10 -2 10 -1 10 1 10 2 10 llll a a + llll a a llll a a + llll a a ATLAS Internal -1 Ldt = 4.8 + 5.9 fb 0 = 7 and 8 TeV s m 2 m 3 m 4 m 5
  4. https://atlas.web.cern.ch/Atlas/GROUPS/PHYSICS/PAPERS/HIGG-2012-27/ Physics Letters B 716 (2012) 1–29 Contents lists available

    at SciVerse ScienceDirect Physics Letters B www.elsevier.com/locate/physletb Observation of a new particle in the search for the Standard Model Higgs boson with the ATLAS detector at the LHC ✩ .ATLAS Collaboration ⋆ This paper is dedicated to the memory of our ATLAS colleagues who did not live to see the full impact and significance of their contributions to the experiment. a r t i c l e i n f o a b s t r a c t Article history: Received 31 July 2012 Received in revised form 8 August 2012 Accepted 11 August 2012 Available online 14 August 2012 Editor: W.-D. Schlatter A search for the Standard Model Higgs boson in proton–proton collisions with the ATLAS detector at the LHC is presented. The datasets used correspond to integrated luminosities of approximately 4.8 fb−1 collected at √ s = 7 TeV in 2011 and 5.8 fb−1 at √ s = 8 TeV in 2012. Individual searches in the channels H → Z Z(∗) → 4ℓ, H → γ γ and H → W W (∗) → eνµν in the 8 TeV data are combined with previously published results of searches for H → Z Z(∗), W W (∗), b¯ b and τ+τ− in the 7 TeV data and results from improved analyses of the H → Z Z(∗) → 4ℓ and H → γ γ channels in the 7 TeV data. Clear evidence for the production of a neutral boson with a measured mass of 126.0±0.4 (stat)±0.4 (sys) GeV is presented. This observation, which has a significance of 5.9 standard deviations, corresponding to a background fluctuation probability of 1.7 × 10⁻⁹, is compatible with the production and decay of the Standard Model Higgs boson. © 2012 CERN. Published by Elsevier B.V. All rights reserved. 1. Introduction The Standard Model (SM) of particle physics [1–4] has been tested by many experiments over the last four decades and has been shown to successfully describe high energy particle interac- tions. However, the mechanism that breaks electroweak symmetry in the SM has not been verified experimentally. This mechanism [5–10], which gives mass to massive elementary particles, implies 120–135 GeV; using the existing LHC constraints, the observed lo- cal significances for mH = 125 GeV are 2.7σ for CDF [14], 1.1σ for DØ [15] and 2.8σ for their combination [16]. The previous ATLAS searches in 4.6–4.8 fb−1 of data at √ s = 7 TeV are combined here with new searches for H → Z Z(∗) → 4ℓ,1 H → γ γ and H → W W (∗) → eνµν in the 5.8–5.9 fb−1 of pp col- lision data taken at √ s = 8 TeV between April and June 2012. The data were recorded with instantaneous luminosities up to
  5. Sven Kreiss [GeV] H m 100 200 300 400 500

    600 0 Local p -9 10 -8 10 -7 10 -6 10 -5 10 -4 10 -3 10 -2 10 -1 10 1 Expected Combined Observed Combined γ γ → Expected H γ γ → Observed H bb → Expected H bb → Observed H llll → ZZ* → Expected H llll → ZZ* → Observed H ν ν ll → ZZ* → Expected H ν ν ll → ZZ* → Observed H llqq → ZZ* → Expected H llqq → ZZ* → Observed H ν l ν l → WW* → Expected H ν l ν l → WW* → Observed H qq ν l → WW* → Expected H qq ν l → WW* → Observed H τ τ → Expected H τ τ → Observed H ATLAS 2011 + 2012 Data = 7 TeV s , -1 L dt ~ 4.6-4.8 fb ∫ = 8 TeV s , -1 L dt ~ 5.8-5.9 fb ∫ σ 0 σ 1 σ 2 σ 3 σ 4 σ 5 σ 6 < 2σ Official Discovery Including the Look- Elsewhere-Effect, the significance is still 5.1σ. 5 [GeV] H m 110 115 120 125 130 135 140 145 150 0 Local p -11 10 -10 10 -9 10 -8 10 -7 10 -6 10 -5 10 -4 10 -3 10 -2 10 -1 10 1 Obs. Exp. σ 1 ± -1 Ldt = 5.8-5.9 fb ∫ = 8 TeV: s -1 Ldt = 4.6-4.8 fb ∫ = 7 TeV: s ATLAS 2011 - 2012 σ 0 σ 1 σ 2 σ 3 σ 4 σ 5 σ 6 5.9σ The local p0 value is below 2σ in the rest of the tested parameter range.
  6. Sven Kreiss Terminology 7 CERN: Physics laboratory LHC: pp accelerator

    ring
 (CERN’s lab equipment) CMS: an “experiment”
 (particle detector) ATLAS: an “experiment”
 (particle detector)
  7. Sven Kreiss LHC 
 Proton-Proton collider with 17 miles circumference

    in a tunnel 300 feet underground that already housed the previous collider. Collides bunches of protons. 1232 magnets, each 50 feet long with a weight of 35 tonnes. 13 http://thescienceteacher.co.uk/moles/ 1 mol
 ~ 1023 Protons in LHC:
 ~1014
  8. Sven Kreiss Beam Dump http://lhc-machine-outreach.web.cern.ch/lhc- machine-outreach/components/beam-dump.htm 
 “Each beam dump

    absorber consists of a 7m long segmented carbon cylinder of 700mm diameter, contained in a steel cylinder, comprising the dump core (TDE). This is water cooled, and surrounded by about 750 tonnes of concrete and iron shielding. The dump is housed in a dedicated cavern (UD) at the end of the transfer tunnels (TD).” http://spectrum.ieee.org/aerospace/astrophysics/ cern-to-start-up-the-large-hadron-collider-now-heres- how-it-plans-to-stop-it “In experiments, researchers found that an 86-microsecond exposure of the beam would bore a hole 40 meters [130 feet] into a block of copper.” Carbon heats up: up to 800°C (1470°F) at the center of the “hot e”. 15
  9. Sven Kreiss Sven Kreiss ATLAS: ~3000 People Performance groups: e/gamma,

    Flavor tagging, Jet/EtMiss, Tau, Muon, Tracking, Simulation
 Trigger and Luminosity groups
 Physics groups: SM, B, Top, Higgs, SUSY, Exotics, Heavy Ion, Monte Carlo 22
  10. Sven Kreiss Higgs Production and Higgs Decay: Many Options depending

    on production & decay mode, selected events may be:
 high signal-to-background with sharp feature as in H→ZZ
 low signal-to-background with sharp feature as in H→γγ
 intermediate signal-to-background with broad feature as in H→WW our theory predicts the expectations in each production & decay 25 Production\Decay γγ ZZ WW bb ττ Production and Decay of the Standard Model Higgs @ the LHC t, b H W, Z H W, Z W, Z H ¯ t,¯ b H t, b M. Spira Fortsch. Phys. 46 (1998) σ(pp→H+X) [pb] √s = 14 TeV M t = 175 GeV CTEQ4M gg→H qq→Hqq qq _ ’→HW qq _ →HZ gg,qq _ →Htt _ gg,qq _ →Hbb _ M H [GeV] 0 200 400 600 800 1000 10 -4 10 -3 10 -2 10 -1 1 10 10 2 - Gluon-Gluon Fusion dominant production process. - Vector Boson Fusion (Hqq) ≈ 20% of gg at 120 GeV - Associated production with W, Z and heavy quarks have small rate, but can provide trigger independent of H decay September 26, 2006 University of Rochester Seminar Higgs Searches at the LHC: Challenges, Prospects, and Developments (page 10) Kyle Cranmer Brookhaven National Laboratory [GeV] MMC τ τ m 0 50 100 150 200 250 Events / 10 GeV 0 100 200 300 400 500 600 700 800 900 Data τ τ → (125) H τ τ → Z Others Fake Lepton Uncert. Boosted µ µ + µ e + ee ATLAS Preliminary = 8 TeV s Signal Region -1 L dt = 20.3 fb ∫ [GeV] 4l m 100 150 200 250 Events/5 GeV 0 5 10 15 20 25 30 35 40 -1 Ldt = 4.6 fb ∫ = 7 TeV s -1 Ldt = 20.7 fb ∫ = 8 TeV s 4l → ZZ* → H Data 2011+ 2012 SM Higgs Boson =124.3 GeV (fit) H m Background Z, ZZ* t Background Z+jets, t Syst.Unc. ATLAS Events / 4 GeV 10 20 30 40 50 60 ATLAS Preliminary γ γ → H -1 Ldt = 20.7 fb ∫ = 8 TeV, s Loose high-mass two-jet Data 2012 Background model = 126.8 GeV (MC) H SM Higgs boson m [GeV] γ γ m 100 110 120 130 140 150 160 Events - Fit -10 -5 0 5 10 15 Events / 4 GeV 2 4 6 8 10 12 14 ATLAS Preliminary γ γ → H -1 Ldt = 20.7 fb ∫ = 8 TeV, s significance miss T E Data 2012 Background model = 126.8 GeV (MC) H SM Higgs boson m [GeV] γ γ m 100 110 120 130 140 150 160 Events - Fit -3 -2 -1 0 1 2 3 4 5 Events / 4 GeV 5 10 15 20 25 30 35 ATLAS Preliminary γ γ → H -1 Ldt = 20.7 fb ∫ = 8 TeV, s One-lepton Data 2012 Background model = 126.8 GeV (MC) H SM Higgs boson m [GeV] γ γ m 100 110 120 130 140 150 160 Events - Fit -8 -6 -4 -2 0 2 4 6 8 10 Events 10 20 30 40 50 60 70 80 Data VH(bb) (best fit) VZ t t W+bb W+cc W+cl Z+bb Z+bl Z+cc Z+cl Uncertainty Pre-fit background =1.0) µ VH(bb) ( ATLAS Preliminary -1 Ldt = 4.7 fb ∫ = 7 TeV s -1 Ldt = 20.3 fb ∫ = 8 TeV s >200 GeV V T 0 lep., 2 jets, 2 tags, p [GeV] bb m 50 100 150 200 250 Data/MC 0.5 1 1.5 [GeV] MMC τ τ m 0 50 100 150 200 250 Events / 10 GeV 0 100 200 300 400 500 600 700 800 900 Data τ τ → (125) H τ τ → Z Others Fake Lepton Uncert. Boosted µ µ + µ e + ee ATLAS Preliminary = 8 TeV s Signal Region -1 L dt = 20.3 fb ∫
  11. Sven Kreiss Particle Detection and Identification 26 predicted one. The

    di erence is less than 4% [5]. time (ns) 0 100 200 300 400 500 600 700 800 ADC counts -200 0 200 400 600 800 1000 1200 -0.04 -0.02 0 0.02 0.04 Data (Data-Prediction)/Max(Data) Prediction MIDDLE LAYER EM BARREL 2008 ATLAS cosmic muons ATLAS Preliminary Graph Graph Graph Figure 3: Typical ionization pulse shape in the EM barrel. Fi fu th The individual cell energy is reconstructed from t Ecell = FµA MeV FDAC µA where A is the amplitude in ADC counts, G repres di erence of the maxima between the injected and current in DAC units to µA and FµA MeV convert Pedestal, gains and noise are parameters used in http://www-library.desy.de/preparch/desy/proc/proc10-01/meng.pdf
  12. Sven Kreiss Data Challenge Needle in a Haystack • raw

    data rate > 1 TB / sec • can only save 1 in 105 collisions, but still, experiments produce 15 PB / year 
 
 • ~4 billion collisions needed to produce 1 Higgs boson • classification algorithms designed for each production & decay • ~1 trillion collisions needed to produce a Higgs that passes selection 27
  13. Sven Kreiss Detectors and Data Acquisition Two multi-purpose detectors at

    collision points: 
 ATLAS, CMS. Every second, 20million collisions happen at each experiment. Every collision produces a detectable “event”. At ATLAS, 100million detector cells are read out and the 20million events are filtered in real-time down to ~400 events per second for offline storage. 28 ⇠ 1032 cm 2s 1, the average event size was ⇠1.3 MB. Fig. 2 Schematic of the ATLAS trigger system A schematic diagram of the ATLAS trigger system is shown in Fig. 2. Detector signals are stored in front-end Bibliography [1] F. Englert and R. Brout, Broken symmetry and the mass of gauge vector mesons, Phys. Rev. Lett. 13 (1964) 321. [2] P. W. Higgs, Broken symmetries, massless particles and gauge fields, Phys. Lett. 12 (1964) 132. [3] P. W. Higgs, Broken symmetries and the masses of gauge bosons, Phys. Rev. Lett. 13 (1964) 508. [4] G. S. Guralnik, C. R. Hagen, and T. W. B. Kibble, Global conservation laws and massless particles, Phys. Rev. Lett. 13 (1964) 585. [5] P. W. Higgs, Spontaneous symmetry breakdown without massless bosons, Phys. Rev. 145 (1966) 1156. [6] T. W. B. Kibble, Symmetry breaking in non-Abelian gauge theories, Phys. Rev. 155 (1967) 1554. [7] ATLAS Collaboration, Detector and Physics Performance Technical Design Report, CERN-LHCC/99-14/15 (1999) . [8] G. Aad, B. Abbott, J. Abdallah, A. A. Abdelalim, A. Abdesselam, O. Abdinov, B. Abi, M. Abolins, H. Abramowicz, H. Abreu, and et al., Readiness of the ATLAS liquid argon calorimeter for LHC collisions, European Physical Journal C 70 (Dec., 2010) 723–753, arXiv:0912.2642 [physics.ins-det] . [9] ATLAS Collaboration, Performance of the ATLAS Trigger System in 2010, Eur. Phys. J. C 72 (2012) 1849, arXiv:1110.1530 [hep-ex] . [10] K. Cranmer, G. Lewis, L. Moneta, A. Shibata, and W. Verkerke, HistFactory: A tool for creating statistical models for use with RooFit and RooStats, Tech. Rep.
  14. Sven Kreiss Sven Kreiss Model: Gaussian example 29 G x

    mu sigma mean width Top node: output value Nodes below: input variables C++ and Python API and XML interface to build models. // Declare variables x,mean,sigma with associated name, title, initial value and allowed range RooRealVar x("x","x",-10,10) ; RooRealVar mean("mean","mean of gaussian",1,-10,10) ; RooRealVar sigma("sigma","width of gaussian",1,0.1,10) ; // Build gaussian p.d.f in terms of x,mean and sigma RooGaussian gauss("gauss","gaussian PDF",x,mean,sigma) ;
  15. Sven Kreiss Combining the Statistical Models of the Analysis Groups

    • teams of 20-200 scientists address each of the production & decay modes • they use theory and a detailed detector simulation to model the data • modeling approaches range from parametric to non-parametric techniques • systematic uncertainties of our complicated detectors must be modeled 30 Before After ents must s, the cs.! al unity. ! ned p)
  16. Sven Kreiss Sven Kreiss Model: Higgs Combination Our models now

    contain about 800 parameters, where ~500 are associated to statistical fluctuations in the Monte Carlo templates. They contain about 20,000 nodes. 33
  17. Sven Kreiss Sven Kreiss Statistics 34 95% CL -1 10

    1 Bkg. Expected Limits s CL (a) 0 Local p -10 10 -9 10 -8 10 -7 10 -6 10 -5 10 -4 10 -3 10 -2 10 -1 10 1 Sig. Expected Observed (b) σ 2 σ 3 σ 4 σ 5 σ 6 [GeV] H m 200 300 400 500 ) µ Signal strength ( -1 -0.5 0 0.5 1 1.5 2 Observed )<1 µ ( λ -2 ln (c) 110 150 p0 to test background hypothesis μ̂ to estimate signal strength µ = SM B BSM qµ = 2 ln L(µ, ˆ ˆ ✓) L(ˆ µ, ˆ ✓)
  18. Sven Kreiss Higgs Physics after Discovery: 
 Coupling Measurements Measure

    properties of the Higgs Boson. How strong does it interact with other particles. Is that consistent with the predictions? 
 
 
 We found evidence for VBF production at the 4.1σ level. 35 τ τ ,ZZ*,WW*, γ γ ggF+ttH µ -2 -1 0 1 2 3 4 5 6 τ τ ,ZZ*,WW*, γ γ VBF+VH µ -2 0 2 4 6 8 10 Standard Model Best fit 68% CL 95% CL γ γ → H 4l → ZZ* → H ν l ν l → WW* → H τ τ → H Preliminary ATLAS -1 Ldt = 4.6-4.8 fb ∫ = 7 TeV s -1 Ldt = 20.3 fb ∫ = 8 TeV s = 125.5 GeV H m Figure 5.1: Likelihood contours for H! , H! ZZ⇤! 4`, H! W and H! ⌧⌧ in the production times branching ratio planes (µggF+ttH µVBF+VH ⇥ B/BSM ). of signal strength measurements. Likelihood contours for the four dec H! , H! ZZ⇤! 4`, H! WW⇤! `⌫`⌫ and H! ⌧⌧ are shown in fi The detector can only measure event counts which are a product of ggF+ttH µ / VBF µ -0.5 0 0.5 1 1.5 2 2.5 3 3.5 Λ -2 ln 0 2 4 6 8 10 12 14 16 18 20 22 24 combined SM expected Preliminary ATLAS -1 Ldt = 4.6-4.8 fb ∫ = 7 TeV s -1 Ldt = 20.3 fb ∫ = 8 TeV s = 125.5 GeV H m Figure 5.3: The ratio of the signal strength for the VBF process over the signal VBF
  19. Thank You CERN website: www.cern.ch ATLAS website: www.atlas.ch ROOT analysis

    tool: root.cern.ch RooStats, statistics tool part of ROOT: 
 https://twiki.cern.ch/twiki/bin/view/RooStats/WebHome My thesis: http://www.svenkreiss.com/blog/phd-thesis/ Follow me on Twitter: @svenkreiss 
 My website: www.svenkreiss.com