Upgrade to Pro — share decks privately, control downloads, hide ads and more …

Databench

 Databench

Sven Kreiss

June 09, 2014
Tweet

More Decks by Sven Kreiss

Other Decks in Technology

Transcript

  1. @svenkreiss Visualizations are important to me. 
 Matplotlib is okay,

    but not great. 
 Animations in matplotlib ?!*&$. 
 Interactions are basically impossible. 3
  2. @svenkreiss A Databench Analysis Optional: add readme, license and requirements.txt

    files, a tests directory and a .travis.yml file and make it a git repository.
 Checkout: https://github.com/svenkreiss/databench_examples 5
  3. @svenkreiss Where next? include visual primitives for d3.js: a bar

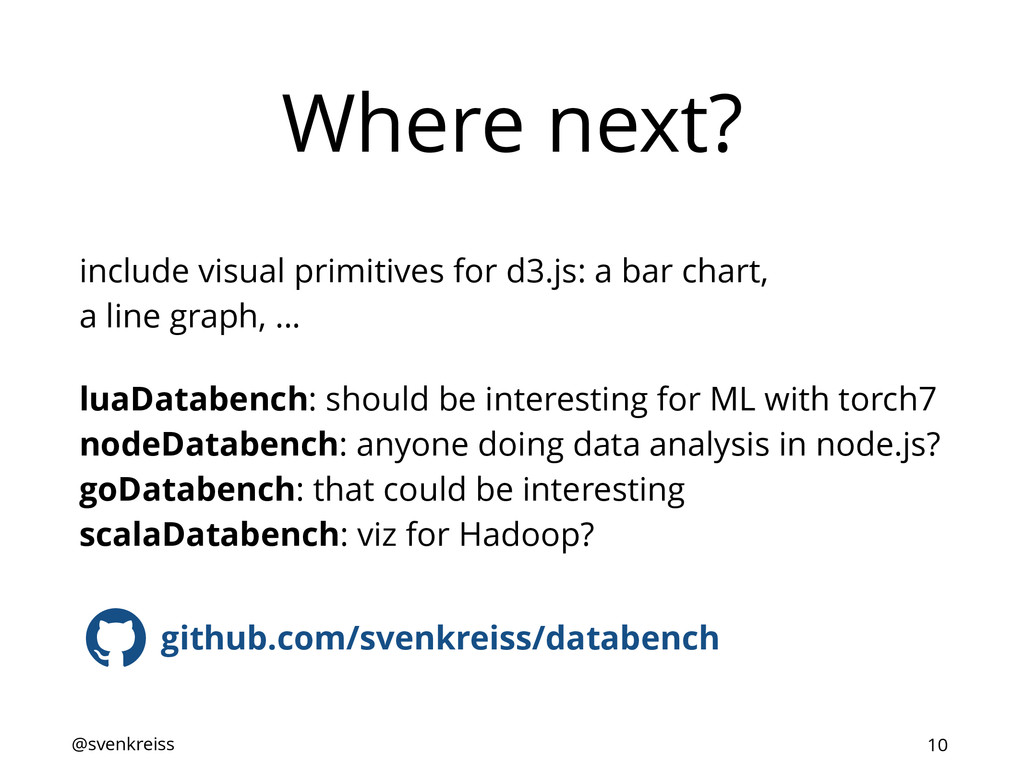
    chart, 
 a line graph, … luaDatabench: should be interesting for ML with torch7
 nodeDatabench: anyone doing data analysis in node.js?
 goDatabench: that could be interesting
 scalaDatabench: viz for Hadoop?
 github.com/svenkreiss/databench 10 #
  4. @svenkreiss Feature: Markdown {% filter markdown %}
 # mpld3Drag
 Testing

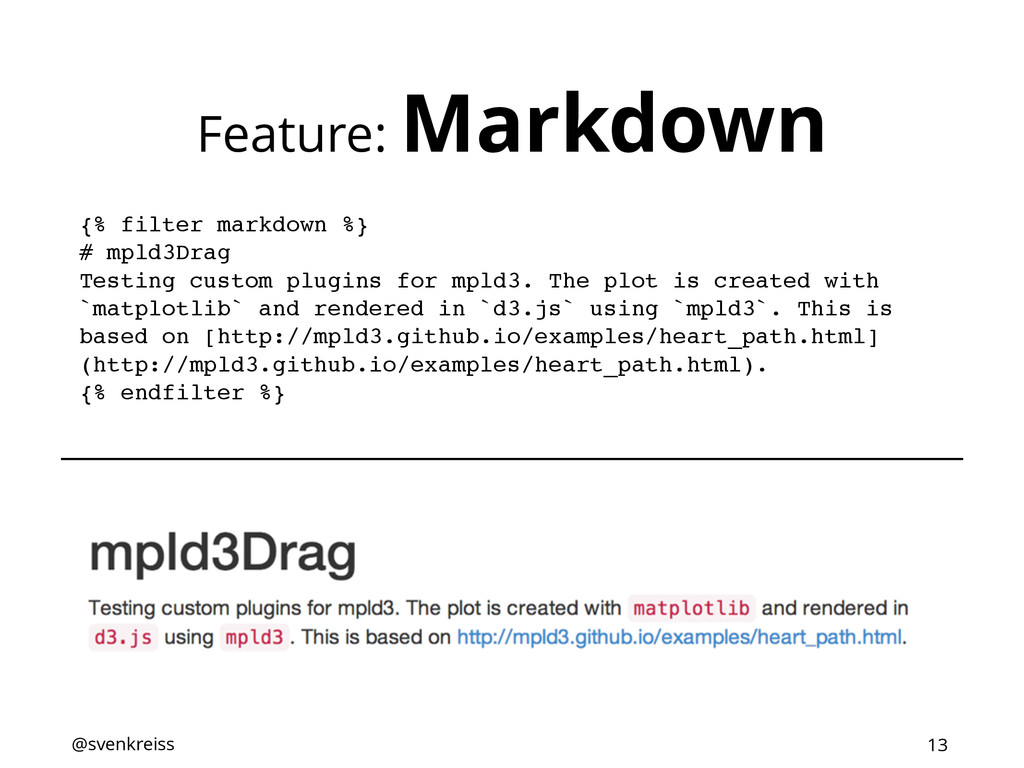
    custom plugins for mpld3. The plot is created with `matplotlib` and rendered in `d3.js` using `mpld3`. This is based on [http://mpld3.github.io/examples/heart_path.html] (http://mpld3.github.io/examples/heart_path.html).
 {% endfilter %} 13
  5. @svenkreiss Feature: mpld3 fig = matplotlib.pyplot.figure(figsize=(8,4)) 
 // create figure

    here
 mpld3pi.signals.emit(‘mpld3canvas', mpld3.fig_to_dict(fig))
 
 <div id="mpld3canvas"></div>
 databench.genericElements.mpld3canvas($("#mpld3canvas")); 14