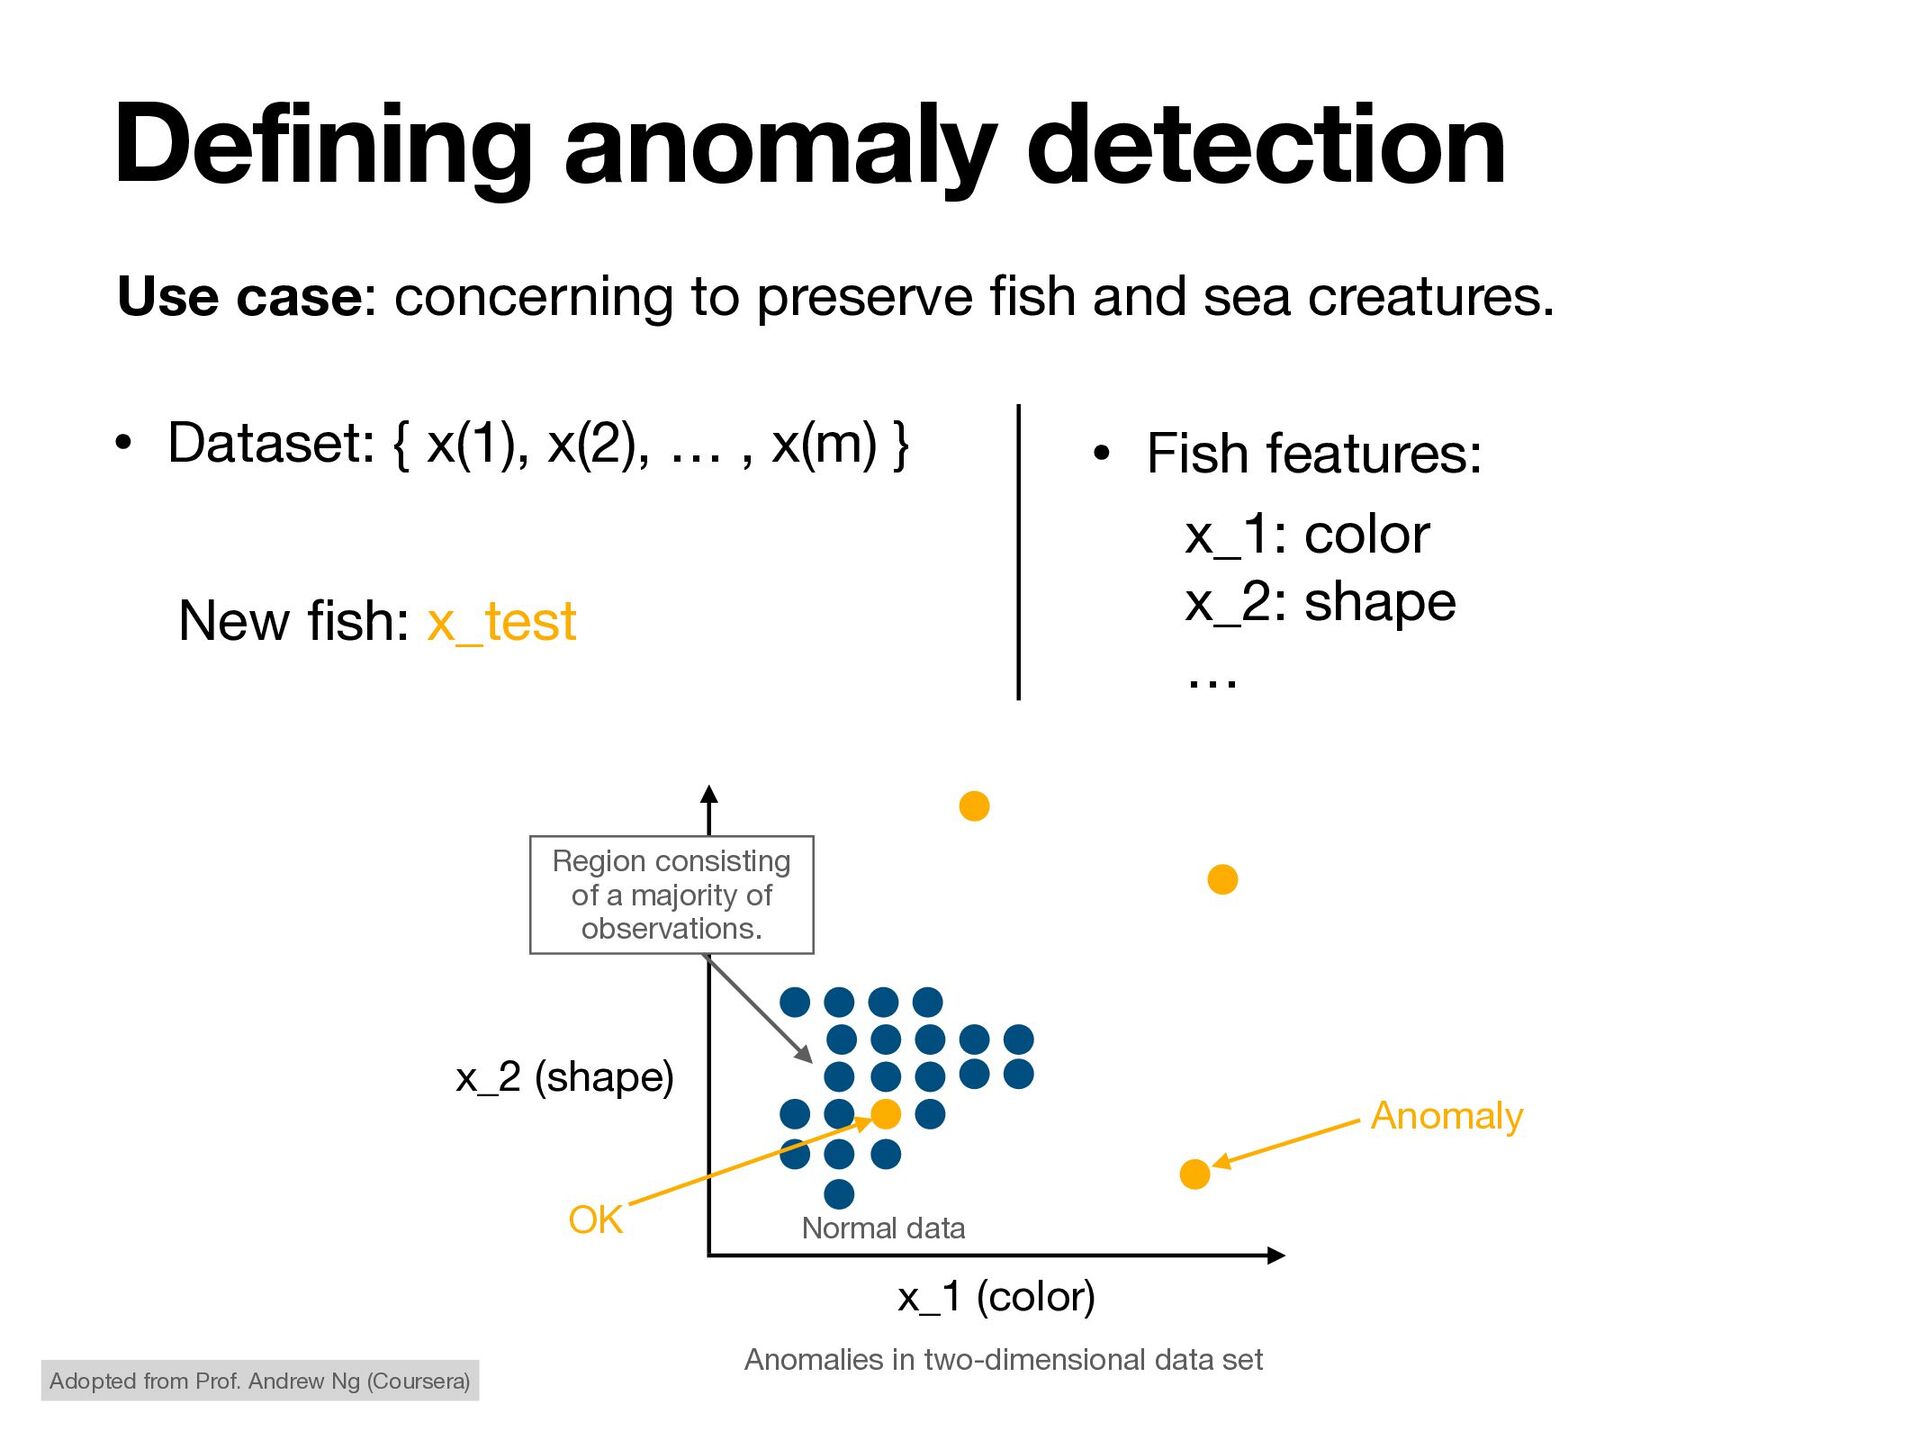
anomaly detection x_2 (shape) x_1 (color) Anomalies in two-dimensional data set Region consisting of a majority of observations. Normal data • Fish features: x_1: color x_2: shape … New fi sh: x_test OK Anomaly Use case: concerning to preserve fi sh and sea creatures. Adopted from Prof. Andrew Ng (Coursera)
• Similar to classi fi cation with high class imbalance. • Semi-supervised • Training using only “normal” data, and test data contaminated with “anomaly” points. • Unsupervised • No label assumption. • Based on assumption that anomalies are very rare compared to normal data. Detection approaches Goldstein, Markus, and Seiichi Uchida. "A comparative evaluation of unsupervised anomaly detection algorithms for multivariate data." PloS one 11.4 (2016): e0152173.
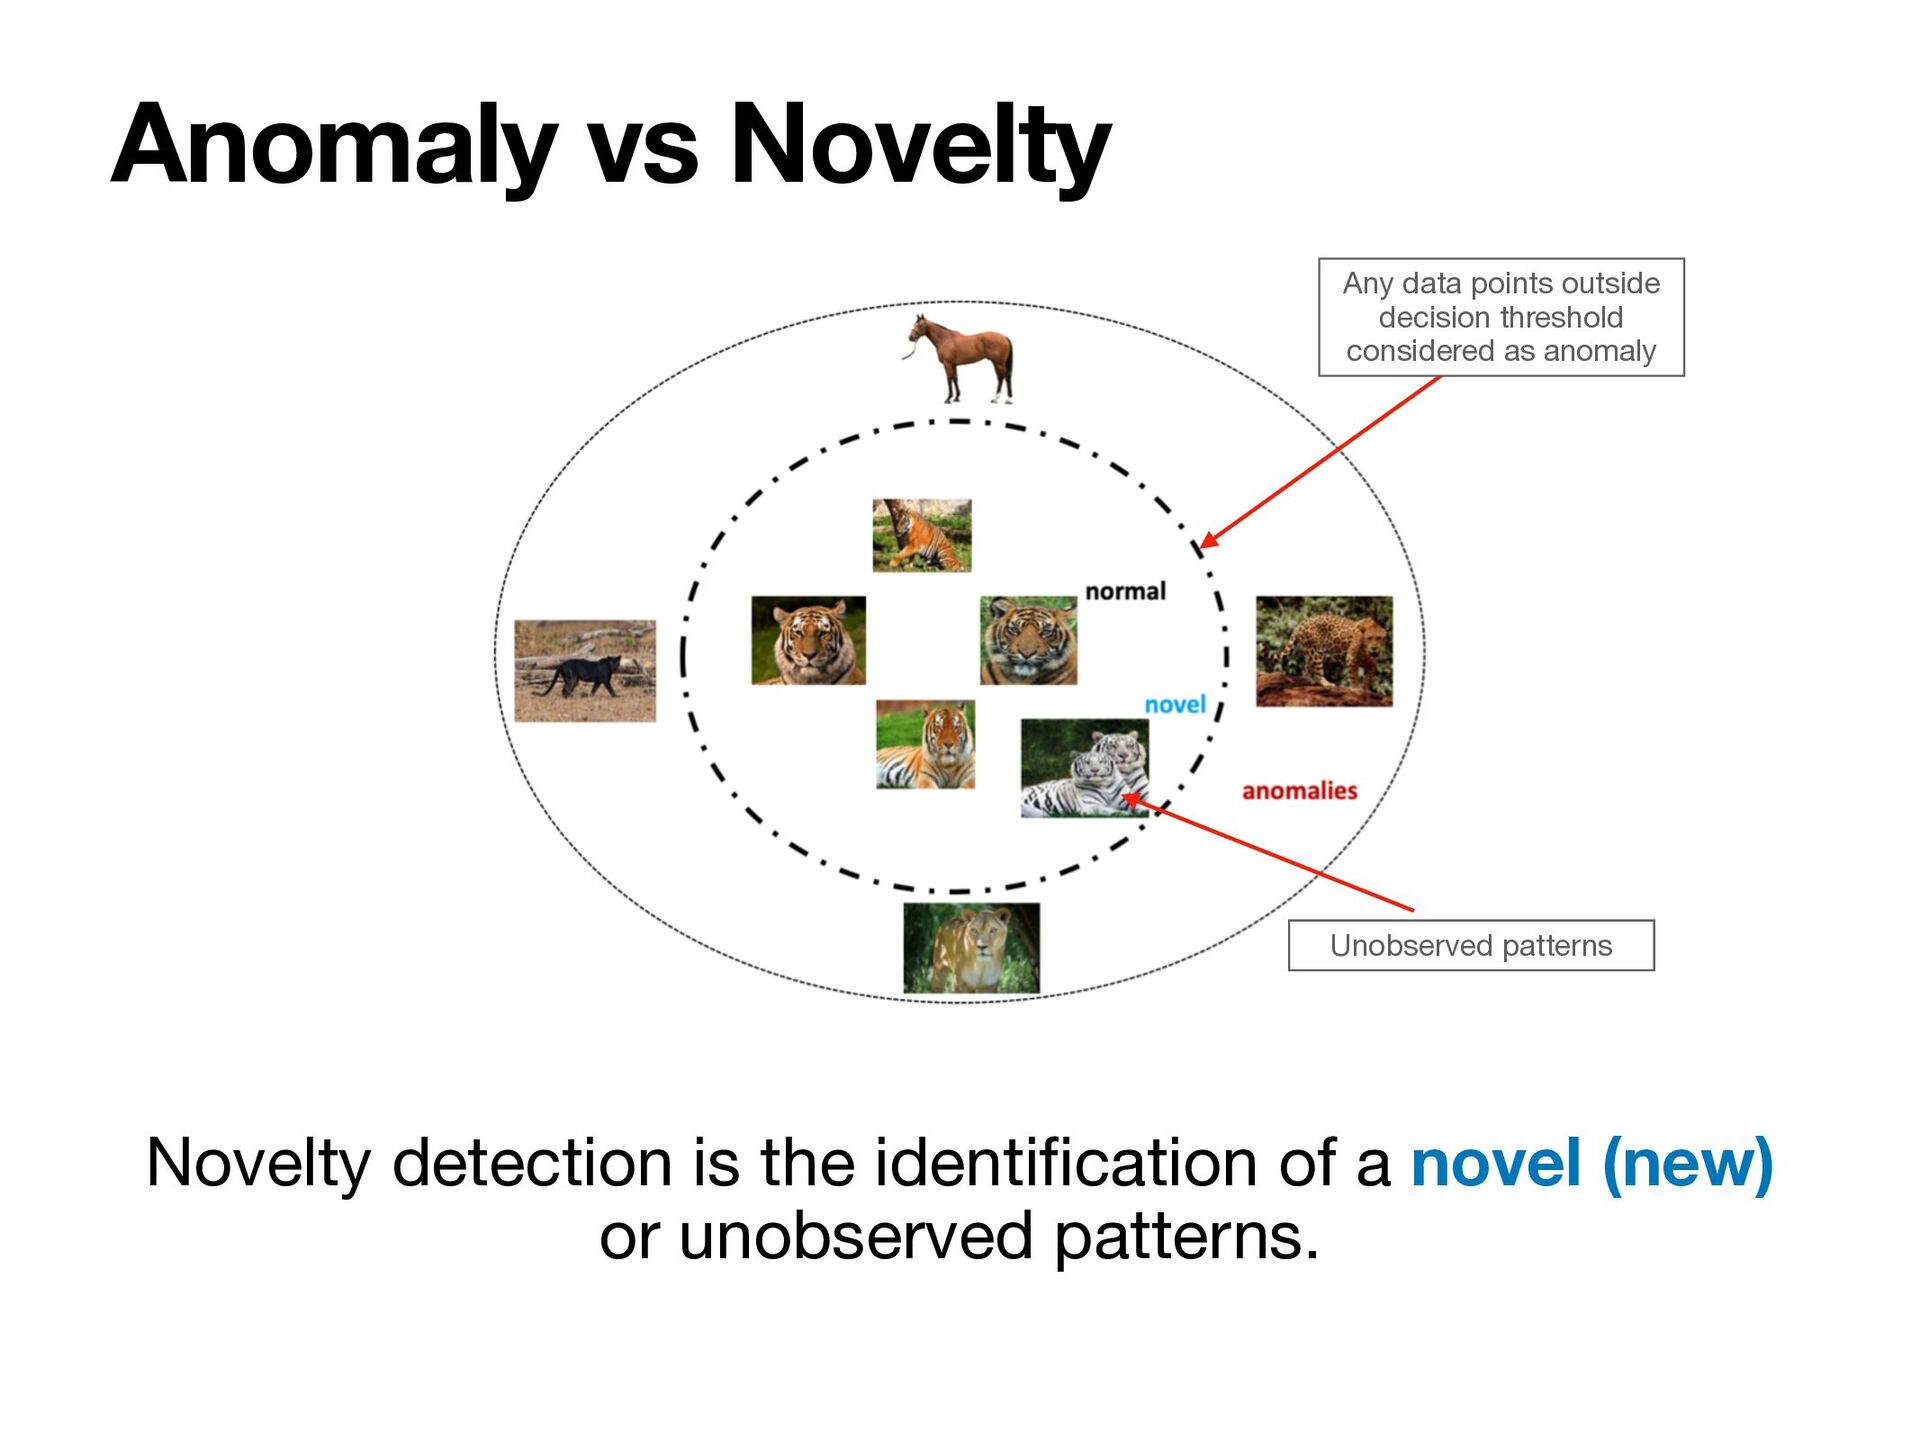
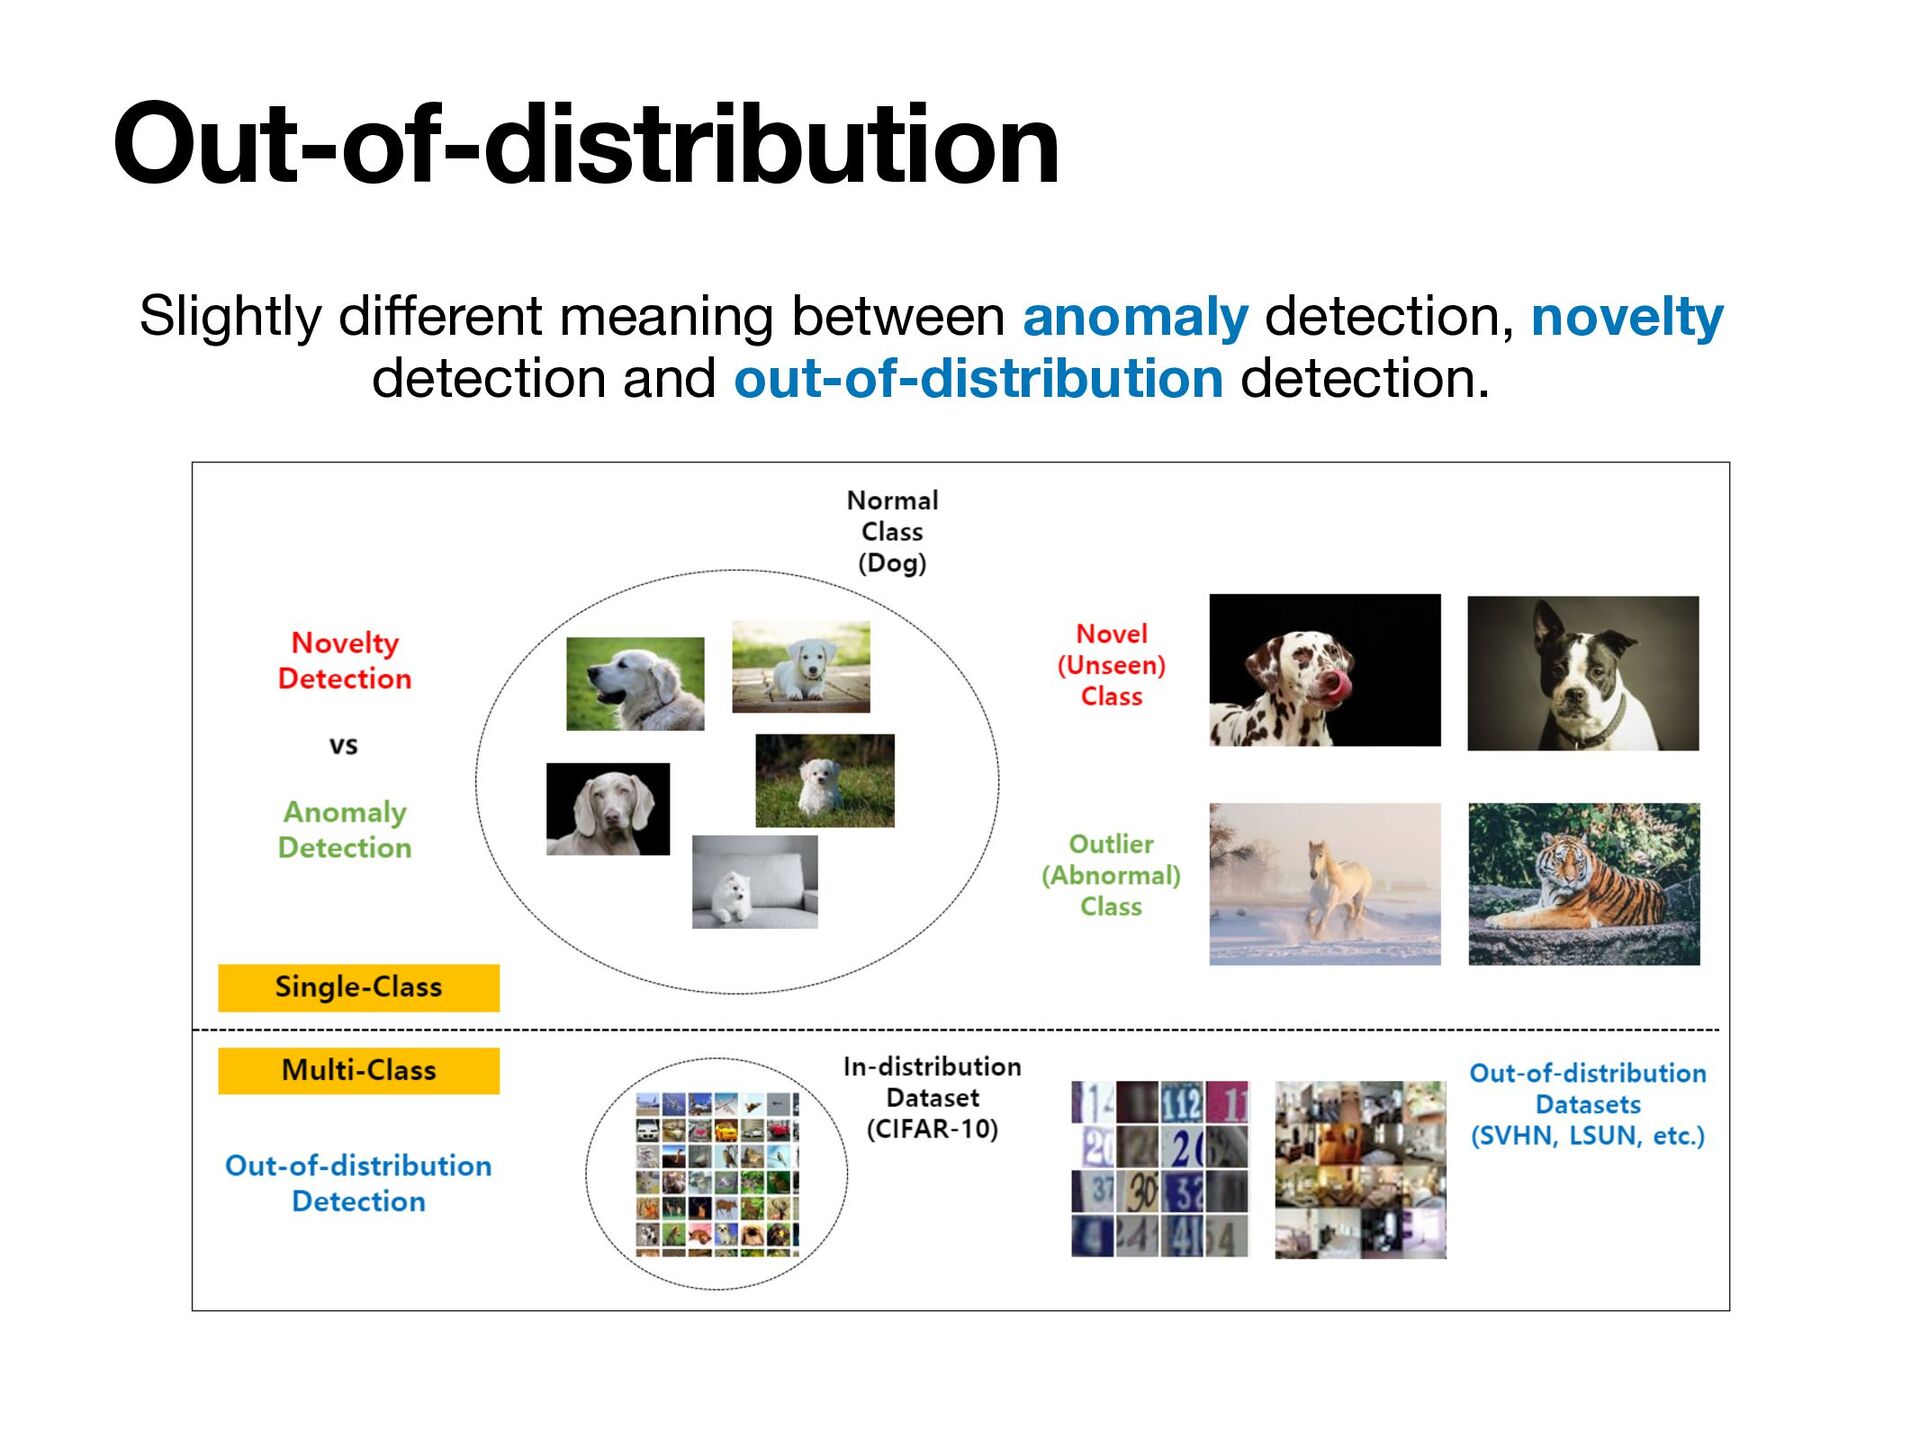
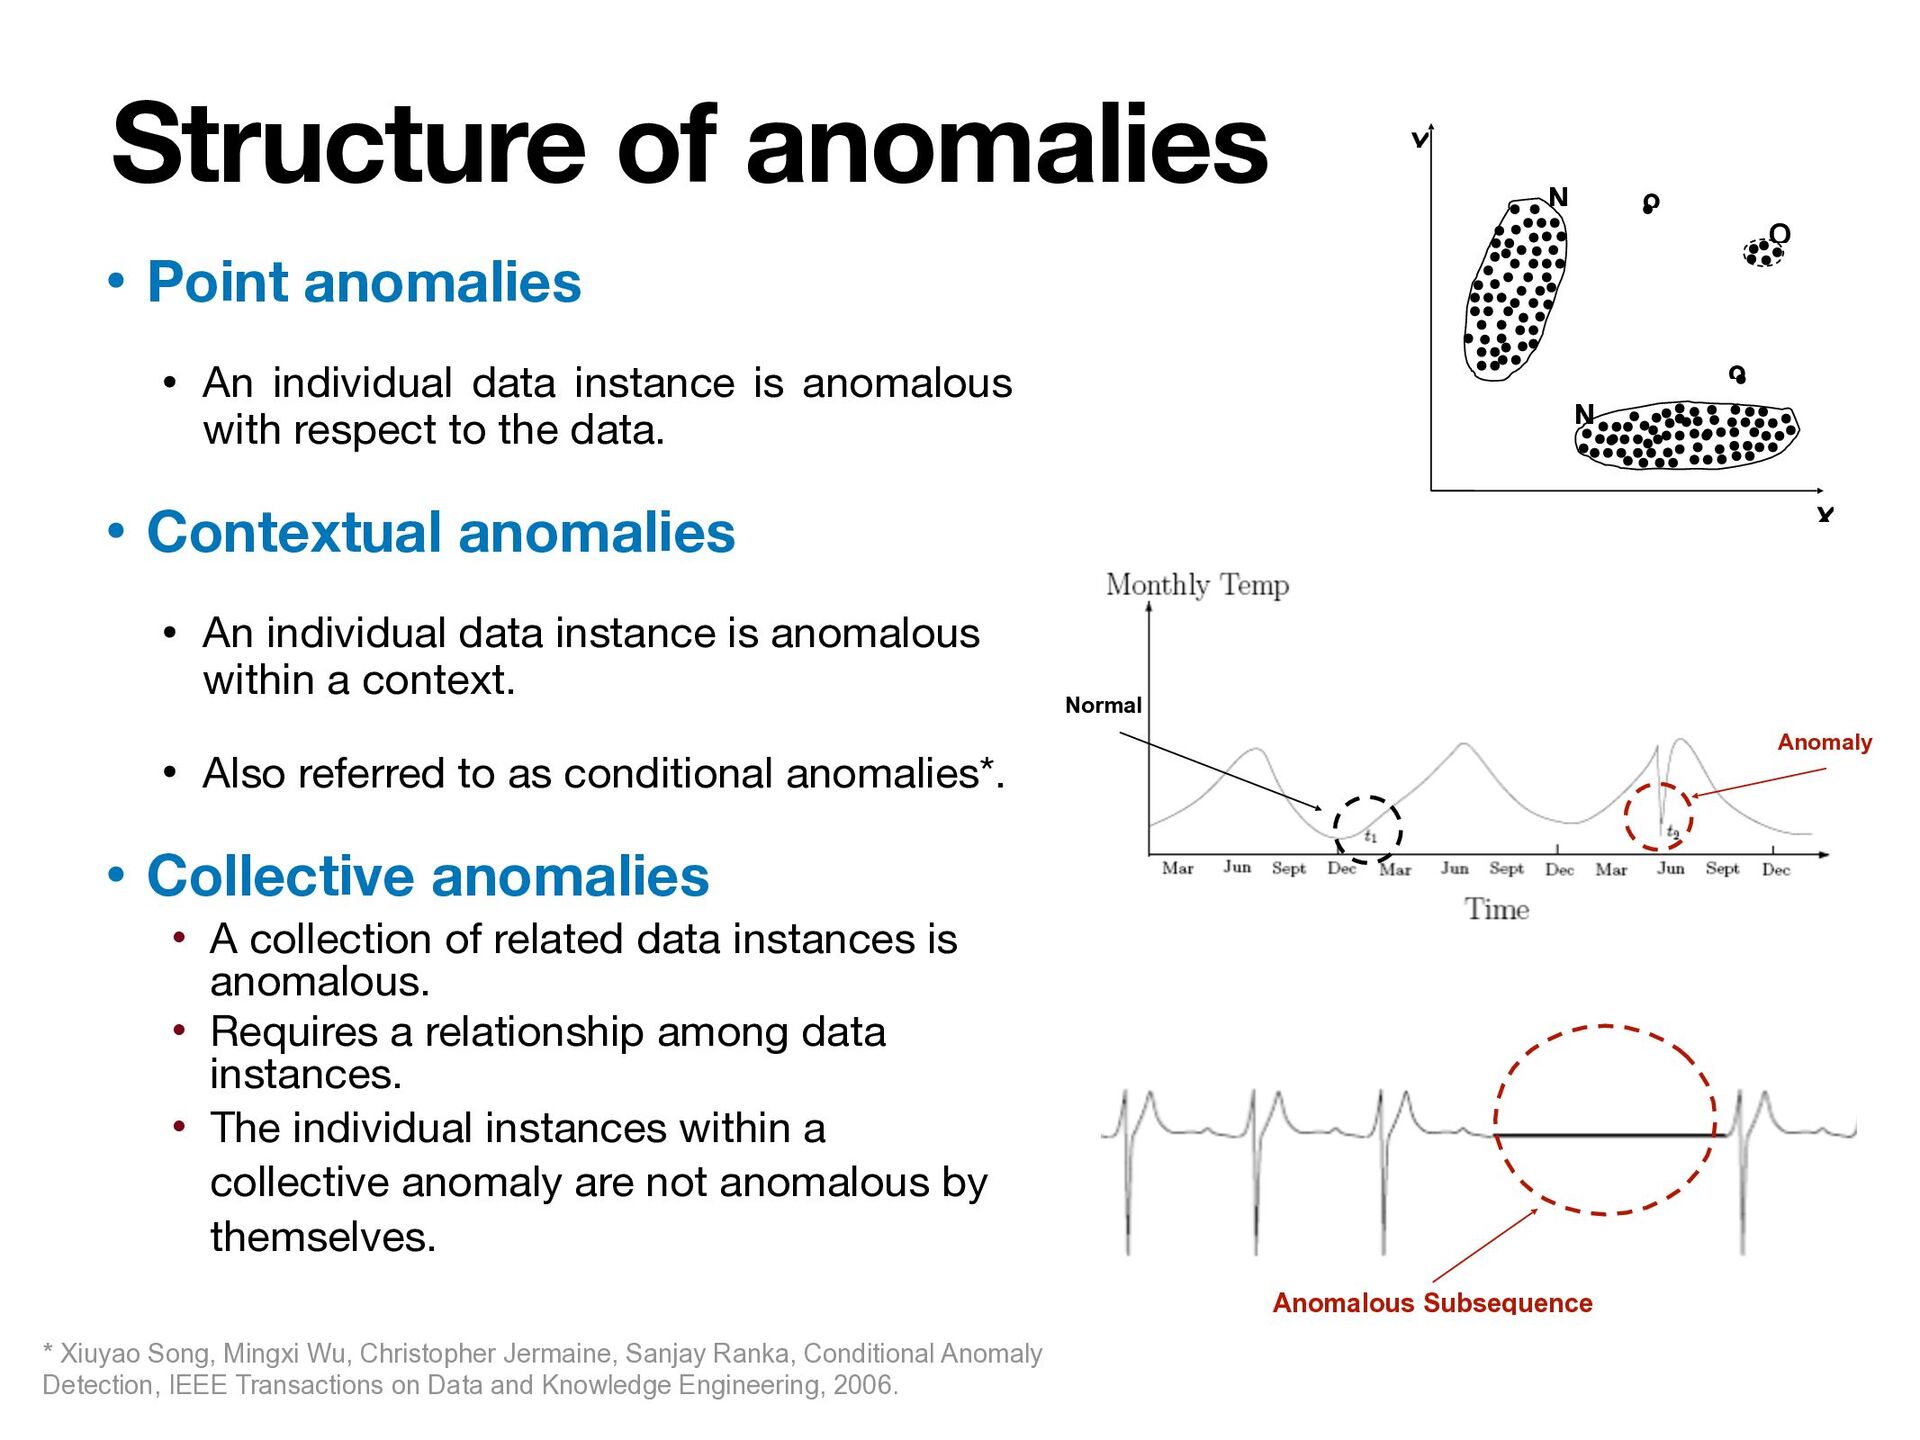
with respect to the data. • Contextual anomalies • An individual data instance is anomalous within a context. • Also referred to as conditional anomalies*. • Collective anomalies • A collection of related data instances is anomalous. • Requires a relationship among data instances. • The individual instances within a collective anomaly are not anomalous by themselves. Structure of anomalies X Y N N o o O Normal Anomaly * Xiuyao Song, Mingxi Wu, Christopher Jermaine, Sanjay Ranka, Conditional Anomaly Detection, IEEE Transactions on Data and Knowledge Engineering, 2006. Anomalous Subsequence
or anomaly label – This is especially true of classification-based approaches • Score – Each test instance is assigned an anomaly score • Allows the output to be ranked • Requires an additional threshold parameter Output of anomaly
points x E D with anomaly scores greater than some threshold t. • Given a dataset D, fi nd all the data points x E D having the top-n largest anomaly scores. Variants of anomaly detection problem
• Trivial classi fi er that labels everything with the normal class can achieve 99.9% accuracy!! Evaluation of anomaly detection Confusion Matrix Anomaly Normal Normal Anomaly • Focus on both recall and precision – Recall (R) = TP/(TP + FN) – Precision (P) = TP/(TP + FP) • F – measure = 2*R*P/(R+P) Recall: Proportion of actual positives identi fi ed correctly. Precision: Proportion of positive identi fi cations actually correct.
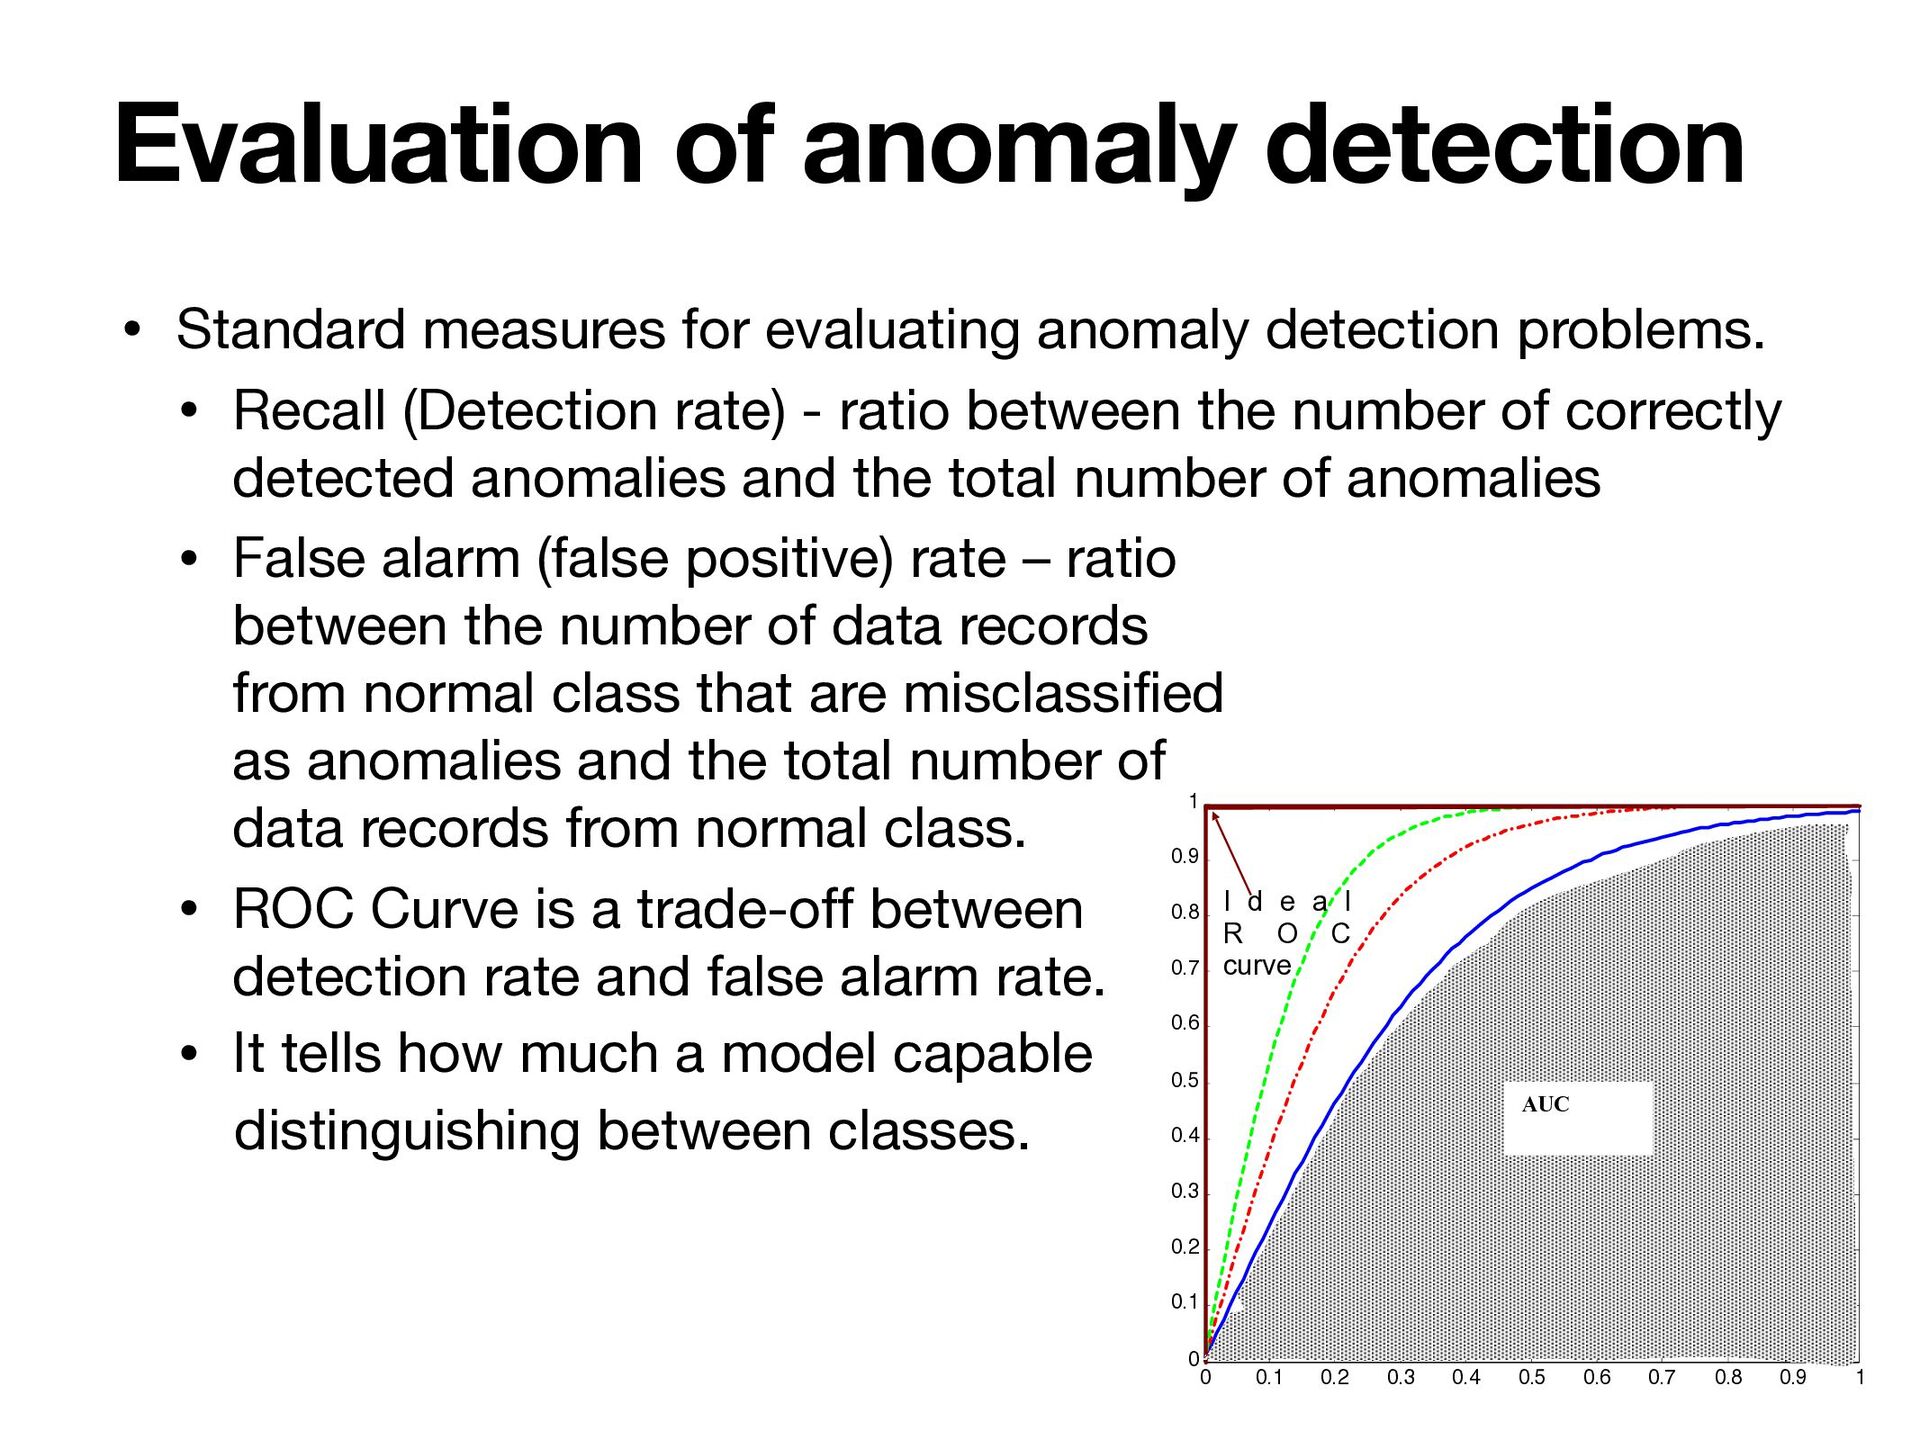
1 0 0.1 0.2 0.3 0.4 0.5 0.6 0.7 0.8 0.9 1 ROC curves for different outlier detection techniques False alarm rate Detection rate AUC Evaluation of anomaly detection • Standard measures for evaluating anomaly detection problems. • Recall (Detection rate) - ratio between the number of correctly detected anomalies and the total number of anomalies • False alarm (false positive) rate – ratio between the number of data records from normal class that are misclassified as anomalies and the total number of data records from normal class. • ROC Curve is a trade-off between detection rate and false alarm rate. • It tells how much a model capable distinguishing between classes. I d e a l R O C curve
a boundary that maximizes the margin between two classes. • In one-class problems the information regarding the anomaly class data is unavailable. • Tackles the absence of anomaly class data by maximizing the boundary with respect to the origin. Anomaly detection by a One-class SVM OCSVM Support Vector Machine
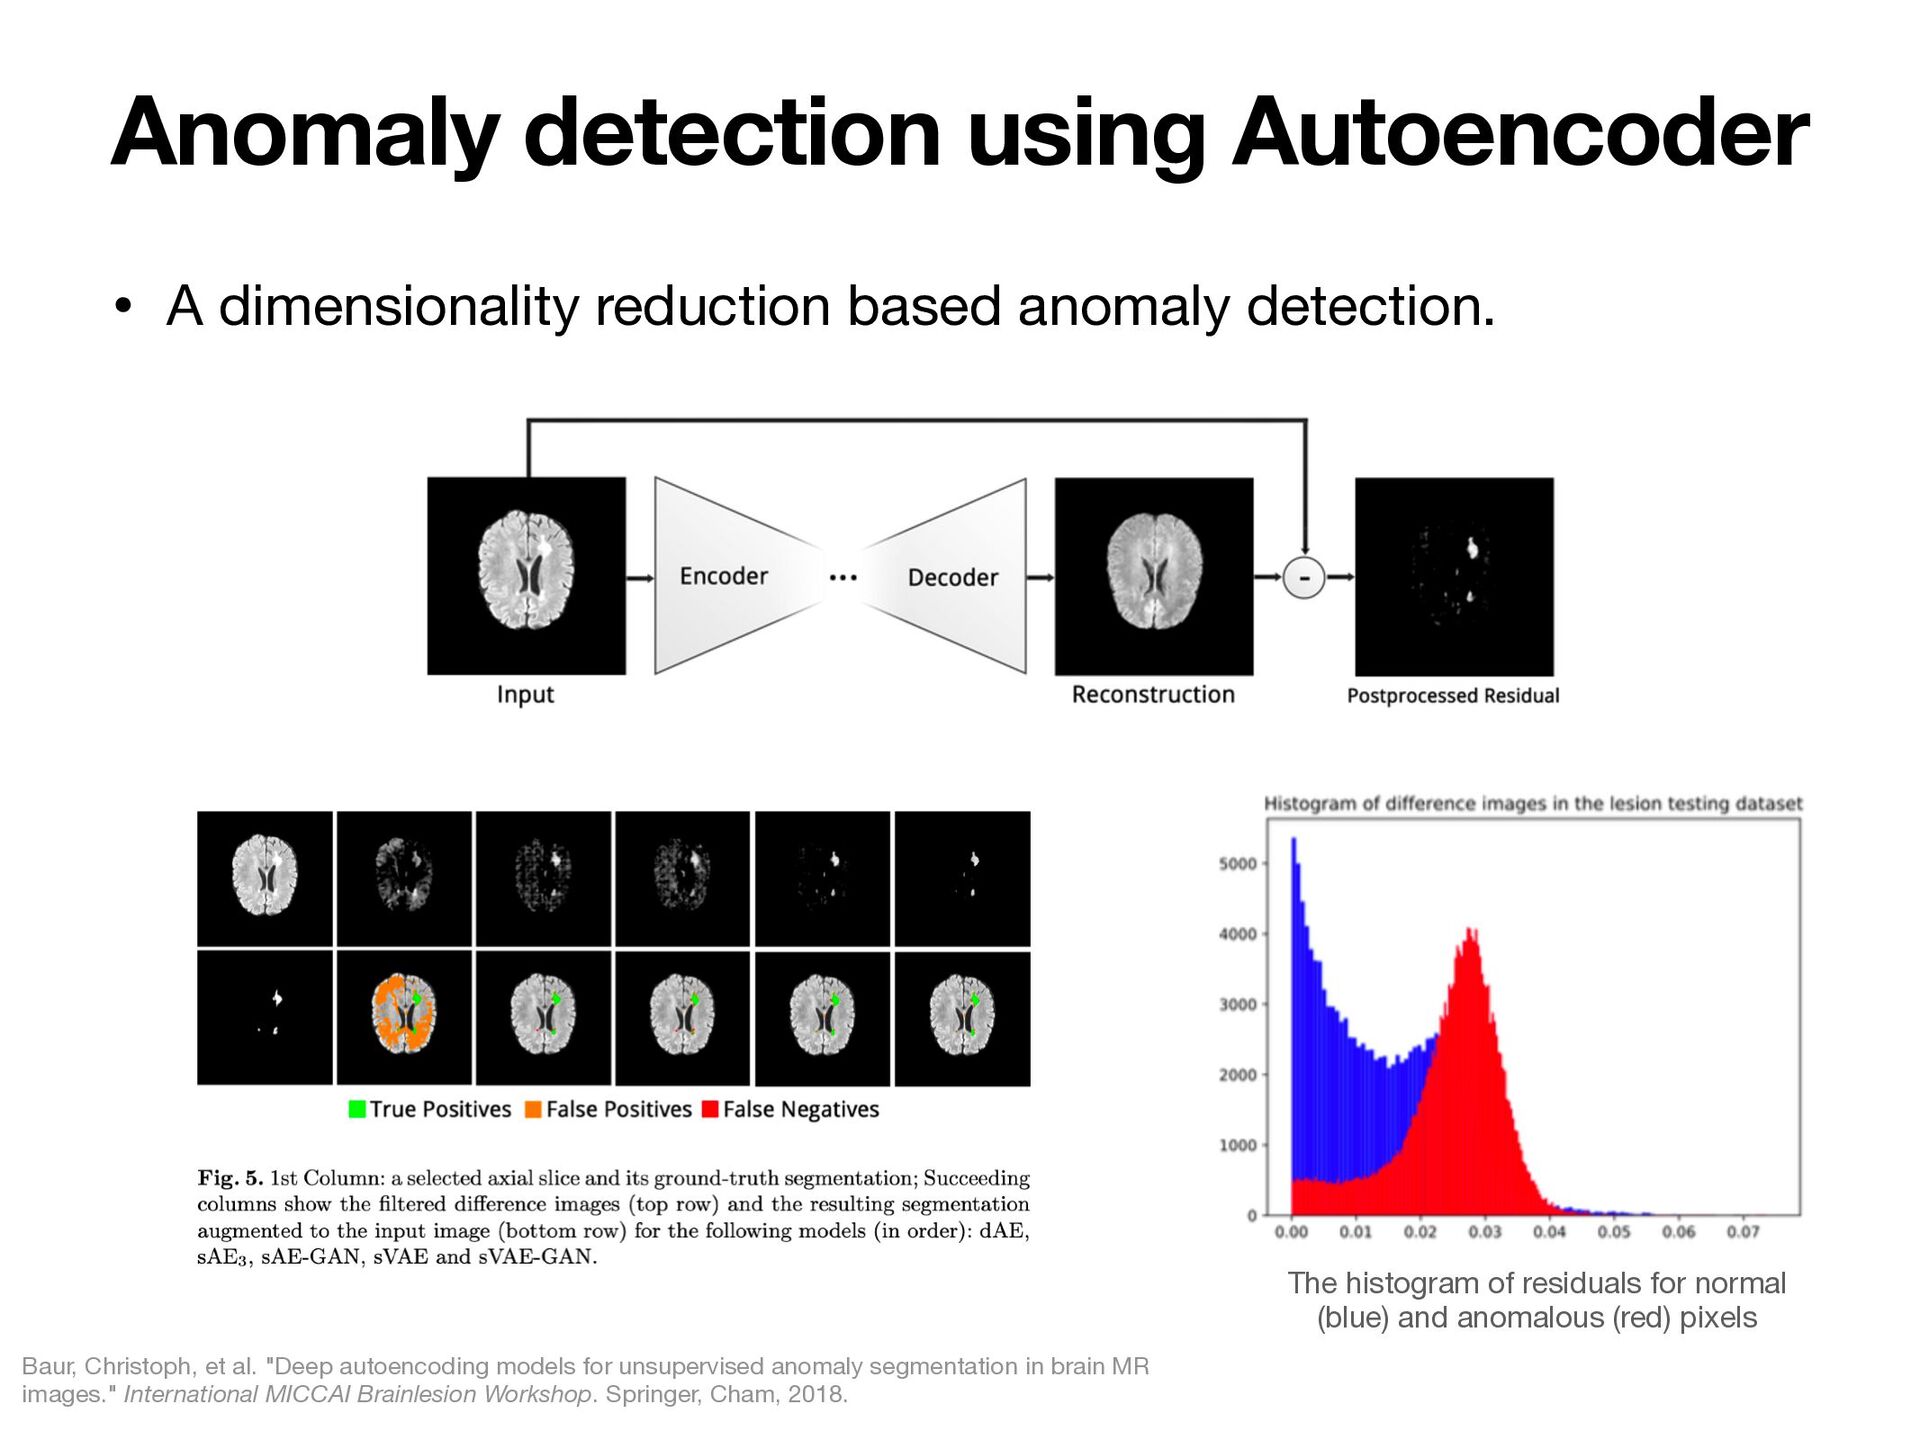
(blue) and anomalous (red) pixels • A dimensionality reduction based anomaly detection. Baur, Christoph, et al. "Deep autoencoding models for unsupervised anomaly segmentation in brain MR images." International MICCAI Brainlesion Workshop. Springer, Cham, 2018.
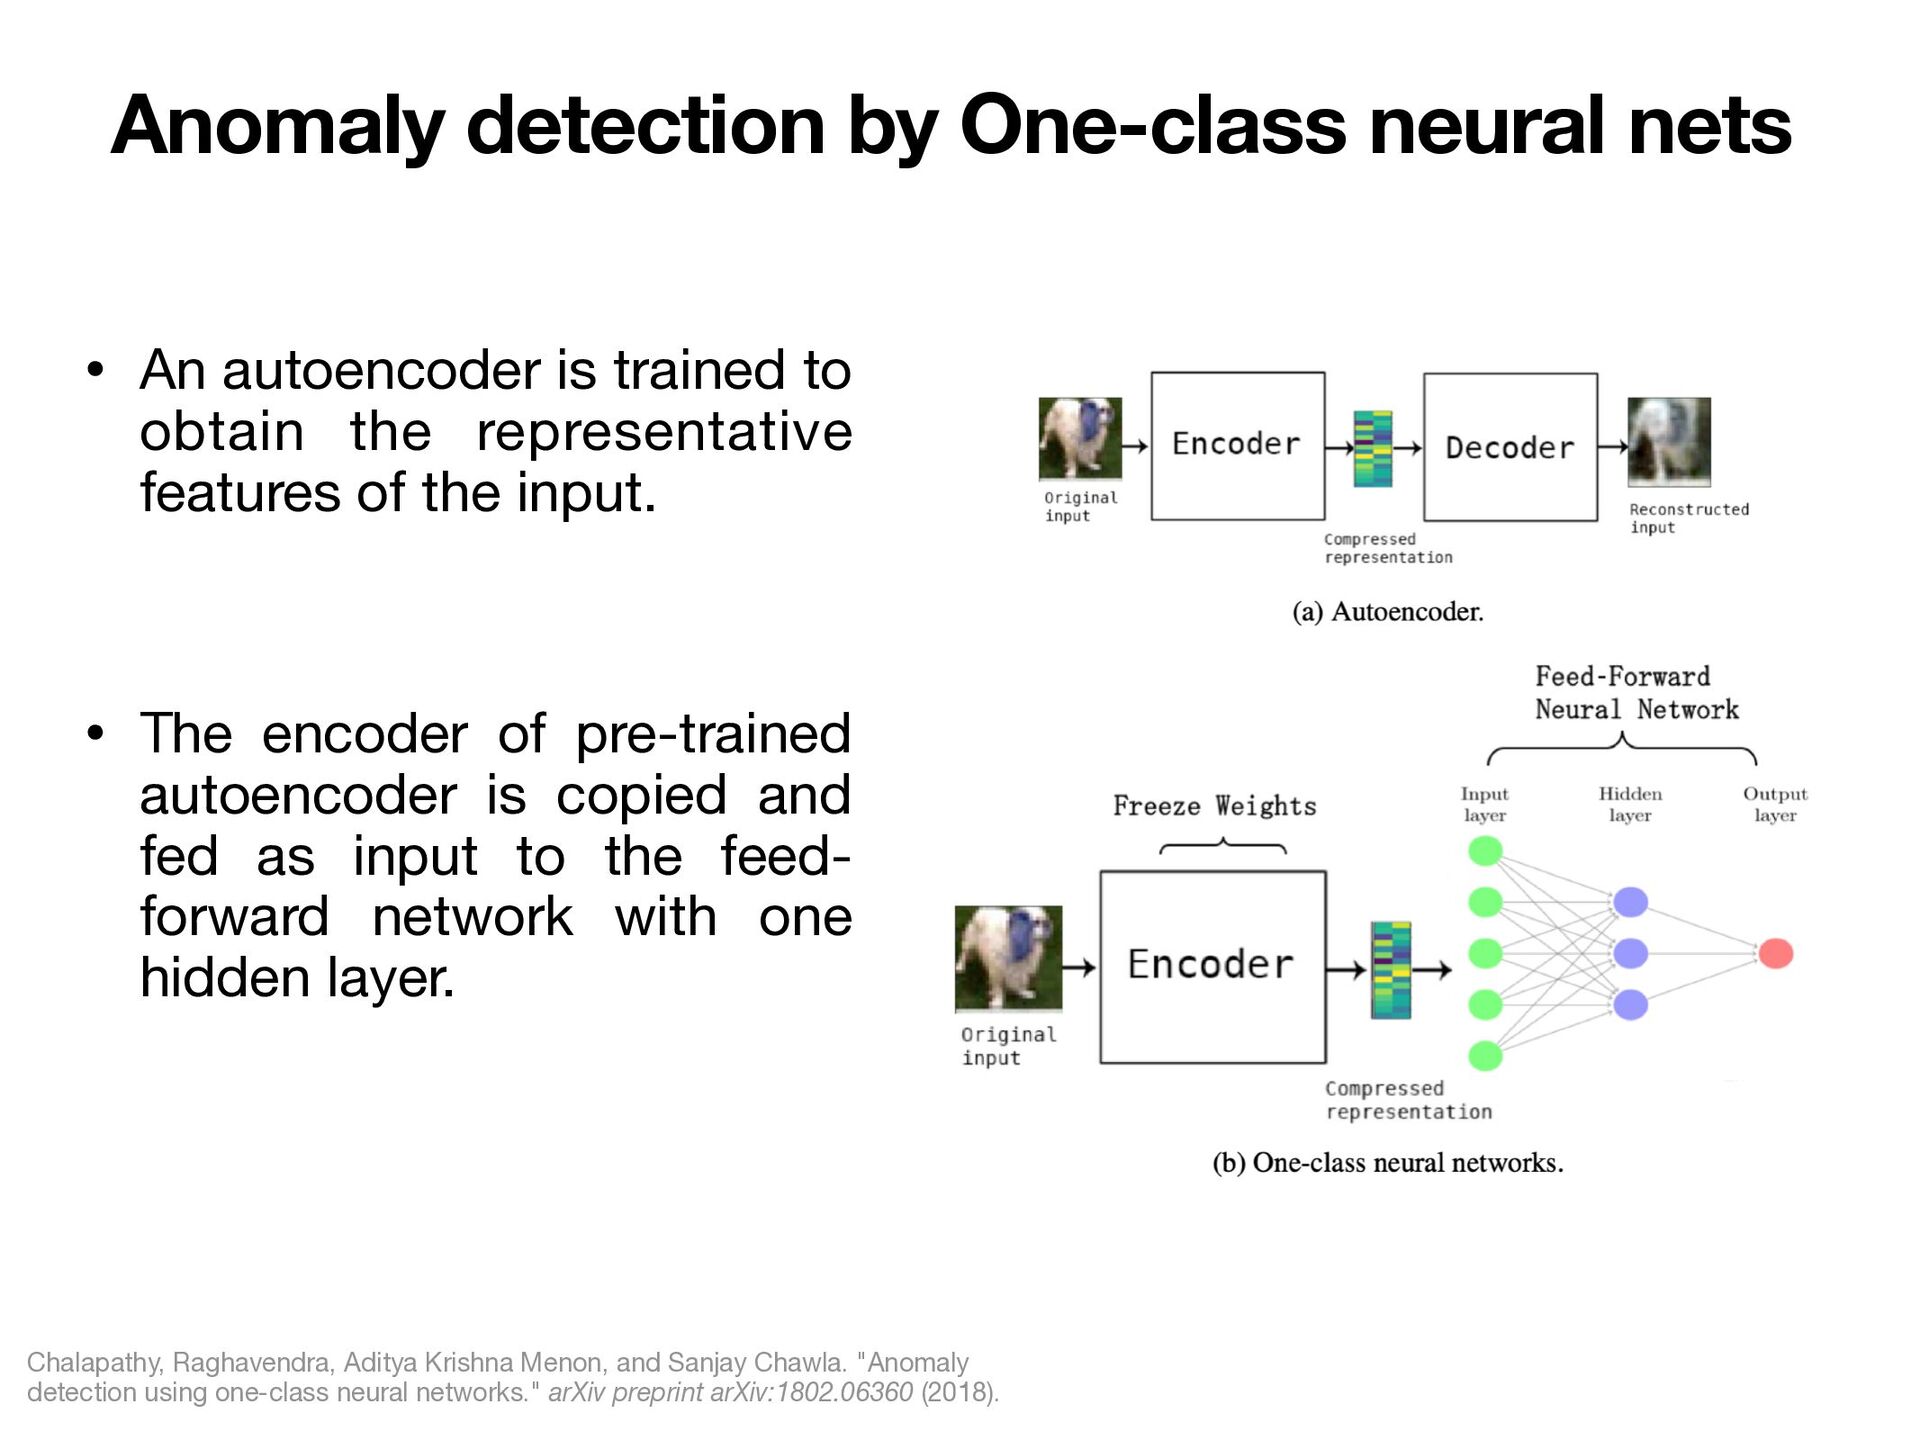
Menon, and Sanjay Chawla. "Anomaly detection using one-class neural networks." arXiv preprint arXiv:1802.06360 (2018). • An autoencoder is trained to obtain the representative features of the input. • The encoder of pre-trained autoencoder is copied and fed as input to the feed- forward network with one hidden layer.
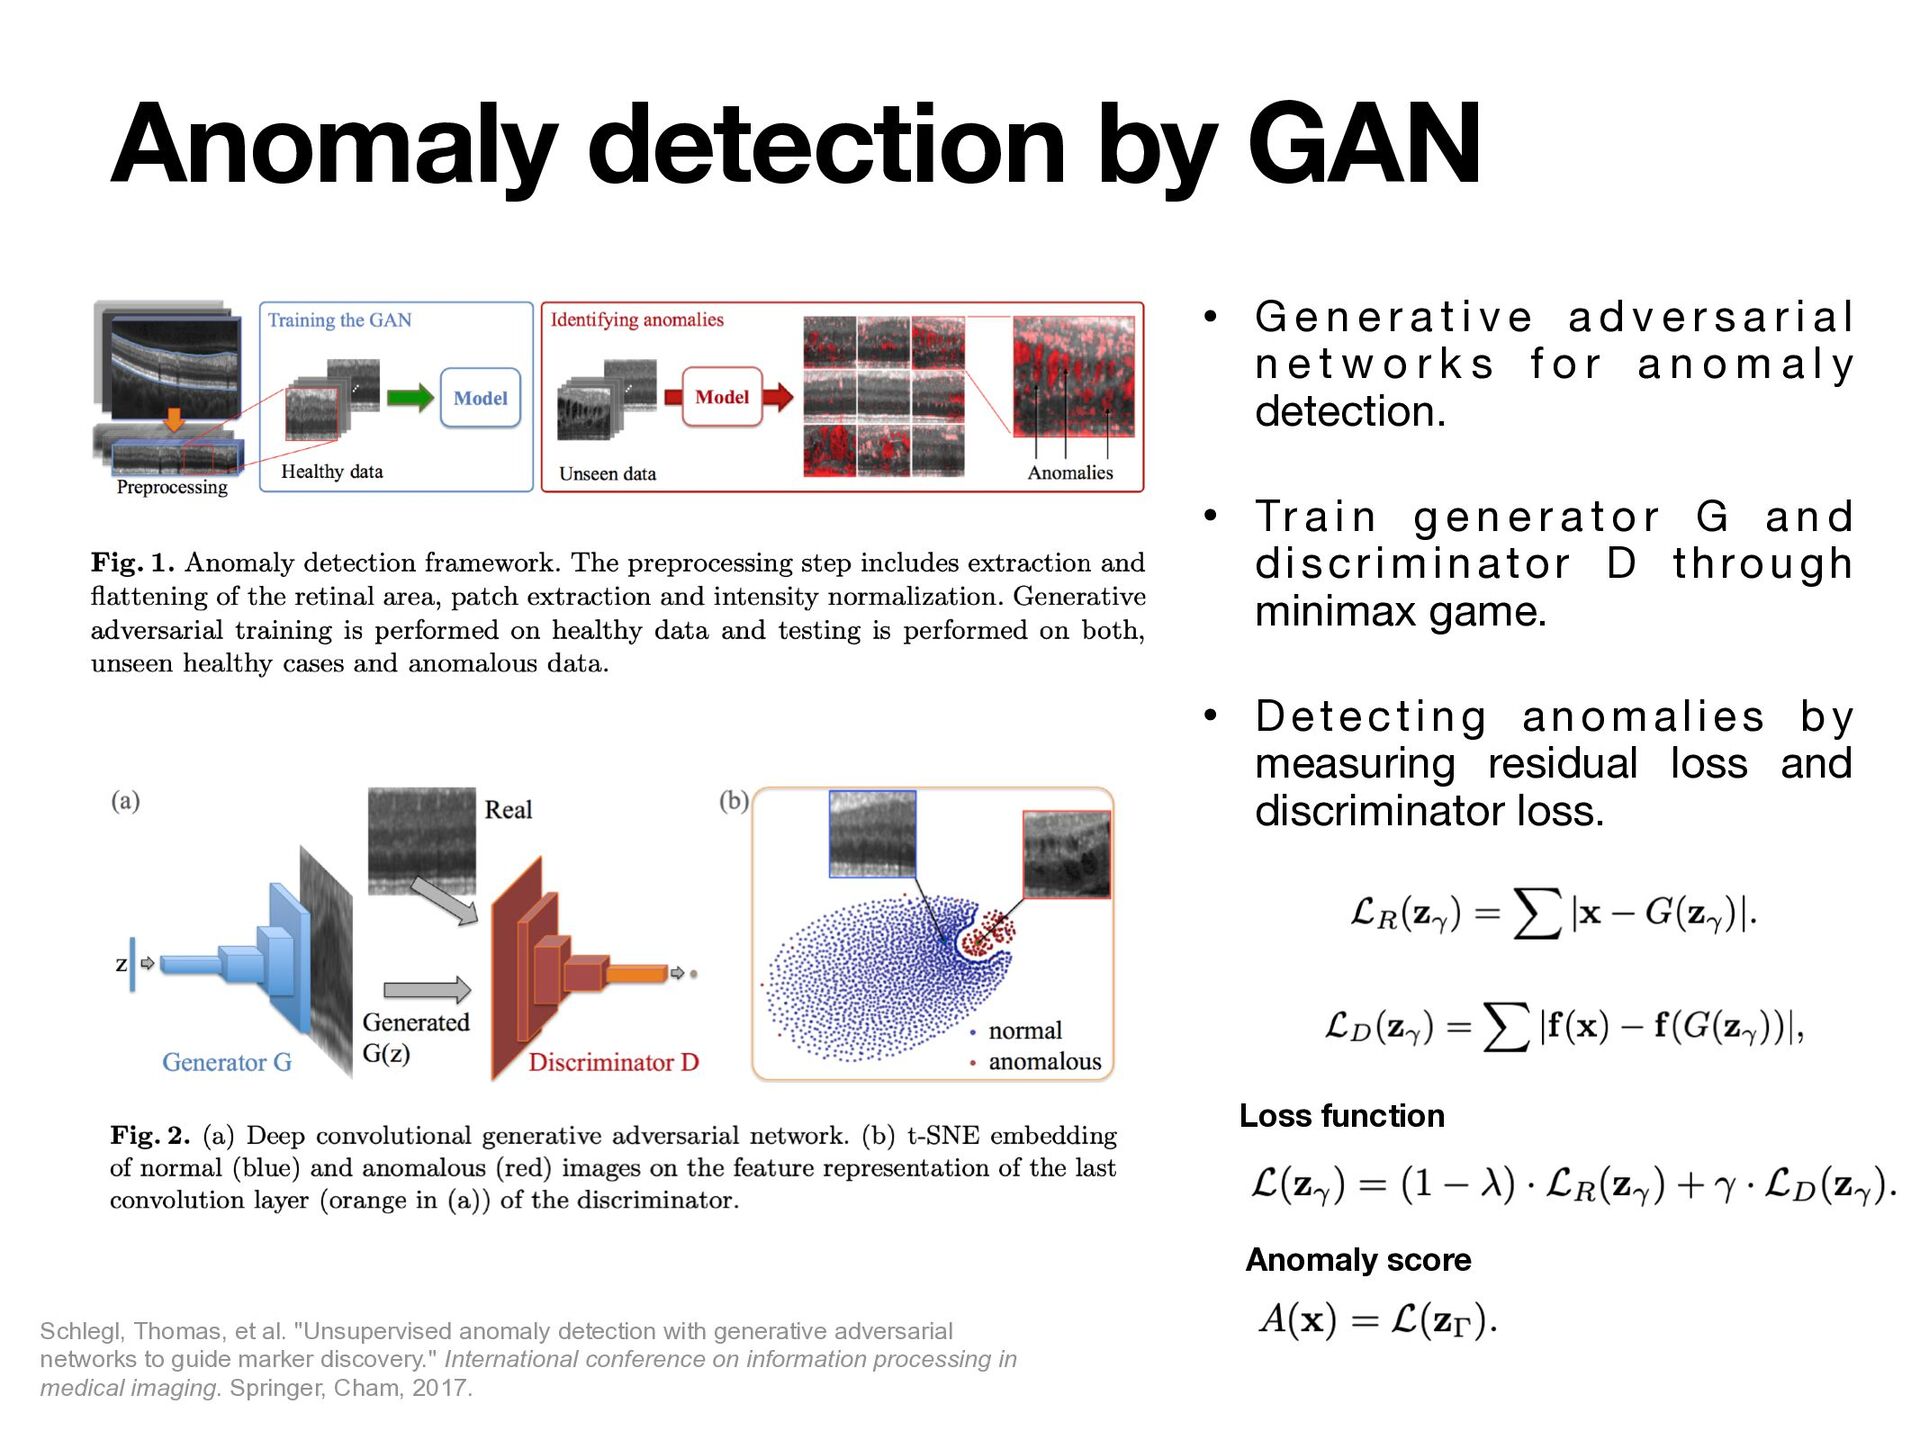
e a d v e r s a r i a l n e t w o r k s f o r a n o m a l y detection. • Tr a i n g e n e r a t o r G a n d discriminator D through minimax game. • Detecting anomalies by measuring residual loss and discriminator loss. Anomaly detection by GAN Schlegl, Thomas, et al. "Unsupervised anomaly detection with generative adversarial networks to guide marker discovery." International conference on information processing in medical imaging. Springer, Cham, 2017. Loss function Anomaly score
boundary between normal/abnormal behavior is often not precisely de fi ned. • Availability of training samples. • Imbalanced datasets. • Normal data behavior and library is also evolving. Challenges
in data. • Problem in anomaly detection is dependent on the application domains. • Require di ff erent approaches to solve di ff erent problems and data availability. • More advance methods proposed using deep learning techniques on complex and high- dimensional data. Conclusion