Upgrade to Pro — share decks privately, control downloads, hide ads and more …

Predict_the_Oscars.pdf

 Predict_the_Oscars.pdf

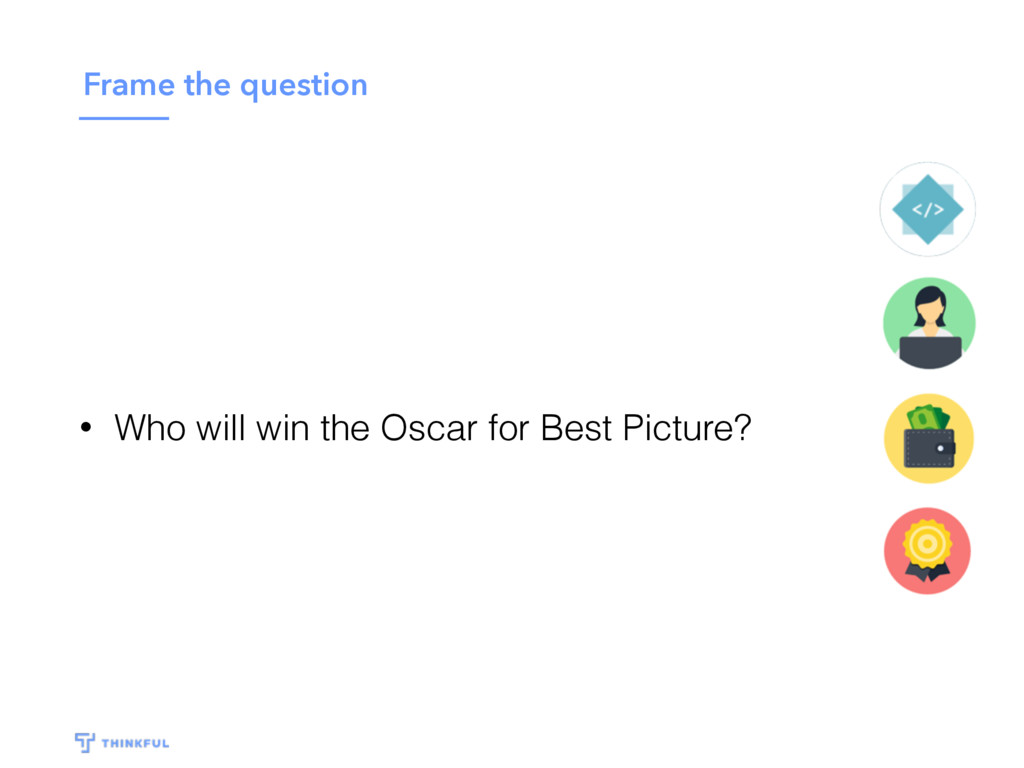
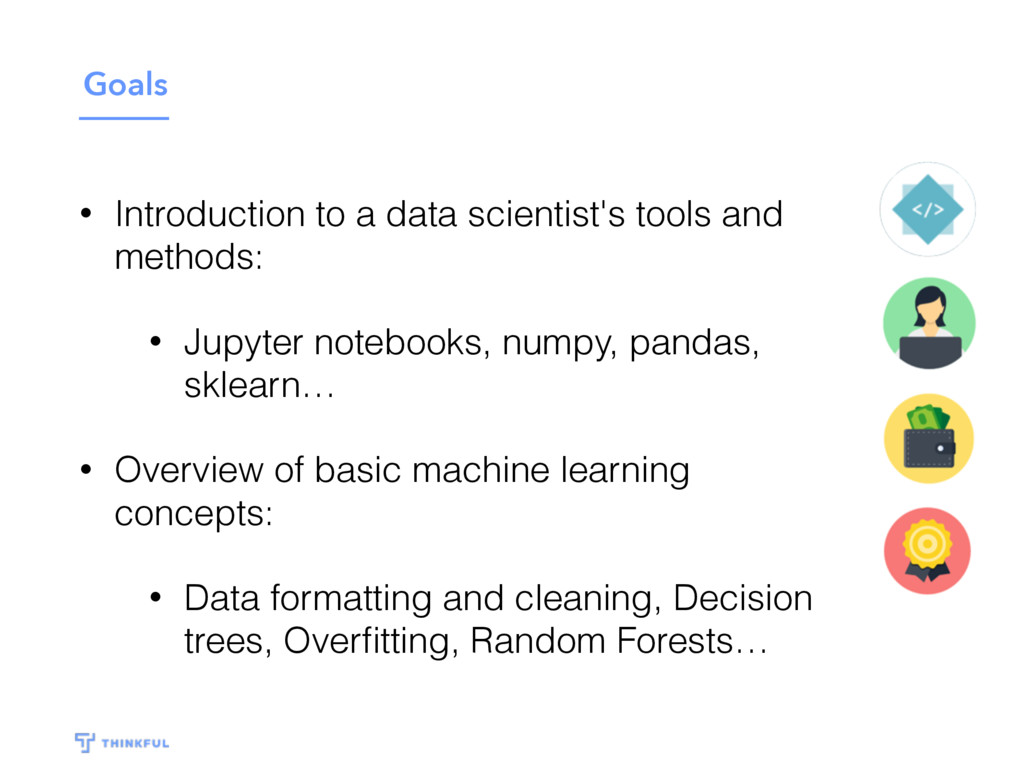
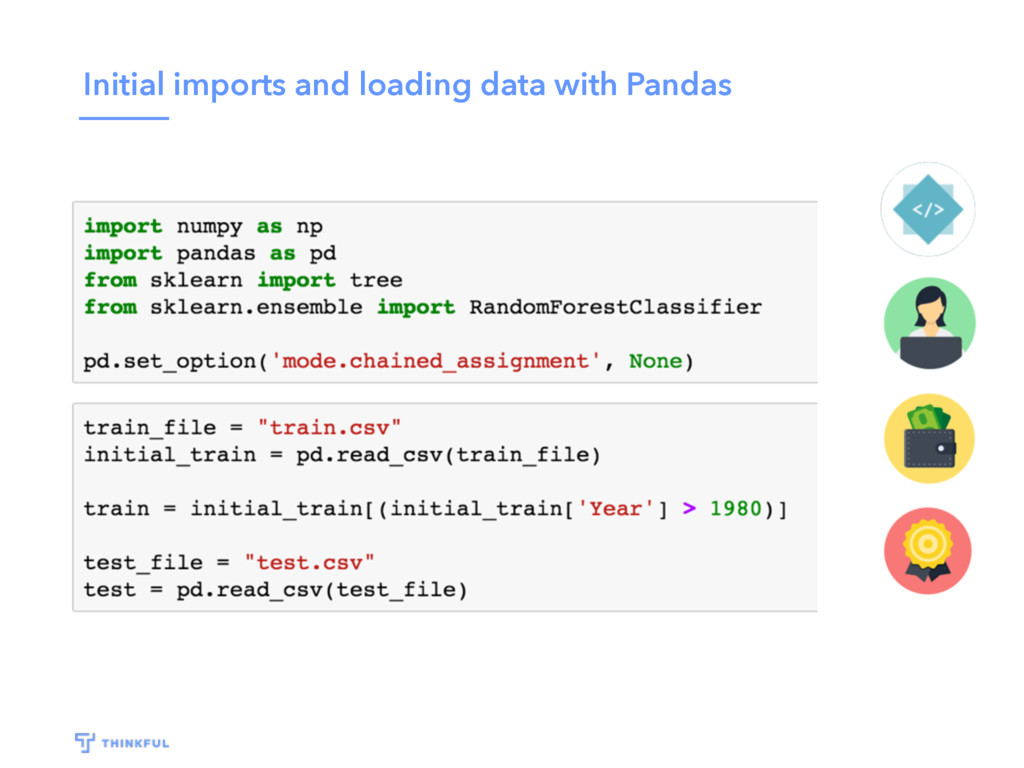
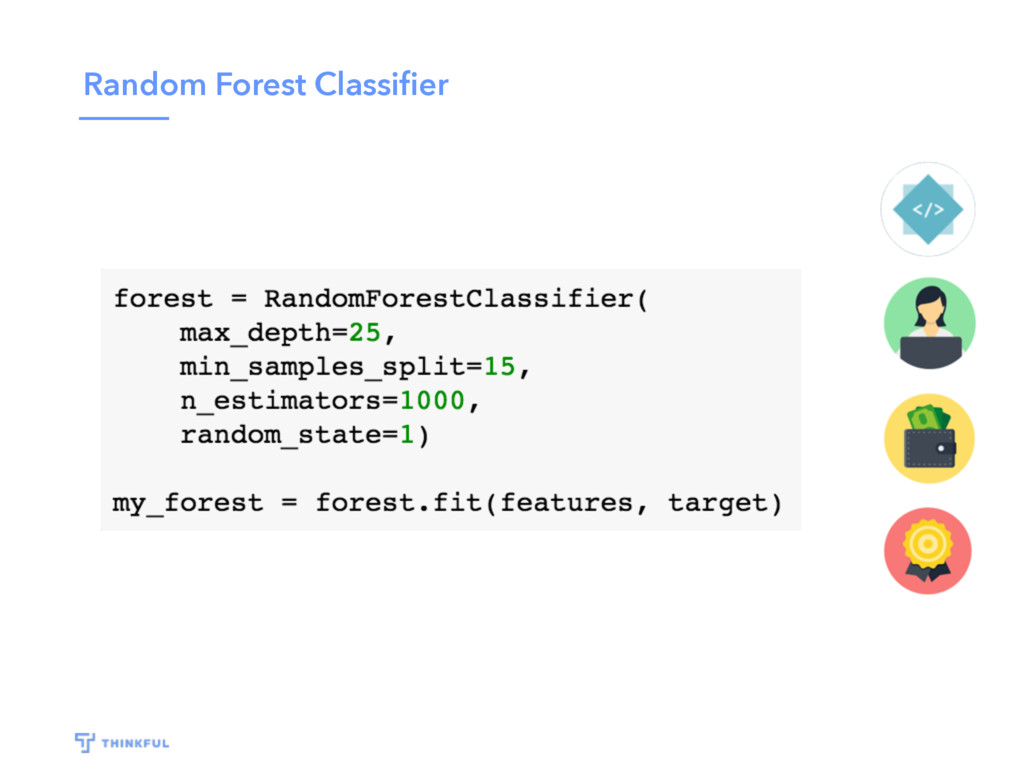
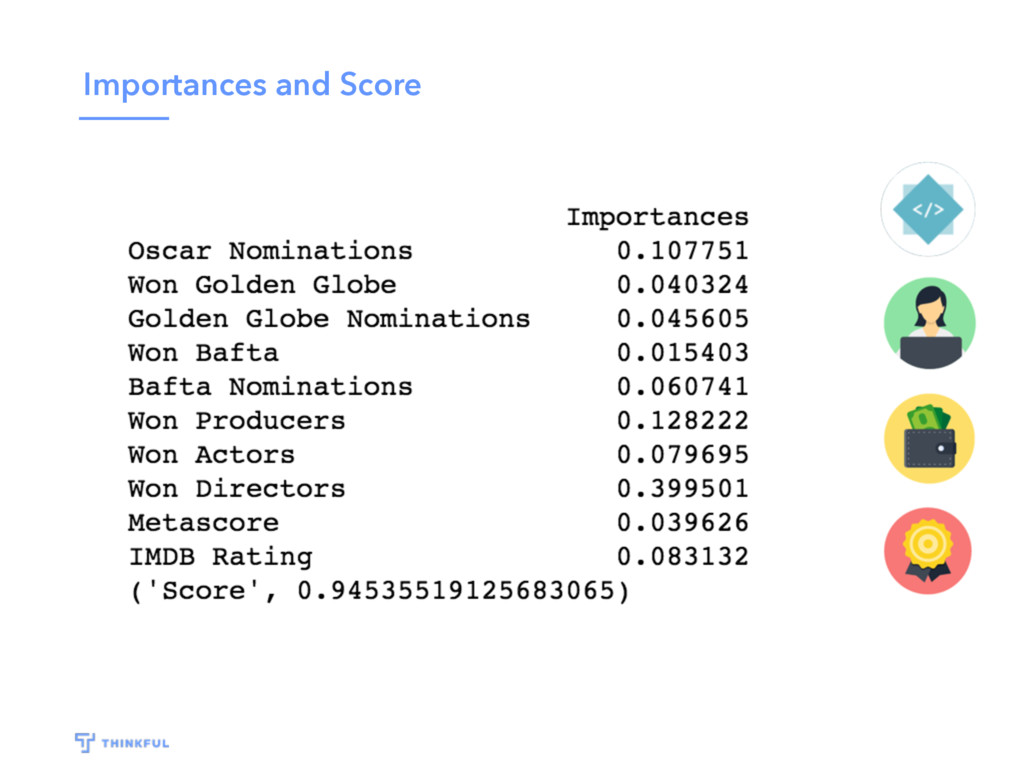
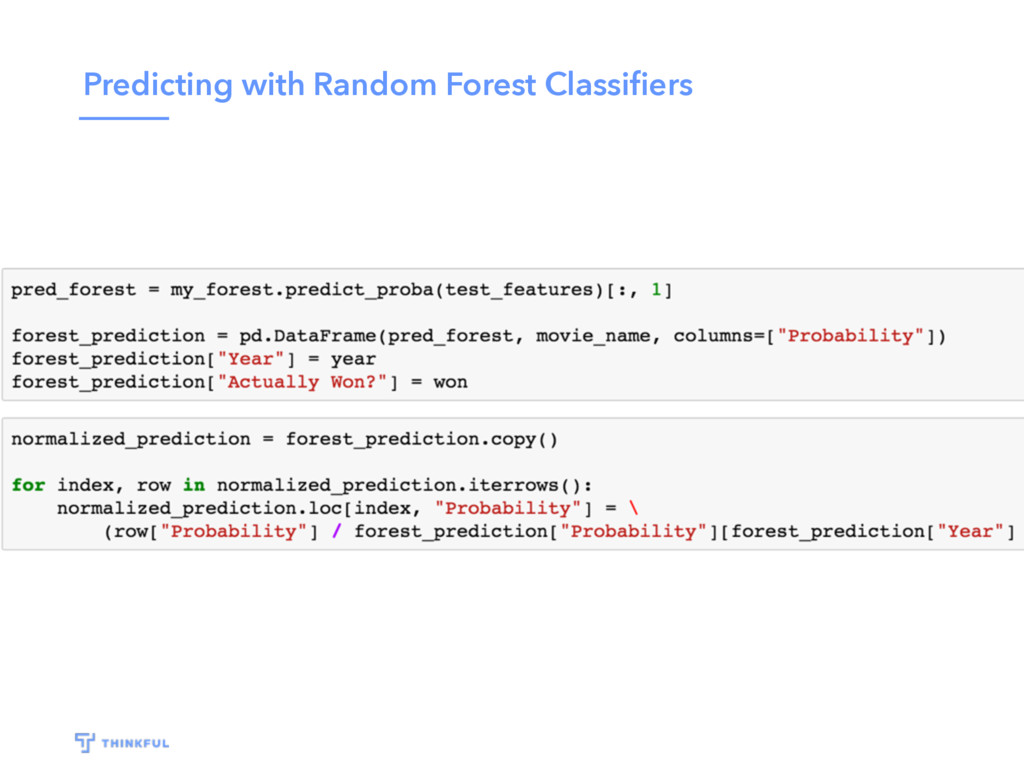
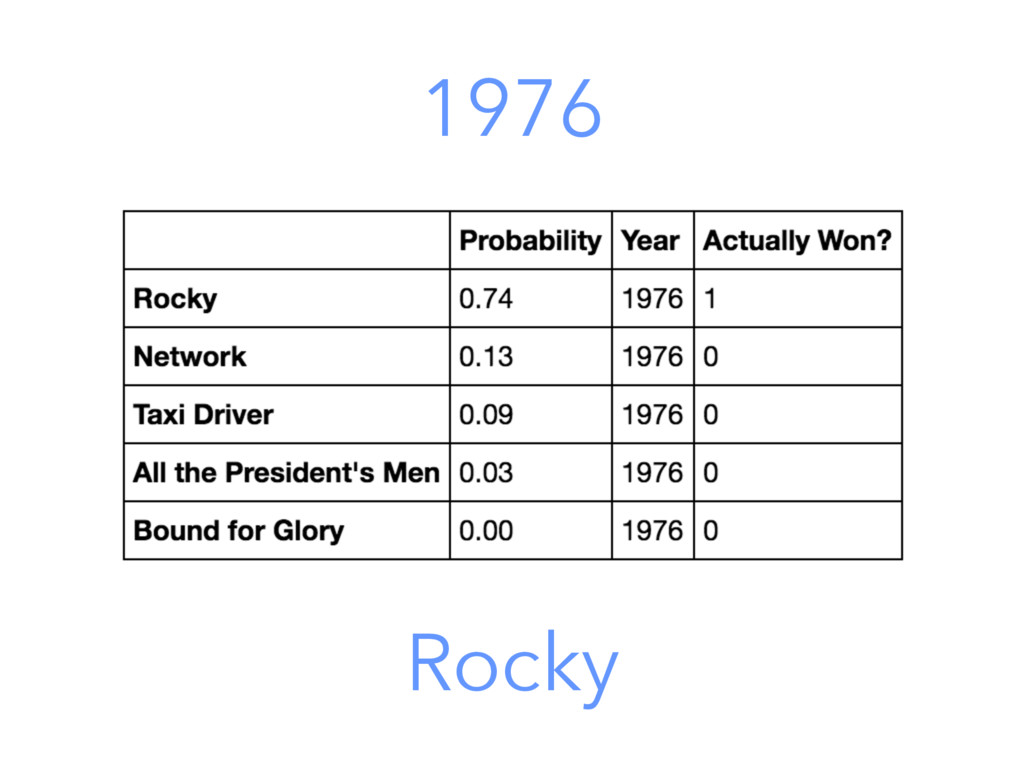
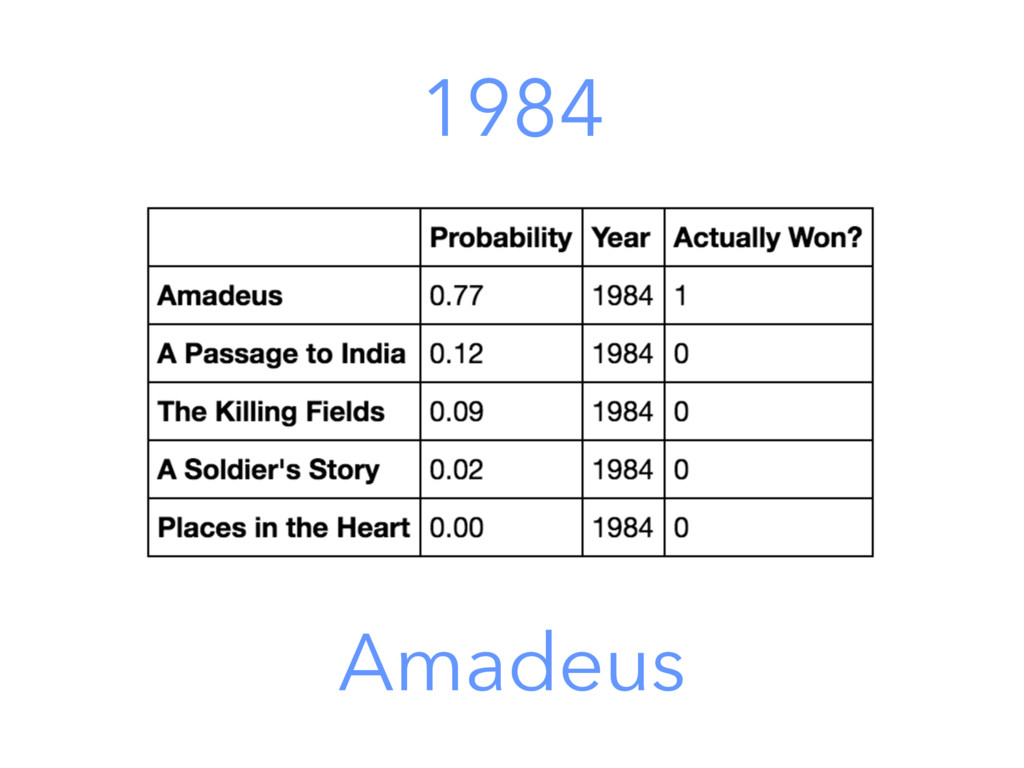
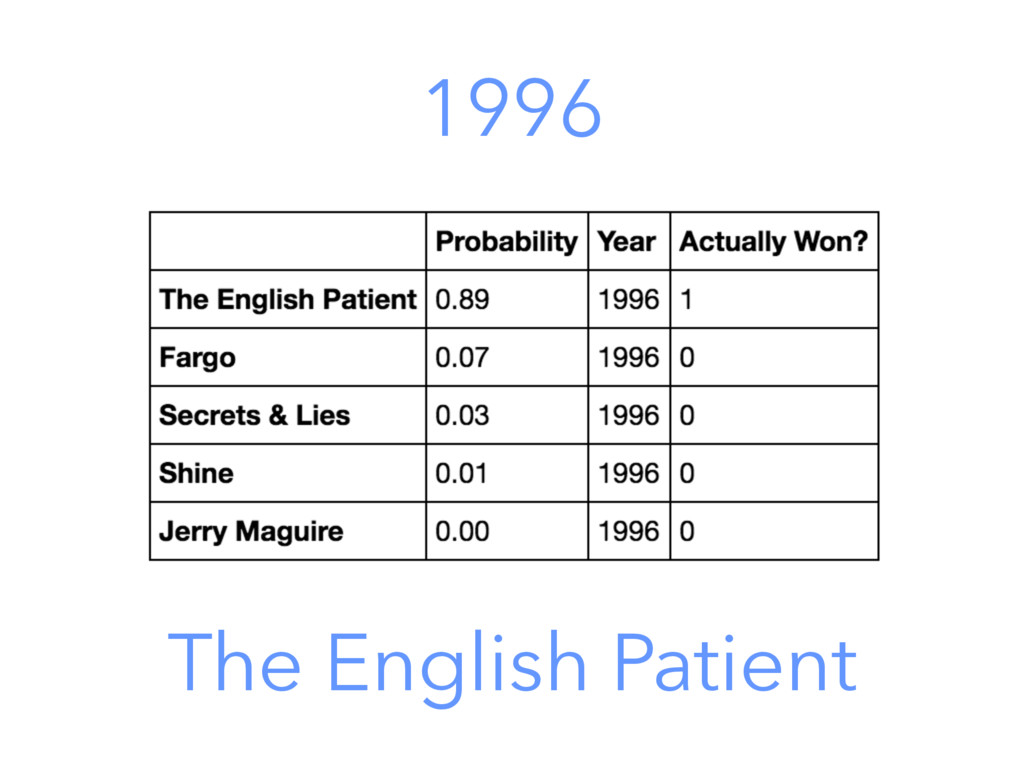
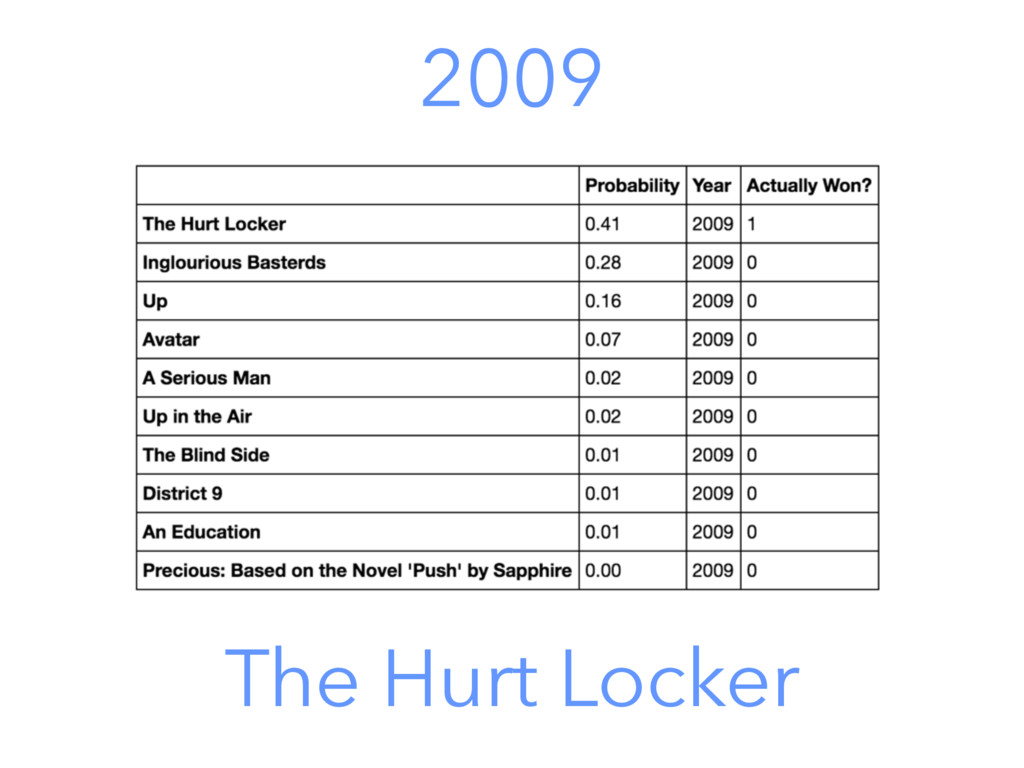
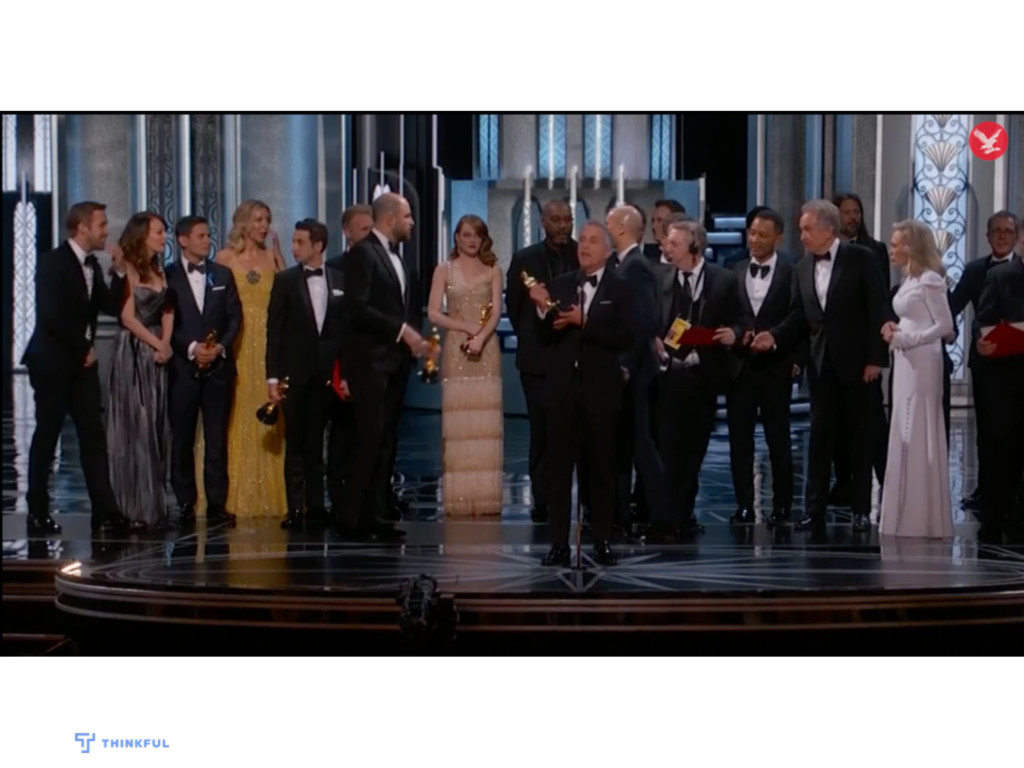
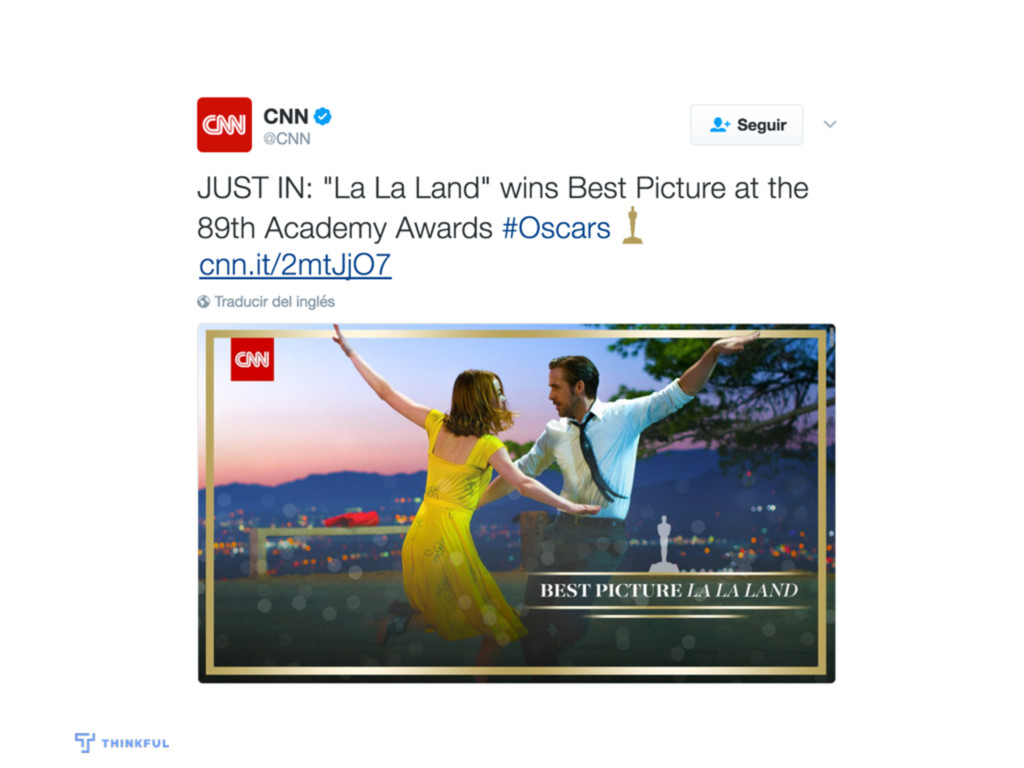
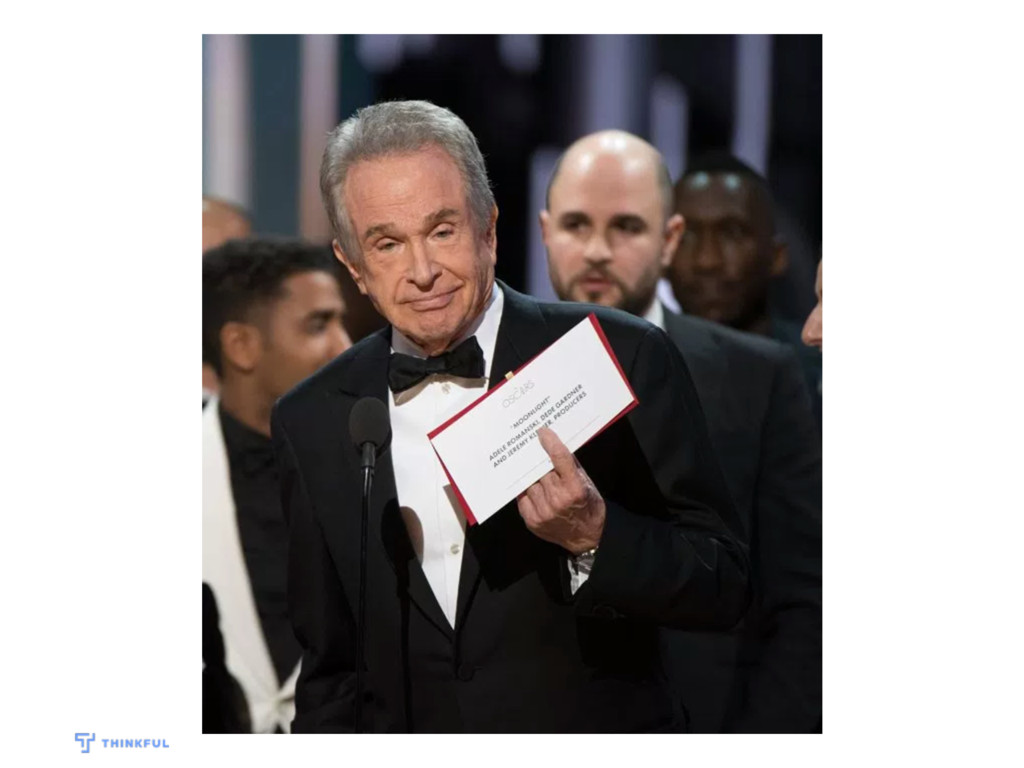
The outcome of the Academy Award for Best Picture surprised us all. But, could that have been predicted? In this practical workshop you'll use a dataset that contains previous Oscar winners to build a prediction model to guess the winner for Best Picture. You'll get an introduction to a data scientist's tools and methods, including an overview of basic machine learning concepts. Unlike this year's Oscars, our model will predict only one winner!

Thinkful

March 16, 2017
Tweet

More Decks by Thinkful

Other Decks in Programming

Transcript

  1. Data Science Process • Frame the question. • Collect the

    raw data. • Process the data. • Explore the data. • Communicate results.
  2. Collect the Data • What kind of data do we

    need? • Financial data (Budget, box office…) • Reviews, ratings and scores. • Awards and nominations.
  3. Process the data • How’s the data “dirty” and how

    can we fix it? • User input, redundancies, missing data… • Formatting: adapt the data to meet certain specifications. • Cleaning: detecting and correcting corrupt or inaccurate records.
  4. Explore the data • What are the meaningful patterns in

    the data? • How meaningful is each data point for our predictions?
  5. Communicate results • Tell story at the right technical level

    for each audience • Make sure to focus on Whats In It For You (WIIFY!) • Be objective, don’t lie with statistics • Be visual! Show, don’t just tell
  6. Goals • Introduction to a data scientist's tools and methods:

    • Jupyter notebooks, numpy, pandas, sklearn… • Overview of basic machine learning concepts: • Data formatting and cleaning, Decision trees, Overfitting, Random Forests…
  7. Jupyter Notebooks • One of data scientist’s everyday tools. •

    Find the link in our classroom tool: • (bit.ly/atl-oscars) • Contains cells with code. They have already been executed for you.
  8. NumPy • The fundamental package for scientific computing with Python.

    • Provides powerful multi-dimensional array objects. • Many methods for fast operations on arrays.
  9. Pandas • Fundamental high-level building block for doing practical, real

    world data analysis in Python. • Built on top of NumPy. • Offers data structures and operations for manipulating numerical tables and time series.
  10. Scikit-learn • Python module for machine learning. • Provides a

    large menu of libraries for scientific computation, such as integration, interpolation, signal processing, linear algebra, statistics, etc.
  11. Understanding your data • .head(n) method: Returns first n rows.

    • .value_counts() method: Returns the counts of unique values in the DataFrame.
  12. Formatting your Data • Rate values in a non-numeric format.

    Thus, we will need to assign each rate a unique integer so that Python can handle the information. • With the .ix method you create a subset of rows and assign a value to a certain variable of that subset of observations.
  13. Decision Trees • It breaks down a dataset into smaller

    and smaller subsets. • The final result is a model with a tree structure that has: • Decision nodes: ask a question and have two or more branches. • Leaf nodes: represent a classification or decision.
  14. Classification vs Regression • Classification — Predict categories. • Identifying

    group membership. • Regression — Predict values. • Involves estimating or predicting a response.
  15. Creating your first Decision Tree You will use the scikit-learn

    and numpy libraries to build your first decision tree. We will need the following to build a decision tree • target: A one-dimensional numpy array containing the target from the train data. • features: A multidimensional numpy array containing the features/predictors from the train data.
  16. Importances and Score • .feature_importances_ attribute: tells us how important

    the features are for the final result. • .score() method: returns the mean accuracy of our fitting.
  17. Overfitting • Resulting model too tied to the training set.

    • It doesn’t generalize to new data, which is the point of prediction.
  18. Random Forest Classifier • Random Forest Classifiers use many Decision

    Trees to build a classifier. • We introduce a bit of randomness. • Each Tree can give a different answer (a vote). The final classification is the most common amongst the Trees.
  19. What is Thinkful? Online skills bootcamp with 1-on-1 mentorship —

    learn anytime & anywhere & get a job, guaranteed. Anyone who’s committed can learn to code.
  20. Our Philosophy • 1-on-1 mentorship is the best way to

    learn • Flexibility matters — learn anywhere, anytime • We only make money when you get a job…
  21. Data Science Bootcamp Syllabus: Python Toolkit, Statistics & Probability, Experimentation,

    Machine Learning, Communicating Data, Algorithms and Big Data
  22. Special Prep Course Offer • Three-week program, includes six mentor

    sessions • Web: HTML/CSS, Javascript, jQuery, Responsive Design • Data: Basic Python & Stats, Data Science Toolkit, Project • Option to continue into web development bootcamp • Prep courses cost $500 (can apply to cost of full bootcamp) • Talk to us about special offers for both programs