Upgrade to Pro — share decks privately, control downloads, hide ads and more …

Analyzing network data with Packetbeat and Elasticsearch

Analyzing network data with Packetbeat and Elasticsearch

Tobias Karlsson

September 06, 2016
Tweet

More Decks by Tobias Karlsson

Other Decks in Programming

Transcript

  1. 4 66M+ Product Downloads 2,400+ Subscription Customers We aim to

    help you make your data usable in real time to power mission critical applications that solve today’s real problems 65,000+ Community Members Statistics since 2012, start of the company Elastic Overview
  2. 5 66 Million Lifetime Product Downloads 2014 30. Millions of

    Downloads 10. 60. 2016 2015 2012 2013 Cumulative all Elastic products to date
  3. 7 IT Operations Application Management Security Analytics Marketing Insights Business

    Development Customer Sentiment Website/App Search Internal/Intranet Search URL Search Internal Systems/Applications External Systems/Applications Developers Architects IT/Ops Business Analysts CTO/CIO/CDO A Solution for Every Use Case and Everyone Log Analytics Metrics Analytics Embedd ed Search Security Analytics Operatio nal Analytics Applicati on Search
  4. 8 Elastic Cloud Security X-Pack Kibana User Interface Elasticsearch Store,

    Index, & Analyze Ingest Logstash Beats + Elastic Stack Introducing the Elastic Stack, X-Pack, and Cloud Alerting Monitoring Reporting Graph
  5. 10 \ adds value across all use cases SECURITY ANALYTICS

    LOG ANALYTICS METRICS ANALYTICS BUSINESS ANALYTICS ENTERPRISE SEARCH APPLICATION SEARCH lock down your data and monitor access get notified when something changes in your data monitor the health of your Elasticsearch cluster(s) explore meaningful relationships in your data generate PDF reports to share your insights
  6. 11 Security for the Elastic Stack (Shield) Security Monitoring for

    the Elastic Stack (Marvel) Monitoring Notifications for the Elastic Stack (Watcher) Alerting Security X-Pack Alerting Monitoring Reporting Graph Automated reporting for the Elastic Stack Reporting Real-time graph analytics for the Elastic Stack Graph A Single Extension
  7. 12 Simply Secure the Elastic Stack • Username/password protection Advanced

    Security When Needed • LDAP/AD integration • Role-based access control • IP filtering • Field and document level security • Encrypted communications • Audit logging • Kibana plugin for login and session management Security (Shield) External Authentication (optional)
  8. 13 Setup Alerts • Create Watches based on data •

    Trigger automatic notifications • Setup chained inputs Notify and Integrate • Slack, Hipchat, JIRA, Pagerduty • Email • Elastic Monitoring (Marvel) • Other Alerting (Watcher)
  9. 14 Monitor Elasticsearch • Real-time statistics and metrics for all

    clusters and nodes Diagnose Issues • Analyze historical or real-time data for root cause analyses Optimize Performance • Utilize in-depth analyses to improve cluster performance Monitoring (Marvel)
  10. 15 Query and Visualize Relationships • Use relevance as a

    guide to uncover and explore new relationships in all your data stored in Elasticsearch • Interact with Graph via a Kibana plugin or use the Graph API to integrate with your applications • Enable new use cases – behavioral analysis, fraud, cybersecurity, drug discovery, and recommendations Graph Analytics
  11. 16 Generate and share reports • Export PDFs of reports

    of dashboards and visualizations with a single click • Use Alerting features to: ‒ email reports on a time-based interval ‒ schedule event-based reports (example: when X event occurs, send Y report) Reporting
  12. 18 Lightweight Data Shippers Library for forwarding host- based metrics

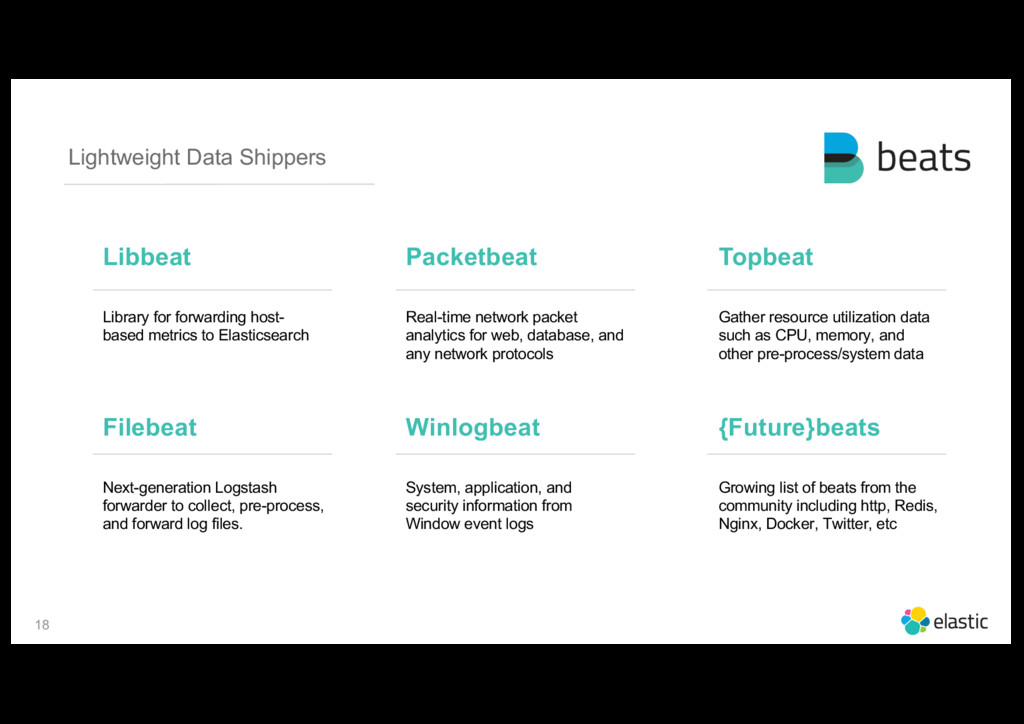
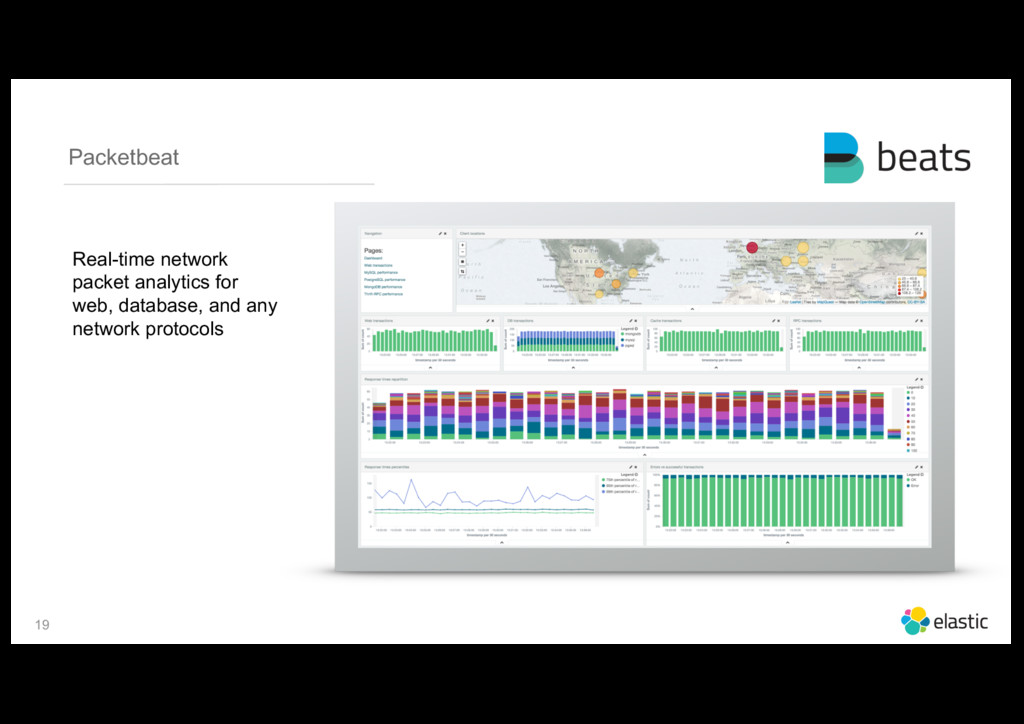
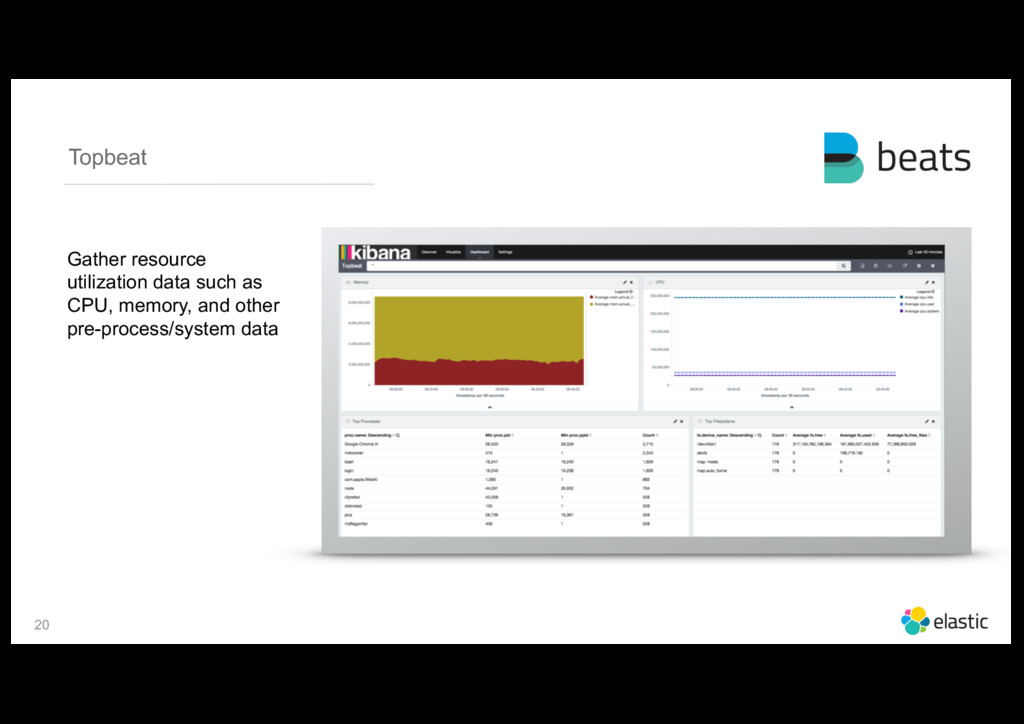
    to Elasticsearch Libbeat Packetbeat Topbeat Real-time network packet analytics for web, database, and any network protocols Gather resource utilization data such as CPU, memory, and other pre-process/system data Next-generation Logstash forwarder to collect, pre-process, and forward log files. Filebeat Winlogbeat {Future}beats System, application, and security information from Window event logs Growing list of beats from the community including http, Redis, Nginx, Docker, Twitter, etc
  13. 22 Some Typical Use-Cases • How’s my host performing? •

    Which hosts are talking to which hosts on what ports? ‒ Which external systems has a infected host talked to • How’s my performance for specific applications?
  14. 24 Install Graph • Step 1: Install X-Pack into Elasticsearch

    ‒ bin/elasticsearch-plugin install x-pack • Step 2: Start Elasticsearch ‒ bin/elasticsearch • Step 3: Install X-Pack into Kibana ‒ bin/kibana-plugin install x-pack • Step 4: Start Kibana ‒ bin/kibana
  15. 26 Configure Logstash Use template colors to highlight input{ pipe{

    command => "tcpdump -nS -r ../../networkdata.pcap -s0 -tttt tcp[13] == 2" } }
  16. 27 Configure Logstash Use template colors to highlight filter{ grok{

    match => ["message", "%{TIMESTAMP_ISO8601:timestamp} IP %{IP:source.ip}.%{INT:source.port} > %{IP:dest.ip}.%{INT:dest.port}"] named_captures_only => true remove_field => [ "command", "host", "@version", "message"] add_field => [ "type", "syn" ] } }
  17. 28 Configure Logstash Use template colors to highlight output {

    elasticsearch { hosts => "localhost” index => "packetbeat-%{+YYYY.MM.dd}" user => "elastic” password => "changeme” } }
  18. 29 Ingest the data • sudo ./packetbeat -e -t -I

    ../networkdata.pcap • sudo ./logstash -f tcpdump_to_packetbeat_index.conf